innovation matters · 1.54 million shares bought back for ~27 million euro 1st corona preventive...
TRANSCRIPT

RoadshowMay 2020
Innovation Matters

Elmos at a glance
2
47%
40%
EU
US
Asia/Pacific
4%
Rest of World
10%
Automotive focus: Sales by industry
35
~5
1,300
85%
15%
Non-automotive
Automotive
Foundry
~2/3Inhouse
~1/3
Global reach: Sales by region
Fablitestrategy:
Wafer production
6
16 sites globally – German roots withDortmund headquarters
product segments: Ranging, Optical, Sensor ICs, Motor Control, Lighting, Safety/Power/Custom ICs
employees, thereof 350 people in product development
years experience in analog mixed signal IC solutions
Elmos ICs on averagein every new car
Charts referring to 2019 financial figures

Design-Center in Düsseldorf opened
Significant strengthening ofdesign/application resources
Recent milestones (1/3)
3
1 billion USPA ICs sold
Sustained high demand and great future potential
Fablite strategy extended
Front-End: Fablite establishedBack-End: 2nd wave of outsourcing started
Conversion into SE announced
AGM will decide in May 2020

Recent milestones (2/3)
4
SMI sold for 95m USD
Transaction for 3.4x externalrevenue / closed Sept 30, 2019
Elmos and Audi strengthen partnership
Audi is key customer for new LED rear light control IC
New CEO appointed
Dr. Schneider (CFO) is designated CEO beginning 2021. Current CEO, Dr. Mindl, will be consultant in the future
Cooperation with Fraunhofer IMS will end June 30, 2020
Deliveries to customers secured by Dortmund fab and foundry partners

Recent milestones (3/3)
5
Foundry cooperation w/ Samsung
Strengthen Fablite strategy and access to advanced process
Public share buyback offer
1.54 million shares bought back for ~27 million Euro
1st Corona preventive measures
End of January: Ban on travel to Asian regions, since then measures have been progressively extended
Mid April: Short-time work starts
Goal: moderate the financial consequences of the weak demand caused by the coronavirus
9.99% Treasury
Stock

6
0% 10% 20% 30% 40%
LED Lighting
BLDC motors(HVAC, pumps,engine cooling)
Advanced Display /HMI
Distance Warning(Emergency Braking
+ Parking)
EV(Battery + Plug-In)
The car is the next smart device ̶̶Elmos is present in the highest growing sub-segments
Source: Strategy Analytics / for BLDC motors: LMCA CAGR 2019-2024
Selected projectsin development
#1for Ultrasonic ICs
#1for Gesture Control
#1for HVAC flaps
#1for Ambient Lighting(and soon rear light)
Semi growth rate for selected applications (CAGR 2016-21) Elmos ICs for growing segments

Elmos shareholder structure set for long-term perspective
7
Weyer Beteiligungsgesellschaft mbH and related parties Jumakos Beteiligungsgesellschaft mbH ZOE-VVG GmbH and related parties Treasury Stock Free float, thereof:
5.05% WA Holdings Inc. as of Jan 09, 2020 5.01% Teslin Capital Management BV as of May 05, 2017 2.99% JPMorgan Asset Mgt. (UK) Ltd. as of Mar 03, 2020
2.99%
19.96%
14.83%
14.33%9.99%
5.01%
5.05%
Free float40.89%
Share buyback Shareholder structure
Public buyback offer 2020 (17.03.2020-26.03.2020)
Offer price per share: 17.50 Euro
Altogether 2.30 million shares have been tendered (offer oversubscribed)
A total of 1.54 million shares bought back for ~27 million Euro
Elmos now holds 2,008,921 treasury shares / 9.99% of the share capital

Q1 2020: Message of the CEO
8
We assume that the numerous plant closures among automotive manufacturers will have a significant negative impact on business performance over the rest of the year.
Elmos started protecting its employees with comprehensive preventive measures at an early stage. At the same time, we have implemented operational measures including short-time work, and will expand those measures to manage the economic effects of the crisis caused by the pandemic.
Since, among other things, customer acquisition continues at the same high level, we believe that Elmos remains in a very strong position in the medium term. That is particularly the case thanks to our strong financial position. ─ Dr. Anton Mindl
”
”

Sales growth of 3.3% in Q1 2020
9
21.7219.6
42.3%41.7%
196.6
2015
206.9
46.4%
23.0
294.8
230.1
20.4
2017
45.2%
253.9
2018
273.4
21.4
2019
250.4
2016
23.7228.6
277.6
43.9%
+6.2%
Organic growth of 7.7% to 273.4 million Euro in 2019
Design Wins 2019 continue on a high level
Yearly sales (million Euro) & gross margin (%) Quarterly sales* (million Euro) & gross margin* (%)
+7.7%
Gross margin
Discontinued operations
Continuing operations
47.9%
75.7
Q1 2019
44.5%45.6%
Q3 2019Q2 2019
45.6%
Q4 2019
43.7%
Q1 2020
62.267.7 67.8
64.2
+3.3%
*For purposes of comparison, quarterly information on the consolidated income statement relates exclusively to continuing operations.
Q1 2020 Sales and earnings development met our expectations
The ratio of the order backlog to sales (book-to-bill) was below one at the end of the reporting period
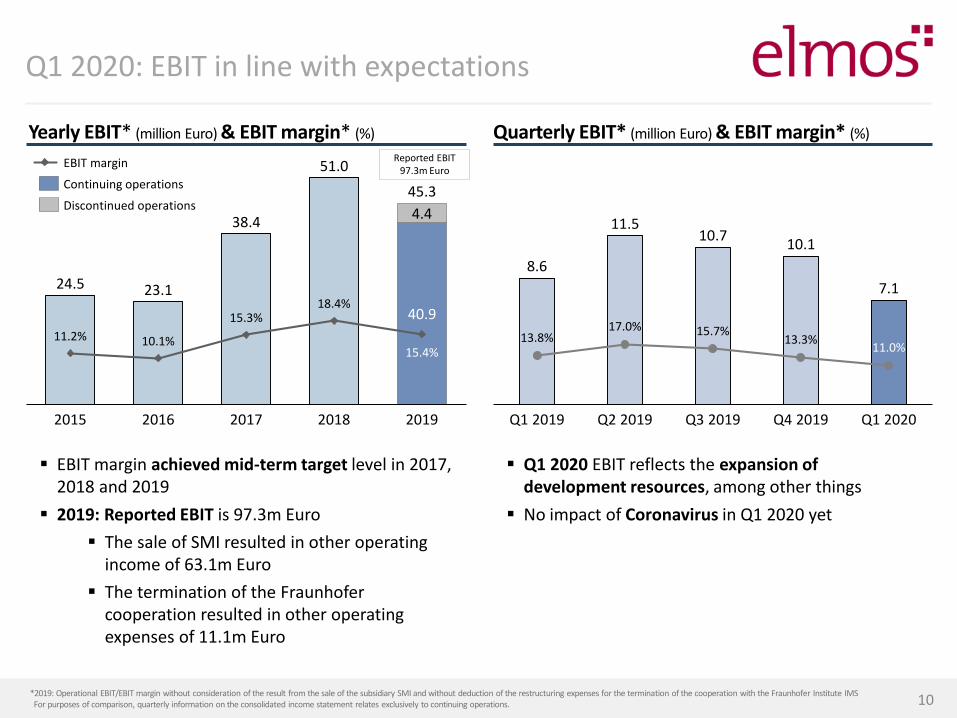
Q1 2020: EBIT in line with expectations
10
EBIT margin achieved mid-term target level in 2017,2018 and 2019
2019: Reported EBIT is 97.3m Euro
The sale of SMI resulted in other operating income of 63.1m Euro
The termination of the Fraunhofercooperation resulted in other operating expenses of 11.1m Euro
11.2%
2017
10.1%
2015
15.3%
2016
18.4%
2018
15.4%
40.9
4.4
2019
24.5 23.1
38.4
51.0
45.3
Yearly EBIT* (million Euro) & EBIT margin* (%) Quarterly EBIT* (million Euro) & EBIT margin* (%)
Reported EBIT 97.3m Euro
*2019: Operational EBIT/EBIT margin without consideration of the result from the sale of the subsidiary SMI and without deduction of the restructuring expenses for the termination of the cooperation with the Fraunhofer Institute IMSFor purposes of comparison, quarterly information on the consolidated income statement relates exclusively to continuing operations.
13.8% 13.3%15.7%
Q1 2019
17.0%
Q3 2019Q2 2019 Q4 2019
11.0%
Q1 2020
8.6
11.510.7
10.1
7.1
Q1 2020 EBIT reflects the expansion of development resources, among other things
No impact of Coronavirus in Q1 2020 yet
Continuing operations
EBIT margin
Discontinued operations

Q1 2020: Adjusted Free Cash Flow positively influenced by high operating CF and low capex
11
Operating Cash Flow (million Euro)
14.9%
2015
10.5%
41.4
10.1%
2016 2017
14.9%
2018
14.8%
2019
9.1%
Q1 2020
23.0 23.2
37.243.6
5.8
201820172015 2016 2019 Q1 2020
29.7
9.1
-5.2 -3.3
76.9
13.5
Capex (million Euro & % of sales)
Adjusted Free Cash Flow (million Euro)
Supportedby tax effects
2016
33.5
2015 2017 2018 2019
50.3
Q1 2020
37.9
48.4 45.6
20.2
55.4
201920162015
53.7
2017 2018 Q1 2020
33.2
16.9
74.384.7
Burdenedby tax effects
1
Supported bySMI sale
1
Net cash (million Euro)
- Adjusted free cash flow: Cash flow from operating activities less capital expenditures for/plus disposal of intangible assets and property, plant and equipment (including payments from disposals of consolidated companies)- Capital expenditures: Capital expenditures for intangible assets and property, plant and equipment less capitalized development expenses1 Disregarding one-off effect from sale and lease back structure of ca. 14 million Euro
Supported bySMI sale
Cash outflow of~27 million Euro
from share buybacknot yet included

Market environment 2020: uncertain economic conditions
12
Daily Newspaper Headlines Market Outlook1
1CAM (April 6, 2020)
New car registrations in million units
83
68
2020e2019
-17%
Regional outlook 2020:
Europe (-21%)
China (-10%)
US (-17%)

Sales 55-60 million Euro
EBIT margin 1% to 6%
Ø exchange rate 1.10 EUR/USD
Guidance for Q2 2020
13
As of May 6, 2020
Due to the current situation, no full year guidance is being issued for 2020.
The Supervisory Board and the Management Board are planning to propose an unchanged dividend, compared to the previous year, of 0.52 Euro per share at the AGM on May 22, 2020.
The comprehensive preventive measures to combat the spread of the coronavirus will continue to apply without change. For example, several hundred employees are working from home and comprehensive social distancing measures are in place.

The Next Smart Device: The Car
RoadshowMay 2020

1515
Research Coverage and Elmos Financial Calendar
Event Date
Quarterly results Q1/2020* May 6, 2020
Virtual AGM May 22, 2020
Quarterly results Q2/2020* August 5, 2020
Quarterly results Q3/2020* November 4, 2020
*The German Securities Trading Act (Wertpapierhandelsgesetz) and the Market Abuse Regulation (EU) oblige issuers to immediately announce any information that may have a substantial price impact, irrespective of the communicated schedules. Therefore it is possible that we will announce key figures of quarterly and annual results ahead of the dates listed above. As we can never rule out changes of dates, we recommend checking dates and news ahead of schedule on the Company’s website (www.elmos.com).
Institution Analyst Recommendation
Bankhaus Lampe Veysel Taze Hold
Deutsche Bank Johannes Schaller Hold
DZ Bank Harald Schnitzer Hold
Hauck & Aufhäuser Christian Sandherr Hold
Oddo BHF Stéphane Houri Hold
Warburg Research Malte Schaumann Buy
Event Date
Institution Analyst Recommendation
Elmos Semiconductor AG
Heinrich-Hertz-Str. 1 | 44227 Dortmund | Germany
Telephone: + 49 231 75 49 287 | Telefax: + 49 231 75 49 111
[email protected] | www.elmos.com
DISCLAIMER
This presentation contains forward-looking statements based on beliefs of Elmos‘ management.
Such statements reflect the company‘s current views with respect to future events and are
subject to risks and uncertainties. Many factors could cause the actual results to be materially
different, including, among others, changes in general economic and business conditions,
changes in currency exchange rates and interest rates, introduction of competing products, lack
of acceptance of new products or services and changes in business strategy. Actual results may
vary materially from those projected here. Elmos does not intend or assume any obligation to
update these forward-looking statements.
16