innovation in the norwegian food cluster - organisation for
TRANSCRIPT

Innovation in the Norwegian food cluster
A contribution to the OECD/CSTP NIS programme, the Cluster focus group
OECD Cluster workshop Utrecht 8-9 May 2000
Author Thor Egil Braadland
Johan Hauknes
Project leader Johan Hauknes
Funding from the TSER Programme/European Commission and Norges
forskningsråd is gratefully acknowledged
Preliminary version. Not to be cited
Oslo, April 2000

Executive summaryThe study looks at processes of change in the Norwegian food cluster. The food cluster,employing around 170.000 persons, is highly institutionalised and has traditionallybenefited from protection from international competition, for reasons of national foodsecurity and rural employment and value creation. In contrast to other Norwegian naturalresource based industries (like the petroleum industry or the water power industry), thefood industry is still dependent upon foreign technological machinery knowledge:Petroleum knowledge and hydro power knowledge has been imported and developed in aquid-pro-quo arrangement with international suppliers of machinery, allowing nationalgiants like Statoil, Kværner and Norsk Hydro to grow up. However, in the food sector,the domestic agrofood monopolies (Norsk Kjøtt, TINE, Felleskjøpet) have filled the roleof technological and economic locomotives, where vertical integration with suppliers ofraw materials have provided an alternative system for knowledge development anddiffusion.
These structures are now challenged from several stances. Increased internationaladaptation and regulation and trade liberalisation are two of many important changestaking place in the food cluster today. Other changes are ongoing processes of verticaland horizontal restructuring between the different elements in the Norwegian industry, aprocess of deconstruction of existing agrobased monopolies is unfolding, particularlywithin the grain and dairy sector, increased professionalisation and organisation amongretail distribution (counter-forcing the traditional hegemony among co-operatives andlarge corporations), increased scientification of the food industry, increased consumer-orientation, internationalisation processes (both in the retail chain groups and in theindustry), and restructuring of the size structure, with more employment in the largestestablishments than before are also important changes taking place.
This paper provides an overview of the Norwegian food cluster, and discuss the trends ofchange against recent theories of economic development. We claim that there is nosimple way to categorise innovation processes in the food industry, innovation activitiesin the food industry is often regarded as low, due to the fact that the industry overallspend comparatively little money on R&D, and it introduces comparatively few newproducts and processes. In extention of this argument, the food industry is claimed to besupplier-dominated in their innovation activities, as product and process innovation oftenare based on inputs from machinery suppliers. We claim that both these interpretations ofthe food industry innovation processes are misguided, because they are based on aninnovation conception where R&D and product and process innovation are regarded ascentre of industrial dynamism. Developing new technological products is not a mainforce in the food industry, the most profound driving force in the food industry seems tobe branding and other market oriented innovations, the building up of trade marks andimages of product quality and hygiene.

iii
1 THE NORWEGIAN FOOD CLUSTER............................................................................................11.1 INTRODUCTION AND SUMMARY .........................................................................................................1
The cluster approach .............................................................................................................................2
2 THE NORWEGIAN FOOD CLUSTER............................................................................................5Quantitative limitation of the cluster .....................................................................................................5
2.1 BACKGROUND ...................................................................................................................................7Introduction ...........................................................................................................................................7What is the food cluster? .......................................................................................................................7Main figures...........................................................................................................................................9International trade regulations for food..............................................................................................12
2.2 OWNERSHIP STRUCTURE AND DOMINANT COMPANIES .....................................................................12The largest owner-groups...................................................................... Error! Bookmark not defined.Size structure .......................................................................................................................................14
2.3 THE GEOGRAPHY OF FOOD COMPANIES............................................................................................16Regional innovation systems in the food cluster?................................................................................17
2.4 DISTRIBUTION SYSTEM AND MARKETS.............................................................................................20
2.5 THREE EXTERNAL KNOWLEDGE SUPPLIERS TO THE FOOD CLUSTER .................................................22Suppliers of machinery and equipment................................................................................................22Research and development ..................................................................................................................27Market analysis....................................................................................................................................31
2.6 PRODUCT AND PROCESS INNOVATION PATTERNS IN THE FOOD CLUSTER..........................................33Product and process innovations.........................................................................................................33Formal and informal innovations........................................................................................................35Branding and consumer trust ..............................................................................................................36Barriers to innovation .........................................................................................................................37Conclusion: A new concept of innovation? .........................................................................................38
2.7 SUMMARY .......................................................................................................................................38
3 HOW CHANGES IN THE INDUSTRY MAY AFFECT INNOVATION PROCESSES ..........413.1 INTRODUCTION ................................................................................................................................41
3.2 CHANGE AND INNOVATION..............................................................................................................41R&D, competitiveness and innovation.................................................................................................41Corporations, hegemonies and competition ........................................................................................43Increased chain group powers and innovation....................................................................................45Restructuring of vertical and horizontal alignments ...........................................................................48Internationalisation, globalisation and ownership..............................................................................48
3.3 SUMMARY AND POLICY CONCLUSIONS ............................................................................................50
REFERENCES............................................................................................................................................51Interviewed persons/companies/location/date.....................................................................................54

1
1 THE NORWEGIAN FOOD CLUSTER
1.1 INTRODUCTION AND SUMMARY
Few researchers recognise food production as an economically important - not to say adominant - sector in the Norwegian economy. In an international perspective, the foodindustry is often regarded as being of little significance to economic growth, and thereexists few studies about innovation, technological capabilities in - and economic impactfrom - this industry.
The food industry is normally categorised as a traditional, low-skilled, labour intensiveand low-tech sector1, 2. Further, food producers are described as technological laggards. Iffood companies innovate at all, the most important changes are often said to be supplier-dominated, changes taking place through implementation of new production equipmentand machinery3. The food industry is in other words mostly analysed as a technologyuser, playing a somewhat adaptive role to the dominant developments among theirsuppliers. In this view innovation in the food industry is dominated by capital-embodiedtechnical change, following models that were developed in the early 1960s as part ofmodern capital theory (f.i. Solow 1960, Arrow 1962).
Ironically, at the same time, it is also a very profitable industry, with comparatively highvalue added per employee. With it’s 500.000 NOKs value added per employee per year(1996), the industry ranks higher than ‘high-tech’ industries like manufacture of radiosand television sets, electrical machinery, medical and optical instruments, manufacturingof oil platforms and machinery and equipment.
How can a supposed technologically backward industry be so profitable? In this paper wetry to adapt theories of innovation and technological development to the Norwegian foodcluster phenomenon. Our basic argument is that regular innovation indicators, likedevelopment of new products and new processes, are too simple concepts to capture thedynamics of the Norwegian food industry. More important to economic development areissues like close relationship to policy-making, protecting the domestic food cluster frominternational competition for a long period of time, the possibility to draw knowledgefrom a wide array of research institutions, internal R&D divisions, technologicalsuppliers and market surveillance companies, and wide processes of branding, understoodbroadly as those processes aimed at making consumers more apt to buy certain products.
The food cluster centres around the Norwegian food processing industry, but includesalso upstream activities like fishing, fish farming, ship yards and agriculture, and
1 STEP Group (1995), Innovation performance at industry level in Norway; Food, beverages and tobacco,W15-95, Oslo2 J. Hauknes (1999), Norwegian Input-Output Clusters and Innovation Patterns, in Boosting Innovation:The Cluster Approach, OECD Paris 19993 Pavitt, K (1984), Sectoral patterns of technical change: towards a taxonomy and theory, p. 343 - 373,Research Policy 13

2
downstream activities like retail, hotels and restaurants. Cluster employment is about170.000 persons, or about 10 percent of all Norwegian employment. The food processingindustry is a central part of the cluster, and is the largest industry in Norway today -measured in both gross product and employment. The food industry alone represents asmuch as 21 percent of all Norwegian manufacturing value added, and it stands for thefifth highest value added per employee among all Norwegian manufacturing industries -higher than industries like electrical and optical instruments, machinery and equipmentand printing and publishing4. In terms of employment, the food industry alone representabout 19 percent of Norwegian manufacturing employment (Table 1)5.
Table 1: The Norwegian food industry, main figures and share of mfg activities, 1996.Source: Statistics Norway, ukens statistikk, 35, 1998 (NACE 15)6.
Companies Employment GVP Value added
Number/amount 1.730 52.450 96.582 mill NOK7 23.816 mill NOK
Share of Norwegian mfg 16 % 19 % 25 % 21 %
This paper gives a presentation of the Norwegian food cluster, with emphasis onanalysing how changes in the cluster may affect innovation processes in the cluster(Chapter 3), based on recent theories of economic change and technologicaldevelopment.
The cluster approachAs nations vary in geography, history, culture and language, they also vary in industrialstructures, institutional structures and knowledge level and directions. This is the reasonwhy processes like mass production and flexible specialisation manifests differently indifferent countries and in different technological and industrial systems.
This report uses a cluster approach to understand the structure of the food productionsystems. Cluster analysis are build on two assumptions: That production systems areperformed by legally separated units, like companies/suppliers, customers, producers ofraw materials, research institutions etc., and that most of these units are inter-linked insome way. The concept of such industrial inter-linkages stems from the Marshallianindustrial district in the late 19th century, with a regained focus in Perroux’ economiclocomotive theories from the 1950s and a third revitalisation through Porter’s clusterstudies in the late 1980s.
A core feature of all these studies has been the role of inter-linkages between the units inpropelling knowledge development and innovation. The dominant work putting this
4 Statistics Norway (1998), ibid.5 The processing industry represent about 1/3 of the total cluster employment, see Figure 16 Include only companies with 20 or more employees7 1.000 NOK = ����������������

3
perspective on the policy agenda the last decade was the OECD publication ‘Technologyand the Economy - the key relationships’, (OECD 1992), marking a shift in theperspective on how economic development was to be understood, and which policyimplications to be drawn. One of the central outcomes of this work was to bury the linearapproach to innovation, replacing it with a so-called interactive model of innovation. Thenotion of interactivity stems from the perspective that not only R&D, but also factors asexternal knowledge suppliers, organisational corpus of scientific and technologicalknowledge, marketing, design, testing and distribution8 can be important factors toinnovation. In recent European economic research, the interactive innovation model hasincreasingly gained terrain.
The interactive innovation model carries three basic differences from the linear model: i)it is interactive, i.e. the different units in the system have the important ability and powerto influence choices and strategies within the other units, ii) it is multidirectional, i.e.there are no mono-directional influence from one unit to another - like from R&D toeconomic development in the linear model - and iii) there are variations in unit strengthsand influence between the units across different production systems; some innovationsources are more important than others across varying sectors. The basic idea of theinteractive innovation model is hence a relativistic one; there are more factors - and oftenmore important factors - behind economic renewal than R&D inputs.
Within the line of innovation studies, one major path has been to give the interactiveinnovation model an explicit geographical context. Attention has been drawn towardsnational systems of innovation9 and regional systems of innovation10. The basic argumentin these studies is that innovation happens more often, or is more apt to be successful,when innovation and learning processes are locally embedded, either within national orwithin regional borders11. However, identifying localised units important to economicdevelopment - and the strength of linkages between them - has shown to be a problematictask. Problems of benchmarking do immediately occur; questions of how it is possible tosystematically identify active units in an innovation system, what is a strong link andwhat is a weak link between the different units, (how do we actually identify suchlinkages in the first place), and how do we compare different systems with one another?With such practical questions unsolved, a problem with the innovation system concept isit’s openness and inclusiveness. Eventually, we run the risk of considering all institutionsand all companies playing important roles in a system where everything is related toeverything. Which of course is analytically useless.
8 OECD (1993), Technology and the Economy, ibid. p. 259 For an overview of concepts and literature, see C. Edquist, Systems of Innovation Approaches: TheirEmergence and Characteristics in C. Edquist (ed.), Systems of Innovation: Technologies, Institutions andOrganisations, London, Pinter 1997.10 For an introduction to the concept, see for example Hans-Joachim Braczyk, Philip Cooke and MartinHeidenreich (eds.), Regional Innovation Systems, London, UCL Press, 199811 Asheim, Bjørn (1994), Regionale innovasjonssystem: Teknologipolitikk som regionalpolitikk, STEPreport 1994:18, Asheim, Bjørn and Arne Isaksen 1996, Location, agglomeration and innovation: Towardsregional innovation systems in Norway? STEP-report 1996:13, Oslo.

4
A way to limit interactivities into useful, conceptual magnitudes must in other wordsallow a perspective where some industries and some links are more important than others.This works grow out of the previous work by Hauknes12, who used 1993-data from theNorwegian national accounts to quantify and map how different industries are linked toone another through intermediate transactions. Using cut-off levels for link strengths andsignificant sectors, Hauknes distinguished six Norwegian clusters whereof one is theagrofood cluster13. Hauknes’ cluster analysis is the point of departure of this analysis.
The advantage of Hauknes’ cluster mapping methodology is how it eloquently capturesthe broad picture of the food cluster. It provides a general description of the whole rangeof food related activities, from production of fishing boats, via fishing, agriculture andindustrialised manufacturing of food to hotels and restaurants14. Unfortunately, thedisadvantage of the result also lies in the very nature of the methodology. As the methodprovides an overview of the large volumes of intra-industrial trade of intermediate goodson an industrial level, the mapping ignores lines of communication and co-operation bothwithin the individual industries in the cluster, and between central cluster units andknowledge providers, innovation partners, suppliers of machinery etc. The secondmethod is use of statistical data on innovation, providing a more detailed overview ofdynamic interactivity within the cluster. The data are from the Community InnovationSurvey, undertaken in 1993 and 1997. The survey includes data for innovation sourcesand technological partners for all European manufacturing industries, includingNorwegian manufactures of food and beverages.
12 Hauknes (1998), op.cit.13 The others are the oil and gas cluster, the construction cluster, the transport cluster and the paper andgraphics cluster, and the information intensive cluster.14 As the mapping is based on intermediate goods, a picture of trade with finished goods frommanufacturing industry to the stores is not provided.

5
2 THE NORWEGIAN FOOD CLUSTER
This chapter contains an overview of the Norwegian food cluster. The basic aim istwofold; i) to provide a description of the Norwegian food cluster, and ii) to give anoverview of dominant processes of change in the cluster.
The chapter starts with a quantification of the food cluster, based on the methodology ofHauknes. A central feature of the cluster is the food processing industry, and we give abrief introduction to the industry, with emphasis on the industry’s role in the nationaleconomy. Further, we give an overview of industrial structure, including a presentation ofthe largest manufacturing food companies, their ownership and the industry sizestructure. As the food industry can be divided into a sub-set of activities (like fishprocessing, meat processing, processing of dairy products etc), a more detailedpresentation is given of the individual activities, however with a close eye on theindustry’s integration towards upstream and downstream activities in the cluster. We thenfollow to look at localisation patterns of the industry, before we look the food distributionsystem, security regulations and innovation activities and policies.
The empirical findings from this chapter are used as a basis for Chapter 3, discussing howchanges in the cluster may affect innovation activities. A main argument is that smallcompanies are structurally vulnerable to the ongoing processes of change in the wholecluster, and that a SME perspective on policy might be needed to maintain industrialdiversity. At the same time, large companies have better ability to exploit the specificitiesof food industrial dynamics, like like-term investments in branding and trade-marks.
Quantitative limitation of the clusterThe industrial extent of - and intermediate relations within - the agrofood cluster ispresented in Figure 1. Thickness of the arrow reflects the magnitude of theinterrelatedness between the different activities. The size of the circles reflects number ofemployees in the industry. The shaded circles represent the food processing industry(NACE 15).

6
Figure 1: The Norwegian food cluster (based on Hauknes 1999, ibid.)
Fodder
Hotels andaccomo-dation
Extractionof crude
oil and gas
Fertilisers
Oils andfats
Agricultureand
husbandryservices
Fishfarming
Fruit andvegetables
Beverages
Other foodproducts
Agriculture
Buildingand repair
of ships
Fishing
Restaurants,catering
Mill products,starches
Fishproducts
Meat andmeat
products
Dairyproducts
Cluster employment
12000
4500
1700
700
7,0 %
2,5 %
1,0 %
0,5 %

7
The agrofood cluster separates from the other Norwegian clusters both in two dominantways: In terms of size and in terms of few linkages to the rest of the economy. Hauknesfinds that the cluster is the largest of the six identified clusters. The cluster’s share ofnational employment is slightly less than 10 percent, with about 170.000 persons15
(1996). The largest employing industries in the cluster are ‘Hotels and accommodation’and ‘Restaurants and catering’, representing respectively 22.000 and 41.000 employees.The following large industries are Agriculture (16.000 employees), fish products (13.500employees), Building and repair of ships (13.000 employees), and Meat and meatproducts and Other food products (both 12.500 employees).
2.1 BACKGROUND
IntroductionThe second part provides a more focused description of interactivity, with main emphasison knowledge providers, innovation sources and technological collaborators to the foodindustry. We find three dominating knowledge providers to the industry; suppliers ofmachinery, suppliers of market knowledge and suppliers of R&D/scientific knowledge.
What is the food cluster?A relevant point of departure in describing the food cluster is the food processingindustry. The Norwegian food industry consists of companies that turn raw materials intoprocessed goods, like fish products, chocolate, meat products, bottled milk, pizzas,beverages etc. Raw materials are mainly supplied by domestic farmers or fishermen.There is hence a strong interdependency between the food companies and the domesticproducers of raw materials. According to Hauknes, 80 percent of intermediate deliveriesare taking place inside the cluster, while only 12 percent takes place with other clusters.Compared to the other five clusters, the agrofood cluster is therefore the most ‘isolated’one, with a radically lower share of linkages to activities outside the cluster than the otherclusters have.
Natural conditions have shown good for production of certain types of raw materials,particularly fishing. Other important natural conditions are soil fertility and plenty ofsweet water. Most agrobased raw materials, like meat, grain and milk, eggs, and potatoesare produced domestically, and Norway is practically self-sufficient with such rawmaterials.
15 The North sea activities (‘extraction of crude oil and gas’) seemingly appears as a part of the food cluster(see Figure). A link is included when flow to receiving sector represent large share of omitting sector totalomitted volume. Oil companies are hence included as they represent large volumes in terms of consumptionof food stuff (mill products, other food products and beverages). We do not include the sector as a part ofthe cluster in the further work, as the basic activity performed in this sector is not related to food in anyway.

8
However, when we talk about the Norwegian food cluster, we are actually talking abouttwo (perhaps three) more or less independent sub-clusters, or production systems.Norwegian food companies can namely be divided into two broad categories, accordingto what kind of raw material they use; agrobased food companies, producing dairyproducts, mill products, fruits, meat and grain-based fodder, and marine based foodcompanies, like producers of fish products and fish-based fodder. In addition, there isalso companies producing beverages, where sweet water represent the largest input interms of volume.
Measured in employment, the agrofood based group of companies is the largest,representing 60 percent16 - or about 35.000 employees - of total employment in the foodindustry. Marine based activities covers about 30 percent (15.000 employees), whilefairly 10 percent are working with production of beverages (about 6.000). As Figure 1illustrates, there exist almost none significant linkages between the three different spaces.Production of beverages, for example, appears as a single island in the figure, withlinkages neither to producers of raw materials nor other food producers. The fish basedproduction system consists of production of fishing boats, fishing, fish farming,manufacturing of fish products, and production of fodder. Norway has one of the worldslongest coast lines17, and fish has been an important export item in hundreds of years, andstill is. Fish-farming has also grown to be an important industry the last decades,particularly red fish. While the red fish is used for food, very large parts of the white fishare either used to fodder or exported without much proccesing. The most fished fish iskolmule, a deepwater cod fish used to fodder. Unprocessed fish (or fish with a low degreeof processing, like filleting and freezing) is the most important Norwegian food exportitem. Most export of unprocessed fish goes to EU countries, particularly Denmark, forfurther processing.
The agrofood production chain is based on agricultural production, which again usesfertilisers and agricultural and husbandry services as dominant intermediate inputs18.From the agriculture activities, the production lines divides into dominant industrialactivities like meat and meat production, dairy products and fodder, and to some lesserextent fruit and vegetables and mill and mill products. Grain, fruit and vegetables aremainly produced in the flat areas of eastern and middle Norway, and western parts ofNorway (Rogaland). Husbandry is mostly kept in mid and north-western Norway, and isdominated by cattle, sheep, pigs and chickens.
16 Including ‘other food products’, like biscuits, chocolate, catering, coffee and tea17 21.465 km including the fjords, or a bit longer than half the distance around the world (40.000 km)18 The only area where agricultural and fish based activities seemingly merge in any substantial way, is inproduction of fodder. As Figure 1 shows, both ‘agriculture’ and ‘fish products’ have dominant links tofodder, and fodder (literally) feeds back to respectively agriculture and fish farming. However, the actuallink between the two production chains is weak. Fodder to fish farming is dominated by herring meal andimported soy. Animal (husbandry) fodder dominantly consists of barley and oats. Fodder aimed athusbandry18 contains mainly 4-5 percent herring meal. For fish fodder, the main agrobased ingredient apartfrom fish meal is soy, but may also include small proportions of wheat and corn gluten.

9
The segmentation is mirrored in the national institutional setting of the food cluster. InNorway, you find for example one Ministry of Agriculture and one Ministry of Fisheries.The research institute sector is also quite segmented, with a wide array of institutionsserving only one of the sectors. The most dominant knowledge suppliers to the agrobasedpart of the cluster are Matforsk, Jordforsk, Planteforsk and NLH. The most importantknowledge suppliers to the fish industry are Fiskeriforskning/University of Tromsø,Fiskerihøgskolen, Fiskeridirektoratet. An overview of these institutions and the sectorthey serve is given in Table 2.
Table 2: Norwegian R&D suppliers in the food processing industry, by main sector.
University/HEI/Governmental Research Institute Private R&D office
Mainly agrobased • Norwegian veterinarycollege
• Agricultural university ofNorway (NLH)
• Matforsk
• Jordforsk
• Planteforsk
• Kontrollinstituttet formeieriprodukter
• Norwegian institute foragricultural research
(NILF)
• Norsk Svineavlslag
• Felleskjøpets fòrutvikling
• Norske Meierier/TINE
• PotetindustriensLaboratorium
• Norsk Kjøtt
Mainly marinebased
• Fiskeriforsk/University ofTromsø
• Norsk Fiskerihøgskole/
• Fiskeridirektoratetsernæringsinstitutt
• Harstad College
• Norconserv
• Havforskningsinstituttet
• Fiskeriforsk
• SNF (fiskeriøkonomi)
• Sildolje- ogSildemelindustriens
Forskningsinstitutt (SSF)
The beverage industry is not at all institutionalised in the same formal way as the fish andagrofood systems. However, the beverage production system has - over the last twentyyears - increasingly been ‘institutionalised’ in another way, by increasingly joineingunder one umbrella, the Orkla investment group. More about this later.
Main figuresThe food industry is Norway’s largest manufacturing industry (NACE 2-digit), and it isgrowing. In companies with 20 or more employees, employment rose from about 49.000in 1993 to about 52.500 in 199719. The industry has experienced a more positiveemployment and turnover trajectory than most other industries, and the share ofmanufacturing employment is today higher than ever before: Employment has risen fromabout 11 percent of manufacturing employment in 1950 to about 18 percent today. TheNorwegian food industry is also more dominating than food industries are in any otherwestern country. Measured as share of manufacturing value added, Norwegian food
19 Statistics Norway (1997), Industristatistikk 1997 (Reviced final figures), Oslo/Kongsvinger

10
industry represented in 1988 eighteen percent. The same figures were for Germany at thattime 10,3 percent, Netherlands 14,8 percent, UK 12, 8 percent and France 12,4 percent 20.
Figure 2 gives an illustrating overview of how dominant the industry is in Norwegianmanufacturing industries. The figure shows total gross value of production (GVP) perindustry (2-digit NACE code)21 in Norway in 1997. GVP from manufacturing of food andbeverages was over 100.000.000.000 NOKs, almost three times as large as the followingindustry on the list. The share of total manufacturing GVP was about 25 percent in 1997.
Figure 2: Gross value of production (NACE 2-digit), 1997, in million NOKs. Source:Statistics Norway Industristatistikk 1997 (Revised, final figures).
0 2 0 0 0 0 4 0 0 0 0 6 0 0 0 0 8 0 0 0 0 10 0 0 0 0 12 0 0 0 0
O ffic e m a c h in e ry
Te xtile
Ra d io s a n d TV s
Ru b b e r a n d p la stic s
M e d ic a l a n d o p tic a l in stru m e n ts
Ele c tric a l m a c h in e ry
O th e r m a n u fa c tu rin g
No n - m e ta llic m in e ra l p ro d u c ts
M e ta l p ro d u c ts
W o o d a n d wo o d p ro d u c ts
P u lp a n d p a p e r
Co ke , re f in e d p e tro le u m p ro d u c ts
M a c h in e ry a n d e q u ip m e n t
Tra n sp o rt e q u ip m e n t
O il p la tfo rm s
P rin tin g a n d p u b lish in g
Ch e m ic a ls
B a sic m e ta ls
Fo o d a n d b e ve ra g e s
It is at the same time a very profitable industry. Figure 3 shows an overview of valueadded per employee in Norwegian food industry. With it’s 500.000 NOKs value addedper employee per year (1996), the industry ranks higher than ‘high-tech’ industries likemanufacture of radios and television sets, electrical machinery, medical and opticalinstruments, oil platforms and machinery and equipment (Figure 3).
20 Wyckoff, A. (1994), Investment, Innovation and Competitiveness: Sectoral performance within the triad,EIMS publication no. 2., p. 75.21 ‘Transport equipment’ is the sum of figures from NACE 34 and 35. ‘Textiles’ is the sum of figures fromNACE 17, 18 and 19. ‘Other manufacturing’ consists of 36 and 37. Oil platforms (NACE 34.114/5) isdrawn from NACE 34 and treated as a separate industry, according to Statistics Norway’s standards.

11
Figure 3: Value added per employee in Norwegian manufacturing industries, in millionNOKs, 2-digit NACE level, 1996. Source Statistics Norway, ukens statistikk, 35, 1998.
0 ,0 0 0 ,2 0 0 ,4 0 0 ,6 0 0 ,8 0 1,0 0 1,2 0 1,4 0 1,6 0 1,8 0
T e xt i le
W o o d a n d w o o d p ro d u c t s
P r in t in g a n d p u b lish in g
M e t a l p ro d u c t s
T ra n sp o r t e q u ip me n t
R u b b e r a n d p la st ic s
M a c h in e ry a n d e q u ip me n t
O il p la t fo rms
O t h e r ma n u fa c t u r in g
M e d ic a l a n d o p t ic a l in st ru me n t s
N o n -me t a ll ic min e ra l p ro d u c t s
E le c t r ic a l ma c h in e ry
R a d io s a n d T V s
P u lp a n d p a p e r
F o o d a n d b e ve ra g e s
B a sic me t a ls
O ffic e ma c h in e ry
C h e mic a ls
C o ke , re fin e d p e t ro le u m p ro d u c t s
An important condition for the food cluster is the regulatory framework. Food regulationmechanisms are complex, ubiqous and interwoven, concerning close to all areas of foodproduction, from breeding, selection and preparation of raw materials, processing,preservation and storing, packing, wrapping and coating, hygiene and safety, quality andnutrition to quality documentation, transport and distribution, trading and sale.
Food and beverages

12
International trade regulations for food
Table 3: Brief overview of regulation of international trade with Norwegian food andfood products. Source: Næringsmiddellovutvalget/Nærings og energidept, (1996),Effektiv matsikkerhet, NOU 1996:10.
Event Starting Covers Food products Raw materials
Aim Policy Aim Policy
‘Initially’ 1930s Shelteringof domestic
foodproducers
Sheltered frominternationalcompetition
Strong protection throughquantitative import restrictions
Sheltered frominternationalcompetition
Strong protectionthrough quantitative
import restrictions
The EEAagreement
1993 Trade withthe
EuropeanUnion
Achieve equalpossibilities for
exchange ofmanufactured
goods, includingfood stuff. MakeNorway adapt to
EU regulations
Applies dominantly to agrofoodproducts. Horizontal rules for
‘health and honesty’ in foodproduction, common veterinary
standards and harmonisationof quality (i.e. standards for
use of ingredients andadditives).
Not included in the EEA agreement, butNorway has duty free access for un-
processed fish
GATT/Uruguay
1995 World trade Increase worldtrade
Change from quantitativeimport restrictions to (gradually
lowered) toll duties.Introduction of minimum
import quotas. Lowering exportsubsidies of national
producers.
Increase worldtrade
Change fromquantitative import
restrictions to(gradually lowered)
toll duties. Allowimport quotas.
WTO 1999+ World trade Increase worldtrade
Further duty reductions? Increase worldtrade
Further dutyreductions?
2.2 OWNERSHIP STRUCTURE AND DOMINANT COMPANIES
Norwegian food companies can be categorised in three, according to their corporatestatus22;
i) Corporation controlled companies, include those companies belonging to nationalor international groups controlling multiple daughter companies. This groupinclude almost all the largest companies (a presentation of the largest companies,employment and ownership is provided below), and cover the five largestNorwegian food companies - Ringnes, Stabburet, Nidar, Freia and Toro. Thesecompanies are vertically integrated in processing, marketing and sales activities,and recognised by a traditional strong market orientation and they were all earlyto develop brand-names. Relation to raw-material suppliers vary from pure marketrelations to more stable relations23. Orkla-owned companies, for example, has astrategy of developing stable supplier relations24. Ringnes, Stabburet and Nidar areall controlled by Orkla, the largest owner-group. Orkla is a Norwegian investmentgroup with ownershares in a wide array of domestic companies, ranging from
22 Knut Onsager og Berit Aasen (1995); Innovasjon og renere teknologi - en studie av landbruksbasertforedlingsindustri, NIBR Notat 1995;117, NIBR, Oslo23 Onsager and Aasen (op.cit.)24 Nationen, 19.05.99

13
newspapers to insurance, chemistry, and food. About 6.500 persons are employedin Orkla-controlled food companies, and main emphasis lies within pizzas andbaked products, jams, juices, mineral water and conserved vegetables. More aboutOrkla in the Appendix. Rieber is located in Bergen, and main products are soupsand fish products. Rieber & Søn are is also involved in building and constructionof roads and production of containers and boxes. The food companies belongingto Rieber & Søn employ about 2.000 persons. There are few internationalcompanies located in Norway. Freia is controlled by the American Kraft GeneralFoods/Philip Morris corporation, with about 1200 employees. Nestlé has also afew companies in Norway, producing fish products and baby food.
ii) Companies belonging to a co-operative structure, covering producer-owned,regionally located production-companies, joining in a common nationaldistribution, marketing and sales organisation. These are strongly verticallyintegrated companies, with strong links to producers of raw material (fruit,vegetables, meat, milk, eggs). Companies belonging to this structure are large,like Hedmark-Oppland slakterier and Gilde-Agro Fellesslakterier with 650 and500 employees. Both these companies belong to Norsk Kjøtt, and three of the tenlargest food companies belong to one ore another co-operative. The co-operativeshave increasingly emphasised brand-naming the last decades, through Gilde(Norsk Kjøtt) and TINE (milk and milk products). The co-operative’s relations toretail stores vary, but are mostly market based. The production monopoly of TINEhas forced retailers to sell TINEs products, while the meat co-operative has metconsistently resistance from the retailers, which explicitly have said they arelooking for competitors to Norsk Kjøtt.
iii) Independent producers, mostly small, autonomous familiy-owned companies.These are companies with weak vertical integration both upstream anddownstream. Owners are often participating in the day-to-day production. Atypical example is Majonesfabrikken, located at the heart of Oslo, with 14employees. The factory produces majonese salads for grocery shops located in thegreater Oslo region, and the manager, who runs the factory with his son, isresponsible for both production, office management and transport. Ingredients arepurchased on marked basis from local suppliers (eggs and oil) and importerslocated in the Oslo region.

14
Table 4: Norwegian food establishments and employment, 199625. Source: StatisticsNorway employment register, 1996, web-info 1999 and telephone interviews 1999.
Establishment Empl. Industry Ownership
RINGNES AS 1485 Brewery Investor group (Orkla)
FREIA AS 1223 Other food Foreign (Kraft General Foods)
STABBURET AS 828 Other food, meat Investor Group (Orkla)
NIDAR AS 693 Other food Investor Group (Orkla)
TORO PRODUK SJON 648 Other food Investor Group (Rieber & Søn)
HEDMARK OPPLAND SLAKTERIER 633 Meat Co-operative (Norsk Kjøtt)
HANSA BRYGGERI AS 627 Brewery Var. financial investors26
GILDE AGRO FELLESSLAKTERI BA 514 Meat Co-operative (Norsk Kjøtt)
VESTFOLD-BUSKERUD SLAKTERI A/L 460 Meat Co-operative (Norsk Kjøtt)
RINGNES E C DAHLS BRYGGERI AS 458 Brewery Investor group (Orkla)
BØNDERNES SALGSLAG 444 Meat Co-operative (Norsk Kjøtt)
STABBURET AS 441 Other food Investor group (Orkla)
FELLESMEIERIET OSLO 411 Dairy Co-operative (TINE Norske Meierier)
FELLESSLAKTERIET A/L 365 Meat Co-operative (Norsk Kjøtt)
SÆTRE AS 334 Pastry Investor group (Orkla)
DENOFA AS 308 Oils Investor group (Orkla)
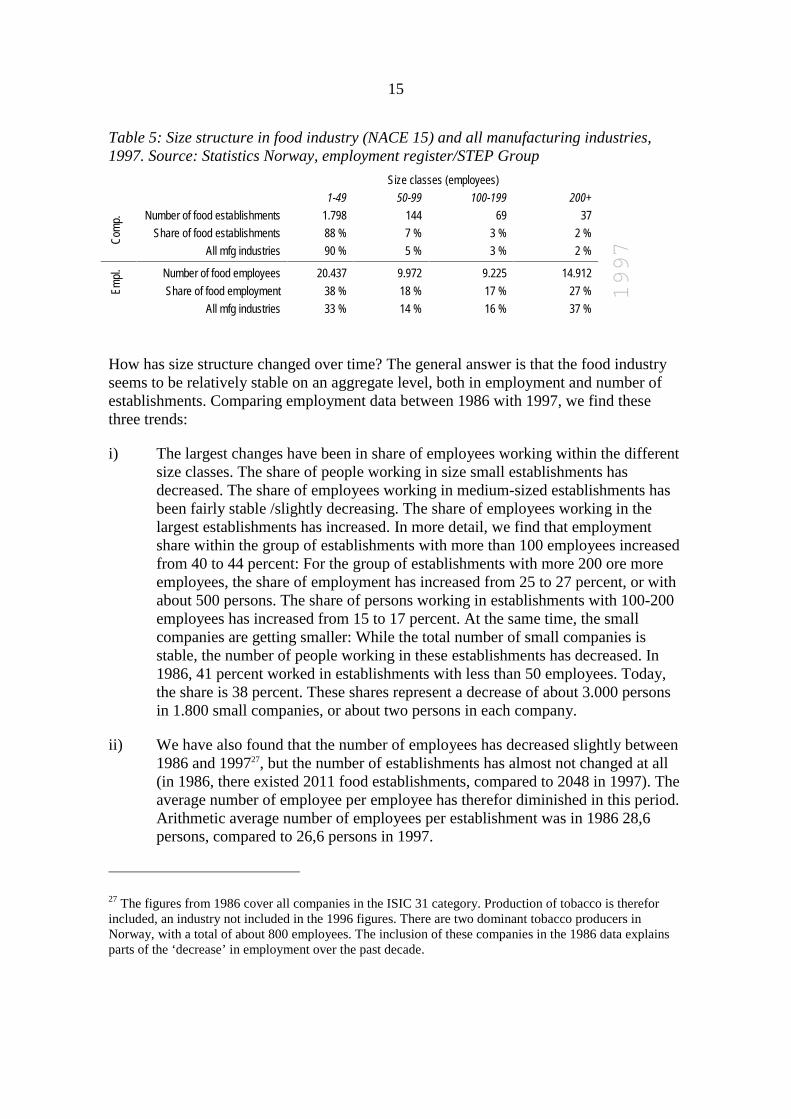
Size structureThe size structure of the food industry is very similar to national size structure: Manysmall-sized establishments and relatively few large ones. There are for example only twofood establishments with more than 1.000 employees; Ringnes and Freia (Table 4). Fromabout 2.000 food establishments, the share of large establishments is practically the sameas national average for manufacturing industries; five percent of the establishments have100 or more employees (Table 5). For establishments with 50-99 employees, the share isa bit less than average (five percent, compared to seven percent), and the share of smallestablishments (less than 50 employees) is consequently a bit higher (90 to 88 percent).
25 The dataset does not provide total company employment. Stabburet, for example, is listed in theoverview with 828 employees, which only include the largest establishment within the company. Stabburethas a total of about 1400 employees. Ringnes breweries has 2.100 employees.26 Hansa Bryggeri was untill recently a part of Orkla, before it was sold to individual investors. Thebrewery merged with Borg Bryggerier in the late 90s, and largest owner share today is held by BorgBryggerier Holding (30 percent), employees (7,5 percent), Hamar Papir (7,5 percent) and a group offinancial investors (a.o. K-invest, Gjensidige and Norske Liv).
15
Table 5: Size structure in food industry (NACE 15) and all manufacturing industries,1997. Source: Statistics Norway, employment register/STEP Group
Size classes (employees)
1-49 50-99 100-199 200+
Number of food establishments 1.798 144 69 37
Share of food establishments 88 % 7 % 3 % 2 %
Com
p.
All mfg industries 90 % 5 % 3 % 2 %
Number of food employees 20.437 9.972 9.225 14.912
Share of food employment 38 % 18 % 17 % 27 %Empl
.
All mfg industries 33 % 14 % 16 % 37 %
How has size structure changed over time? The general answer is that the food industryseems to be relatively stable on an aggregate level, both in employment and number ofestablishments. Comparing employment data between 1986 with 1997, we find thesethree trends:
i) The largest changes have been in share of employees working within the differentsize classes. The share of people working in size small establishments hasdecreased. The share of employees working in medium-sized establishments hasbeen fairly stable /slightly decreasing. The share of employees working in thelargest establishments has increased. In more detail, we find that employmentshare within the group of establishments with more than 100 employees increasedfrom 40 to 44 percent: For the group of establishments with more 200 ore moreemployees, the share of employment has increased from 25 to 27 percent, or withabout 500 persons. The share of persons working in establishments with 100-200employees has increased from 15 to 17 percent. At the same time, the smallcompanies are getting smaller: While the total number of small companies isstable, the number of people working in these establishments has decreased. In1986, 41 percent worked in establishments with less than 50 employees. Today,the share is 38 percent. These shares represent a decrease of about 3.000 personsin 1.800 small companies, or about two persons in each company.
ii) We have also found that the number of employees has decreased slightly between1986 and 199727, but the number of establishments has almost not changed at all(in 1986, there existed 2011 food establishments, compared to 2048 in 1997). Theaverage number of employee per employee has therefor diminished in this period.Arithmetic average number of employees per establishment was in 1986 28,6persons, compared to 26,6 persons in 1997.
27 The figures from 1986 cover all companies in the ISIC 31 category. Production of tobacco is thereforincluded, an industry not included in the 1996 figures. There are two dominant tobacco producers inNorway, with a total of about 800 employees. The inclusion of these companies in the 1986 data explainsparts of the ‘decrease’ in employment over the past decade.
1997

16
iii) The total number of enterprises - and the share of establishment in different sizeclasses - has been stable.
2.3 THE GEOGRAPHY OF FOOD COMPANIES
The geography of the food industry is of particular interest, in three ways. Firstly, foodemployment in general plays a dominant role in almost all regions. Secondly, theNorwegian food industry is market by a distinguished regional division of labour.Thirdly, there is a pattern in terms of how different activities, like manufacturing,marketing and R&D activities, within large companies are localised.
Firstly, the food industry seen as a whole is not confined to particular regions. It standsfor large quantities of employment in almost all counties. With the exception of the threesouthernmost counties (Vest-Agder, Aust-Agder and Telemark), each county has at least2.000 employees within food manufacturing (Figure 4). The largest ‘food counties’measured in number of employees, are Hordaland and Rogaland, and Møre og Romsdaland Sør-Trøndelag. Large companies in these counties are Toro produksjon, Hansabryggerier, Norway Foods (Hordaland), Tou bryggerier, Agro fellesslakteri, in addition toseveral dairies and producers of fodder (Rogaland) and E C Dahls bryggerier and Nidar(Trondheim). Employment measured as share of total employment in manufacturingindustries (Figure 5), we see that the food industry is particularly dominant in the mostrural counties, including the northernmost and coastal ones, like Finnmark, Nordland,Troms, Møre og Romsdal and Sogn og Fjordane.
Secondly, the food industry is marked by a regional division of labour. We have alreadytouched briefly upon this. Fish processing is most important in the northern and north-western area of coastal Norway, and the large share of food employment in these counties(see above) is mostly found within fish processing. Meat and dairy industries are mostimportant in central and eastern Norway (Hedmark, Oppland, Nord-Trøndelag, Sør-Trøndelag and Østfold). Pastry products are produced in Oslo and Sør-Trøndelag. Oil andfat production are located in Østfold. Fruits are processed in the larger surrounding areaof the capital region (Vestfold, Hedmark, Oppland). Production of beverages are mainlylocalised to four main towns in each part of the country.
Thirdly, there seems to be a general pattern of how large food companies locate theirdifferent activities. For large companies production is regionalised, while marketdivisions, research and head office is located in the Oslo region. Maarud, producingpotato chips, taco stuff and pommes frites, has production facilities at Disenå betweenSkarnes and Årnes, while sales and marketing is located at Rodeløkka in Oslo. Nestlé hasa market and sales office at Billingstad in the outskirts of Oslo, with Findus factory atHammerfest in Finnmark and baby food production at Hamar. TINE Norske Meierier isowned by several dairies located in different regions of the country, but have salesdivision, market division and research division in Oslo. Frionor has a marketing andresearch division in Oslo and a production location in Trondheim. Mills has head officein Oslo, with production in Fredrikstad, Drammen, Lillehammer, Trondheim,Finneidfjord in addition to Oslo. Fjordland, producing dairy products and prepared meals,is solely an administrative company, with all employees located in the Oslo office

17
(administration, economy, marketing and sales), renting production capacities frommanufacturing units belonging to Fjordlands owners (TINE, Norsk Kjøtt /Gilde andPrior).
Figure 4: Employment in the Norwegian food industry, number of employees by county,1996 (N=55.113)28. Source: Employment register, 1996, STEP Group / Statistics Norway
0 1000 2000 3000 4000 5000 6000
ØSTFOLD
AKERSHUS
OSLO
HEDMARK
OPPLAND
BUSKERUD
VESTFOLD
TELEMARK
AUST AGDER
VEST AGDER
ROGALAND
HORDALAND
SOGN OG FJORDANE
MØRE OG ROMSDAL
SØR TRØNDELAG
NORD TRØNDELAG
NORDLAND
TROMS
FINNMARK
Regional innovation systems in the food cluster?Regional innovation systems consist of systems where an industry branch is particularlydominating, and where companies participate in innovative networks, often reckognisedby some kind of cultural unification. The most known successful regional innovationsystems are Silicon Valley, some industrial districts in Northern Italy and Cambridge. Ina quantitative study of Norwegian regional inovation system, Isaksen discovered 13 suchfood clusters in fish processing and none in agrofood29. Seven of the fish processingclusters were located in the two northernmost counties (Troms og Finnmark), while therest were located in western and north-western Norway (Sør-Trøndelag, Møre ogRomsdal, Sogn og Fjordane and Hordaland). The clusters were identified throughemployment statistics, where employment in one region and one industry was three timeshigher than national average, and included at least 10 companies and 200 employees.These results echo the findings above, where we stated that the fish processing industry isof particular domination in the northern-most counties.
28 Measured in number of employees living in county and working in the food industry29 A. Isaksen (1996); Regional Clusters and Competitiveness: the Norwegian case, STEP report R-16-1996,STEP Group, Oslo

18
Figure 5: Food industry employment as share of industrial employment, by county, 1996(national average = 21 percent)28. Source: Employment register, 1996, STEP Group /Statistics Norway.
0 % 20 % 40 % 60 % 80 %
ØSTFOLD
AKERSHUS
OSLO
HEDMARK
OPPLAND
BUSKERUD
VESTFOLD
TELEMARK
AUST AGDER
VEST AGDER
ROGALAND
HORDALAND
SOGN OG FJORDANE
MØRE OG ROMSDAL
SØR TRØNDELAG
NORD TRØNDELAG
NORDLAND
TROMS
FINNMARK
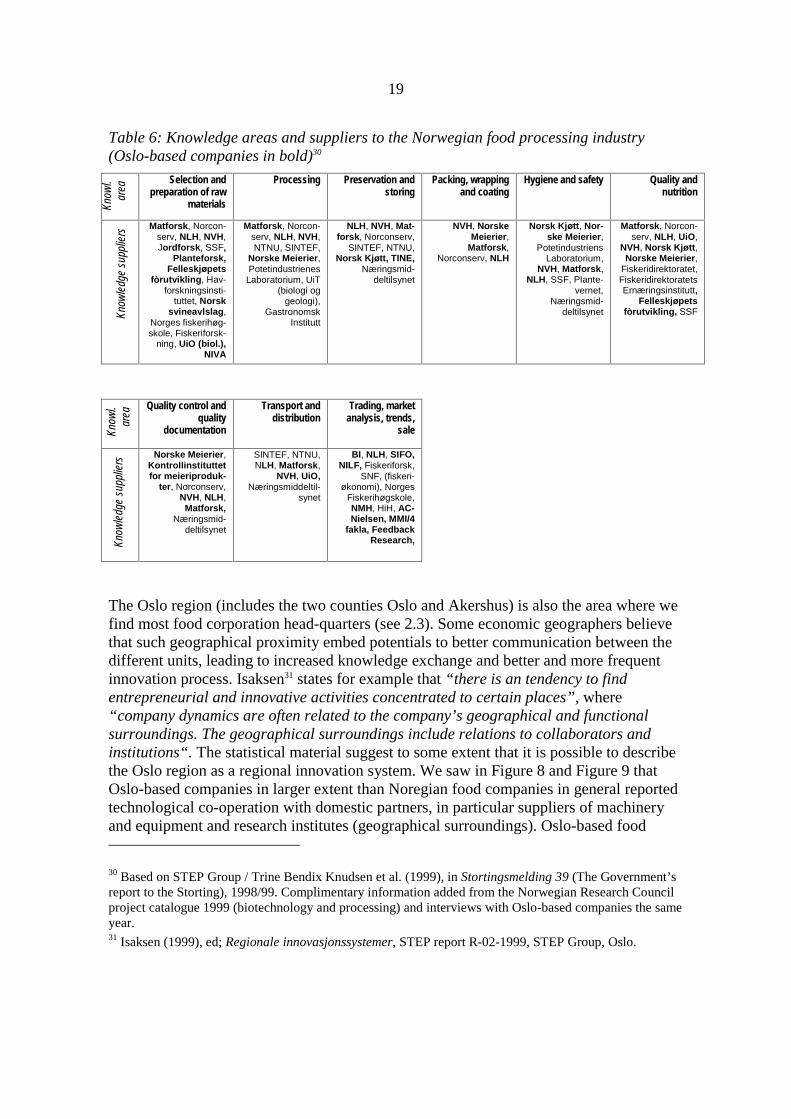
The disadvantage of Isaksen’s model is that it does not say anything about the relationsbetween the companies in these regions. Neither does it illuminate how and to whichextent knowledge suppliers play a role in food innovation. So who are the core suppliersof external knowledge, where are they located and what fields do they operate in? In asurvey performed by STEP Group in 1997, Norwegian food companies were asked whichresearch environment they regarded as important knowledge providers to their field ofproduction. The result is presented in Table 6. The table shows dominant knowledgeareas in the food industry, and more than 30 knowledge providers in these areas. Themost important ones are described later in this paper.
Several aspects can be derived from this table. Firstly, we see that the most frequentfound knowledge suppliers are located in the Oslo region. These knowledge suppliersinclude Jordforsk (Ås), Planteforsk (Ås), Matforsk (Ås), NorgesLandbrukshøgskole/NLH (Ås), Norges Veterinærhøyskole/NVH (Oslo) and University ofOslo (UiO). Particularly seems Matforsk to be the most extensive knowledge supplier tothe food industry, which according to the table supplies almost all food-related activitieswith scientific knowledge. The list also includes Oslo-based branch-institutes, likeresearch laboratories at TINE Norske Meierier and Norsk Kjøtt. In addition, the mainbulk of market monitoring companies and trend analysts are located here. We alsoremember from earlier that machinery suppliers are mainly located in the Oslofjord area.
19
Table 6: Knowledge areas and suppliers to the Norwegian food processing industry(Oslo-based companies in bold)30
Know
l.ar
ea
Selection andpreparation of raw
materials
Processing Preservation andstoring
Packing, wrappingand coating
Hygiene and safety Quality andnutrition
Know
ledg
e su
pplie
rs
Matforsk, Norcon-serv, NLH, NVH,Jordforsk, SSF,
Planteforsk,Felleskjøpets
fòrutvikling, Hav-forskningsinsti-
tuttet, Norsksvineavlslag,
Norges fiskerihøg-skole, Fiskeriforsk-
ning, UiO (biol.),NIVA
Matforsk, Norcon-serv, NLH, NVH,NTNU, SINTEF,
Norske Meierier,PotetindustrienesLaboratorium, UiT
(biologi oggeologi),
GastronomskInstitutt
NLH, NVH, Mat-forsk, Norconserv,
SINTEF, NTNU,Norsk Kjøtt, TINE,
Næringsmid-deltilsynet
NVH, NorskeMeierier,
Matforsk,Norconserv, NLH
Norsk Kjøtt, Nor-ske Meierier,
PotetindustriensLaboratorium,
NVH, Matforsk,NLH, SSF, Plante-
vernet,Næringsmid-
deltilsynet
Matforsk, Norcon-serv, NLH, UiO,
NVH, Norsk Kjøtt,Norske Meierier,
Fiskeridirektoratet,FiskeridirektoratetsErnæringsinstitutt,
Felleskjøpetsfòrutvikling, SSF
Know
l.ar
ea
Quality control andquality
documentation
Transport anddistribution
Trading, marketanalysis, trends,
sale
Know
ledg
e su
pplie
rs
Norske Meierier,Kontrollinstituttetfor meieriproduk-
ter, Norconserv,NVH, NLH,Matforsk,
Næringsmid-deltilsynet
SINTEF, NTNU,NLH, Matforsk,
NVH, UiO,Næringsmiddeltil-
synet
BI, NLH, SIFO,NILF, Fiskeriforsk,
SNF, (fiskeri-økonomi), Norges
Fiskerihøgskole,NMH, HiH, AC-Nielsen, MMI/4
fakla, FeedbackResearch,
The Oslo region (includes the two counties Oslo and Akershus) is also the area where wefind most food corporation head-quarters (see 2.3). Some economic geographers believethat such geographical proximity embed potentials to better communication between thedifferent units, leading to increased knowledge exchange and better and more frequentinnovation process. Isaksen31 states for example that “there is an tendency to findentrepreneurial and innovative activities concentrated to certain places”, where“company dynamics are often related to the company’s geographical and functionalsurroundings. The geographical surroundings include relations to collaborators andinstitutions“. The statistical material suggest to some extent that it is possible to describethe Oslo region as a regional innovation system. We saw in Figure 8 and Figure 9 thatOslo-based companies in larger extent than Noregian food companies in general reportedtechnological co-operation with domestic partners, in particular suppliers of machineryand equipment and research institutes (geographical surroundings). Oslo-based food
30 Based on STEP Group / Trine Bendix Knudsen et al. (1999), in Stortingsmelding 39 (The Government’sreport to the Storting), 1998/99. Complimentary information added from the Norwegian Research Councilproject catalogue 1999 (biotechnology and processing) and interviews with Oslo-based companies the sameyear.31 Isaksen (1999), ed; Regionale innovasjonssystemer, STEP report R-02-1999, STEP Group, Oslo.
20
companies also had more often collaboration with external suppliers of machinery(functional surroundings).
However, the main argument against the region being a regional innovation system is thatfood employment as share of total employment is relatively low; about 18 percent ofmanufacturing employment in Oslo (national average is slightly higher) is found in foodcompanies - representing 14 percent of total Norwegian food employment.
2.4 DISTRIBUTION SYSTEM AND MARKETS32
A large part of domestically produced food products reach their markets throughwholetrade and subsequently through stores. Such stores consist dominantly of retailstores, but also include restaurants and hotels, bakeries, fast food restaurants, kiosks andgas stations. Total turnover for retail stores33 and hotels and restaurants34 in Norway isabout 120 billion NOKs, sales of grocery products, food and beverages from gas stationsnot included. Retail store turnover represents about 80 percent of this turnover, and this iswhere we will keep our focus. As with the food industry, the mass market distributionsystem is marked by a converged ownership structure. As much as 99 percent of groceryturnover35 is now taking place within the four retail groups; NorgesGruppen (33 percent),NKL (25 percent), Hakon Gruppen AS (28 percent) and Reitan-Gruppen (13 percent).NKL is membership controlled, whilst the three others are familiy-owned.
The most predominant change within the last decades’ development of chain groups hasbeen the entering of low-price chains like Rimi and Rema, which increasingly dominatethe market. Rimi (Hakon-gruppen) is the single largest chain with 14,6 of total groceryturnover. Rema (Reitan-gruppen) is the second largest with 12,6 percent. These chainsare both price-focused and their product arrays are limited. The top-down structure givesthe local manager no powers to sell other products than what is decided by the groupowners.
The chains also vary in degree of integration with the group. Dulsrud (ibid.) separatebetween three forms of integration:
i) Voluntarily chains are chains where acquisition of food products / other productsis arranged through a varying degree of co-operation, but where the individualshops still have a relatively large freedom and control over what they sell.
32 This section is mostly based on A. Dulsrud (1999); Markedstrender og utvikling i distribusjonsmønsteret,in Borch, O. J. and E. P. Stræte (op.cit.)33 Retail is here defined as those companies categorised under NACE 52.1 (retail stores with broad productarray) and 52.2 (specialised retail stores for food and beverage products), according to Statistics Norway.Source: SSB (1996); Wholesale and Retail Trade Statistics 1996, C531, Oslo-Kongsvinger, Table 534 Not including accomodation. Covers those companies categorised under NACE 55.1-5 (Hotel andrestaurants). Source: Statistics Norway (1997); Hotell- og restaurantvirksomhet, registerstatistikk, Oslo-Kongsvinger
35 Including non-food items.

21
NorgesGruppen, for example, includes about 15 large and small chains, most ofthem of this type. NorgesGruppen includes supermarket chains like AKA/Spar,Meny, Jens Evensen and Lorentzen. This category also cover the stores belongingto NKL, a co-operative owned by local grocers.
ii) Satellite chains are chains where stores are owned - and product array isdetermined - centrally in the chain, and where profits go to the chain owner. Suchstores are run by managers hired by the chain, and the managers have little or noinfluence on the product array. A typical example is Rimi (Hakon-gruppen).
iii) Franchise chains are chains where independent managers run their own storeunder a common chain with few people working in the umbrella organisation. Themanagers have separate The managers in franchise chains don’t have - like withsatellite chains - much freedom to determine the product array. The maindifference is that profits goes in a larger extent back to the store. Example of afranchise chain is Kiwi, a low-price chain under NorgesGruppen.
Integration also has a vertical dimension. Upstream, the chains have integrated withwholesalers and to some extent with national manufacturers of private brands or otherregional suppliers, a completely new situation compared to before, where retail storeswere loosely integrated. Between wholesale and retail, this vertical integration has gonevery far. All the largest wholesalers have agreements with one of the chain groups.Hakon-gruppen uses Hakon-gross, a buy-up of former wholesale groups like Staff, KøffNord, Køff Sør, and others. NorgesGruppen uses Joh. System A/S, which also owns 50percent of NorgesGruppen. The strongest vertical relations between wholesale and retailare found in NKL and Reitan-Gruppen, which owns their own wholesalers. NKL ownsNKL Vareforsyning, while Reitan-Gruppen owns Rema-gross.
All groups have vertical relations to producers of private label products. These relationsare, however, more often contractual and not based on ownership. NKL is the group withtightest relations to manufacturers, owning mills, bakeries and conserves companies.Reitan-Gruppen uses Grans as their producer of beverage on private label and NordfjordKjøtt AS as supplier of meat products. NorgesGruppen uses Lerum as stablemanufacturer of juices, jams and beverages under their private label Eldorado.
Vertical and horizontal integration has had direct implication on how different foodproducts access the shelves. Companies without any vertical relation to the groups mustre-negotiate supplier agreements once a year. For all food companies, market access isinitially based on how many groups or chains the company manage to enter. For largeproducers of well-known brand-names, for example - like TINE, Coca Cola, Gilde andFreia - entering the Norwegian store shelves is almost guaranteed. For these producers,there is an initial mutual dependency with the grocery chains: The chains need the well-known brand-names, the brand-names need the chains. For other companies, likeFjordland, maintaining their relation with the chains can be a more vexatious task.Fjordland is a medium-sized producer of prepared meals and dairy products, which usedto have a large share of turnover secured through supplies to Hakon-gruppen. However,one day Fjordland received a fax from Hakon, stating that Fjordland ‘was too expensive

22
for the group, and was out of business with Hakon’. Overnight, forty percent of Fjordlandturnover had disappeared.
Gaining access to the store is only one part of the process of reaching the market. Insidethe store, there are other deciding factors: Products’ location in the store, number ofcompeting products in the store and how much shelf space is offered. The basicdifference from earlier is that these are all factors the chains are more in control of thanbefore. Competing private label products is one such developments. NKL is the oldestchain group in Norway, and has used private label products for a long time (their ‘blueand white’ products was introduced in the seventies). As an increasing share of stores arepart of a chain, emphasis on private labels products has increased. All groups use privatelabels, and private labels is found in an increasing number of products, like beers anmineral waters, conserves, jams and juices, pizzas, pet food, coffee and meat products, inaddition to non-food products like washing cloths, toothpaste and soaps.
As some of the retail groups are increasingly aiming at the Nordic and Eastern Europeanmarkets, the contracts with the groups becomes even more important over time. Reitan-gruppen has for example opened shops in Denmark and Poland36, and Hakon-gruppen is aco-owner of the Swedish ICA. Recently a leveraged buy-out of ICA/Hakon-gruppen fromthe Dutch Ahold was proposed.
2.5 THREE EXTERNAL KNOWLEDGE SUPPLIERS TO THE FOOD CLUSTER
In this section we look more closely at the manufacturing part of the food cluster,illuminating the most central, external knowledge suppliers to the food processingindustry. We find three such important supplier categories. These are suppliers ofmachinery, consumer bridging companies (like suppliers of trend analysis and marketsurveillance) and suppliers of basic and applied R&D knowledge. We give a detailedpresentation of the importance of these knowledge providers and give an overview ofrelations between these knowledge suppliers and the industry part of the food cluster.
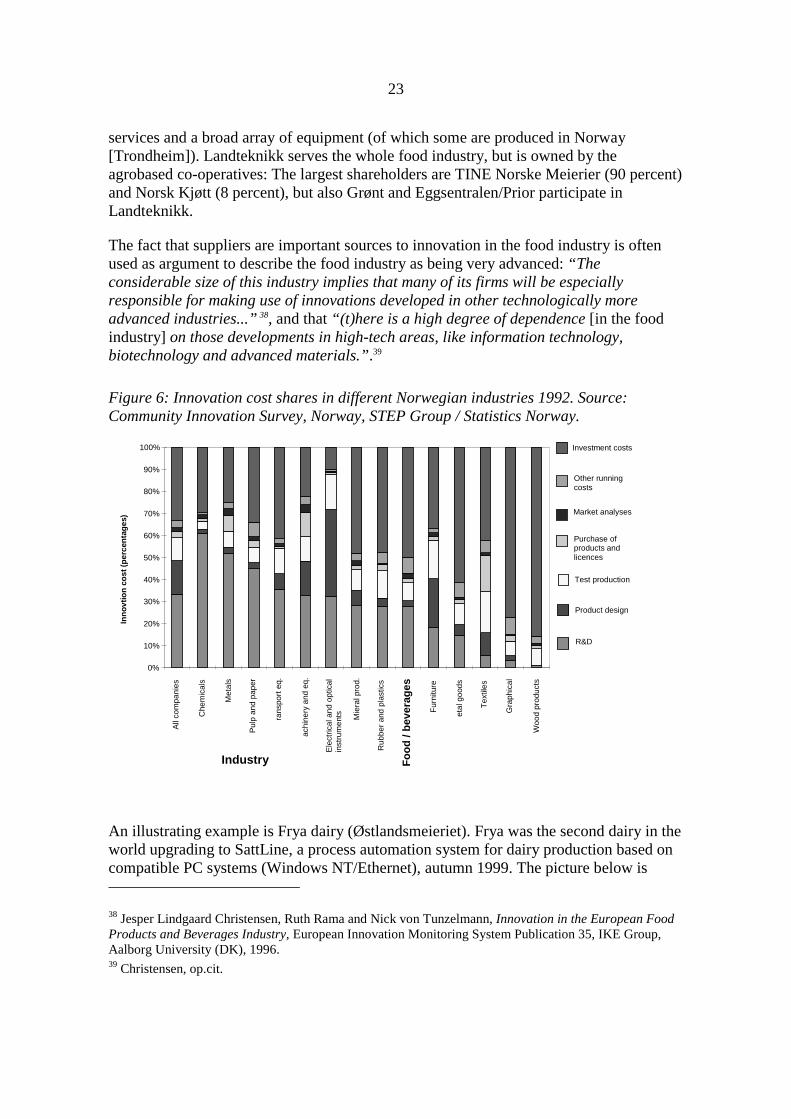
Suppliers of machinery and equipmentNew machinery and equipment is the single largest innovation cost for food companies, ifwe judge by 1993-statistics. Investment costs represent about 50 percent of totalinnovation costs, a higher share than what we find in heavy machinery-based industrieslike pulp and paper and metal production (Figure 6). Norwegian food companies aremainly using machinery from Danish, German, Dutch, British and Japanese companies,most often acquired through Norwegian retailers localised near the Oslo-fjord area37.Most relations between the industry and suppliers of machinery are market-based.However, not so with the most central machinery retail company, Landteknikk AS, withabout 250 employees. The company is located in Oslo, Stavanger and Trondheim andsupplies the food industry with complete process chains and machinery, consulting
36 See for example http://www.kappa-design.cz/plany/rema.htm37 Aasen and Onsager ibid.
23
services and a broad array of equipment (of which some are produced in Norway[Trondheim]). Landteknikk serves the whole food industry, but is owned by theagrobased co-operatives: The largest shareholders are TINE Norske Meierier (90 percent)and Norsk Kjøtt (8 percent), but also Grønt and Eggsentralen/Prior participate inLandteknikk.
The fact that suppliers are important sources to innovation in the food industry is oftenused as argument to describe the food industry as being very advanced: “Theconsiderable size of this industry implies that many of its firms will be especiallyresponsible for making use of innovations developed in other technologically moreadvanced industries...” 38, and that “(t)here is a high degree of dependence [in the foodindustry] on those developments in high-tech areas, like information technology,biotechnology and advanced materials.”.39
Figure 6: Innovation cost shares in different Norwegian industries 1992. Source:Community Innovation Survey, Norway, STEP Group / Statistics Norway.
0%
10%
20%
30%
40%
50%
60%
70%
80%
90%
100%
All
com
pani
es
Che
mic
als
Met
als
Pul
p an
d pa
per
rans
port
eq.
achi
nery
and
eq.
Ele
ctric
al a
nd o
ptic
alin
stru
men
ts Mie
ral p
rod.
Rub
ber
and
plas
tics
Fo
od
/ b
ever
ages
Fur
nitu
re
etal
goo
ds
Tex
tiles
Gra
phic
al
Woo
d pr
oduc
ts
Industry
Inn
ovt
ion
co
st (
per
cen
tag
es)
Investment costs
Other runningcosts
Market analyses
Purchase ofproducts andlicences
Test production
Product design
R&D
An illustrating example is Frya dairy (Østlandsmeieriet). Frya was the second dairy in theworld upgrading to SattLine, a process automation system for dairy production based oncompatible PC systems (Windows NT/Ethernet), autumn 1999. The picture below is
38 Jesper Lindgaard Christensen, Ruth Rama and Nick von Tunzelmann, Innovation in the European FoodProducts and Beverages Industry, European Innovation Monitoring System Publication 35, IKE Group,Aalborg University (DK), 1996.39 Christensen, op.cit.

24
taken at Frya, and shows two operators controlling the new automation system, suppliedby Landteknikk. The picture illustrates how a seemingly ‘backward’ industry can be‘advanced’ through implementing and using new technology.
Figure 7: Surveillance of the automation system at the Frya Dairy (Østlandsmeieriet)
Further, if we ask Norwegian food processing companies how often they undertaketechnological development projects with different partners, one of the most used partnersare suppliers of machinery and equipment. Figure 8 shows the share of innovative foodcompanies reporting different types of domestic technological collaborators in the periodof 1995 to 1997. Figures for Norwegian food companies and Oslo-based food companiesonly, compared to national average for all companies, marked with circles. Suppliers ofmachinery and equipment founds the second most important domestic partners for bothgroups of companies. For foreign partners (Figure 9), suppliers of equipment andmachinery is the most frequent used partner for both Oslo-based companies alone and forall Norwegian companies together.

25
Figure 8: Domestic technological co-operation: Share of innovative food companiesreporting technological co-operation with Norwegian partners the last three years(weighted figures), in Oslo and whole Norway, compared to national average (circles).Source: Community Innovation Survey 1997, STEP Group / Statistics Norway
0 % 20 % 40 % 60 %
Other enterprises
within the group
Competitors
Clients or
customers
Consultancy
enterprises
Suppliers of
equipment etc.
Universities, HEI
Public or private
research institutes
Norway
Oslo
Figure 9: Foreign technological co-operation: Share of innovative food companiesreporting technological co-operation with foreign partners the last three years (weightedfigures), compared to national average (circles). Source: Community Innovation Survey1997, STEP Group / Statistics Norway
0 ,0 0 % 2 0 ,0 0 % 4 0 ,0 0 % 6 0 ,0 0 %
Other enterpriseswith in the group
Competitors
Clients or customers
Consultancyenterprises
Suppliers ofequipment etc.
Un iversities, HEI
Public or privateresearch institu tes
Norway
Oslo
The figures above also demonstrate that suppliers of equipment and machinery found animportant, but not the only kind of technological partner for the food industry. The realityis more complex. The food industry draws upon knowledge from a wide array of internal

26
and external knowledge suppliers. Sometimes food companies collaborate withcompetitors and consultancy enterprises. Between 10 and 20 percent of the companiesreported they had had such co-operation the last three years. More important, however, isthe role of enterprises within the corporation and Norwegian research institutions, likeuniversities and research institutes. If we look only at co-operation with Norwegianpartners, about 40 percent of the companies had collaborated technologically with at leastone of these three kind of partners. Customers are also important: ¼ of the companies hadcollaborated with customers.
Cohen and Levinthal40 claim that in order to absorb such external knowledge, companieshave historically had to establish receiver competencies - or absorptive capacities, as theyterm it - that enable putting external knowledge into useful and innovative practice in thecompany. The pattern of collaboration is also a reflection of how food companiescollectively have arranged their organisation to receive external knowledge: There existfor example strong receiver capabilities for knowledge from scientific suppliers, for newmachinery and for ideas stemming from within the group. As we will show, the foodindustry also carry capabilities of putting knowledge from market monitoring intoinnovation activities.
We therefor argue that labels like both ‘supplier dominated’ and ‘process innovative’should be used with caution when describing the food industry. We find reasons tobelieve that the idea of the food industry being a supplier-dominated industry is not anaccurate description of the food cluster, as the supplier-dominated perspective literallyrefers to a situation were the industry’s innovation activities are dominantly astechnology users, shaped by technology developed by suppliers, describing the industryas playing a somewhat adaptive role to technological developments taking place exteriorto the industry.
These figures demonstrate firstly that there are other, very important sources toinnovation in food industry than suppliers of machinery. Secondly, technological co-operation is most often based on inter-action, not monodirectional flows of goods andideas from suppliers to receivers, suggesting that the food industry is more deliberatelyproduct or process innovating than the domination perspective of Pavitt indicate. In linewith the interactive model of innovation it is rather clear that suppliers of machinerydeliver machinery that stand as a result of both the competence of the suppliers and theneeds of the buyer. A better understanding of the acquisition process is that the process isinteractive, not marked by monodirectional domination. Thirdly, looking back at Figure6, we find that the investment share (i.e. investment in machinery) is only twice the shareof R&D expenditures. Suppliers are in other words not dominantly 'steering' the industry,they are just twice as important innovation expenditures as the second next innovationsource, namely R&D. Fourthly, the share of innovation costs to capital investments infood processing is at the exact level as (in Pavitt’s taxonomy) ‘scale-intensive’ industries(like Metal products and Rubber and plastics). The figure also show that the food industry
40 Cohen, W. M. and D. A. Levinthal (1990); Absorptive Capacity: A New Perspective on Learning andInnovation, Administrative Science Quarterly, 35: 128-152

27
spends relatively lesser shares on capital investments than scale-intensive (and notsupplier-dominated) industries like Metal goods, Graphics and Wood products. Fifthly,the Norwegian ‘science-based’ industries (still according to Pavitt’s taxonomy) onlyspend four percent points more on R&D than a ‘supplier-dominated’ industry like thefood industry (more about R&D in the next section). And lastly, another important inputsource to innovation is market analysis. ‘Food and beverages’ is one of the industriesspending the largest share of innovation expenditures on such analysis. More about thislater.
Research and developmentThe use of R&D in the Norwegian food industry has increased profoundly the lastdecades. After a stable period in the 1970s, R&D expenditures in Norwegian foodcompanies started to rise in the 1980s and 90s (Figure 10). The rise came in two bursts;one in the last half of the eighties and the second in the first half of the nineties. In boththese periods, the total amount of R&D was doubled within few years, followed by a‘down period’. From 1986 to 1989, the amount was doubled from 100 mill NOKs to 200mill NOKs. From 1991 to 1995, the amount was more than doubled, from 175 mill NOKsto almost 400 mill NOKs41. After 1995, the level sunk to pre-1993 level. In 1997, thefood companies spend 282 mill NOKs per year.
Figure 10: R&D expenditures by Norwegian food companies (ISIC 31; Food, Beveragesand Tobacco), 1973 - 1997, in million NOKs (current prices). Source: OECD ANBERDdatabase for R&D expenditures, national currencies, 1999.
R&D expenditures (mill NOKs)
0
5 0
10 0
15 0
2 0 0
2 5 0
3 0 0
3 5 0
4 0 0
4 5 0
19 7 3 19 7 5 19 7 7 19 7 9 19 8 1 19 8 3 19 8 5 19 8 7 19 8 9 19 9 1 19 9 3 19 9 5 19 9 7
The increased use of R&D is in line with international trends (Christensen et al, op.cit.).Figure 11 provides an indexed overview of R&D performed by both Norwegian and
41 The reason for the last rise is partly the Governmental 900 mill NOK aid to structural change, given tothe food industry in the advent of both a possible EU membership and the possibility of increasedliberalisation of international trade markets.

28
OECD food companies42 between 1973 and 93 (1973=100). The OECD figures do notinclude Norway. R&D in OECD-countries has experienced a stabile increase from 1972.The increase has been on about 500 percents in these twenty years, or about 25 percentper year in average. The annual change in Norwegian R&D is more fluctuant. Until 1985,the annual changes were more or less in line with the development in the other OECDcountries. After 1986, the two ‘bursts’ illustrated in Figure 10 make Norway diverge fromthe OECD average.
Figure 11: R&D expenditures index (PPP$, 1972=100) for Norwegian food companies,compared to OECD average, 1973 to 1993. ISIC 31 (Food, Beverages and Tobacco).Source: OECD ANBERD database,1999.
0
200
400
600
800
1000
1200
1973 1975 1977 1979 1981 1983 1985 1987 1989 1991 1993
OECD excl. Norway
Norway
R&D investments by food companies is - compared to other industries - rather low.Holding total R&D expenditures against the immense size of the industry, we findimmediately low ratios. R&D share of sales is for Norwegian food processing companies0,316 percent43, which clearly makes it a ‘low-tech’ industry. The R&D level is less thanone third of the share ‘needed’ to label the industry ‘medium-tech’, according to theOECD classification. Similar results appear if we compare R&D expenditures by industryemployment: While the food industry represent about 20 percent of manufacturingemployment, the share of manufacturing industries’ R&D is only about 3 percent (Table7). The industry’s share of R&D man-years is also much lower than the share ofindustrial employment.
42 ISIC 31; Food, beverages and tobacco43 R&D total 1997: 282 million NOKs. Total turnover 1997: 89.194 million NOKs (Source: NIFU 1999op.cit.).

29
Table 7: R&D financed by food companies. Source: Norges forskningsråd (1999), Detnorske Forsknings- og Innovasjonssystemet, Norges Forskningsråd, Oslo. Table A-6-10.Only companies with 50 or more employees.
Employ-ment
Units withR&D (%)
R&D man-years
InternalR&D44
ExternalR&D
Internal toext. ratio
Food industry 55.113 30 186 126,5 45,5 2,78
All mfg industries 288.242 42 4978 3900,5 1696,2 2,30
Food share of mfg 19,1 % - 3,7 % 3,2 % 2,7 % -
In such a comparison, it looks like if the industry spends few resources on R&D. This is,however, to say it at least, a statement that need some modification. First of all, the foodindustry has other, important ways to innovate, like acquisition of machinery and utilisingmarked knowledge (as we shall see).
Secondly, the size of the industry make the R&D activities undertaken or financed in sumvery large. An illustrating example is the fact that the food industry spent in 1997 asmuch as 282 million NOKs on R&D45, which is three times higher than total NorwegianR&D expenditures in the ICT industry46.
Thirdly, there is also a broad array of domestic non-industry financed research on foodgoing on. Most of this research is basic research aimed at developing or monitoring rawmaterials, like Jordforsk, Planteforsk, Havforskningsinstituttet and LandbruketsForsøksringer. However, twelve of the fifteen institutes report they perform someindustry-financed research. The total number of research man-years performed is at least1.000, most probably around 1.400.
Two important non-industry sources of finance are Norwegian Research Council andMinistry of Agriculture. However, a very important feature of the food research systemare financial means distributed by Omsetningsrådet. Omsetningsrådet (the sales council)receives, as mentioned before, financial means from a small tax on sales of Norwegianagroproducts. Some of these means are used to finance information offices on meat andvegetables, and some of the means fund the research institute sector serving the agrofoodcluster. In the Table, we see that particularly Landbrukets Forsøksringer, MATFORSK,Norconserv and Mat og Miljøanalyse report these finacial sources as important.
We have seen that Norwegian R&D expenditures in food companies have risen markablythe last decade or so, and -more interestingly – steeper than OECD average. Does thismean that industry-financed R&D expenditures are higher than other OECD countries? Itdepends of course on how we measure R&D-expenditures. Table 8 provides an overview
44 Million NOKs45 Source: NIFU (ed.), (1999), Det norske Forsknings- og Innovasjonssystemet, Norges Forskningsråd,Oslo. Table A-6-10, and OECD Anberd 1999.46 Manufactuyring of office machinery and computers (Nace 30) spent about 90 million NOKs on R&D in1997 (NIFU ibid.).

30
of R&D expenditures as share of food industry gross product in ten OECD countries in1993. The Norwegian share is 1,4 percent. Norway’s share is lesser than the shares ofFinland and Netherlands only, with respectively 2,1 and 2,6 percent. For the othercountries, like Canada (0,5 percent), France (1,0 percent), Sweden (1,5 percent) and USA(1,1 percent), Norwegian food industry has a similar or substantially higher R&D share.Using other measures will give other results. Figures from 1993 indicate that food-company financed R&D as share of turnover is lesser in Norway than in most otherOECD-countries47.
Table 8: Industry-financed R&D expenditures as share of gross product in the foodindustry in ten OECD countries, 1993. NACE 15+16. Source: NIFU (1999), op.cit.
Country Canada Denmark Finland France Japan Netherlands Norway Gr. Britain Sweden USA
R&D as share ofgross product (%)
0,5 1,2 2,1 1 1,8 2,6 1,4 1 1,5 1,1
Most industry-financed R&D is performed by large companies. Sixty percent of totalR&D expenditures in the industry is financed by companies with 50 employees or more.Compared to the national average of 90 percent48, this is still a very low share. Small foodcompanies represent in other words a much higher share of R&D expenditures than whatwe find in most other industries. The major bulk of research is performed in-house(Figure 12). Two thirds of large company financed research, and 50 percent of smallcompany financed R&D, are performed in-house, adding to a total of 2/3 of all R&Dexpenditures. About 1/3 is acquired externally.
Figure 12: R&D expenditures 1997, by company size and performing unit. Total = 282million NOKs. Source: Norges forskningsråd 1999: Det norske Forskningssystemet -statistikk og indikatorer 1999, Norges Forskningsråd, Oslo
Own R&D (+50 empl.)45 %
Acquired R&D (1-49 empl.)
16 %
Acquired R&D (50+ empl.)
16 %
Own (1-49 empl.)23 %
47 STEP Group (1995)48 Total R&D expenditure by mfg industries was 8.905 NOKs whereof 927 mill NOKs financed bycompanies with less than 50 employees.
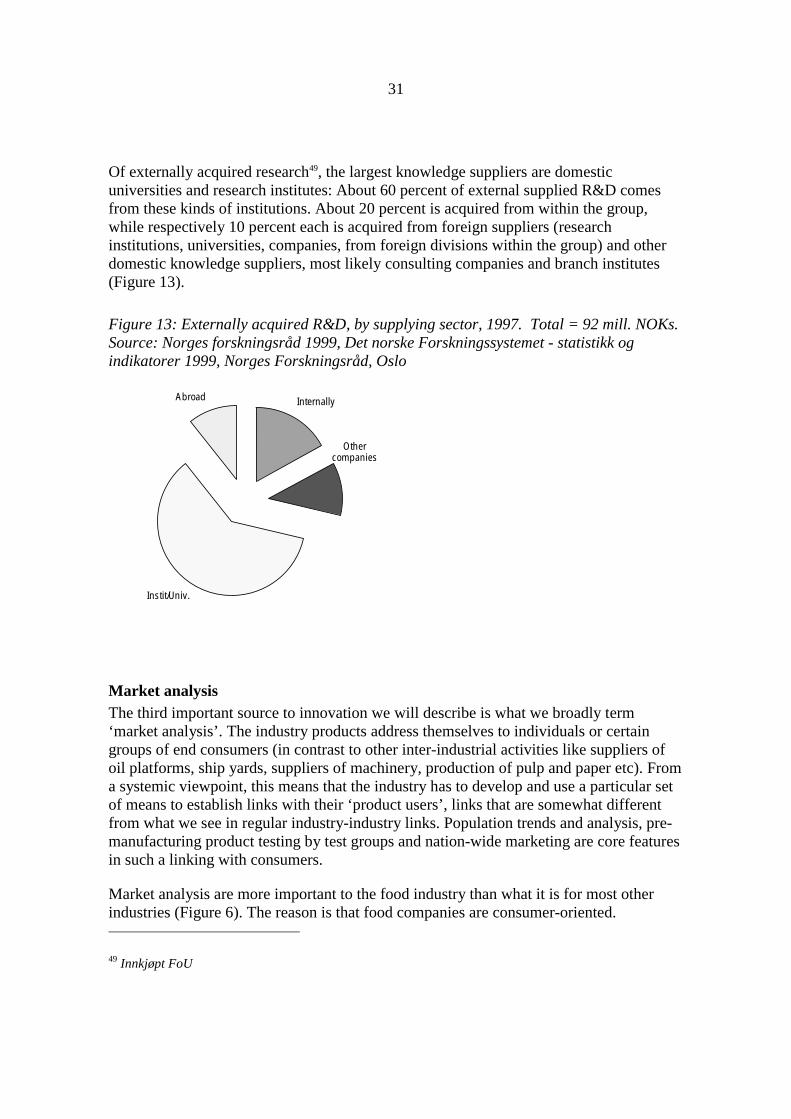
31
Of externally acquired research49, the largest knowledge suppliers are domesticuniversities and research institutes: About 60 percent of external supplied R&D comesfrom these kinds of institutions. About 20 percent is acquired from within the group,while respectively 10 percent each is acquired from foreign suppliers (researchinstitutions, universities, companies, from foreign divisions within the group) and otherdomestic knowledge suppliers, most likely consulting companies and branch institutes(Figure 13).
Figure 13: Externally acquired R&D, by supplying sector, 1997. Total = 92 mill. NOKs.Source: Norges forskningsråd 1999, Det norske Forskningssystemet - statistikk ogindikatorer 1999, Norges Forskningsråd, Oslo
Instit/Univ.
Abroad Internally
Other companies
Market analysisThe third important source to innovation we will describe is what we broadly term‘market analysis’. The industry products address themselves to individuals or certaingroups of end consumers (in contrast to other inter-industrial activities like suppliers ofoil platforms, ship yards, suppliers of machinery, production of pulp and paper etc). Froma systemic viewpoint, this means that the industry has to develop and use a particular setof means to establish links with their ‘product users’, links that are somewhat differentfrom what we see in regular industry-industry links. Population trends and analysis, pre-manufacturing product testing by test groups and nation-wide marketing are core featuresin such a linking with consumers.
Market analysis are more important to the food industry than what it is for most otherindustries (Figure 6). The reason is that food companies are consumer-oriented.
49 Innkjøpt FoU

32
According to the Christensen et al., the main driving force in food industrial innovation isnot suppliers of machinery, but increasingly the market: Customers needs and consumertrends are heavy influential to the product portfolio in the food industry, and hence inwhich way innovation takes: ”(T)he ‘supplier-dominated’ label is no longer adequate.Firms in this industry assess product innovation as being as important as processinnovations in their goal of innovation, and see market developments as more importantthan either. Clients and customers - not suppliers - are regarded as the most importantsingle source of information leading to innovation.”50
In other words, we must understand the dynamic of the industry not only as a user oftechnology, in the Pavittian way, but also as a responsive and market consciousmanufacturer, in which the food industry is a thorough listener to input signals frommarket patterns, tastes, changes in consumption, new sociological and economicalsettings etc. The food industry is demand-driven, and knowledge-input about markets andtrends are central elements in the inter-active innovation model of the food industry.
A typical example is Nestlé AS, a major producer of baby food. The Swiss company hasa Norwegian head office in Oslo, and the market director reports that in order to keep anoverview of potential markets for baby food, they keep constantly a close eye atNorwegian birth rates. Although Nestlé produces most of their products in Switzerland51,like coffee and Lion, the market director states ‘we are the local eyes and ears for thecorporation’. Nestlé also procures market analysis from external market analysts, like 4Fakta/MMI and AC Nielsen.
A similar use of external knowledge providers is reported from TINE Norske Meierier.TINE's latest and biggest product innovation was introducing Ox, a milk-based drink in afancy, magazine-inspired wrapping (including news text, brief information, colourfulpictures, cool design) and with unusual tastes (like milk with liquorice taste), aimed atadolescents. TINE’s field work was impressive. Both TINE’s market division andresearch division were involved in developing the different tastes and visual shaping ofthe product. People from the public relation company Bates Group was hired in todevelop the basic design of the container. A separate web site was established for theproduct (http://www.ox.no). The container magazine was regularly changed by anexternal editor company. The trend consulting company Magic Hat supplied TINE withtrend analysis, and external consultancies performed youth panel tests and analyses.
Market surveillance and trend analysis can therefor be important knowledge input to theindustry. From Figure 6, we see that expenditures on ‘market analysis’ is about fourpercent of total innovation costs. This is not only larger than most inter-industrialindustries, it is also higher than other consumer-oriented industries like chemicals (inwhich pharmaceuticals is incorporated) and consumer electronics.
50 Christensen, op.cit.51 Nestlé is also a dominant manufacturer of baby food. Nestlé baby food for Norwegian markets isproduced domestically (Hamar), according to current regulation for such production.
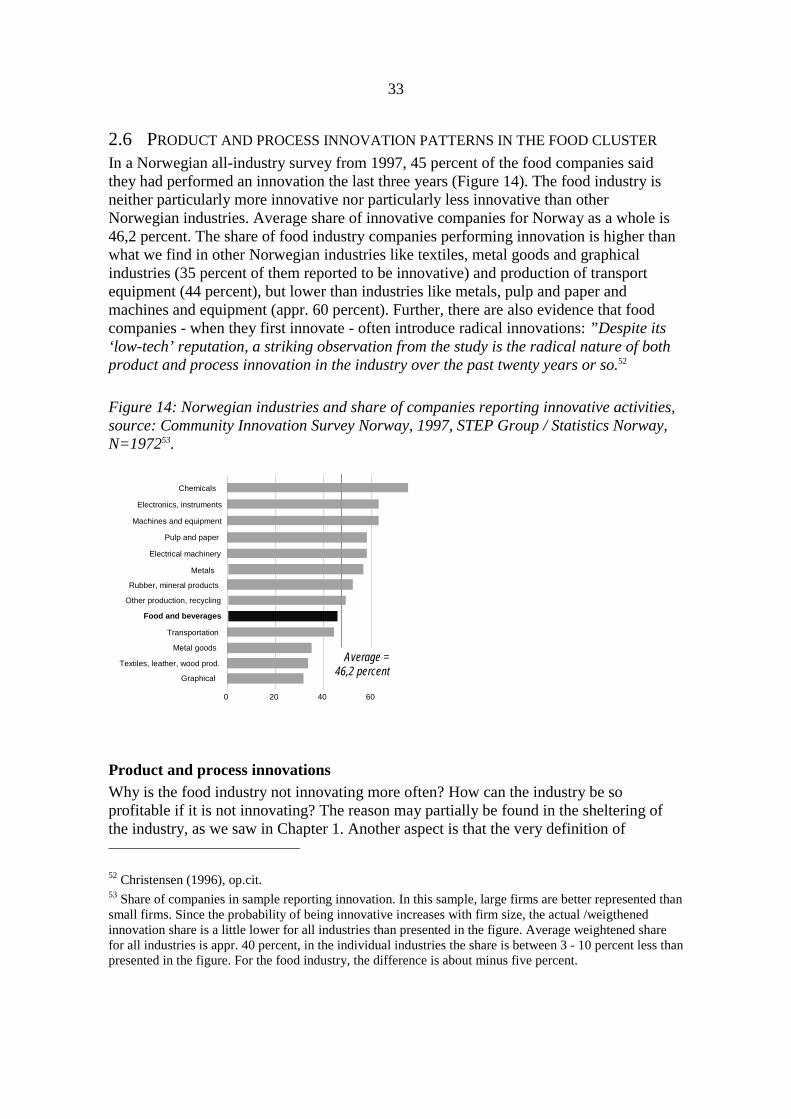
33
2.6 PRODUCT AND PROCESS INNOVATION PATTERNS IN THE FOOD CLUSTER
In a Norwegian all-industry survey from 1997, 45 percent of the food companies saidthey had performed an innovation the last three years (Figure 14). The food industry isneither particularly more innovative nor particularly less innovative than otherNorwegian industries. Average share of innovative companies for Norway as a whole is46,2 percent. The share of food industry companies performing innovation is higher thanwhat we find in other Norwegian industries like textiles, metal goods and graphicalindustries (35 percent of them reported to be innovative) and production of transportequipment (44 percent), but lower than industries like metals, pulp and paper andmachines and equipment (appr. 60 percent). Further, there are also evidence that foodcompanies - when they first innovate - often introduce radical innovations: ”Despite its‘low-tech’ reputation, a striking observation from the study is the radical nature of bothproduct and process innovation in the industry over the past twenty years or so.52
Figure 14: Norwegian industries and share of companies reporting innovative activities,source: Community Innovation Survey Norway, 1997, STEP Group / Statistics Norway,N=197253.
0 20 40 60
Graphical
Textiles, leather, wood prod.
Metal goods
Transportation
Food and beverages
Other production, recycling
Rubber, mineral products
Metals
Electrical machinery
Pulp and paper
Machines and equipment
Electronics, instruments
Chemicals
Average =46,2 percent
Product and process innovationsWhy is the food industry not innovating more often? How can the industry be soprofitable if it is not innovating? The reason may partially be found in the sheltering ofthe industry, as we saw in Chapter 1. Another aspect is that the very definition of
52 Christensen (1996), op.cit.53 Share of companies in sample reporting innovation. In this sample, large firms are better represented thansmall firms. Since the probability of being innovative increases with firm size, the actual /weigthenedinnovation share is a little lower for all industries than presented in the figure. Average weightened sharefor all industries is appr. 40 percent, in the individual industries the share is between 3 - 10 percent less thanpresented in the figure. For the food industry, the difference is about minus five percent.

34
innovation in the Innovation survey is too narrow. A typical categorisation of innovationin ‘typical’ industries are ‘product’ and ‘process innovations’, or ‘organisationalchanges’. Such innovations do of course also take place in the food industry, and they areoften important. We have briefly mentioned TINE’s immense work behind the launchingof a new milk-based drink as an example of how a new product develops.
In a more broader perspective, a trend in product development is the increased emphasison prepared meals54. The basic reason behind this development is competition fromrestaurants, which are large and increasing processors of raw materials (see Figure 1).People spend generally more time at restaurants than before, as a result of a combinationof increased welfare, less spare time and increasingly continental eating habits. Fjordlandis a typical company illustrating this point. Fjordland was established as a co-operationbetween TINE, Gilde/Norsk Kjøtt, Prior and Hoff in 1994, and has today 50 employeesand an annual turnover on 335 million NOKs55. Fjordland produces prepared meals likeFjordland Biff Stroganoff with rice, Meatballs with mashed peas and potatoes and IndianCarry Chicken with rice. The four owners have traditionally been producers of separateproducts, like milk and milk products (TINE), meat products (Norsk Kjøtt), eggs (Prior)and fried potatoes (Hoff); together they are capable of producing products that are in linewith recent consumption trends.
A change of process would typically be to implement new machinery, like the recentactivities at the Ringnes Gjelleråsen brewery. Production of soft drinks has beenprofoundly automated the last decade, with German mechanical machines and Japaneserobots gradually taking over manual tasks, like lifting, loading, moving and storing loadsof bottles. The storage room at Ringnes is immense, including several hundred 13 meterhigh shelves filled with a seemingly chaotic mixture of empty bottles ready for cleaningand refill, and loads ready to leave the factory. The storage room is completelyautomated, and a computer keeps perfect track of which are tour and which are returnbottles, and at the same time making sure that the right kind of bottles is brought from theshelves and put at the right conveyor belt; either leading to the cleaning machines or toone of the 20 truck ramps further down the hall. What was earlier performed by 15factory floor truck drivers is now run by one computer an two controllers.
Product and process innovations in the food industry are often interdependent activities.The CIS Survey (1997) showed that Norwegian food companies rarely performed productinnovations without performing process innovation at the same time. The dominant shareof innovating companies reported that they had performed both process and productinnovation the last three years. Very few companies reported that they had performedproduct innovation only. This could indicate that when food companies start producing anew product, they predominantly have to undertake major investments in equipment andmachinery. It could also indicate that when food companies perform product innovation,the innovations are rather radical and need a whole new set-up of the production line.This perspective is also argued for in Christensen at al (1996), stating that the food
54 Christensen at al, op.cit.55 Fjordland homepages (www.fjordland.no), dec. 1999.

35
industry has particularly been strong in introducing radical innovations the last twodecades. There are in other words a seemingly strong complimentarity between productand process innovation in the food industry – much stronger than in other industries.
A central process innovation the last decades has been the profound improvements andchanges in transport56. The changes has taken three forms. Firstly, there has been gradualimprovements in trucks and cooling systems, which have increased the potential forextending the transport routes for food - or a toning down of space, if you like. Secondly,there has been a development in logistics activities. This change has taken two forms;there has been an increased division of labor between the people in charge of logistics onthe one hand and the truck drivers on the other, and - related to this - an increasedprofessionalisation of the logistics people and the technology they use, in the shape ofsatelite based control systems which are opening up for more economic flow of goods57.The third development has been the retail chains gradually taking over transport servicesthrough their vertical integration with wholesale (more about this in 2.4).
Formal and informal innovationsProduct developments range from extremely informal to very formal. The differencebetween formal and informal seems to vary with company size. Large companies, boththe corporate controlled and the companies belonging to a co-operative structure, tend toformalise product development through use of market divisions, research divisions,external and internal market analysts and external research suppliers. The abovementioned case of TINE’s Ox drink illustrates the formal way of developing newproducts. In the process, TINE involved their market division and research division, inaddition to external knowledge suppliers like trend analysts and web designers. This is anindication not only of a formalisation of the innovation process, it is also a sign of ahighly professionalised innovation process. The same applies for product development inMaarud, a major snack provider, owned by Freia / Kraft General Foods. When Maaruddevelops new products, it is in close co-operation with their Nordic sister companies ofthe food innovation process, using test and development laboratories and staff, sometimesinvolving several hundred variations of product taste to find the right one. In Ringnes,product development takes place in the company’s product development department inGjelleråsen, involving a range of persons, mainly chemists and market analysts. Productdevelopment in Fjordland, owned by large co-operatives, is taking place in the ownersR&D laboratories, in addition to co-operation with market agencies and scientificknowledge suppliers like Matforsk and Norconserv58.
At the other end of the scale, we find small companies with rather informal innovationprocesses. Majonæsfabrikken is an artisan factory with 14 employees, located at the heartof Oslo, producing mostly private-label, high quality majonese salads for the
56 Ørstavik, F. (1998), Innovation regimes and trajectories in goods transport, STEP-report R-09-1998,STEP Group, Oslo57 Ibid,p.58 Fjordland homepages, op.cit.

36
supermarkets in Oslo and the surrounding region. Both father and son works inproduction. The company often develop new products by copying competitors salads; ifthey see a new type of salad from the competitors (like Denja or Mills) in the groceryshop, they buy it, determine the ingredients by smelling and tasting the salad, and decidewhether ‘to go for it or not’ based on how they find the product.
Branding and consumer trustInterpreting ‘innovation’ as a major effort to increase or maintain profits, innovation infood companies separates from innovations undertaken in other industries. The basicdifference in between food industry and other industries is that innovation may very oftenbe to keep a product exactly the way it is, focussing on maintaining or increasing theproduct’s market share by familiarising the product to consumers. Familiarising productsin order to develop stable customer-industry relations is a business developing methodtermed ‘branding’. The basic idea behind branding is that customers will be more apt toconsume products they already trust, products they know (or think they know) or at leasthave heard of. Branding is mostly done through regular commercials (television, radios,journals, newspapers), but also through distributing product samples (like smallattachments to journals or newspapers) or by sponsoring activities, like sporting activitiesor music concerts. The emphasis on branding is illustrated from what followed in thewake of the above mentioned Ox drink developed by TINE. The product ultimatelyturned out to be a failure. In spite of TINE spending million of Norwegian kroners onproduct development and market analysis, the adolescents did not buy the products.TINE's response to this is to pursue a strategy of continuing building up the brand nameof their most famous cheese product, Norvegia. This cheese is one of the most sellingcheeses in Norway, and also one of the most sold foreign cheeses in the US.
We find branding in most consumer-oriented industries, not only the food industry.Typical examples are Swatch watches, Bosch car batteries and window wipers, Hundaicars and Nokia mobile telephones. However, branding is more important to the foodindustry than most other industries. Not necessarily because the threshold of trying newproducts are higher per se for food products than for other consumer goods (we know thatthe share of Norwegians eating ‘non-traditional dinner’ are slightly decreasing59), butbecause eating and drinking is a process of putting manufactured items into in yourmouth and swallow it; eating is ultimately a very private and bodily event. This requires ahigh degree of consumer trust in the products or the producing company. Branding is away of creating this trust. Branding takes place by for example attaching short, simpleand positive messages to product names (‘probably the best beer in the world’[Carlsberg], ‘Guinness is good for you’), or using happy and satisfied people eating ordrinking the product (like for examples in the jolly commercials for Lipton’s Sun Tea orfor Coca Cola Company products more generally)60.
59 Stræte (op.cit.)60 This sterotypic mode of publiction has been brilliantly ironised in a series of commericals for Solo, atraditional Norwegian orange-based soft drink manufactured by both Ringnes and Hansa. The spot’s show

37
International food brands are particularly important for beverages, like Carlsberg,Heineken, Tuborg, Coca Cola and Nestlé. In Norway, there exist a wide array of brandnames that most people would recognise. These brands can analytically be divided intwo; product brands, like Farris (Ringnes’ sparkling mineral water), M (Freia’s chocolate)and Grandiosa (Stabburet’s Pizza), and portfolio brands / company brands, like Freia,Nora (jams and juices produced in Norway by Stabburet), Eldorado (a wide array ofimported canned fruits and vegetables, in addition to juices, soft drinks and jamsproduced in Norway), Gilde (Norsk Kjøtt’s meat products) and TINE (milk and a widearray of butter and cheeses). Several of these names, like TINE, Gilde and Eldorado, areall relatively new names, established as pure marketing brands for companies that goback a long time. TINE61, for example, is the marketing name for what used to be calledNorske Meierier, Gilde is the marketing name for meat products from companiesorganised as Norsk Kjøtt, and Eldorado is NorgesGruppen’s private label.
Barriers to innovationQuantitative industry-studies of barriers of innovation are important to understand howthe industry innovates, and which factors companies consider as important hamperingfactors to renewal and innovation. In an all-industry survey from 1997, Norwegiancompanies were asked to respond if any of nine given factors ever had been a hamperingfactor to innovation activities during 1994 to 1997.
Food companies separated from most other industries by emphasising organisationalrelations, lack of market information, too strict standards and regulations and marketfailure for new products and processes62 as factors being important barriers to innovation.The industry did not separate markably from other industries in factors like lack ofqualified personell, lack of technological information or too high innovation costs.
This picture harmonises with what we have seen so far. The food industry is dominatedby large, traditional companies, as seen in 2.2. Large companies are often marked byembedded organisational resistance to change, and according to the survey, it seems thatthe food companies are more resistant to change than companies in other industries. Inthe survey, public regulations on how food production can be undertaken is also oftenregarded as an active barrier to innovation. The very fact that food production is aconsumer-oriented industry is also reflected in the market’s failure to accept innovativeproducts barrier for new products and processes. The very fact that market failure is aprofound resistance to innovation in the food industry is in itself an interestingobservation, as it underlines our suggested interpretation of the food industry as adynamic industry, but that the problem is more that new products have trouble in findingnew markets fast enough, either in the population or among retail chains.
different people in unhappy or uncomfortable situations (for example a boy sadly waiting in vain for hisdate), drinking Solo, with the slogan ‘probably the only soft drink that does nothing but satisfy your thirst’61 [tee:ne]62 Nås et al (1999), Innovasjon i norsk næringsliv, STEP report R-04-99 ???
38
Conclusion: A new concept of innovation?Innovation, narrowly understood as new processes or new products, can sometimes forma relevant concept of how to understand renewal in the food cluster. However, in aperspective where innovation is understood as major effort to maintain or increaseprofitability63, new products and processes becomes inferior to more profound processesthat are not thorougly captured by regular innovation concepts - not to say regularinnovation surveys. Such activities include for example long-term processes of increasedscientification, long-time improvement in transport technology and logistics,development of industrial hegemonies, maintained protection from import throughpolitical influence, branding and the profound changes in vertical and horisontal alliancesundertaken in the food cluster. These are all changes that seems vital to the system’s sperformance, and represents activities that are performed to maintain or increaseprofitability.
The simple, but still important, conclusion from broadening the innovation definition isthat a low-tech industry with low share of R&D expenditures compared to otherindustries, may still be quite innovative and dynamic, and even high-tech. Only in termsof advanced knowledge, we have demonstrated that i) the food industry is an advancedproquirer of market intelligence, ii) the industry may draw upon knowlege from a vastbackbone of basic research institutions, iii) advanced technology is imported to theindustry through suppliers of machinery, iv) branding is for the food industry a seeminglymuch more intelligible way of ’product innovation’ than constantly introducing newproducts, and that v) changes in vertical and horizontal alignments in the cluster areimportant dynamic activities (see also J. Hauknes, Innovation – A need for new concepts?prepared for the NIS network and innovative firms focus group)
2.7 SUMMARY
The food cluster plays a major economic role in the Norwegian economy, in terms ofshare of manufacturing value added and regional employment. The cluster consists ofthree more or less independent value chains; manufacturing of beverages, manufacturingof agrofood products and manufacturing of fish products. Particularly the agrofood andthe fish production value chains are two independent, and geographically andinstitutionally segregated production systems. However, within the individual chainsthere are tight relations between the units, particularly within the agrofood part of thecluster. Horizontal integration between suppliers of raw material (like milk and grain),vertical integration between producers of raw materials and manufacturers (TINE,Felleskjøpet) and ‘extra-horizontal’ alignment between the agrobased co-operatives (likethe joint distribution system LFD, the joint ownership of machinery supplier Landteknikkand the joint ownership of producer of prepared meals Fjordland).
• Ownership is professionalised. The increasing share of employees working in largecompanies are working in companies owned by investor-groups or joining
63 Hauknes (1999), Innovation in Norwegian service firms, STEP Report forthcoming

39
horizontally integrated co-operatives with co-ordinated, centralised marketing, sales,distribution and research and development activities. The innovation process isformalised in the largest companies, in areas like market monitoring, branding andresearch and development. External R&D is often acquired from research institutesand universities. The industry is increasingly consumer-oriented, and privatecompanies provide food companies with market analysis and trend patterns.
• There is a well-defined geographical division of labour among different parts of theindividual food companies. Production is often regionalised, and localised near rawmaterial sources (like for agrofood processing and fish processing) or located in thebiggest towns (like for mineral water and chocolate). Marketing, sales and R&D areactivities predominantly located in the capital area.
• Many SMEs perform research and development compared to industrial average. Theindustry has collectively a high R&D/gross product compared to the food industry inother countries industries.
• The industry is profitable; it has the fifth highest levels of value added per employeein Norway. The food industry shows an extensive use of advanced technologydeveloped by other industries. Product quality control is highly institutionalised, andgo long back in time.
The system is under change. During the presentation of the food cluster we have pointedto these changes:
• There is a process if increased scientification of the food process going on. Foodcompanies have spent an increasing amount of money on R&D the last two decades.Scientification processes also enter the industry indirectly through acquisition ofequipment and machinery, and through use of new additives64.
• Still fairly sheltered, the Norwegian food industry are awaiting processes ofharmonisation and liberalisation of international trade. Still, ongoing processes of de-monopolisation take place, particularly in manufacturing of fish products, grain anddairy products.
• Increased employment in the largest establishments - establishments persistentlyowned by corporations or joining domestic co-operatives - suggesting tendencies ofhegemonies building, which again is associated with professionalisation ofproduction, marketing and branding processes.
• Increase in professionalisation and organisation among stores through chain powers,counterforcing the hegemony process among manufacturers of food products.
64 Christensen op.cit.

40
• Ongoing processes of vertical and horizontal restructuring; changes in producer-supplier links, producer-producer links, producer-chain links, producer-consumerlinks and chain-chain links.
• Ongoing internationalisation processes, both in the retail chain groups and in theindustry
We will in turn discuss these points with respect to how they may affect innovationpatterns in the industry.

41
3 HOW CHANGES IN THE INDUSTRY MAY AFFECT INNOVATIONPROCESSES
3.1 INTRODUCTION
In this chapter we attempt to interpret trends of change in a broader framework, providingan analysis of innovation in the Norwegian food cluster. These are increasedscientification, international harmonisation and liberalisation, hegemonisation,increased chain group powers, vertical and horisontal restructuring andinternationalisation. The processes are sometimes intervowen and mutually dependent.
3.2 CHANGE AND INNOVATION
R&D, competitiveness and innovationA trend in among food companies have been a growth in R&D expenditures the lastdecades. Even though some of the increase has clearly propelled by the ‘structural changefund’ granted in the first half of the 90s, the increase is in line with a similar Europeantrend. Increased scientification, both directly through increased R&D expenditure incompanies and indirectly through purchase of equipment and machinery, is marking thefood industry.
In Norway, the industry-financed R&D can be interpreted as a demonstration to whichdegree the existing knowledge and research infrastructure is adapted to the needs of thefood industry. In the last years, particularly Matforsk - a central knowledge provider tothe food industry (see for example 0) - has gradually increased it's share of industryfinanced research the last years. Still, industry financed R&D only represent only 186 ofabout 1.600 food-related researcher man-years - or about 11 percent.
A central question is to which extent the increased R&D level is interesting, not to saydeterminant, to the industry’s further development? The increase in R&D expenditurescan be interpreted as a preparation process to increased exposure to internationalcompetition, as was the intention behind the 1994 structural fund. According to MichaelPorter, R&D can initially be regarded as a higher-order competitive advantage; anadvantage achieved through using advanced skills and capabilities (Porter 1990, p 50).Porter argues a cluster’s competitive advantages are more difficult to nullify the higherorder they are, and the better they are constantly improved or upgraded (ibid. p. 51). Theincreased R&D level the last years may indicate an attempt of building of such acompetitive advantage. This way of thinking has gained terrain among policy-makers,which in 1994 granted the 900 millioner NOK structural fund to prepare the food industryfor EU membership.
However, the problematic issue with R&D in the Norwegian food industry is twofold:firstly that newly developed products are easy to copy for other producers. Tastes, colors,wrapping, design or packaging methods are visible and easy reckogniseable factors; aswe saw in the case of Majonæsfabrikken. The competitors’ new majonese salads are

42
bought and ‘investigated’ on quite informal basis; the ingredients are detected throughsniffing and tasting, and the manager decides whether to start producing the salad or not.The same goes for indirect R&D, where new process equipment is also easy copiable. InNorway, production machinery is often aqcuired through market relations withwholesailers, and new production technology is easily accessible for most foodproducers.
Secondly, R&D activities successfully leading to new products are not always guaranteedsuccessful sales, as we saw in the case of TINEs launch of their Ox drink. The treshold ofestablishing markets for new food products can sometimes be quite high, for reasons oflack of consumer trust, existing traditions etc. In sum, this leads us to conclude that R&Dnot always represent a higher-order advantage in the food cluster. On the contrary, R&Dactivities carry many of the same signs of reckognitions Porter uses to describe lower-order competitive advantages; those factors that are easy to imitate. (ibid. p. 49).
The very definition of higher order advantages are those factors that are difficult to copyand usually depend on a history of sustained and cumulative investment. In the foodindustry, there is nothing that fit this definition as much as branding. Product or companynames that are build up through historical marketing processes represent advantages thatare very difficult to copy. The picture becomes more complex if we - in a broader context- understand the food industry R&D investments as mere processes of branding, not somuch aimed at product or process development in itself. There are two reasons forinterpreting R&D activities as being less vital to product development than branding:Firstly, new products seemingly arise in collaboration with machinery suppliers, assuccessful introduction of new products very often go hand in hand with implementationof new machinery, as we saw in chapter 2. For food companies, there are no naturaldivision between product innovation and process innovation. One thing is that this resultleads us to think in the direction of suppliers of machinery and equipment being ratherinfluential to how and which new food products emerges. However, the direction, amountand blend of knowledge involved from the machinery suppliers and food companies insuch developments are discussable. Is it so that the knowledge flow direction ismonodirectional, from supplier to purchaser? We think not; it is more likely aninteractive process between the two. As we for example have illustrated - in Figure 8 andFigure 9 - that food companies very often establish technological co-operation withsuppliers of machinery.
Secondly, a survey of the Norwegian food companies’ strategic preferences - performedin relation to the establising of the structural funds - revealed that mere productdevelopment ranges very low, compared to other factors as quality, hygiene and customerrelation65. In the survey, food companies collectively reported ‘strong brand names’ as thetenth most important factor of 24, while ‘ensuring quality on processed products’,‘quality and hygiene in production’ and ‘relation to customers’ were the three mostimportant factors. Developing radically new products was ranked as the 23. most
65 ECON/Coopers and Lybrand (1997), Evaluering av omstillingstiltakene for den landbruksbasertenæringsmiddelindustrien, Sluttrapport fase 2, ECON, Oslo, p. 25

43
important strategy, developing existing products was ranked as the 20. This suggests thatwe have to understand branding in the food industry in a much broader way than justtraditional building of product names or trade marks. In this approach, we must alsoinclude long-term, strategic developments of factors that customers appreciate, like foodquality and hygiene.
The increased R&D is also interesting to interprete in a user-producer perspective, wherethe grocery chains stands as the users and the food producers are producers. The grocerychains dominate - and make a living out of - markets for food products. It is still mostlythe industry that carries the product development expences. This ‘free rider’ system issimilar to what we find in German car production, where car manufacturers puts mostemphasis on putting devlopment pressure downwards in the system, forcing theirsuppliers to product innovate in order to maintain contracts.
Corporations, hegemonies and competitionWithin evolutionary economic theory there exist two competing 'grand theories' oneconomic development, innovation and production structures. On the one hand there arethose that claim that the economy is in a profound change from mass production toflexibel specialisation (a second industrial divide), characterised by increased verticaldisintegration, decentralisation of control and development of new, flexible modes ofproduction and organisation66. In line with this argument, it follows that large, verticallyintegrated companies producing standardised mass products gradually will beoutcompeted by small, flexible and specialised companies in informal networksproducing differensiated and customer adapted products for a fragmented market. Othersare more careful in their conclusions. Leborgne and Lipietz claim that we are in atransition periode that includes both change and continuity, and that mass production willbe modified through process and product changes based on new technology. According toL&L, new technology allows vertical disintegration, but does not imply a necessarydeconstruction of power.
We have shown that a larger share of employment is increasingly found in the largestcompanies. Employment share within the group of establishments with more than 100employees increased from 40 to 44 percent. At the same time, the small companies aregetting smaller: While the total number of small companies is stable, the number ofpeople working in these establishments has decreased. In 1986, 41 percent worked inestablishments with less than 50 employees. Today, the share is 38 percent. These sharesrepresent a decrease of about 3.000 persons in 1.800 small companies, or about twopersons in each company. There are in other words no immediate reason to believe thatNorwegian food production approaches a more flexible food production structure, at leastnot if one judge by the size of the companies alone.
However, there are contradictory trends appearing. Traces of increased flexibility appearsat least in three forms. Firstly through the high share of R&D financed by small food
66 See for example Piore and Sabel 1984, Scott and Storper 1989

44
companies. R&D, which is commonly associated with something that dominantly largecompanies undertake, is more frequently taking place in small companies. As much as 40percent of the R&D was financed by companies with less than 50 employees, which isfour times higher than national average. Secondly, a countering trend is the graduallyimplementation of new process, transport and logistics technology, which have impliedmore efficient supply systems, possibilities for longer transport routes and better stockcontrol - as we for example saw in the case of Ringnes. A third trend is the dissvolvingprocess of already established monopolies in the agrofood sector, like we have seenthrough the increased competition in the meat sector and through the establishing ofSynnøve-Finden and Gårdsmeieriene.
On a more broader level, there is no clear answer to the discussion whether or to whichdegree company size is related to flexibility or inflexibility. We have seen that barriers-to-innovation reports from companies said that organisational relations were regarded asmajor obstacles in the food industry. As organisational barriers are more likely found inlarger companies, the results indicate that large food companies may be more resistant tochange than other large companies in Norway.
However, there are no necessary one-to-one relation between larger size and reducedinflexibility. We have seen in the case of the Norwegian food industry that largecompanies perform more R&D (as large companies often do), they may have moreorganised transport systems, the large agro-cooperatives have formal integration tosuppliers of machinery and they have in general better financial base and interpretivecapability to purchase and utilise market surveillance information. In line with thisargument, Nooteboom (1999) claims - in line with Rothwell’s ‘dynamic complimentarity’concept - that there are no ideal organisational system for innovation, but that differenttypes of corporate structures are better adapted to some parts of the innovation processthan others. For example, large, vertically integrated companies should theoretically bebetter adapted to those innovations being costly; like in those cases where marketing,R&D and trademarks are important features of the innovation process. Small companiesare typically more adapted to situations of rapid product change and flexibly developingor serving small niche markets. We have shown that there are in general three types offood companies in the Norwegian cluster: the large and vertically integrated agrofoodcompanies, the corporations with varying vertical integration and some horisontalintegration, and thridly the independent, family-owned companies with few vertical norhorisontal linkages. In this respect, the above referred-to statistics suggest that Norwayhas been in a duopole situation, with large companies representing the dynamics ofmarketing and branding, while the small companies represent the role of non-mass, nichemarkets, with rapid development and commercialisation of new products. Severalindicators suggest that the Norwegian food industry is moving towards the Leborgne andLipietz model, where large companies still dominate the market, and that new technologyonly modifies this paradigme. We have for example seen that a larger share ofemployment over time is found in the largest companies, that large companies have(theoretically) better economic potential to exploit new market information and new,flexible technology, i.e. logistics, as in the case of Ringnes. We have seen thatdevelopment of new products are closely related to implementation of new processtechnology, which tend to make product innovation more expensive. And we have seen

45
that companies often report that products meet market failure, which indicates thatdeveloping new products is not always vital to the performance of the industry - withnegative implications for those small companies where product development are central.
Does this mean that policy should appreciate development of larger entities? There arebasically two interrelated main arguments for stimulating growth - or maintaining theexistence - of small companies. The first one is the Piore and Sabel argument of smallcompanies being more flexible and structurally better adapted to new technology, anargument we have shown is only to some degree true in the light of the decicive fooddynamic factors. The second, related argument is that small companies may be importantto create variety and thereby enlarging the platform for further selection67. The graduallyincreasing dominance of large companies in Norwegian food production can thereforeillustrate a trend where variation and selection powers are subordinate to increasedcorporate hegemony. This can again on the one hand be interpreted as a process of lessdomestic competition than before, and implicitly a smaller selection platform.
However, on the background of increased international competition, this may seem as aplausible preparation development, not at least when we know that large entities are oftenbetter adapted to the specificities of innovation in the food industry; branding, trade-marks, development of transport systems etc. On the other hand, to which degree theincreased hegemonisation affects product variety for the consumer is a vexatious task todetermin. In terms of product variety, we know that product development in general areless important for food companies than other companies, which points in the direction ofsaying that product variety may not always be of vital interest to consumers.
For most large companies, new products are also related to high market insecurity, andthey are expensive to develop, as they demand new process technology and highmarketing costs. Innovation for food companies is often, as we have underlined before,aimed at maintaining or increasing sales of existing products instead of developing newproducts. Increased exposure of internationally produced food products may therefor bethe most likely way to create product variety for consumers.
Increased chain group powers and innovationVertical and horizontal integration among the Norwegian retails stores has led chaingroups to control larger parts of the production system than before. For many foodproducers, the increased chain dominance is of course real and experienced asthreatening: Competition from cheaper private labels products, combined with aprofessionalisation of the grocery stores through common marketing, common wholesaleand common acquisition of products and inventories - are issues that make life for thelargest food producers more demanding than before. These new challenges take severalforms:
67 Smith (1991) in J. S. Metcalfe (1994)

46
Threat from private labels: The mere threat from private labels are not overwhelming, sofar. According to a survey by ACNielsen68, only about 7 percent (in 1997) of totalturnover in the chains stem from private label products. Although the share has risen fromless than five percent in 1995, this is much less than what we find in larger, internationalchains like Tesco (UK), where the share of private label products are as high as 65percent69. In addition, production of private labels products is still mainly performeddomestically, by relatively small or medium-sized companies (like in beverages). Privatelabels is represent therefor no threat to the food economy itself, it is more a balancing ofpowers towards Orkla (and partly Coca Cola Company) as the hegemonic supplier ofbeverages in Norway.
Threat from low-price chains with few products: The low-price chains’ market share hasgrown, and represent today very important nodes for food products turnover. The maincritique towards these chains has been that they homogenise and standardise the productarray, making the selection of products less varied. There are little empirical evidencesupporting this perspective. The reason why is that the grocery chains are still diversified.There exist several chains with larger product selections, like Jens Evensen, Mega, Sparetc. It is possible for small companies to gain access in these stores. Majonæsfabrikken,for example, with only 14 employees, distribute their quality majonese to moreindependent chain stores, like ICA and Jens Evensen. In addition, the grocery chains alsoare in demand for new products, as a natural part of the competition between them.Several interviewees have reported that the chains are less conservative than oftenclaimed. Particularly NorgesGruppen - the largest group of the four - is denoted as beingin demand for new products.
A third threat is of course that the chains found a counterbalance to the existingdomination of co-operatives - like Norsk Kjøtt and Tine - and the corporations -particularly Orkla, but also Rieber & Søn. This counterforce manifests in several ways.One way it manifests is that end consumers have indirectly more power towards the foodproducers, as they have more organised negotiators on price than before. Another way isthat chains may to some extent challenge the traditional supply monopoly from theexisting grand organisations. Orkla has for example developed a dominant position inproduction of beverages. Some of Orkla’s remaining competitors (small, familiy-ownedbreweries like Lerum, Telemark Mineralvannfabrikk and Grans) have strengthened theirposition (and possibly survived) in the market by being suppliers of private labelbeverages to the chain groups. However, none of the chains are offering private labelmineral water only. The balance stands on whether Orkla can make the chains dependentupon their own national products through branding or quality. The same applies forNorsk Kjøtt, who has countered increased competition on meat processing through amajor effort to build up and maintain their brand-name Gilde.
68 ACNIelsen is a market monitoring company. The survey is cited in Dulsrud in Stræte and Dulsrud(op.cit.)69 Dulsrud in Stræte and Dulsrud (op.cit.) p. 118
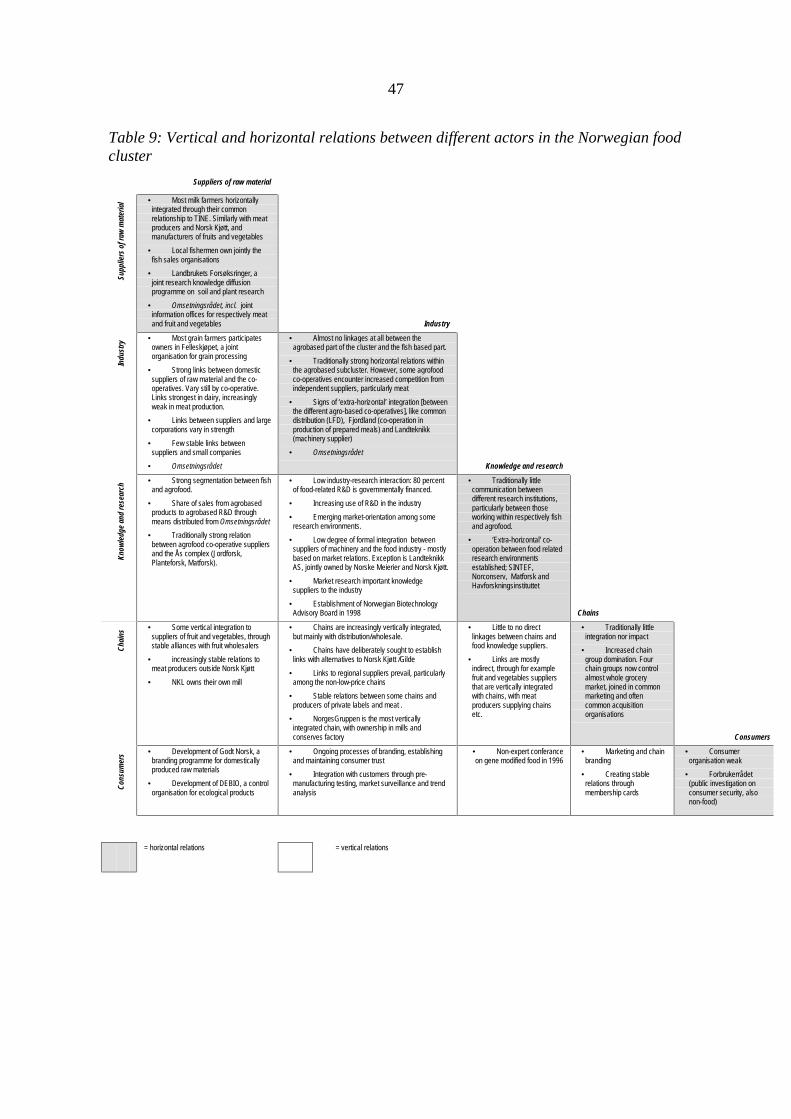
47
Table 9: Vertical and horizontal relations between different actors in the Norwegian foodcluster
Suppliers of raw material
Supp
liers
of r
aw m
ater
ial • Most milk farmers horizontally
integrated through their commonrelationship to TINE. Similarly with meatproducers and Norsk Kjøtt, andmanufacturers of fruits and vegetables
• Local fishermen own jointly thefish sales organisations
• Landbrukets Forsøksringer, ajoint research knowledge diffusionprogramme on soil and plant research
• Omsetningsrådet, incl. jointinformation offices for respectively meatand fruit and vegetables Industry
Indu
stry
• Most grain farmers participatesowners in Felleskjøpet, a jointorganisation for grain processing
• Strong links between domesticsuppliers of raw material and the co-operatives. Vary still by co-operative.Links strongest in dairy, increasinglyweak in meat production.
• Links between suppliers and largecorporations vary in strength
• Few stable links betweensuppliers and small companies
• Omsetningsrådet
• Almost no linkages at all between theagrobased part of the cluster and the fish based part.
• Traditionally strong horizontal relations withinthe agrobased subcluster. However, some agrofoodco-operatives encounter increased competition fromindependent suppliers, particularly meat
• Signs of ‘extra-horizontal’ integration [betweenthe different agro-based co-operatives], like commondistribution (LFD), Fjordland (co-operation inproduction of prepared meals) and Landteknikk(machinery supplier)
• Omsetningsrådet
Knowledge and research
Know
ledg
e an
d re
sear
ch
• Strong segmentation between fishand agrofood.
• Share of sales from agrobasedproducts to agrobased R&D throughmeans distributed from Omsetningsrådet
• Traditionally strong relationbetween agrofood co-operative suppliersand the Ås complex (Jordforsk,Planteforsk, Matforsk).
• Low industry-research interaction: 80 percentof food-related R&D is governmentally financed.
• Increasing use of R&D in the industry
• Emerging market-orientation among someresearch environments.
• Low degree of formal integration betweensuppliers of machinery and the food industry - mostlybased on market relations. Exception is LandteknikkAS, jointly owned by Norske Meierier and Norsk Kjøtt.
• Market research important knowledgesuppliers to the industry
• Establishment of Norwegian BiotechnologyAdvisory Board in 1998
• Traditionally littlecommunication betweendifferent research institutions,particularly between thoseworking within respectively fishand agrofood.
• ‘Extra-horizontal’ co-operation between food relatedresearch environmentsestablished; SINTEF,Norconserv, Matforsk andHavforskningsinstituttet
Chains
Cha
ins • Some vertical integration to
suppliers of fruit and vegetables, throughstable alliances with fruit wholesalers
• increasingly stable relations tomeat producers outside Norsk Kjøtt
• NKL owns their own mill
• Chains are increasingly vertically integrated,but mainly with distribution/wholesale.
• Chains have deliberately sought to establishlinks with alternatives to Norsk Kjøtt /Gilde
• Links to regional suppliers prevail, particularlyamong the non-low-price chains
• Stable relations between some chains andproducers of private labels and meat .
• NorgesGruppen is the most verticallyintegrated chain, with ownership in mills andconserves factory
• Little to no directlinkages between chains andfood knowledge suppliers.
• Links are mostlyindirect, through for examplefruit and vegetables suppliersthat are vertically integratedwith chains, with meatproducers supplying chainsetc.
• Traditionally littleintegration nor impact
• Increased chaingroup domination. Fourchain groups now controlalmost whole grocerymarket, joined in commonmarketing and oftencommon acquisitionorganisations
Consumers
Con
sum
ers • Development of Godt Norsk, a
branding programme for domesticallyproduced raw materials
• Development of DEBIO, a controlorganisation for ecological products
• Ongoing processes of branding, establishingand maintaining consumer trust
• Integration with customers through pre-manufacturing testing, market surveillance and trendanalysis
• Non-expert conferanceon gene modified food in 1996
• Marketing and chainbranding
• Creating stablerelations throughmembership cards
• Consumerorganisation weak
• Forbrukerrådet(public investigation onconsumer security, alsonon-food)
= horizontal relations = vertical relations
48
Restructuring of vertical and horizontal alignmentsHauknes (1998) has pointed out that the food cluster represent an activity with highdegree of intra-relatedness; it is the Norwegian cluster where most trade of intermediategoods take place within the cluster, compared to the other five clusters. These internaltransactions are performed in a profoundly intervowen web of horisontal and verticalrelations. Some of these relations are also changing. We have described these linkages -and how they are slightly changing - throughout the paper. Table 9 is an attempt to sumup the network of vertical and horisontal in the Norwegian food cluster. The grey boxesrepresent horisontal linkages - those linkages between companies or units performing thesame operations or activities. The white boxes represent vertical linkages - linkagesbetween units with different roles along the production line.
Internationalisation, globalisation and ownershipInternational food trade is an activity with deep and historically interdependent relation tosea and land transport technology and to logistics. Food trade is not only based on deephistorical roots, international trade started with food trade. Hobsbawn writes for examplethat International trade…developed primarily as an exchange of raw materials andfoodstuffs70.
Access to foodstuff was among the driving forces behind colonialism. The Economistwrites: Soon after dawn on May 21st 1498, Vasco da Gama and his crew arrived atCalicut after the first direct sea voyage from Europe to Asia. If history’s modern age hasa beginning, this is it. Europe’s ignorance of, and isolation from, the cosmopolitanintellectual and commercial life of Asia were ended forever. With ships, weaponry and awillingness to use them both, the countries of Europe were about to colonise the rest ofthe world. To support this expansion, its merchant classes would invent new forms ofcommercial credit and the first great corporations, vital parts of capitalism’s operatingsystem, and spread their trading networks across the seven seas. And what did the menshout as they came ashore? “For Christ and spices!”71
International trade with food and food stuffs has never gained full momentum, for threeinterdependent reasons. On the one side, trade with food products has dominantly beenlimited by the interests of western economies through national and supranationalregulation aimed at protecting their domestic food producers, like we have seen in thecase of Norway - where regulations protecting the interests of domestic farmerscombined with a profound fear of inferior food quality from foreign producers havemuted the flow of food across borders. Secondly, limits to logistics, trade networks andtransport technology and transport costs have limited the possibility of full internationaltrade with food, because food stuff is heavy and/or it often need to be kept cool all theway. Thirdly, new technology replacing traditional inputs from raw materials - like in thecase of artificial sweetening for sugar, gene modified soy beans for regular beans or
70 Hobsbawn (1979) cited in Dicken (1986)71 Economist 19.12.1998, fromhttp://www.economist.co.uk/485VV9aT/editorial/freeforall/19981219/xm0008.html

49
greenhouse grown vegetables to maintain production in colder areas - are also factors thatto some degree influence the amount and direction of international food trade.
Since internationalisation processes meets their limits in technology and regulation,globalisation processes has in many areas grown up as an complimentary process. Whileinternationalisation commonly is associated with quantitative cross-borders trade,Østerud suggests that globalisation involve increased strengthening of (qualitative)networks across country borders72. Such networks are most commonly associated withmultinational companies controlling companies in several countries73. Foreign ownershipin the food industry is rare. Most large agrofood companies are for example owned bydomestic farmers or dairies, and rather few of the remaining large food corporationslocated in Norway have foreign ownership. With exception of Nestlé and Freia KraftMarabou, near to all large companies are owned by domestic owners. And in those casesthere are foreign owners, the share is low.
Norwegian food production is therefor seemingly low integrated in the global network ofcorporate ownership in the food industry. However, many of the Norwegian companiesare controlling activities abroad, particularly in the nordic countries and increasingly ineastern Europe. This mostly applies for Orkla, Rieber and some of the retail chains. Orklais already well established in Norway and Sweden, and has as explicit objective toimprove the position in Finland and Denmark. Orkla has a sales apparatus in all theNordic countries. Orkla also intends to further develop the Nordic region as its domesticmarket and gradually expand into selected markets in Central and Eastern Europe, incountries like Poland, the Czech Republic, Hungary, Ukraine, Austria, Estonia, Lithuania,and Latvia. Rieber & Søn had a sale outside Norway in 1998 that exceeded 60 percent forthe first time. The whole Rieber Group had in 1998 a total of 7737 employees, whereof4911 were employed abroad. Similarly, TINE also have tight relations to the USamerican market, where they produce Jarlsberg.
However, in a global comparison, Norwegian food producers are quite small. Accordingto Fortune 500, ConAgra, Sara Lee, RJR Nabisco Holdings, Archer Daniels Midland, IBPand H.J. Heinz are the five world’s largest food producers. SaraLee alone has 140.000employees, or almost three times the whole Norwegian food industry. ConAgra is a worldleader in trademarks with more than 80.000 employees). The risk of increasedinternational competition seems relevant. As the food industry is so highly intervowen,increased competition leading to reduced activities in the Norwegian industry willinfleuence more than the industry alone.
However, successful introduction from foreign brands and producers are dependent uponmany factors, for instance the fact that Norway represents a small market with long foodtraditions related to domestic established brands. The situation today is that the number offoreign employees working in Norwegian companies ‘outcompete’ those domesticemployees working in foreign owned companies. Using this indicator, it looks like the
72 Ø. Østerud (1999), Globalisering73 Asheim. A list over the largest food manufacturers is given in the Appendix
50
Norwegian food industry seems more expansive and globalised in its form thanforeigners are to Norway.
A more vital threat to the food industry may be how the chain structure develops. Severalfood producers report that the development of large domestic chains has made their lifemore difficult. However, we may only have seen the beginning of the story. As with thefood industry, the grocery chains are also increasingly becoming global actors, with anaggressive strategy. A good example is Wal-Mart, the world largest grocery chain, withalmost one million employees74. Wal-Mart has just entered the British market, and thereare no immediate reason to belive that the tour should stop here. Whether foreign chainswill enter the Norwegain market is again a question of market size and barriers to entry.If the Norwegian market is regarded to small for international grocery chains, atheoretically possible development may be that some of the vertically integrated agrofoodproducers enter the chains as owners, completing the dominance line from soil to shelves.
Still, a possibility of foreign chains buying into the Norwegian chains lies of course in thefact that three of the four Norwegian grocery chains are familiy owned. An indication oftimes to come may be Ahold’s takeover bid for ICA/Hakon-gruppen. To what extent willevents like these influence Norwegian food suppliers. There is of course a possibility thatforeign chains will bring with them already established industry-relations. It is reasonableto believe that successful branding - i.e. to which degree Norwegian producers have madetheir customers more apt to buy exactly their products - will be very influential to whichdirection such competition will take.
3.3 SUMMARY AND POLICY CONCLUSIONS
By using the food industry as starting point, we have described the food cluster as large,compared to the size of the Norwegian ecconomy, and a profitable activity compared toother industries in Norway. The industry has in many respect lived it’s own life, shelteredfrom the surrounding world. Historically, the industry has been protected frominternational competition through tight relations to policy-makers. Today, the food clusteris the cluster with fewer extra-cluster relations than any other cluster (Hauknes 1999),and marked by tight vertical relations between different units in the production line.
We have seen that the food industry is innovative, but not in the conventional meaning ofthe concept: In terms of product and process innovation - a particularly interrelated actionin the food industry - the rate is comparatively low. However, we have suggested thatinnovation defined as an action aimed at increasing profitability, we must include moreintangible factors like developments in transport systems and sustained branding(including cumulative building of trademarks, product testing and commercials, avoidingnegative rumors etc.). Also, horisontal and vertical alignments can be interpretedimportant innovation efforts, as they resulted in corporate powers. First among agrofoodproducers towards policy-makers, later among retail chains toward the industry. As
74 A list of the world largest grocery chains are presented in the Appendix.

51
manufacturing of food has been a strategic issue for Norwegian politics the last centuries,corporative power may in itself be regarded as an innovation.
Innovation policy towards the food industry is a complex task, as the food industrydynamics vary quite a lot from dynamics in other industries. The food industry buildcompetitiveness on seemingly other and less easy copied factors, as cumulative brandingefforts and building of consumer trust. R&D activities, in the understanding of appliedresearch aimed at developing new products, seem rather unimportant, compared to otherindustries. However, the indirect R&D fee through Omsetningsrådet is a rather importantbasic research backbone to the food cluster.
REFERENCESAftenposten 23. December 1999
Arbo, P. et al. (1996); SNDs fiskerisatsing, første delrapport i evaleringen av SNDsstrategi og virkemidler overfor fiskeindustrien, NORUT samfunnsforskning,Tromsø
Asheim, Bjørn (1994), Regionale innovasjonssystem: Teknologipolitikk somregionalpolitikk, STEP report 1994:18
Asheim, Bjørn and Arne Isaksen (1996), Location, agglomeration and innovation:Towards regional innovation systems in Norway? STEP-report 1996:13, Oslo.
Borch O. J. and E. P. Stræte (eds.) (1999), Matvareindustrien mellom næring og politikk,Tano Aschehoug, Oslo
Braczyk, Hans-Joachim, Philip Cooke and Martin Heidenreich (eds.) (1998), RegionalInnovation Systems, UCL Press, London
Brynjolfsson, E. and L. Hitt (1998), Beyond Computation: Information Technology,Organisational Transformation and Business Performance, Working paper, MIT,1998, p. 3
Brynjolfsson, E. (1993), The Productivity Paradox of Information Technology,Communications of the ACM, Vol. 36, No. 12, Dec.
Bush, V., (1945), As We May Think; The Atlantic Monthly; July, 1945; Volume 176, No.1; pages 101-108.
Christensen, Jesper L., Ruth Rama and Nick von Tunzelmann (1996), Innovation in theEuropean Food Products and Beverages Industry, European InnovationMonitoring System Publication 35, IKE Group, Aalborg University (DK)
Cohen, W. M. and D. A. Levinthal (1990); Absorbtive Capacity: A New Perspective onLearning and Innovation, Admiinistrative Science Quarterly, 35: 128-152, CornellUniversity
Dicken, P (1986), Global Shift - Industrial change in a Turbulent World, Harper and Row

52
Dietrichs, E. (1995), Adopting a ‘high-tech’ policy in a ‘low-tech’ industry. The case ofaquaculture, STEP Report 02/95, STEP Group, Oslo
ECON/PriceWaterhouseCoopers (1998), Evaluering av omstillingstiltakene for denlandbruksbaserte næringsmiddelindustrien, Sluttrapport, fase 3, ECON, Oslo
ECON/Coopers and Lybrand (1997), Evaluering av omstillingstiltakene for denlandbruksbaserte næringsmiddelindustrien, Sluttrapport fase 2, ECON, Oslo
ECON/Coopers&Lybrand (1996), Evaluering av omstillingstiltakene for denlandbruksbaserte næringsmiddelindustrien, Sluttrapport fase 1, ECON, Oslo
Edquist, C. (1997), Systems of Innovation Approaches: Their Emergence andCharacteristics in C. Edquist (ed.), Systems of Innovation: Technologies,Institutions and Organisations, Pinter, London
Federation of Norwegian Beer Consumers webpages (Dec. 1999),http://www.interpost.no/nor-ale/expressweb97-2.htm
Fjordland homepages (Dec. 1999), http://www.fjordland.no
Freeman, C. (1988), Structural crisis of adjustment, business cycles and investmentbehaviour, in Dosi G et al, Technical Change and economic theory, London,Pinter.
Frionor webpages (Dec. 1999), http://www.frionor.se
Hauknes, J. (1998), Norwegian Input-Output Clusters and Innovation Patterns, STEPReport R-15-1998, Oslo
Hauknes and Braadland (1999), Innovation in Norwegian services, STEP Report XX/99,STEP Group, Oslo
Hobsbawn, E.J. (1979) The development of the world economy, Cambridge Journal ofEconomics, 3, 305-318
Klassekampen, 10. December 1999
Klassekampen, 31. December 1999
KUF (1999), Forskning for framtiden, Government’s report to the Storting, 1998/99.
Landbruksdepartementet (1999), Fra jord til bord, Governments report to the Storting no.19, Oslo
Metcalfe, J. S. (1994), Evolutionary Economics and Technology Policy, The EconomicJournal, July 1994, Royal Economic Society
Nationen 19.05.99
NIFU (ed.), (1999), Det norske Forsknings- og Innovasjonssystemet, NorgesForskningsråd, Oslo. Table A-6-10, and OECD Anberd 1999.
NIFU (1999), Instituttkatalogen, Oslo.
NOE (1995); Norsk Næringsvirksomhet, Faktahefte 1995, NOE
Norwegian Research Council (1999) Project catalogue for Bioproduction and Processing.

53
Norwegian Research Council webpages (Dec. 1999), http://www.forskningsradet.no
Nooteboom, B. (1999), Innovation and inter-firm linkages: new implications for policy,Research Policy 28 (1999) 793-805, Elsevier
Næringsmiddellovutvalget/Nærings og energidept, (1996), Effektiv matsikkerhet, NOU1996:10.
Nås, S. O. (1998), Innovasjon i Norge - en statusrapport, STEP rapport R-08-98, Oslo,STEP Group
OECD (1993), Technology and the Economy, ibid. p. 25
Onsager, K. and Berit Aasen (1995); Innovasjon og renere teknologi - en studie avlandbruksbasert foredlingsindustri, NIBR Notat 1995;117, NIBR, Oslo
Pavitt, K (1984), Sectoral patterns of technical change: towards a taxonomy and theory,p. 343 - 373, Research Policy 13
Rieber & Søn, annual report 1998
Smith, K. (1999), Specialisation, innovation and growth across heterogenous economies:issues for policy, paper presented to conference on Innovation systems: GrowthEngines for the 21st Century, Museum of Contemporary Art, Sydney, November19th to 20th 1998.
Statistics Norway (1996); Wholesale and Retail Trade Statistics 1996, C531, Oslo-Kongsvinger, Table 5
Statistics Norway (1997); Hotell- og restaurantvirksomhet, registerstatistikk, Oslo-Kongsvinger SNT homepages (Dec. 1999), http://www.snt.no
Statistics Norway (1997), Industristatistikk 1997 (Reviced final figures),Oslo/Kongsvinger
Statistics Norway (1998), Ukens Statistikk, 35
STEP Group (1995), Innovation performance at industry level in Norway; Food,beverages and tobacco, W15-95, Oslo
TINE webpages (Dec. 1999), http://www.tine.no
Veie, E. og Knut Onsager (1990), Landbruksbasert industri - Utviklingsbehov ogforskningens rolle, Resource Policy Group (GRS), Oslo
Wicken, Olav, (1997), Industrialisering og deindustrialisering i Norge 1960-1990, inIsaksen (ed.), 1997, Innovasjon, næringsutvikling og regionalpolitikk,Høyskoleforlaget, Kristiansand
Wyckoff, A. (1994), Investment, Innovation and Competitiveness: Sectoral performancewithin the triad, EIMS publication no. 2., p. 75.
Ørstavik, F. (1998), Innovation regimes and trajectories in goods transport, STEP-reportR-09-1998, STEP Group, Oslo
Aasjord, B. and G. Album, 1996, Dansen rundt gullfisken, Rapport 3/96,Naturvernforbundets Barentshavkontor

54
Interviewed persons/companies/location/dateThanks to the following persons, who helpfully contributed to this report with insightfuland invaluable information.
- Rector Roger Abrahamsen, Norges Landbrukshøgskole, Ås, June 22., 1999
- Head of Research Colin Murphy, Norges Landbrukshøgskole, Ås, June 22., 1999
- Director Kjell Aksnes, Norges Landbrukshøgskole, Ås, June 22., 1999
- Market director Finn Messel, Den lille Nøttefabrikken, Hauketo, July 6., 1999
- Manager Pål Glatz, Majonæsfabrikken, Majorstua, July 7., 1999
- Market Director Stein Drogseth, TINE Norske Meierier, Grønland, July 16., 1999
- Division Director Lars Espen Aukrust, Bioproduction and Processing Division(Bioproduksjon og Foredling), Norwegian Research Council, Sept. 16., 1999
- Market Director Gabriella Dånmark, MATFORSK, Ås, Sept. 20., 1999
- Labour Unionist Arve Rolijordet, Ringnes AS, Gjelleråsen, Sept. 21., 1999
- Trade Marketing Manager (retail) Karl Bønnhof, A/S Nestlé Norge,Billingstadssletta, Sept. 22., 1999