innovation for inclusive development : evidence from
TRANSCRIPT

Conference on Innovation for Inclusive Development 21st November 2012 Cape Town, South Africa
Dr. Parveen Arora
Advisor
Department of Science and Technology (DST)
Government of India
New Delhi, India
Innovation for Inclusive Development : Evidence from National Innovation Survey -India

OUTLINE
Importance of Innovation in Indian Context
Understanding of Innovation – National Innovation Survey
Implications

National Innovation Survey -India
Survey Coverage : A firm level national survey covering 31 states and Union Territories in 2011. The survey has been conducted for 10,000 samples firms in NIC two digit classification.
For the present purpose we use data from 11 states for which processed data was available.
Context Specificity( Inequality) :
~ inclusiveness of innovation – firms at the bottom of pyramid
~ effectiveness of the innovation support system vis-à-vis
developed context

Support system for Innovation 1
From generation of new knowledge to its application to the production system it is a long way with difficult terrain of both technological and non-technological nature and necessitates efficient support system.
Support system essentially means shortening the long way and also making it smother and easier journey for a technology from research to production or as it is generally said, from lab to land or a firm’s search for a new technology or knowledge.
Innovation, therefore, is the effectiveness of the support system.
We propose that both the arrangement and effectiveness of the support system is specific to the context of the country, and largely distinguishable between developed and developing economies.
We examine it in the context of Indian experience based on a firm level survey of innovation activities

Support system for Innovation 2
We distinguish between developed and developing economies mainly in terms of maturity of market forces which is considered as weaker in developing countries compared to the developed world.

Innovation System dynamics:
Supply and Demand
We define the market for innovation in terms of supply system – that is innovation support system.
On the other hand the demand side is understood in terms of the extent of accessing of the supply system by the innovative firms.
The innovation systems comes to fruition with the synergy between the demand and supply side of the innovation dynamics.
We examine the demand and supply issues in terms of NIS, RIS and SIS.

Innovation infrastructure: the Indian scenario
Organisations at local levels are quite skeletal
Large number of organizations for technology generations. Comparatively less are the organizations for latter two phases of innovations – like survival phase and growth phase
If ‘innovation’ is the end, institutions traced here as means look quite discrete as initiatives.
While all dimensions of innovation are covered by these institutions the beneficiaries appear to be abstract entities because the modus operndi is users approaching for the services – an approach more suitable for developed industrialized economy.
More useful for the corporate sector than SMEs.
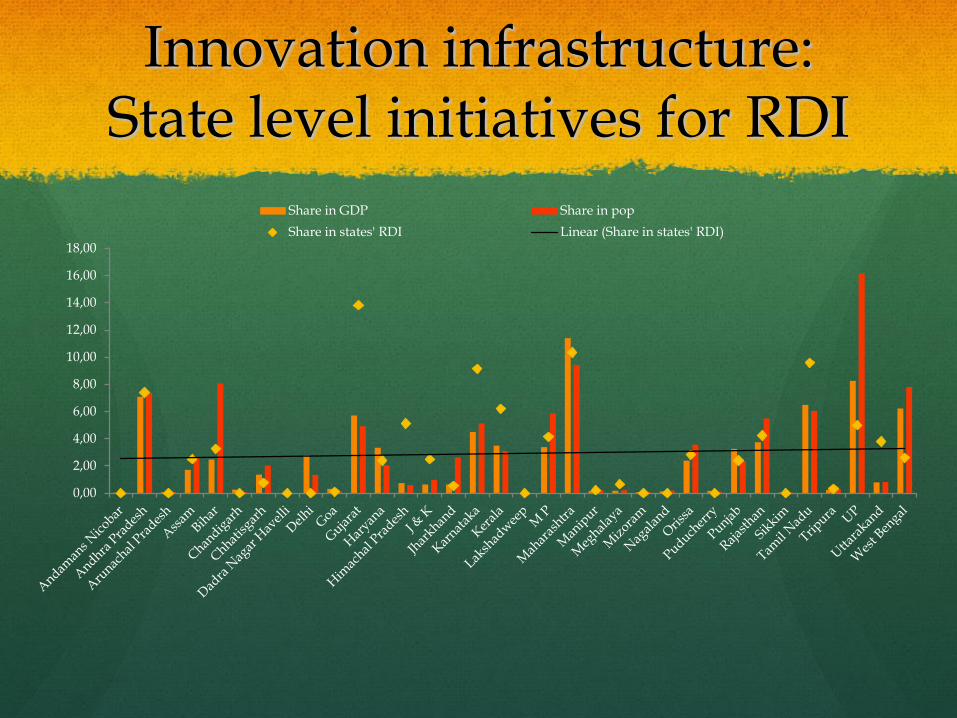
Innovation infrastructure: State level initiatives for RDI
0,00
2,00
4,00
6,00
8,00
10,00
12,00
14,00
16,00
18,00
Share in GDP Share in pop
Share in states' RDI Linear (Share in states' RDI)
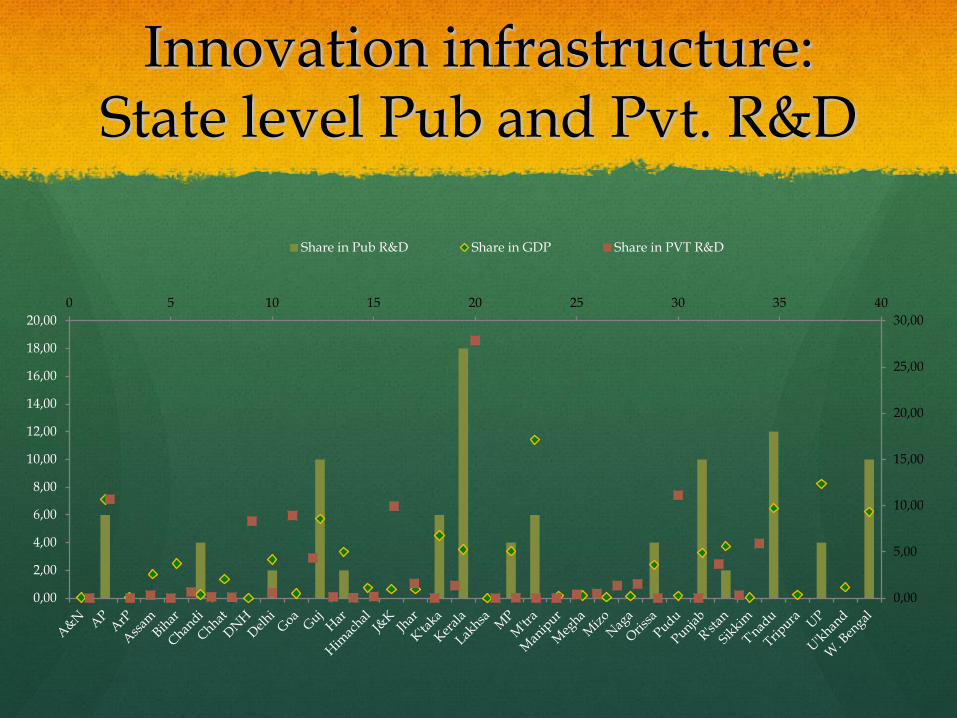
Innovation infrastructure: State level Pub and Pvt. R&D
0 5 10 15 20 25 30 35 40
0,00
5,00
10,00
15,00
20,00
25,00
30,00
0,00
2,00
4,00
6,00
8,00
10,00
12,00
14,00
16,00
18,00
20,00
Share in Pub R&D Share in GDP Share in PVT R&D

Innovation infrastructure: for SMEs

The demand side of innovation
Sta
Innovation
intensity (Rank) Source of
knowledge
(Educational
institution)
Source of
knowledge
(R&D
institution)
Institutional
Source of
finance
Training in
institution
Novelty of
innovation
Bihar 8.18 (11) 19 19 1 20 93% new to the
firm
Jharkhand 45.78 (4) 11 16 5 50 88% new to the
firm
Himachal
Pradesh 16.92 (9) 84 82 20 52
75% new to
market
Tamil Nadu 44.47 (5) 10 17 5 2 84% new to the
firm
Haryana 25.99 (7) 39 40 5 12 78% new to the
firm
Kerala 57.26 (2) 4.78 16.27 0 1.16 78% new to firm
Karnataka 62.60 (1) 4.33 18.61 0.43 3.9 58% new to firm
Gujarat 18.75 (8) 89.58 87.5 2.27 16.67 81%new to firm
Chhattisgarh 13.29 (10) 29.55 29.55 0 20 55% new to
market
Odisha 28.48 (6) 18.09 32.98 0 10 94%new to firm
W. Bengal 47.95 (3) 22.86 28 14.29 9.89 77% new to firm
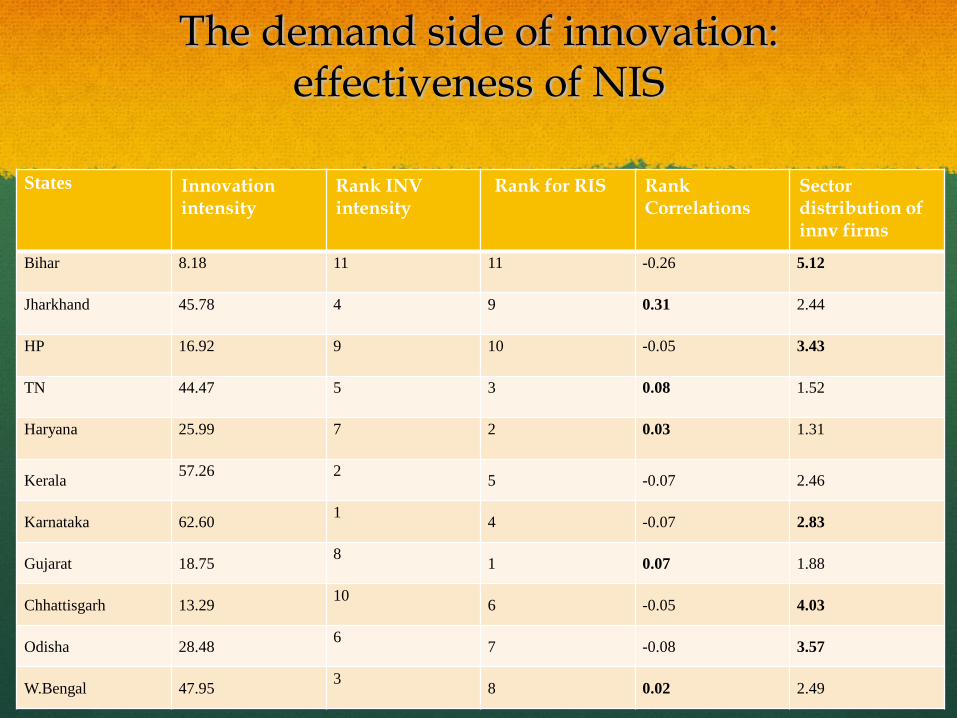
The demand side of innovation: effectiveness of NIS
States Innovation intensity
Rank INV intensity
Rank for RIS Rank Correlations
Sector distribution of innv firms
Bihar 8.18 11 11 -0.26 5.12
Jharkhand 45.78 4 9 0.31 2.44
HP 16.92 9 10 -0.05 3.43
TN 44.47 5 3 0.08 1.52
Haryana 25.99 7 2 0.03 1.31
Kerala 57.26 2
5 -0.07 2.46
Karnataka 62.60 1
4 -0.07 2.83
Gujarat 18.75 8
1 0.07 1.88
Chhattisgarh 13.29 10
6 -0.05 4.03
Odisha 28.48 6
7 -0.08 3.57
W.Bengal 47.95 3
8 0.02 2.49

Understanding and Implications
looked at the other side of the Innovation System approach of understanding innovations. The other side is the effectiveness of the system once it is in place.
Showed that innovations are essentially new to the firm , and is not part of the firms’ strategy for market expansion and consolidation.
Again market is not strong enough that firms would mobilise financial and technological resources for new innovations. As a result innovations remain essentially restricted to the internal abilities of the firms.
There is no market dynamics that lead the firms to access the facilities provided under NIS which is rarely used by firms. On the other hand weak RIS works as major detriment of innovation.
One important finding of the study is the role played by SIS in determining the innovation intensity of a state overcoming the burden of weak RIS and weak market forces.
Pro active efforts from the national agencies to close the communication gap between the actors and the innovation support system to realise the true innovative potential.
