injuries and accident causes in the pulpwood-logging ... · summary reports on the injury...
TRANSCRIPT
UNITED STATES DEPARTMENT OF LABORL. B. Schwellenbach, Secretary
BUREAU OF LABO R STATISTICS Ewan Clague, Commissioner
+
Injuries and Accident Causes in the Pulpwood-Logging Industry,1943 and 1944
Bulletin No. 924
For sale by the Superintendent o f Documents, U. S. Government Printing Office, Washington 25, D. C. Price 10 cents
Digitized for FRASER http://fraser.stlouisfed.org/ Federal Reserve Bank of St. Louis

Letter of Transmittal
United States D epartment of Labor,Bureau of Labor Statistics,
Washington, Z>. (7., December 4, 1947.The Secretary of Labor:
I have the honor to transmit herewith a report on the occurrence and causes of work injuries for 1943 and 1944 in the pulpwood-logging industry.
This report, a portion of which appeared in the August 1947 Monthly Labor Review, was prepared in the Industrial Hazards Division by Frank S. McElroy and George R. McCormack as a part of the Bureau of Labor Statistics regular program of compiling work-injury information for use in accident- prevention work.
E wan Clague, Commissioner.Hon. L. B. SCHWELLENBACH,
Secretary of Labor.
Digitized for FRASER http://fraser.stlouisfed.org/ Federal Reserve Bank of St. Louis
ContentsPage
Summary------------------------- 1Injury record----------------------------------------------------------------------------------------------------------------------------------- 2
Frequency of injuries_____________________________________________________________________________________ 2Severity of inj uries________________________________________ - _____________________________________________ 2
The industry__________________________________________________________________________________________________ 3Hazards of the industry_______________________________________________________________________________________ 5
Principal operations and their hazards_____________________________________________________________________ 5Engineering__________________________________________________________________________________________ 5Felling and limbing___________________________________________________________________________________ 5Skidding or yarding__________________________________________________________________________________ 6Bucking, peeling, splitting_________________________________________________________________ 6Loading and unloading_______________________________________________________________________________ 7Transportation________________________________ 1_____________________________________________________ 7
Injury analysis------------------------------------------------------------------------------------------------------------------------------------------------- 8Kinds of injuries experienced---------------------------------------------------------------------------------------------------------------------- 8Injuries and the age of workers___________________________ 8
Accident analysis______________________________________________________________________________________________ 9Where accidents occurred_________________________________________________________________________________ 9Agencies involved in accidents____________________________________________________________________________ 9
Accident causes____________ 11Unsafe working conditions________________________________________________________________________________ 12
Unsafe conditions management can control____________________________________________________________ 13Unsafe conditions workers can control_________________________________________________________________ 14
Unsafe acts_______________________________________________________________________________________________ 14Unsafe equipment used or equipment used unsafely___________________________________________________ 15Unsafe position or posture____________________________________________________________________________ 16Unsafe loading, placing, or planning____________ 16
Appendix.— Statistical tables:Table 1. Industrial injury frequency rates in logging operations in 1944, classified by geographic area and kind
of logging------------------------------------------------------------------------------------------------------------------------------------------- 18Table 2. Disabling injuries in pulpwood logging in 1943 and 1944, classified by part of body injured and extent
of disability__________________________________________________________________________________________ 18Table 3. Disabling injuries in 1943 and 1944, classified by part of body injured and region--------------------------- 19Table 4. Disabling injuries in 1943 and 1944, classified by nature of injury and extent of disability--------------- 19Table 5. Disabling injuries in 1943 and 1944, classified by nature of injury and region______________________ 20Table 6. Disabling injuries in 1943 and 1944, classified by part of body injured and nature of injury------------- 20Table 7. Disabling injuries in 1943 and 1944, classified by age of injured and extent of disability------------------ 21Table 8. Disabling injuries in 1943 and 1944, classified by operation and extent of disability________________ 21Table 9. Disabling injuries in 1943 and 1944, classified by operation and region------------------------------------------- 21Table 10. Disabling injuries in 1943 and 1944, classified by occupation of injured and extent of disability___ 22Table 11. Disabling injuries in 1943 and 1944, classified by part of body injured and by operation__________ 22Table 12. Disabling injuries in 1943 and 1944, classified by agency and extent of disability--------------------------- 23Table 13. Disabling injuries in 1943 and 1944, classified by agency and region---------------------------------------------- 23Table 14. Disabling injuries in 1943 and 1944, classified by accident type and region------------------------------------ 24Table 15. Disabling injuries in 1943 and 1944, classified by accident type and by operation-------------------------- 24Table 16. Disabling injuries in 1943 and 1944, classified by unsafe working condition and region____________ 24Table 17. Disabling injuries in 1943 and 1944, classified by unsafe working condition and operation_________ 25Table 18. Disabling injuries in 1943 and 1944, classified by agency and unsafe working condition___________ 25Table 19. Disabling injuries in 1943 and 1944, classified by unsafe act and region___________________________ 26Table 20. Disabling injuries in 1943 and 1944, classified by unsafe act and operation________________________ 26
Charts
Chart 1. Part of body affected by disabling injuries in pulp wood-logging operations_____________________________ ivChart 2. Major agencies involved in pulp wood-logging accidents-------------------------------------------------------------------- 10Chart 3. Major types of accidents in pulpwood logging---------------------------------------------------------------------------------- 11Chart 4. Major types of unsafe working conditions in pulpwood-logging operations----------------------------------------- 12Chart 5. Major types of unsafe acts in pulpwood-logging operations--------------------------------------------------------------- 15
III
Digitized for FRASER http://fraser.stlouisfed.org/ Federal Reserve Bank of St. Louis

CHART
PART OF BODY AFFECTED BY DISABLING IN JU R IES IN PULPWOOD LOGGING OPERATIONS
1943-1944
UNITEO STATES DEPARTMENT OF LABOR BUREAU OF LABOR STATISTICS
Digitized for FRASER http://fraser.stlouisfed.org/ Federal Reserve Bank of St. Louis

Work Injuries and Accident Causes in the Pulpwood-Logging Industry, 1943 and 1944
Summary
L ogging operations are commonly recognized as being among the most hazardous of industrial activities. The general impression has been, however, that pulpwood logging is considerably less hazardous than general logging because of the smaller and lighter logs produced. In large measure the results of this survey directly contradict that impression by indicating that injuries are no less common in pulpwood logging than in the production of sawlogs.
In response to a written request from the Bureau of Labor Statistics, 266 pulpwood-logging operators and 137 timber-logging operators submitted summary reports on the injury experience of their employees during 1944. Injury-frequency rates based upon these reports indicated no significant difference in the degree of hazard associated with the two types of logging. In the pulpwood- logging group there were 75.5 disabling injuries for every million employee-hours worked, and in the timber-logging group the corresponding average was 76.6. Both of these rates, however, were substantially higher than the 1944 all-manufacturing average of 18.4, and exceeded that of every other manufacturing industry.
In addition to supplying the summary reports used in the evaluation of the magnitude and general aspects of the injury problem in pulpwood- logging operations, 43 of the cooperating employers also made their original accident records available for detailed examination. This analysis was designed to determine how and why most pulp- wood-logging accidents occurred. The 43 establishments were distributed among 14 States and, as a group, employed about 5,500 workers in 1944. Their combined injury-frequency rate for 1944 was 85.0, which was somewhat higher than the industry average, but did not indicate that their accident experiences were other than typical of the industry. Because of the fact that their records for the single year of 1944 contained data on fewer accidents than were considered necessary
to establish a representative cause pattern, the study of their experience was broadened to cover both 1943 and 1944. On this basis the analysis included 1,933 accident cases, each of which resulted in a disabling injury.
A representative of the Bureau of Labor Statistics visited each of these 43 operations and, insofar as the data were available, transcribed from their records the following items regarding each accident: Place where the accident occurred; the occupation, age, experience, and sex of the injured worker; the nature of the injury and the part of the body injured; the type of accident; the object or substance (agency) which caused the injury; and the unsafe condition and the unsafe act which led to the accident. These data were then analyzed according to the American Recommended Practice for Compiling Industrial Accident Causes, as approved by the American Standards Association. Because some of the case records were incomplete in respect to particular details, all of the cases could not be used in every phase of the analysis. Each step of the analysis, however, was based upon the records of at least 34 logging operations.
In compiling these averages, it was necessary to exclude all operations in the Pacific Coast States. In that area, the usual practice is to combine the cutting of pulp and sawlogs into a single operation and to cut pulpwood in regular sawmill lengths of 40 or more feet. Pulpwood logging, therefore, is no different from general logging in that region. As a result, this survey is based upon the so-called “ short stick” pulpwood logging of the Northeastern, Great Lakes, and Southern areas. These data indicated that nearly half of all the disabling injuries were experienced by fellers and buckers, about 16 percent of the total were experienced by employees engaged in loading and unloading logs, and another 16 percent by workers engaged in transporting logs and equipment. Injuries to the legs, feet, and toes were most common with trunk injuries next in numerical importance. Cuts,
1
Digitized for FRASER http://fraser.stlouisfed.org/ Federal Reserve Bank of St. Louis
lacerations, punctures, bruises, and contusions predominated, but strains, sprains, and fractures were also numerous.
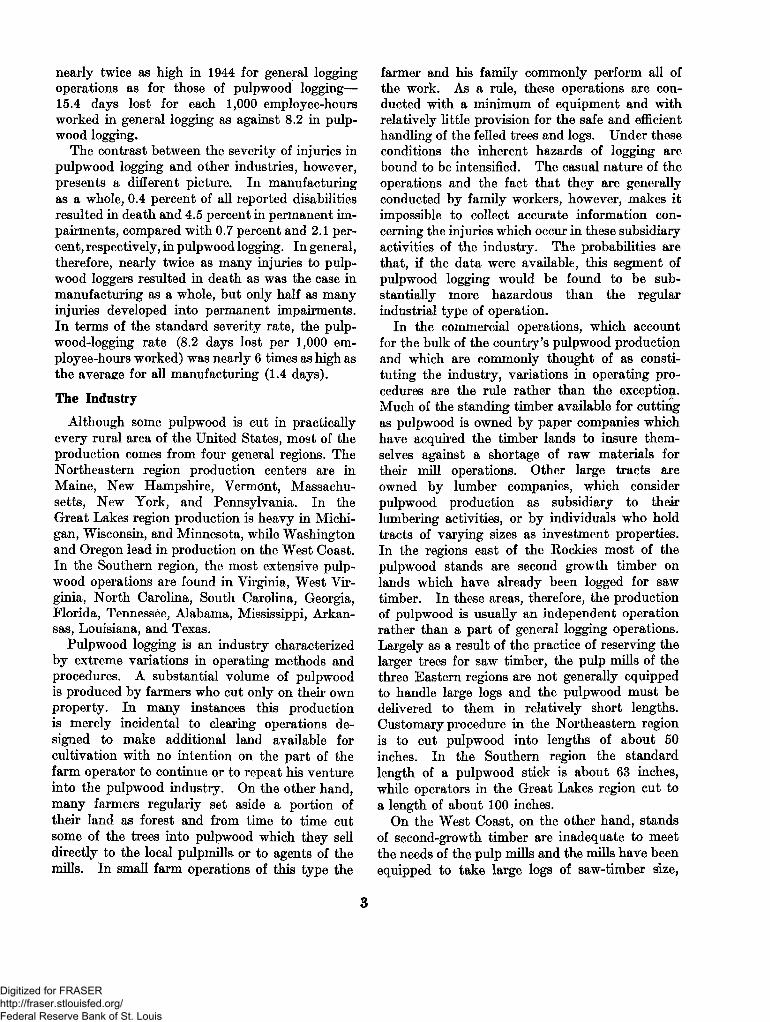
Logs, trees, hand tools, working surfaces, and vehicles were the leading injury-producing agencies and the most common type of accident was that in which the injured worker was struck by a moving object. Outstanding among the unsafe working conditions which led to accidents were rough, slippery, or obstructed working surfaces and decayed or dead limbs and trees. Among the more common unsafe acts resulting in injuries were the unsafe use of equipment, particularly hand tools, inattention to footing, and unsafe planning of felling operations.
Injury Record, 1944
Frequency' of Injuries: Comparison between the combined injury records of 266 pulpwood-logging operations and of 137 general logging operations, for the year 1944, showed very little difference in the frequency of injury in the two segments of the logging industry. The pulpwood-logging group averaged 75.5 disabling work injuries for every million employee-hours worked, which differed only slightly from the average of 76.6 for the general logging group.1
Reflecting substantial differences in operating methods and in the conditions under which operations must be conducted, the injury-frequency rates2 * * * for pulpwood logging varied considerably in the three areas included in the study. The Northeastern region had the best record with an average frequency rate of 70.3. The rate for the Southern area was 76.8, and that for the Great Lakes area was 83.1. Lending further emphasis to the high incidence of injuries in pulpwood logging is the fact that in the Great Lakes area the average injury-frequency rate tor these operations was nearly 6 points higher than the average of 77.2 for general logging operations. In the Southern area this relationship was reversed, the rates being 76.8 for pulpwood logging and 81.8 for general logging. Similar comparison between the over-all injury records for the two types of
1 See appendix, table 1.2 The injury-frequency rate is the average number of disabling injuries for
each million employee-hours worked. A disabling injury is one which resultsin death or permanent impairment, or causes an inability to work extendingbeyond the day of injury.
logging in the Northeastern area was impossible because of a lack of sufficient reports from general logging operators in that region.
The full significance of these injury-frequency rates as indicators of the high degree of hazard in pulpwood logging is somewhat obscured unless they are compared with similar rates for other types of industrial activity. For example, in the same period (1944) the average injury-frequency rate for all manufacturing activities was only 18.4.8 In other words, in an equivalent amount of working time, the workers in pulpwood logging experienced 4 times as many injuries as an average group of workers selected from manufacturing as a whole. More specifically, for every million hours worked, pulpwood loggers had 1.6 times as many disabling injuries as workers in the brewing industry; 1.8 times as many as foundry workers; 2.1 times as many as workers in slaughtering and meat packing; 5.2 times as many as workers in the automobile-manufacturing industry; and 14.2 times as many as workers in the explosives industry. Perhaps even more illuminating is the fact that approximately 1 in every 7 pulpwood loggers experienced a disabling work injury in 1944. This compares with ratios of approximately 1 in 24 in manufacturing as a whole; 1 in 10 in the foundry and brewing industries; 1 in 12 in slaughtering and meat packing; 1 in 28 in automobile manufacturing; and 1 in 81 in the explosives industry.
The Severity of Injuries: Although comparison between pulpwood logging and general logging on the basis of injury frequencies showed only minor differences, the reports did indicate that the injuries which occurred in pulpwood operations were generally less serious than those which occurred in general logging. Approximately 3 percent of the disabling injuries to pulpwood loggers in 1944 resulted in death or permanent physical impairment as compared with nearly 6 percent in general logging. Similarly, the average recovery time for temporary disabilities experienced by pulpwood workers was 22 days, as against 24 days required by general loggers. The standard severity rate, which takes into account the economic time loss resulting from death and permanent impairment cases, was
3 See Work Injuries in the United States During 1944. Bureau of Labor Statistics Bulletin No. 849.
2
Digitized for FRASER http://fraser.stlouisfed.org/ Federal Reserve Bank of St. Louis
nearly twice as high in 1944 for general logging operations as for those of pulpwood logging— 15.4 days lost for each 1,000 employee-hours worked in general logging as against 8.2 in pulp- wood logging.
The contrast between the severity of injuries in pulpwood logging and other industries, however, presents a different picture. In manufacturing as a whole, 0.4 percent of all reported disabilities resulted in death and 4.5 percent in permanent impairments, compared with 0.7 percent and 2.1 percent, respectively, in pulpwood logging. In general, therefore, nearly twice as many injuries to pulpwood loggers resulted in death as was the case in manufacturing as a whole, but only half as many injuries developed into permanent impairments. In terms of the standard severity rate, the pulp- wood-logging rate (8.2 days lost per 1,000 employee-hours worked) was nearly 6 times as high as the average for all manufacturing (1.4 days).
The Industry
Although some pulpwood is cut in practically every rural area of the United States, most of the production comes from four general regions. The Northeastern region production centers are in Maine, New Hampshire, Vermont, Massachusetts, New York, and Pennsylvania. In the Great Lakes region production is heavy in Michigan, Wisconsin, and Minnesota, while Washington and Oregon lead in production on the West Coast. In the Southern region, the most extensive pulpwood operations are found in Virginia, West Virginia, North Carolina, South Carolina, Georgia, Florida, Tennessee, Alabama, Mississippi, Arkansas, Louisiana, and Texas.
Pulpwood logging is an industry characterized by extreme variations in operating methods and procedures. A substantial volume of pulpwood is produced by farmers who cut only on their own property. In many instances this production is merely incidental to clearing operations designed to make additional land available for cultivation with no intention on the part of the farm operator to continue or to repeat his venture into the pulpwood industry. On the other hand, many farmers regularly set aside a portion of their land as forest and from time to time cut some of the trees into pulpwood which they sell directly to the local pulpmills or to agents of the mills. In small farm operations of this type the
farmer and his family commonly perform all of the work. As a rule, these operations are conducted with a minimum of equipment and with relatively little provision for the safe and efficient handling of the felled trees and logs. Under these conditions the inherent hazards of logging are bound to be intensified. The casual nature of the operations and the fact that they are generally conducted by family workers, however, makes it impossible to collect accurate information concerning the injuries which occur in these subsidiary activities of the industry. The probabilities are that, if the data were available, this segment of pulpwood logging would be found to be substantially more hazardous than the regular industrial type of operation.
In the commercial operations, which account for the bulk of the country’s pulpwood production and which are commonly thought of as constituting the industry, variations in operating procedures are the rule rather than the exception. Much of the standing timber available for cutting as pulpwood is owned by paper companies which have acquired the timber lands to insure themselves against a shortage of raw materials for their mill operations. Other large tracts are owned by lumber companies, which consider pulpwood production as subsidiary to their lumbering activities, or by individuals who hold tracts of varying sizes as investment properties. In the regions east of the Rockies most of the pulpwood stands are second growth timber on lands which have already been logged for saw timber. In these areas, therefore, the production of pulpwood is usually an independent operation rather than a part of general logging operations. Largely as a result of the practice of reserving the larger trees for saw timber, the pulp mills of the three Eastern regions are not generally equipped to handle large logs and the pulpwood must be delivered to them in relatively short lengths. Customary procedure in the Northeastern region is to cut pulpwood into lengths of about 50 inches. In the Southern region the standard length of a pulpwood stick is about 63 inches, while operators in the Great Lakes region cut to a length of about 100 inches.
On the West Coast, on the other hand, stands of second-growth timber are inadequate to meet the needs of the pulp mills and the mills have been equipped to take large logs of saw-timber size,
3
Digitized for FRASER http://fraser.stlouisfed.org/ Federal Reserve Bank of St. Louis
approximating 40 feet in length. In that area, therefore, pulpwood and saw logs are commonly produced under identical operating conditions— in some instances the actual use to which the logs will be put may not be determined until they have been removed from the forest. Because of this similarity in the two types of logging and the rather common practice of combining both into a single operation it was impossible to obtain specific information relating only to pulpwood logging on the West Coast. For this reason all of the operations in that area were omitted from this survey.
Two distinct operating policies were found to prevail among the owners of pulpwood tracts in the three Eastern regions. In the Southern region the general practice is to treat pulpwood as a continuing crop. Under this method each area is logged every 5 or 6 years and the only trees cut are those which have reached the most desirable size for pulpwood. This results in a substantial uniformity in the size of the logs cut for pulpwood, which reduces the difficulties of handling the material and thereby contributes to the safety of the operations. The practice of reworking each area at relatively short intervals also helps to reduce the amount of auxiliary work necessary in these operations. Roads through the forest which were built and used for the removal of the pulpwood during one cutting period, frequently are found to need only minor repairs to be usable in a later period. Similarly, the clearing of underbrush to facilitate operations is frequently minimized because the same area had been cleared only a few years before in the course of an earlier operation.
General practice in the Northeastern and Great Lakes regions is to cut over a tract only once in 20 or 30 years and to take all timber of usable size. As a result the size of the timber cut varies widely, the roads built during one cutting period are seldom usable at the time of the next cutting period, and the underbrush is usually very heavy.
On the large tracts owned by the paper companies, and to some extent on other large holdings, it is not uncommon for the owners to employ the woodsmen directly and to make pulpwood logging one of their regular activities. On the smaller tracts, however, it is seldom economical for the owners to undertake the management of logging operations and the general practice is to turn the
actual logging over to contract operators who employ the workers and provide the necessary equipment. Employment on the large company-owned projects is somewhat more regular than with the contract operators, and as a rule the large company operations are better organized. Safety programs are practically nonexistent except on the paper company tracts where some effort is made to extend the plant safety programs into the woods activities.
Estimates as to the number of persons employed in pulpwood logging are highly conjectural. Much of the work is seasonal and many of the workers have regular occupations in other industries, working in pulpwood logging only when their other work is slack. Generally, pulpwood cutters are paid by the cord and other personnel are paid by the hour.
Variations in climate and in the nature of the terrain largely account for the pronounced differences in the operating methods in the various regions. As a rule, the woods areas are thinly populated and are frequently far removed from public highways and railroads. Transportation problems, therefore, play an important part in determining the pattern of operations. In the Northeastern region and in parts of the Great Lakes region where the timber lands are rough and irregular, the cost of constructing all-weather roads through the forests for the removal of the pulpwood is frequently prohibitive. In the winter, however, the construction of snow roads over which the pulpwood can be removed on sleds is relatively simple. As a result the forest roads in those areas are frequently almost impassable during the summer months when most of the cutting must be done. Travel between the operating areas and locations outside the forest is exceedingly difficult and time consuming. Under these conditions it is generally necessary for the employers to provide and operate camps where the woods workers can live near the area of operations. General operating procedure under these circumstances is to fell and buck the trees into pulpwood lengths, and to pile the pulpwood in clearings adjacent to the roads during the summer and to haul it out during the winter. Where streams are available, the logs may be floated to the mills. This method of moving pulpwood from the forest, however, is not common.
In contrast, most of the logging operations in
4
Digitized for FRASER http://fraser.stlouisfed.org/ Federal Reserve Bank of St. Louis
the Southern region are on comparatively level ground and road building is not such a problem. Frequently only minor clearing and filling is necessary to open a road over which ordinary trucks and passenger cars can drive to the cutting area. As transportation can readily be provided, the workers in this region generally live outside the forest. Similarly, the ease of transportation makes it possible for the Southern operators to remove the pulpwood in trucks as soon as it has been cut into the proper lengths. In fact, the prompt removal of the pulpwood from the forest is essential in these areas as the wood quickly decays if it is piled and held in the woods.
Hazards of the Industry
Many of the hazards encountered in pulpwood logging are directly associated with particular activities. There are, however, a wide variety of hazards to which all woods workers are exposed regardless of their specific assignments. Rough and slippery ground causes many falls. Rocks, shrubbery, and tree roots present tripping hazards for everyone who must move around in the woods. The injury possibilities in the case of falls resulting from these conditions are frequently intensified by the fact that the workers are likely to be carrying sharp tools, such as axes, saws, pulphooks, or peavies. Cuts and punctures from contact with these tools are common in all woods occupations.
Low hanging branches and shrubbery frequently present eye hazards to all workers as they move about, but their most serious threat is that of deflecting a swung ax or other sharp tool against the body of the person using the tool. Falling trees and falling limbs are primarily hazardous to the fellers, but also constitute a danger to all persons who may be near the felling operations. Similarly, rolling and sliding logs are a source of injury to many workers. The possibility of injury from overexertion is also present in practically all woods occupations.
THE PRINCIPAL OPERATIONS AND THEIR HAZARDS
Engineering: The nature and extent of the preliminary work necessary in any woods operation varies widely with the size of the operation and the nature of the terrain in which the operation is to be located. In rugged country this work has all the characteristics of a major engineering
project, and in the larger companies it is commonly organized into an engineering department or division. The construction and maintenance of roads into the forest, the construction of camps, and the placement of heavy equipment, such as slasher saws, are generally the functions of these departments.
Road construction involves surveying and laying out the routes, clearing the selected road area, and smoothing and compacting the surface. In some instances it is necessary to build bridges or to dig drainage ditches. Much of the work must be performed by hand labor although the use of bulldozers, tractors, scrapers, and even power shovels is not uncommon. In the course of clearing the route, trees must be felled under much the same conditions as prevail in the regular cutting operations. In addition, all stumps and underbrush must be removed from the roadway. The construction workers, therefore, face all of the hazards of felling operations plus the hazards peculiar to the use of earth-moving equipment and explosives.
Camp construction usually consists primarily of rough carpenter work in which the chief hazards arise from the use of sharp tools or from overexertion. This work is frequently assigned to employees who have had little training or experience as carpenters and who may not be familiar with the safe methods of performing these operations.
Felling and Limbing: In felling operations the most common procedure is to make the undercut with an ax and to complete the cut with a cross-cut saw or bucksaw, although the saw may also be used in making the undercut, particularly on trees of larger diameter. The undercut is simply a wedge-shaped cut an the side of the tree toward which it is desired to fall. The felling cut with the saw is horizontal and is started on the side opposite the undercut at a point slightly above the point of the undercut wedge.
The use of power saws in the felling operation has become very common in some areas, particularly in the South where level ground and the absence of heavy underbrush make it possible to move this type of equipment around without much difficulty. The saws may be either chain saws or circular saws, the latter being the type most generally used. Power is furnished by a
769794— 48------2 5
Digitized for FRASER http://fraser.stlouisfed.org/ Federal Reserve Bank of St. Louis
small gasoline motor and is transmitted to the blade by means of a belt, the entire mechanism being mounted on a two-wheeled, hand-drawn cart. The blade is usually mounted on a projecting arm and arranged so that it can be tilted to cut at different angles. As cutters usually are paid according to the amount of timber cut, many of the individual workers provide their own power saws in an effort to increase their production. Maintenance, therefore, is not a duty of the employer and may be very haphazard, with the result that the inherent hazards involved in using these power tools may be greatly increased by their not being kept in good condition. None of the power saws observed in operation during the survey had guards either at the blade or over the belts or power take-offs.
After the tree has been felled the limbs and top are removed with an ax, usually by the same person who did the felling. The log is then ready for yarding or bucking which is commonly performed by another worker.
The felling operation involves a wide variety of hazards which the feller must overcome through his own knowledge and skill. Little supervision is provided and as each tree presents a different problem there can be little advance planning for the safety of specific operations. It is essential, therefore, that the fellers know how to recognize the hazards and how to take the necessary precautions to insure the greatest degree of safety in their work. It is probable that much could be accomplished in this respect if the employers were to furnish general training in safe felling procedures. The survey indicated, however, that it is not common in this industry for employers to provide such training.
The most outstanding hazards faced by fellers include the possibility of cuts from the keen edges of axes or saws, and the possibility of being struck by falling trees or limbs. An effective swing of an ax by an experienced woodsman may seem simple and casual to an observer. Actually it is the culmination of a series of closely coordinated actions each of which has some bearing on the safety of the feller. If the ax edge is dull or the angle of the stroke is incorrect, the ax may glance from the tree instead of cutting as intended, and be thrown against the feller. If low hanging branches interfere with the swing of the ax, it may be deflected against his person. And if his footing is insecure or his stance incorrect, he may be thrown off bal
ance and find the swinging ax completely out of control. In addition to the hazards inherent in the use of his sharp tools, the feller must also face the possibility that the ax blows may dislodge dead limbs overhead, which may fall upon him, or that the tree may break off unexpectedly and kick back against him, or that it may not fall freely as he anticipated. Accidents in which falling trees strike other trees and are deflected are common as are accidents in which workers are struck by saplings which snap back when freed after having been bent down by falling trees. Similarly, many fellers are injured in trying to release felled trees which have lodged in other trees in falling.
In limbing operations much of the danger arises from the necessity of using the ax in awkward positions and of swinging it among branches which may deflect the swing. Limbs on the under side of the trunk are often bent and under tension so that they will spring out when cut or will allow the log to drop or roll.
Skidding or Yarding: After the tree has been felled and limbed, the common practice is to drag the stripped log to a cleared area, called a yard, where it is cut, or bucked, into pulpwood lengths. In some instances, however, the bucking may be done without moving the log.
In the three regions east of the Rockies, the skidding or yarding of pulpwood logs is usually accomplished by using a horse or a tractor to pull the logs along the ground. In some instances a small two-wheeled cart, called an arch, is used to support the front end of logs which are to be pulled by a tractor.
The major hazards of yarding operations consist of the danger of being struck or crushed by the logs as they are dragged through the woods. This danger is greatest, of course, when the ground is rough or hilly, which may cause the logs to roll or swing unexpectedly. Getting the logs into position to be dragged away and placing the chains by which they are to be dragged sometimes involves strenuous physical effort and presents the possibility of injuries from overexertion.
Bucking, Peeling, Splitting: Bucking, or cutting the logs into pulpwood lengths, is usually done with a hand saw, although portable power saws are extensively used for this purpose in the South. Slasher saws, which are large-powered saws with
6
Digitized for FRASER http://fraser.stlouisfed.org/ Federal Reserve Bank of St. Louis

a rolling carriage on which the logs are moved up to the blade, are occasionally used in large-scale operations.
When the logs are yarded, the bucking is generally done with the log resting on a sawhorse or sawladder. A sawladder is constructed by laying two logs, 18 to 30 feet long, side by side and nailing short pieces of lumber across them at 4- or 5-foot intervals. The crosspieces are notched in the center and the log to be bucked is moved into the notches so that it will not roll during the bucking. In moving the log onto the sawhorse or sawladder, the bucker generally uses a cantdog or canthook.
Most pulpwood is sent to the mill without being peeled or split. In some areas, however, the bark may be removed before the logs are taken from the forest. This is particularly true in respect to hardwood logs. Splitting is necessary only when the logs are of large diameter. Peeling is usually done after the felled tree has been limbed, but before it has been bucked into pulp- wood lengths. Ordinary procedure in this operation is to loosen a short strip of bark with the ax and then to force a spud or drawknife under the bark which pulls it away from the wood.
The chief hazards associated with bucking, peeling, and splitting lie in the handling of the heavy logs. Strains and sprains from overexertion and crushed hands and feet caused by rolling or dropped logs are common in these operations, particularly in the piling of the pulpwood after bucking.
Loading and Unloading: Loading the pulpwood onto trucks or sleds for removal from the forest and loading into railroad cars for delivery to the mill are commonly manual operations, although the use of mechanical loading equipment is on the increase in the larger operations. In hand loading the men work in groups, usually with two or three doing the lifting and one on top of the load doing the placing. Pulphooks and pickaroons are commonly used to handle the logs in this operation. Lifting and moving the logs into place is very strenuous work and often results in severe strains. In addition there is always the possibility of being struck by a dropped log, or that logs may roll from the load onto the workers on the ground. The top loader moves about on the load where he faces the possibility of falls on the irregular sur
faces of the logs and the more serious hazard of having insecurely placed logs roll from the load carrying him to the ground with them.
Because of the generally larger size of the pulpwood sticks in the Great Lakes region, the use of mechanical loading equipment is more common in that area than in either the Northeastern or Southern regions. Portable conveyors and machines resembling warehouse stackers are sometimes used in these operations, but the more usual method is to utilize some type of crane or derrick to lift the logs onto the vehicle. In using some of this equipment, the practice is to assemble a number of logs into a sling load and to hoist the bundle into place. Operators in the Great Lakes region, however, more commonly employ clamshell buckets to eliminate the handling necessary in building sling loads. These clamshell buckets, which are very similar to those used in moving earth, are lowered onto the piled pulpwood and in each bite pick up a number of sticks.
Mechanical loading speeds the work and eliminates the strenuous exertion involved in lifting the logs onto the vehicle by hand. It does, however, introduce other hazards. Workers on the ground are exposed to the danger of being struck by logs which may fall from unbalanced loads, and there is always the possibility of being struck by a swinging load which may crush the unwary worker if he happens to be caught between it and a fixed object. The top loaders, who must guide the loads into place, may easily be knocked to the ground by a swinging load or may be caught under the load as it is lowered into place. In addition there is the possibility that the logs may roll when the sling is relaxed or the clamshell opened.
Pulpwood workers seldom have occasion to unload railroad cars, but the unloading of trucks and sleds is frequently a part of their work. As a rule unloading is a hand operation and may involve moving the logs into a railroad car or placing them on a conveyor at the mill.
Transportation: In the Southern region motortrucks are commonly used to transport the pulpwood from the woods to the mill or railroad siding. In the Northeastern and Great Lakes regions horse or tractor drawn sleds are used for winter transportation and trucks or trailers are used in the summer. Water transportation was found to be
7
Digitized for FRASER http://fraser.stlouisfed.org/ Federal Reserve Bank of St. Louis
unusual in the South and of only minor importance in the two northern areas.
The chief hazards associated with hauling the pulpwood are that the loads may upset or spill due to rough and hilly terrain or unsafe driving methods. In many instances no seats are provided for the teamsters on sleds or wagons and they are forced either to ride the load or walk at the side. In either case the possibility of injury is great if the load should spill. Walking at the side also involves the danger of being struck by the sled if it skids, which frequently happens when it strikes an obstruction.
Injury Analysis
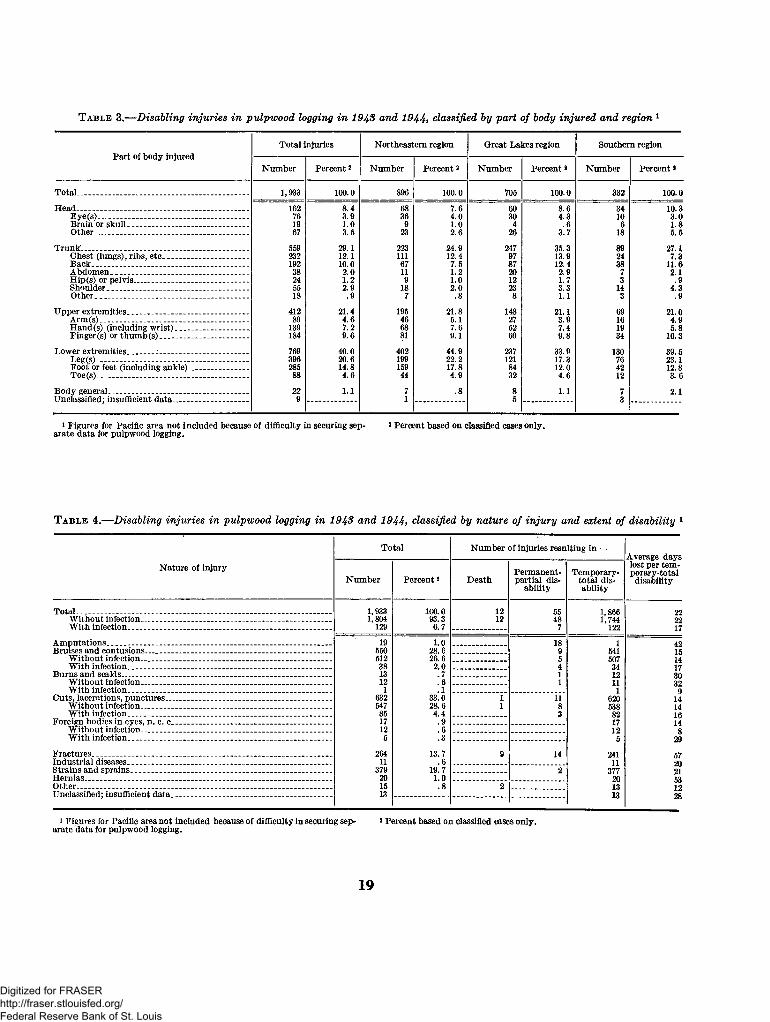
Kinds of Injuries Experienced: Cuts, lacerations, and punctures were the most common injuries experienced by pulpwood workers. Approximately one in every three disabling injuries reported were of this general nature. Over half of these injuries affected the lower extremities and about one-third affected the upper extremities. Cuts on the leg were more common than cuts on the foot. Cuts on hands and fingers, however, outnumbered arm cuts by about 4 to l.4
Bruises and contusions were the second most common variety of injury, comprising approximately 29 percent of the total volume. The lower extremities were most commonly injured but a substantial volume of the bruises and contusions were reported as affecting the trunk, the upper extremities, and the head. The closely related group of injuries, designated as strains or sprains, which included about 20 percent of the disabling cases, were primarily injuries to the trunk although the lower extremities were involved in a considerable number of cases. Back sprains predominated among the cases affecting the trunk.
Fractures were found to be more common and of a more serious nature in pulpwood logging than in most other industries. Nearly 14 percent of all the reported disabilities were fractures. About one-third of these were cases of fractured ribs and somewhat more than one-third were fractured legs, feet, or toes. The more serious cases included fractures of the skull, back, and pelvis. This group of injuries was responsible for 9 of the 12 fatalities reported in the survey.
*See appendix, tables 2 to 6, and table 11.
Injuries and the Age of Workers: As pulpwood logging involves a considerable amount of strenuous physical activity, employment in the industry during normal times is predominately made up of comparatively young men. During the war years, however, many of the younger men left the industry to enter the military services, or to work in other industries, and the proportion of older men in the pulpwood industry rose substantially. However, none of the operators visited in the course of the survey maintained any records showing the ages of their employees. For this reason, the preparation of an age distribution covering all employees was impossible and no conclusion could be drawn as to whether or not there was any relationship between the age of workers and the frequency of injuries. However, practically all of the injury reports included both the age of the injured persons and the extent of the disability resulting from the injury. It was possible, therefore, to compare the patterns of the disabilities experienced by workers of different ages.5 It should be noted, however, that this comparison involves the assumption that the hazards faced by workers in the different age groups were similar. This could not be proved factually, but, on the other hand, there was no evidence that the age of the worker was considered in making work assignments.
These data corroborate the findings of previous studies in other industries, that injuries to older persons are likely to result in more serious disabilities than those experienced by younger persons, the differences being due primarily to the greater recuperative ability of the younger persons. The break-down of the reported injuries according to the age of the injured persons indicated that these differences first become apparent at about the 40-year age level and are intensified at the 50-year level. Only 2.6 percent of the disabling injuries experienced by pulpwood workers under 41 years of age resulted in death or permanent impairment. In the age range of 41 to 50, however, 4.1 percent of the injuries resulted in death or permanent impairment and in the range of 51 to 60 years of agQ the proportion was 5.9 percent. Similarly, in respect to temporary disabilities, the average recovery time for workers in the under 41 years of age group was 20 days.
• See appendix, table 7.
8
Digitized for FRASER http://fraser.stlouisfed.org/ Federal Reserve Bank of St. Louis
For those in the 41 to 50 years of age group the average was 22 days and for those in the 51- to 60-year group it was nearly 29 days.
Accident Analysis
Where Accidents Occurred: In setting up a safety program the customary procedure is to concentrate upon the particular operations or activities in which the hazards are known to be the greatest, or which are known to be the source of the greatest volume of injuries. In the pulpwood-logging industry, however, few employers maintain separate employment records for the various types of activities. As a result it was impossible to obtain accurate information regarding the number of persons engaged in specific activities. This deficiency in the available information prevented the computation of comparative injury-frequency rates on a departmental or activity basis. It was possible, however, to determine for nearly all injury cases what the injured persons were doing at the time they were injured. Classification of the injury cases on the basis of this information indicates the activities which were most productive of injuries, but because it takes no account of the number of workers in each activity, it cannot be taken as indicating the relative degree of hazard prevailing in the various types of activities. As a basis on which to plan a safety program, however, it does indicate specifically the operating divisions in which safety work should be stressed in order to reduce the over-all injury record of the industry.6
Felling and bucking operations, including limbing and peeling, were the source of nearly half (47 percent) of all the recorded injuries. In the separate regions the proportions were: 54 percent for the Great Lakes area; 46 percent for the' Southern region; and 42 percent for the Northeastern region. About 3 percent of these cases resulted in death or permanent disability. For temporary disabilities in this group the average time loss was 22 days. In large measure this high concentration of injuries in felling and bucking operations merely reflects the relatively large proportion of the workers in the industry who are engaged in these activities. Nevertheless, it is apparent that any successful accident prevention program in the pulpwood-logging industry must
• See appendix, tables 8 to 11.
stress the development of safe practices in felling and bucking.
In a broad sense the transportation operations of the industry include all of the activities connected with the movement of the logs from the point of felling to the point of delivery to the consumer. On this basis more than 40 percent of the injuries in the industry occurred in the course of transportation. For more detailed consideration, however, the general group of transportation activities was broken down into several specific operations. Among these, the most prolific source of injuries—accounting for about 17 percent—was the operation of loading logs onto or unloading them from vehicles. Another 16 percent of the injuries occurred in the operation of the transport vehicles. In the Southern area this latter activity was a particularly important source of injuries which accounted for over 25 percent of the reported cases.
Because pulpwood logging in the Southern area involves relatively little skidding and yarding, the injuries attributable to this operation in that region amounted to only 3 percent of the total. In the Great Lakes region, on the other hand, about 8 percent of the injuries occurred in skidding and yarding operations, and about 5 percent in the Northeastern region. Similarly, river driving operations, which are uncommon in the South, were charged with no injuries in the Southern region, but were responsible for nearly 4 percent of the injuries in the Northeastern area and about 1 percent in the Great Lakes area. Injuries to engineering and equipment maintenance workers also were relatively more important in the Northeastern and Great Lakes regions than in the South.
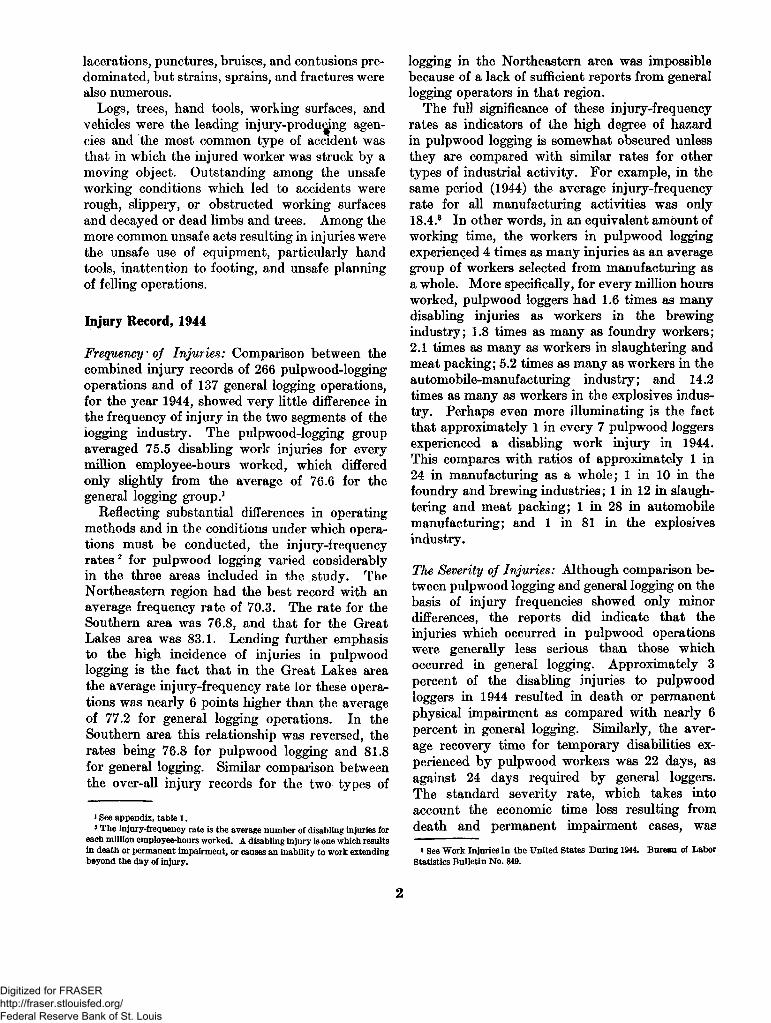
The Agencies Involved in Accidents: The determination of the particular physical objects which are most commonly involved in injuries constitutes a fundamental step in the development of a successful safety program. When these objects are known, it becomes possible to determine how and why they contributed to the occurrence of injuries and then to take measures to overcome their accident-producing possibilities. To permit the precise determination of these items, which are commonly called “ agencies,” the American Recommended Practice for Compiling Industrial Accident Causes defines an agency as “ the object or substance which is most closely associated with
9
Digitized for FRASER http://fraser.stlouisfed.org/ Federal Reserve Bank of St. Louis

MAJOR AGENCIES INVOLVED IN PULPWOOD LOGGING ACCIDENTS
HAND TOOLS
LOGS
WORKINGSURFACES
TREES
VEHICLES
OTHER
1943-44PERCENT OF ALL DISABLING INJURIES
0 5 10 15 20 25
UNITED STATES DEPARTMENT OF LABOR BUREAU OF LABOR STATISTICS
the injury, and which in general could have been properly guarded or corrected.”
Analysis based upon this definition points directly to logs or trees, hand tools, working surfaces, and vehicles as the outstanding injury-producing agencies in the pulpwood logging industry. Logs were the indicated agencies in 25 percent of the cases analyzed and trees were the agencies in another 11 percent.7 Accidents involving these agencies deserve particular attention because of the relatively large proportion which resulted in death or permanent disabilities.
Hand tools, as a group, were involved in about one-fourth of the accidents. Among these the cases involving axes were most important both in numbers and in the proportion of injuries resulting in permanent impairments. Pulp-hook injuries were numerous, but none of those which were re
7 See appendix, tables 12 and 13.
ported were known to have resulted in either death or permanent impairment.
Working surfaces were the designated agencies involved in about 14 percent of the accidents and vehicles were involved in over 7 percent. In the latter group the cases involving motor vehicles were most numerous and also most productive of serious injuries.
In general, the patterns presented by the agency analyses for the three regions were very similar. In each area logs and trees, as a group, ranked first as injury producers and hand tools ranked second. Among the hand tools, axes were of first importance in all regions and pulp hooks ranked second. On a relative basis, however, pulp-hook accidents were more common in the Northeastern region than in either of the other areas. On the other hand, accidents involving canthooks or peavies were uncommon in the Northeastern and Southern regions, but were rather numerous in the Great Lakes area.
10
Digitized for FRASER http://fraser.stlouisfed.org/ Federal Reserve Bank of St. Louis
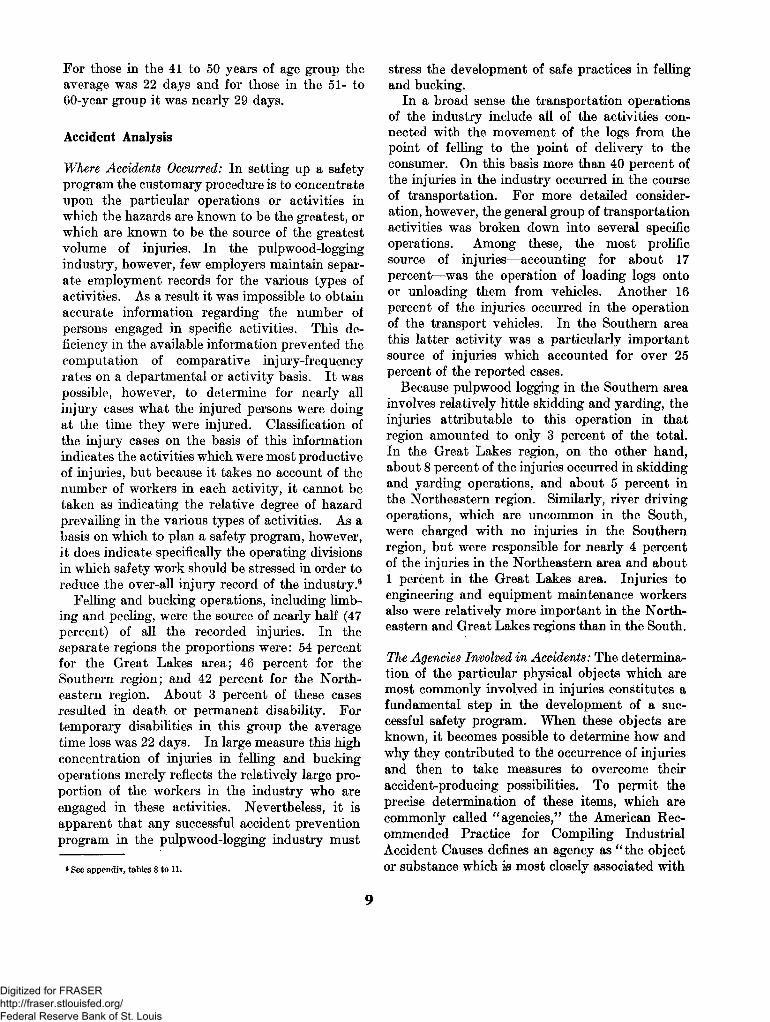
The most pronounced differences between the regions were in respect to accidents involving working surfaces and vehicles. In the Northeastern and Great Lakes regions the hazards connected with operations in rough and irregular country were emphasized by the considerable number of accidents associated with unsafe working surfaces, as compared with a much smaller number of motor-vehicle accidents. In the Southern region, on the other hand, the number of accidents in
volving unsafe working surfaces was relatively small and was greatly exceeded by the volume of vehicle accidents. Also reflecting differences in operating methods, the vehicles which were indicated as agencies in the Southern region were nearly all motortrucks while animal and tractor- drawn vehicles were involved in about half of the vehicular accidents in the Great Lakes region and in about a third of those in the Northeastern region.
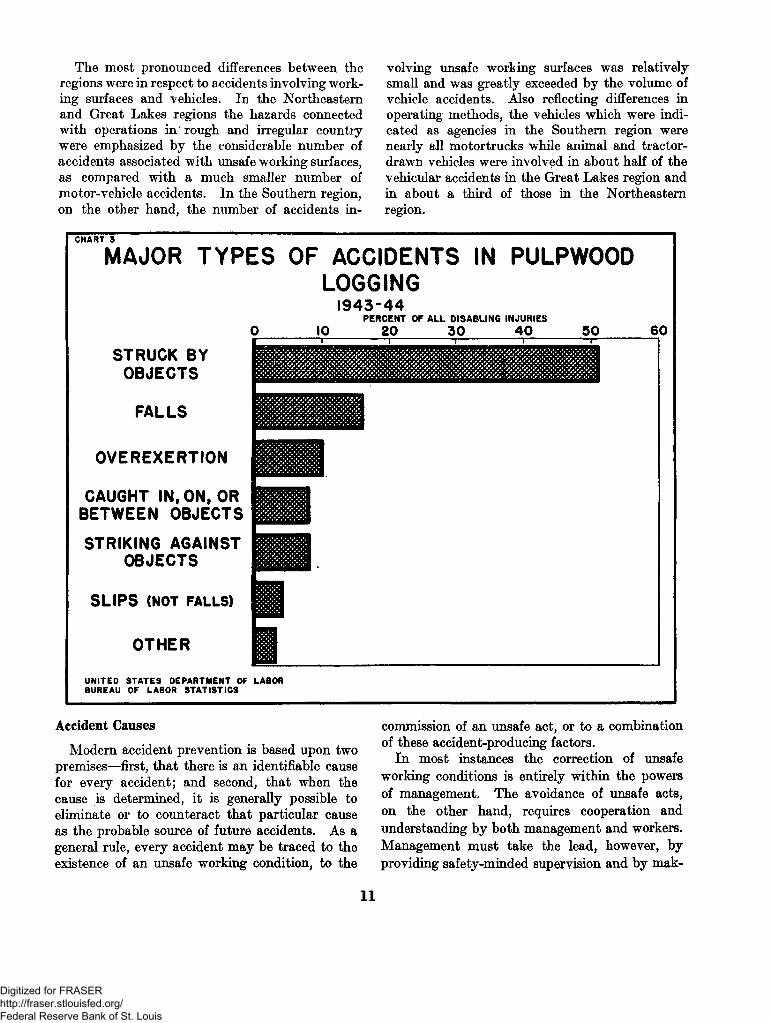
CHART 3
MAJOR TYPES OF ACCIDENTS IN PULPWOODLOGGING
1943-44PERCENT OP ALL DISABLING INJURIES
0 10 20 30 40 50 60
STRUCK BY OBJECTS
FALLS
OVEREXERTION
CAUGHT IN, ON, OR BETWEEN OBJECTS
STRIKING AGAINST OBJECTS
SLIPS (NOT FALLS)
OTHER
U N IT E D STA TE S DE PA R TM EN T OF BUREAU OF LABOR S T A T IS T IC S
i--------------- 1--------------- r
LABOR
Accident Causes
Modern accident prevention is based upon two premises—first, that there is an identifiable cause for every accident; and second, that when the cause is determined, it is generally possible to eliminate or to counteract that particular cause as the probable source of future accidents. As a general rule, every accident may be traced to the existence of an unsafe working condition, to the
commission of an unsafe act, or to a combination of these accident-producing factors.
In most instances the correction of unsafe working conditions is entirely within the powers of management. The avoidance of unsafe acts, on the other hand, requires cooperation and understanding by both management and workers. Management must take the lead, however, by providing safety-minded supervision and by mak
II
Digitized for FRASER http://fraser.stlouisfed.org/ Federal Reserve Bank of St. Louis

ing sure that all workers are acquainted with the hazards of their operations and are familiar with the means of overcoming them.
UNSAFE WORKING CONDITIONS
In most industries it is feasible for management to take direct action to eliminate practically all unsafe working conditions. Commonly this is accomplished by improving physical conditions at
the workplace, by the installation of guards, or by rearranging the work processes or procedures. In factory-type operations, in which the employer controls the materials and provides special premises, tools, and facilities for the work, and in which the work is performed under close supervision, this method of accident prevention is both practical and successful.
In logging operations, however, the situation is
CHART 4
MAJOR TYPES OF UNSAFE WORKING CONDITIONSIN PULPWOOD LOGGING OPERATIONS
1943-44PERC ENT OF A L L D IS A B L IN G IN JU R IE S
C 5 10 15 20 251 1 1 1
SLIPPERY
D E F E C T IV EROUGH
AGENCIES
AGED, WORN, CRACKED
HAZARDOUS
OTHER
LACK OF CLEAR WORKING SURFACESARRANGEMENT
ORPROCEDURE
CONGESTION OF WORKING SPACES
OTHER
LACK OF PROPERL n v i > v r rnvrfcnSAFETY EQUIPMENT
IMPROPERLYGUARDED AGENCIES
UNITED STATES DEPARTMENT OF LABORBUREAU OF LABOR STA TIS T IC S
1 2
Digitized for FRASER http://fraser.stlouisfed.org/ Federal Reserve Bank of St. Louis
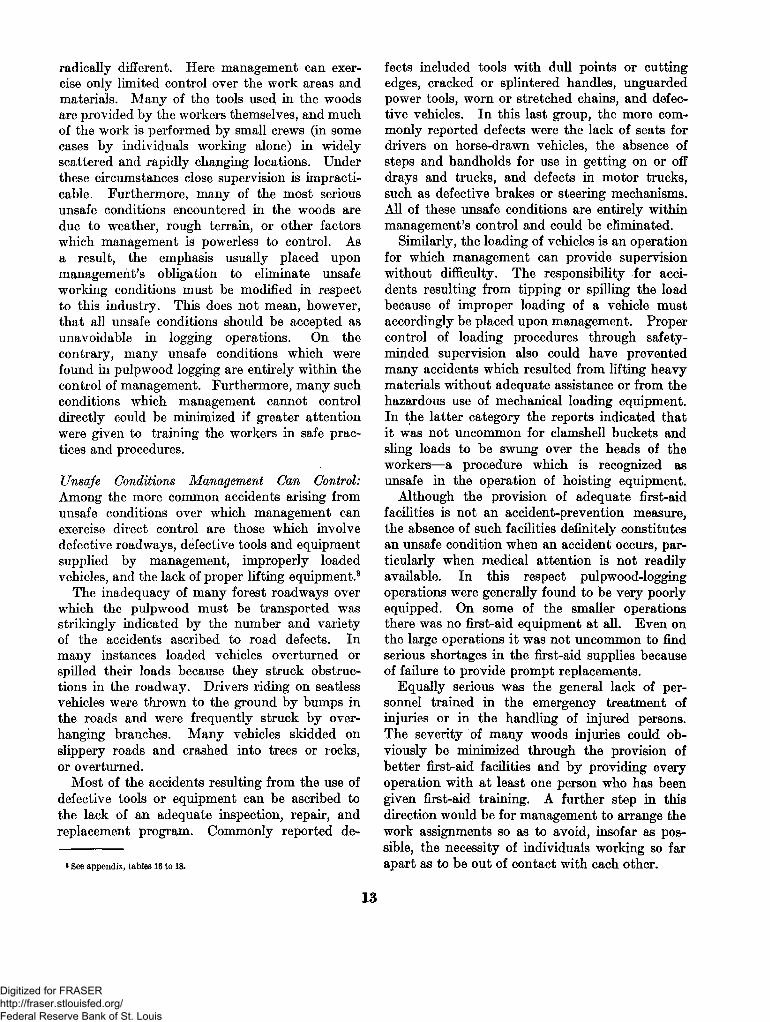
radically different. Here management can exercise only limited control over the work areas and materials. Many of the tools used in the woods are provided by the workers themselves, and much of the work is performed by small crews (in some cases by individuals working alone) in widely scattered and rapidly changing locations. Under these circumstances close supervision is impracticable. Furthermore, many of the most serious unsafe conditions encountered in the woods are due to weather, rough terrain, or other factors which management is powerless to control. As a result, the emphasis usually placed upon management’s obligation to eliminate unsafe working conditions must be modified in respect to this industry. This does not mean, however, that all unsafe conditions should be accepted as unavoidable in logging operations. On the contrary, many unsafe conditions which were found in pulpwood logging are entirely within the control of management. Furthermore, many such conditions which management cannot control directly could be minimized if greater attention were given to training the workers in safe practices and procedures.
Unsaje Conditions Management Can Control: Among the more common accidents arising from unsafe conditions over which management can exercise direct control are those which involve defective roadways, defective tools and equipment supplied by management, improperly loaded vehicles, and the lack of proper lifting equipment.8
The inadequacy of many forest roadways over which the pulpwood must be transported was strikingly indicated by the number and variety of the accidents ascribed to road defects. In many instances loaded vehicles overturned or spilled their loads because they struck obstructions in the roadway. Drivers riding on seatless vehicles were thrown to the ground by bumps in the roads and were frequently struck by overhanging branches. Many vehicles skidded on slippery roads and crashed into trees or rocks, or overturned.
Most of the accidents resulting from the use of defective tools or equipment can be ascribed to the lack of an adequate inspection, repair, and replacement program. Commonly reported de
• See appendix, tables 16 to 18.
fects included tools with dull points or cutting edges, cracked or splintered handles, unguarded power tools, worn or stretched chains, and defective vehicles. In this last group, the more commonly reported defects were the lack of seats for drivers on horse-drawn vehicles, the absence of steps and handholds for use in getting on or off drays and trucks, and defects in motor trucks, such as defective brakes or steering mechanisms. All of these unsafe conditions are entirely within management’s control and could be eliminated.
Similarly, the loading of vehicles is an operation for which management can provide supervision without difficulty. The responsibility for accidents resulting from tipping or spilling the load because of improper loading of a vehicle must accordingly be placed upon management. Proper control of loading procedures through safety- minded supervision also could have prevented many accidents which resulted from lifting heavy materials without adequate assistance or from the hazardous use of mechanical loading equipment. In the latter category the reports indicated that it was not uncommon for clamshell buckets and sling loads to be swung over the heads of the workers—a procedure which is recognized as unsafe in the operation of hoisting equipment.
Although the provision of adequate first-aid facilities is not an accident-prevention measure, the absence of such facilities definitely constitutes an unsafe condition when an accident occurs, particularly when medical attention is not readily available. In this respect pulpwood-logging operations were generally found to be very poorly equipped. On some of the smaller operations there was no first-aid equipment at all. Even on the large operations it was not uncommon to find serious shortages in the first-aid supplies because of failure to provide prompt replacements.
Equally serious was the general lack of personnel trained in the emergency treatment of injuries or in the handling of injured persons. The severity of many woods injuries could obviously be minimized through the provision of better first-aid facilities and by providing every operation with at least one person who has been given first-aid training. A further step in this direction would be for management to arrange the work assignments so as to avoid, insofar as possible, the necessity of individuals working so far apart as to be out of contact with each other.
13
Digitized for FRASER http://fraser.stlouisfed.org/ Federal Reserve Bank of St. Louis

Unsafe Conditions Workers Can Control: In the group of unsafe conditions recognized as being less susceptible to direct management control, hazards found to be most productive of injuries were those associated with rough or slippery surfaces, dead trees or limbs, and the lack of clear work spaces. There appears to be little that either management or the workers can do to eliminate the possibility of accidents from some of these causes. It is equally apparent, however, that the workers themselves can and should eliminate many such unsafe conditions for themselves as a normal part of their work. Nevertheless, it is obvious from the record that such precautions are frequently not taken. The problem of management, therefore, is to increase the safety consciousness of the workers and to make sure that they know how to protect themselves.
Ice, snow, mud, wet grass, loose stones, underbrush, stumps, etc., were responsible for many slipping and tripping accidents in all divisions of the industry. For the person who is moving about in the forest, constant alertness and close attention to where he is walking constitute the only practicable defense against such hazards. However, when the workers are performing felling, limbing, peeling, splitting, piling, or other operations in which a firm footing is essential, it should be their first concern to make sure that there are no such hazards underfoot. Similarly, although it is impracticable to attempt to remove low-hanging branches, vines, and the like in the vicinity of all operations, it is essential that this be done wherever it is necessary to swing an ax which might be caught and deflected.
Various types of accidents involving dead limbs or trees were reported. In some instances these were blown down by the wind onto persons who were working or merely walking nearby. In other instances, workers were hit by dead trees which were accidentally knocked over by the felled trees. Other reports indicated that dead limbs from the trees which fellers were cutting became dislodged by the jarring from ax blows, and injured the workers. Dead limbs also were the cause of a number of accidents in limbing operations. In these cases the limber’s ax unexpectedly passed
clear through the dead limb and either struck the worker or threw him off his feet.
UNSAFE ACTS
In the field of accident prevention an unsafe act is defined as “ a violation of a commonly accepted safe procedure.” 9 Literally this means that no personal action shall be designated as unsafe unless there is a less hazardous alternative method or procedure. In many instances it was apparent from the reports that the individual knew the safe procedure but consciously decided not to follow it; for example, a worker deliberately removed the guard from a saw and used it without the provided protection. In other cases, the available data indicate that the person who acted unsafely did so simply because he did not know the safe method.
The first step toward the elimination of unsafe acts, therefore, requires that all workers are thoroughly instructed in the safe methods of performing their duties and that they are familiar with the hazards connected with deviations from such safe procedures. Generally, the second essential step is to exercise strict supervision to see that only safe methods are used. In pulpwood logging, however, direct supervision of all operations is impracticable. Proper instruction, therefore, becomes doubly important. Unfortunately, it became quite evident in the course of the survey that relatively few pulpwood operators made any provision for the proper training of their employees. In most instances, only perfunctory inquiries were made about the previous training and experience of new employees before assigning them to work in the woods.
In most of the accident cases analyzed, the available facts indicated that the occurrence of the accident was directly related to the commission of an unsafe act in one of the following broad categories: Using unsafe equipment or using equipment unsafely; unsafe loading, placing,, or planning; and taking an unsafe position or posture.10
9 American Kecommended Practice for Compiling Industrial Accident Causes, approved by the American Standards Association, August 1, 1941, (New York, 1941).
10 See Appendix, Tables 19 and 20.
14
Digitized for FRASER http://fraser.stlouisfed.org/ Federal Reserve Bank of St. Louis
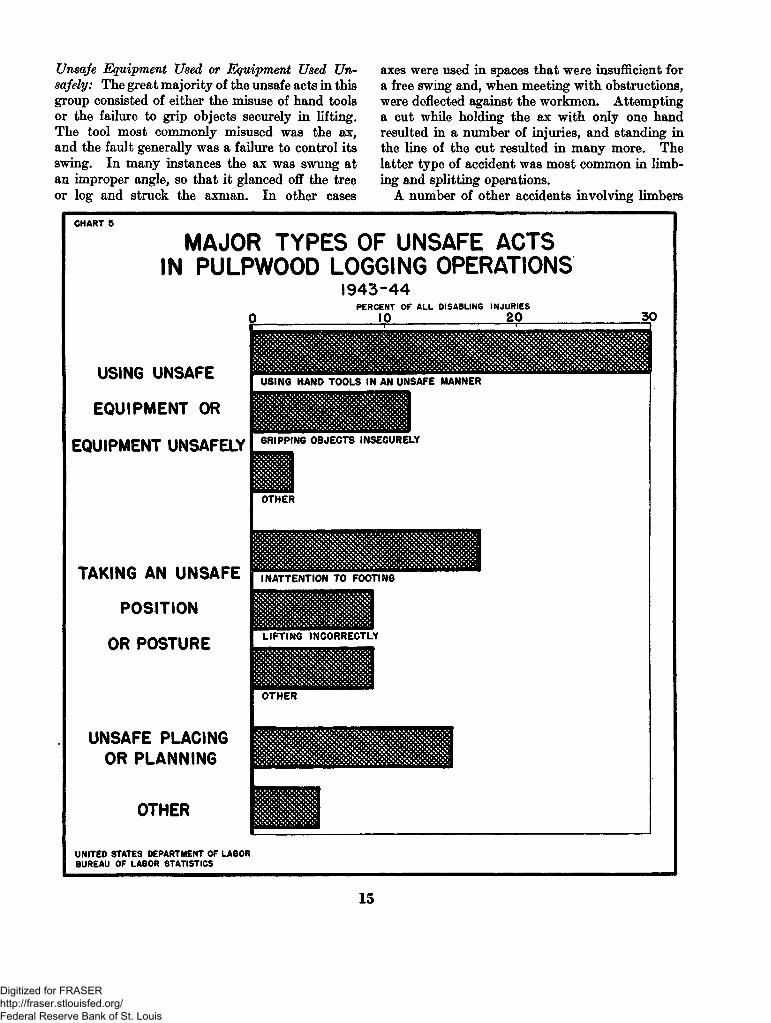
Unsafe Equipment Used or Equipment Used Unsafely: The great majority of the unsafe acts in this group consisted of either the misuse of hand tools or the failure to grip objects securely in lifting. The tool most commonly misused was the ax, and the fault generally was a failure to control its swing. In many instances the ax was swung at an improper angle, so that it glanced off the tree or log and struck the axman. In other cases
axes were used in spaces that were insufficient for a free swing and, when meeting with obstructions, were deflected against the workmen. Attempting a cut while holding the ax with only one hand resulted in a number of injuries, and standing in the line of the cut resulted in many more. The latter type of accident was most common in limbing and splitting operations.
A number of other accidents involving limbers
CHART 5
MAJOR TYPES OF UNSAFE ACTS IN PULPWOOD LOGGING OPERATIONS
USING UNSAFE
EQUIPMENT OR
EQUIPMENT UNSAFELY
TAKING AN UNSAFE
POSITION
OR POSTURE
UNSAFE PLACING OR PLANNING
OTHER
UNITED STATES DEPARTMENT OF LABOR BUREAU OF LABOR STATISTICS
1943-44PERCENT OF ALL DISABLING INJURIES
10 20 30------------------------------------------------------------------- 1-------------------------- — — - ■"»-------------— i------------------------------------------------------------ --—
USING HAND TOOLS IN AN UNSAFE MANNER
GRIPPING OBJECTS INSECURELY
INATTENTION TO FOOTING
15
Digitized for FRASER http://fraser.stlouisfed.org/ Federal Reserve Bank of St. Louis

resulted from the practice of standing on the trunk of the tree while using an ax to trim off limbs. In this position it is frequently impossible to avoid a severe fall if the ax catches on an obstruction or if it unexpectedly passes through the limb being cut. Some of these accidents resulted in particularly severe injuries because the workers fell on the ax. Another group of limbing accidents resulted from applying the ax to the wrong side of limbs which were under tension. When trees fall they often bend saplings or limbs to the ground and place them under tension. Safe practice dictates that these limbs or saplings should be cut with the ax from the under side of the curve. When they are struck on the top side the tension frequently will throw the ax back out of control.
Although cases involving the misuse of axes were the most numerous, and generally resulted in the most severe injuries, many accidents were attributable to the misuse of other hand tools such as saws, pulphooks, and canthooks. Pulp- hook accidents were particularly common. Frequently the pulphook glanced from the log, or even missed the log entirely, and struck either the worker using the hook or a nearby coworker. Generally the failure to properly control the tool in cases of this kind resulted from inattention or from improper grasp of the tool.
In addition to the accidents resulting from misuse of tools in processes for which they were designed, many accidents were chargeable to the use of hand tools for purposes other than those for which they were intended. An outstanding example of such misuse occurred when a feller used his ax to push over a tree which had been partly cut through. The ax slipped from the trunk and the worker fell on the blade.
In lifting, piling, or moving heavy, rough, and awkward objects like pulp wood logs, accidents are inevitable unless the handling procedures are properly coordinated and executed. The most common fault in these operations was that of taking an insecure grip on the object being handled or in releasing the object before it was solidly placed in position. As a result many feet or toes were crushed by objects which slipped from the hands of workers, or their fingers were pinched by the materials which they were piling or placing.
Unsafe Position or Posture: The most common
unsafe act in this general category was inattention to footing. Natural irregularities in the surface of the ground were involved in some of the accidents in this group, but the majority were cases of tripping over logs, stumps, rocks, or other objects lying on the ground. Sometimes the workers tripped while stepping backwards to get out of the way of falling trees. In other instances, workers were injured when their feet slipped from the hub caps, tires, wheel spokes, fenders, or frames of vehicles on which they were climbing, or when they stepped from vehicles onto loose stones or into holes in the ground. Teamsters were frequently injured when they attempted to stand on the load and were thrown off by unexpected jolts.
Lifting with a bent back or from an awkward position was a particularly common cause of injury, and numerous workers were injured because they unnecessarily placed themselves in the path of moving or falling objects. Accidents of the latter type frequently occurred in skidding and yarding operations when workers walked or stood close to or on the downhill side of logs which were being dragged. In some of these accidents the workers were caught between the moving logs and fixed objects such as trees, stumps, or boulders, resulting usually in serious injuries.
Unsafe Loading, Placing, or Planning: Because woodsmen often work alone without supervision, they must assume a great deal of responsibility for their own safety and for the safety of others who may approach their operations. This is particularly true in felling operations. The felling of each tree presents a different combination of problems. The feller first must decide the direction in which he wishes the tree to fall. The line of its fall should be as clear as possible so that it will not strike other trees; and when it comes to rest it should be so located as to facilitate limbing and handling of the stripped trunk. Before the actual felling is started, safe practice dictates that the area at the base of the tree be checked to be sure that there is sufficient clear space for the work and for the feller to move away when the tree starts to fall. It is also essential for safety that the feller check the ground around the tree to make certain that he will have secure footing; and finally, that he inspect the tree for any dead
16
Digitized for FRASER http://fraser.stlouisfed.org/ Federal Reserve Bank of St. Louis
limbs which might be dislodged by the blows of his ax and fall on him.
The experienced feller makes these observations automatically and quickly formulates a plan for the operation. This may include the removal of some of the hazards revealed by his inspection or the adoption of special procedures which will offset the hazards. However, the tendency on the part of some experienced fellers to take chances to save time, or the inability of inexperienced workers to recognize existing hazards or to plan successfully for their elimination, frequently result in serious accidents in this operation.
A case, typical of many reported in this category, involved a felled tree which had lodged in a second tree. The feller then decided to cut down the latter in order to release the first tree. In the course of this operation the first tree became dislodged and dropped onto the feller, who was working under it. In another instance the feller climbed up the trunk of the lodged tree to reach a point where he could cut it loose. His weight caused it to come free, throwing him to the ground. In other instances workers were injured when they tried to push trees loose after they had
lodged in other trees. Equally common were cases in which the butt of a falling tree kicked back and injured the feller when the top of the tree struck another tree.
The accidents classified as arising from unsafe loading or placing of materials commonly occurred in the course of loading or piling pulpwood. Generally these were cases of failure to interlock or block the piles to prevent the logs from rolling down or becoming dislodged when the pile was walked upon. There were, however, a considerable number of accidents caused by the unsafe placing of tools and other equipment. In a typical case, a worker was injured when after cutting a bush, he laid his ax on the ground and then stepped on it as he pulled the bush aside. Another worker laid his ax on a pile of branches and, when he picked up the branches, the ax fell on his foot.
Accidents of these types constitute strong evidence of the general lack of safety consciousness among pulpwood workers, and emphasize the need for a program based upon the “ Three E's of Safety” —Engineering, Education, and Enforcement.
17
Digitized for FRASER http://fraser.stlouisfed.org/ Federal Reserve Bank of St. Louis

Appendix: Statistical Tables
T able 1.— Industrial injury frequency rates in logging operations in 1944, classified by geographic area and kind of logging1
Geographic area and kind of logging
Number of opera
tionsNumber of employees
Employee-hours
worked(thousands)
Number of disabling injuries
Total days lost
Injury rates2Average days lost
per temporary-total disabilityTotal
Resulting in-
DeathPermanent-
partialdisability
Temporary-totaldisability
Frequency Severity
Total pulpwood logging.......... 266 9,772 19,327 1,459 11 30 1,418 159,148 75.5 8.2 22Total other logging3............... 137 4,372 8,044 616 10 25 581 123,490 76.6 15.4 24Northeastern area:
Pulpwood logging_______ 40 4,189 9,870 694 5 13 676 73,269 70.3 7.4 22Great Lakes area:
Pulpwood logging............. 142 3,636 6,136 510 2 16 492 55,470 83.1 9.0 21Other logging.................... 85 2,352 4,459 344 4 11 329 55,195 77.2 12.4 30
Southern area:Pulpwood logging............. 84 1,947 3,321 255 4 1 250 30,409 76.8 9.2 24Other logging.................... 39 1,623 3,154 258 5 14 239 62,118 81.8 19.7 16
1 Figures for Pacific area not included because of difficulty in securing separate data for pulpwood logging.
2 The frequency rate is the average number of disabling injuries for eachmillion employee-hours worked. The severity rate is the average number of days lost for each thousand employee-hours worked.
* Includes figures not shown separately because of insufficient data.
T able 2.— Disabling injuries in pulpwood logging in 1943 and 1944, classified by part of body injured and extent of disability1
Part of body injured
Total Number of injuries resulting in— Average days lost per
temporary- total disabilityNumber Percent 2 Death
Permanent- partial dis
abilityTemporary-
total disability
Total............ ............................................................................................. 1,933 100.0 12 55 1,866 22162 8.4 7 4 151 14
Eye(s)______________________________________________________ 76 3.9 3 73 15Brain or fit-nil_______________________________________________ 19 1.0 6 13 33Other.................................................................................................... 67 3.5 1 1 65 10
T ru n k .._______________________________________________________ 559 29.1 3 556 26Chest (lungs), ribs, etc_______________________________________ 232 12.1 2 230 23Back____ ____ ______________ ________________________ __ ____ 192 10.0 1 191 25Abdomen___________________________________________________ 38 2.0 38 34Hip(s) or pelvis______________________________________________ 24 1.2 24 41Shoulder ________________________________________________ 55 2.9 55 23Other_______________________________________________________ 18 .9 18 26
Upper extremities. . . . _________ _________________________________ 412 21.4 34 378 19Arm(s) . _________ _________________ -_______________ 89 4.6 2 87 21Hand(s) (including wrist)____________________________________ 139 7.2 6 133 18Finger (s) or thumb (s)______ __________________________________ 184 9.6 26 158 19
Lower extremities...................................................................................... 769 40.0 1 17 751 22Leg(s)............................. ..................................................................... 396 20.6 1 13 382 23Foot or feet (including ankle)_________________________________ 285 14.8 2 283 21Toe(s)___ ________________________________________________ 88 4.6 2 86 19
22 1.1 1 21 28Unclassified; insufficient data_____________________________________ 9 9 20
i Figures for Pacific area not included because of difficulty in securing * Percent based on classified cases only,separate data for pulpwood logging.
18
Digitized for FRASER http://fraser.stlouisfed.org/ Federal Reserve Bank of St. Louis
T able 3.— Disabling injuries in pulpwood logging in 1948 and 1944) classijied by part of body injured and region 1
Part of body injuredTotal injuries Northeastern region Great Lakes region Southern region
Number Percent2 Number Percent2 Number Percent2 Number Percent2
Total..................................................... ................. 1,933 100.0 896 100.0 705 100.0 332 100.0Head....... ...................... ............ ........................... 162 8.4 68 7.6 60 8.6 34 10.3
Eye(s).........................................................—- 76 3.9 36 4.0 30 4.3 10 3.0Brain or skull.................................................. 19 1.0 9 1.0 4 .6 6 1.8Other................................................................ 67 3.5 23 2.6 26 3.7 18 5.5
Trunk'.......................... .................... .................... 569 29.1 223 24.9 247 35.3 89 27.1Chest (lungs), ribs, etc__............................... 232 12.1 111 12.4 97 13.9 24 7.3Back...................... ................. ........................ 192 10.0 67 7.5 87 12.4 38 11.6Abdomen................... ........................ .......... 38 2.0 11 1.2 20 2.9 7 2.1Hip(s) or pelvis........... .................................. 24 1.2 9 1.0 12 1.7 3 .9Shoulder. ......................... .............................. 55 2.9 18 2.0 23 3.3 14 4.3Other............................................................... 18 .9 7 .8 8 1.1 3 .9
Upper extremities.......................................... ........ 412 21.4 195 21.8 148 21.1 69 21.0Arm(s)............................................................. 89 4.6 46 5.1 27 3.9 16 4.9Hand(s) (including wrist)........................... 139 7.2 68 7.6 52 7.4 19 5.8Finger (s) or thumb (s)............ ........................ 184 9.6 81 9.1 69 9.8 34 10.3
Lower extremities......... ....................................... 769 40.0 402 44.9 237 33.9 130 39.5Leg(s).......................................................... — 396 20.6 199 22.2 121 17.3 76 23.1Foot or feet (including ankle)......................... 285 14.8 159 17.8 84 12.0 42 12.8Toe(s)._..................... ............... .................... 88 4.6 44 4.9 32 4.6 12 3.6
Body general_________________ ____ _______ _ 22 1.1 7 .8 8 1.1 7 2.1Unclassified; insufficient data_________________ 9 1 5 3
1 Figures for Pacific area not included because of difficulty in securing sep- * Percent based on classified cases only, arate data for pulpwood logging.
T able 4.— Disabling injuries in pulpwood logging in 1948 and 1944) classified by nature of injury and extent of disability 1
Nature of injury
Total Number of injuries resulting in —Average days lost per temporary-total disabilityNumber Percent2 Death
Permanent- partial dis
abilityTemporary-
total disability
Total........................... ........................ . . . ........... ..................................... 1,933 1C0.0 12 55 1,866 22Without infection________________ ___________________________ 1,804 93.3 12 48 1,744 22With infection. ________ _____ ___________ ______ ____________ 129 6.7 7 122 17Amputations __ _______________________________________________ 19 1.0 18 1 42Bruises and contusions. — _______________________________________ 550 28.6 9 541 15Without infection____________________________________________ 512 26.6 5 507 14With infection_______________________________________________ 38 2.0 4 34 17Burns and scalds____ ___________________________________________ 13 .7 1 12 30Without infection____________________________________________ 12 .6 1 11 32W ith infection _______________________________ _____________ 1 .1 1 9Cuts, lacerations, punctures................................................... ............ . 632 33.0 1 11 620 14Without infection.......................................................... ..................... 547 28.6 1 8 538 14With infection..___________________ ______________ _______ ___ 85 4.4 3 82 16Foreign bodies in eyes, n. e. c_____________________________________ 17 .9 17 14Without infection____ _________ _______ ______ ______________ 12 .6 12 g
With infection................................................................................... 5 .3 5 29Fractures....... .................... ......................................... ........................... 264 13.7 9 14 241 57Industrial diseases____________ __________________________________ 11 .6 11 20Strains and sprains____ ___________ ____ _________________________ 379 19.7 2 377 21Hernias_________ _____ ____ ________ _____________________ _______ 20 1.0 20 53Other........ ........................... ................. ................................................... 15 .8 2 13 12Unclassified; insufficient data........................... ........... .............. ......... . 13 13 28
i Figures for Pacific area not included because of difficulty in securing sep- 2 Percent based on classified cases only,arate data for pulpwood logging.
19
Digitized for FRASER http://fraser.stlouisfed.org/ Federal Reserve Bank of St. Louis
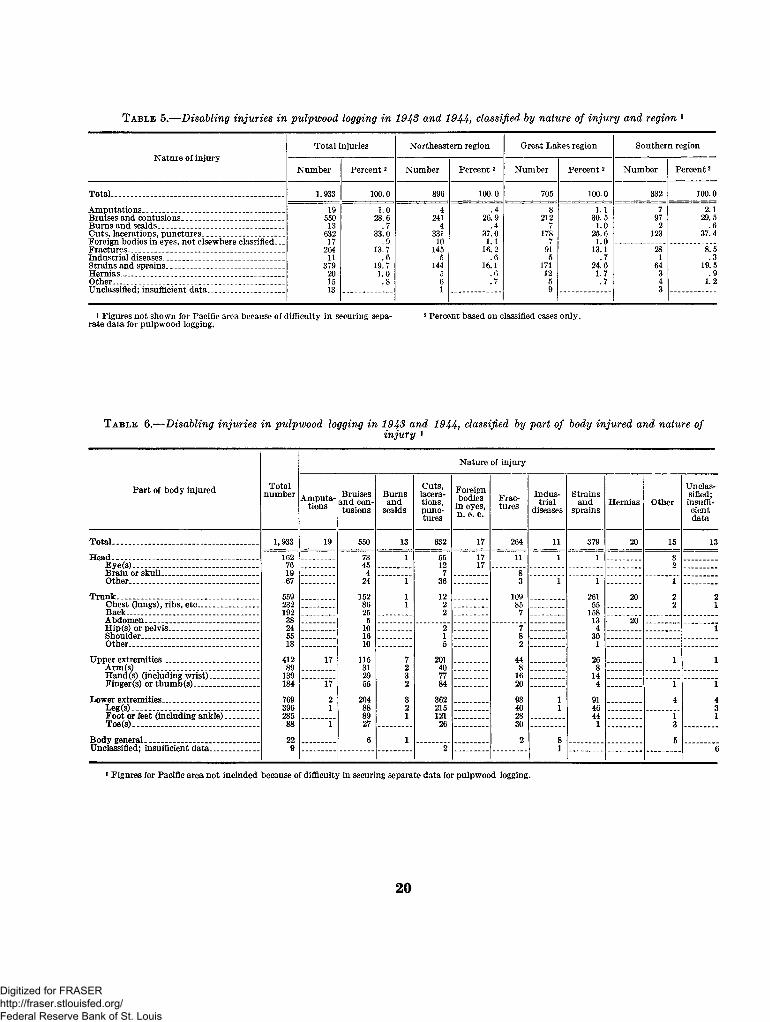
T able 5.— Disabling injuries in pulpwood logging in 1948 and 1944, classified by nature of injury and region
Nature of injuryTotal injuries Northeastern region Great Lakes region Southern region
Number Percent2 Number Percent2 Number Percent2 Number Percent2
Total............................................................. ........ 1.933 100.0 896 100.0 705 100.0 332 100.0Amputations..______________________________ 19 1.0 4 .4 8 1.1 7 2.1Bruises and contusions_______________________ 550 28.6 241 26.9 212 30.5 97 29.5Burns and scalds_____________________________ 13 .7 4 .4 7 1.0 2 .6Cuts, lacerations, punctures.. ________________ 632 33.0 331 37.0 178 25.6 123 37.4Foreign bodies in eyes, not elsewhere classified__ 17 .9 10 1.1 7 1.0Fractures____________________________________ 264 13.7 145 16.2 91 13.1 28 8.5Industrial diseases____________________________ 11 .6 5 .6 5 .7 1 .3Strains and sprains_____________________ _____ 379 19.7 144 16.1 171 24.6 64 19.5Hernias.-------------------------------------------------------- 20 1.0 5 .6 12 1.7 3 .9Other_______________________________________ 15 .8 6 . 7 5 .7 4 1.2Unclassified; insufficient data_______ 13 1 9 3
i Figures not shown for Pacific area because of difficulty in securing sepa- 2 Percent based on classified cases only,rate data for pulpwood logging.
T a b le 6.— Disabling injuries in pulpwood logging in 1943 a,nd 1944, classified by part of body injured and nature ofinjury 1
Nature of injury
Part of body injured Totalnumber Amputa
tionsBruises
and contusions
Bumsand
scalds
Cuts,lacerations,punctures
Foreign bodies
in eyes, n. e. c.
Fractures
Industrial
diseasesStrains
andsprains
Hernias OtherUnclassified;insufficientdata
Total......... ..............—.............................. . 1,933 19 550 13 632 17 264 11 379 20 15 13Head______ ____________ ______ ________ 162 73 1 55 17 11 1 1 3
Eye(s)__................................................. 76 45 12 17 2Brain or skull..................................... 19 4 7 8Other...................... ............ .................. 67 24 1 36 3 1 1 1
Trunk..______________________________ 559 152 1 12 109 261 20 2 2Chest (lungs), ribs, etc______________ 232 86 1 2 85 55 2 1Back________ ____________ _______ 192 25 2 7 158Abdomen__________________________ 38 6 13 20Hip(s) or pelvis_________ ___________ 24 10 2 7 4 1Shoulder__________ _______ _______ 55 16 1 8 30Other...................................................... 18 10 5 2 1
Upper extremities....................... ................ 412 17 115 7 201 44 26 1 1Arm(s)_____ ______________________ 89 31 2 40 8 8Hand(s) (including wrist)..................... 139 29 3 77 16 14Finger (s) or thumb (s)........................... 184 17 55 2 84 20 4 1 1
Lower extremities____ _________________ 769 2 204 3 362 98 1 91 4 4Leg(s)..................................................... 396 1 88 2 215 40 1 46 3Foot or feet (including ankle)________ 285 89 1 121 28 44 1 1Toe(s).................................................... 88 1 27 26 30 1 3
Body general__________________________ 22 6 1 2 8 5Unclassified; insufficient data— ................ 9 2 1 6
* Figures for Pacific area not included because of difficulty in securing separate data for pulpwood logging.
20
Digitized for FRASER http://fraser.stlouisfed.org/ Federal Reserve Bank of St. Louis
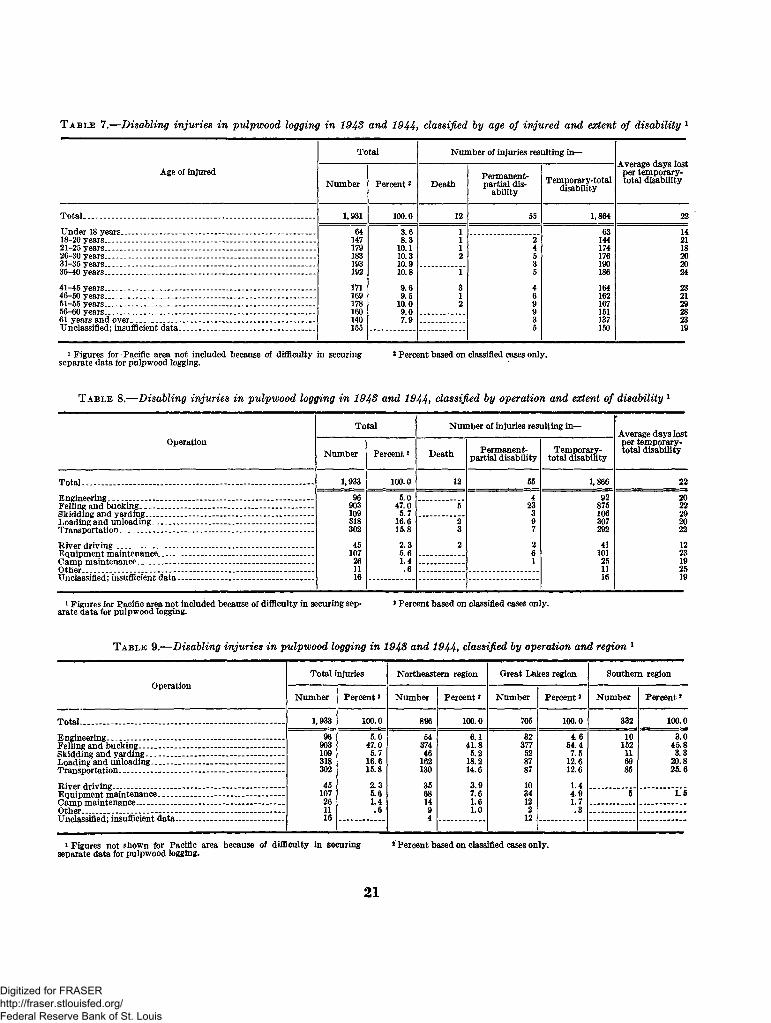
T able 7.— Disabling injuries in pulpwood logging in 1948 and 1944) classified by age of injured and extent of disability 1
Total Number of injuries resulting in—Average days lost
per temporary- total disability
Age of injuredNumber Percent2 Death
Permanent- partial dis
abilityTemporary-total
disability
Total.................... .......... ....................... ....................................... 1,931 100.0 12 55 1,864 22Under 18 years____________________________________________ 64 3.6 1 63 1418-20 years ..................................................................... .............. 147 8.3 1 2 144 2121-25 years _______________________________________________ 179 10.1 1 4 174 1826-30 years ____________________________________________ 183 10.3 2 5 176 2031-35 years....................... .................... .............. ............... .......... 193 10.9 3 190 2036-40 years_________________________________________________ 192 10.8 1 5 186 2441-45 years________________________________________________ 171 9.6 3 4 164 2346-50 years________________________________________________ 169 9.5 1 6 162 2151-55 years. ______________________________________________ 178 10.0 2 9 167 2956-60 years_____ ____ __________ ___________________________ 160 9.0 9 151 2861 years and over _______________________________________ 140 7.9 3 137 23Unclassified; insufficient data______________________________ 155 5 150 19
1 Figures for Pacific area not included because of difficulty in securing 2 Percent based on classified cases only,separate data for pulpwood logging.
T able 8.— Disabling injuries in pulpwood logging in 1948 and 1944) classified by operation and extent of disability 1
Operation
Total...................................... .Engineering. ...........................Felling and bucking________Skidding and yarding_______Loading and unloading--------Transportation................. —River driving--------------- ------Equipment maintenance........Camp maintenance.......... ...Other......................................Unclassified; insufficient data
Total Number of injuries resulting in—Average days lost per temporary- total disabilityNumber Percent2 Death Permanent-
partial disabilityTemporary-
total disability
1,933 100.0 12 55 1,866 2296 5.0 4 92 20
903 47.0 5 23 875 22109 5.7 3 106 29318 16.6 2 9 307 20302 15.8 3 7 292 2245 2.3 2 2 41 12
107 5.6 6 101 2326 1.4 1 25 1911 .6 11 2516 16 19
1 Figures for Pacific area not included because of difficulty in securing sep- 2 Percent based on classified cases only,arate data for pulpwood logging.
Table 9.— Disabling injuries in pulpwood logging in 1948 and 1944t classified by operation and region 1
OperationTotal injuries Northeastern region Great Lakes region Southern region
Number Percent2 Number Percent2 Number Percent2 Number Percent2
Total..................................................................................... 1,933 100.0 896 100.0 705 100.0 332 100.0
Engineering....... ................................................................. 96 5.0 54 6.1 32 4.6 10 3.0Felling and bucking............................................................ 903 47.0 374 41.8 377 54.4 152 45.8Skidding and yarding.......................................................... 109 5.7 46 5.2 52 7.5 11 3.3Loading and unloading...................................................... 318 16.6 162 18.2 87 12.6 69 20.8Transportation. ........................... - ..................- .................. 302 15.8 130 14.6 87 12.6 85 25.6Riyer driving _ _ _____ ______ ___ 45 2.3 35 3.9 10 1.4Equipment maintenance.................................................... 107 5.6 68 7.6 34 4.9 5 1.5Camp maintenance . . _______-__ 26 1.4 14 1.6 12 1.7Other ______________________________ 11 .6 9 1.0 2 .3Unclassified; insufficient data-___ __________________ 16 4 12
1 Figures not shown for Pacific area because of difficulty in securing 2 Percent based on classified cases only,separate data for pulpwood logging.
21
Digitized for FRASER http://fraser.stlouisfed.org/ Federal Reserve Bank of St. Louis
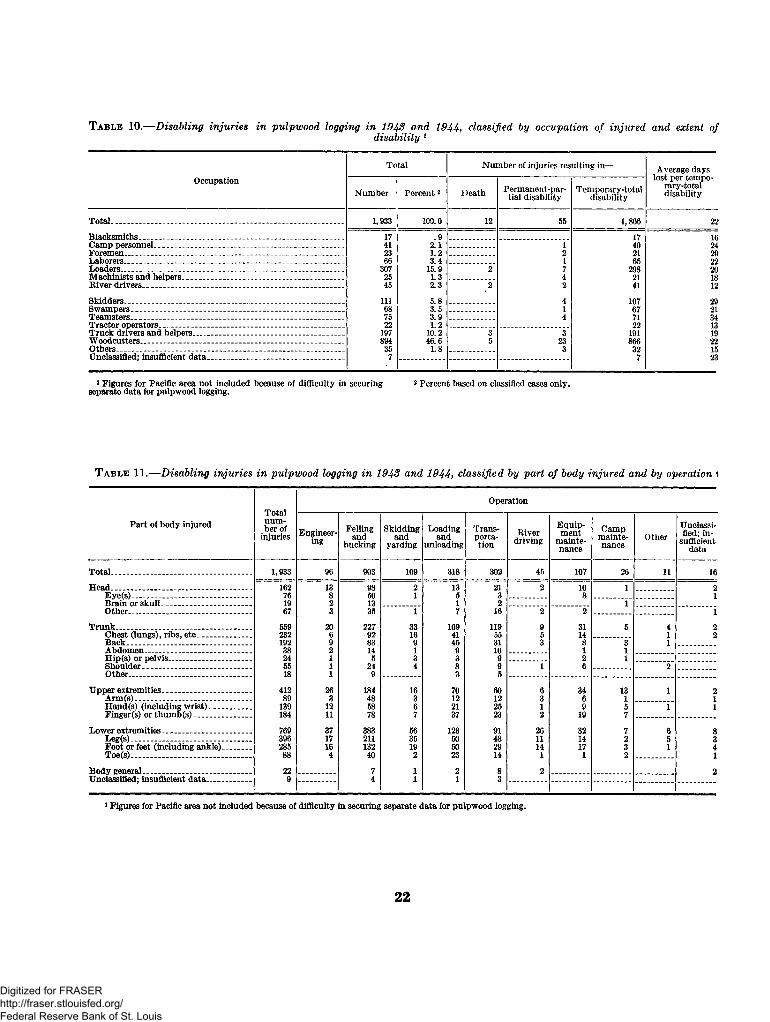
T able 10.— Disabling injuries in pulpwood logging in 1943 and 1944, classified by occupation of injured and extent ofdisability 1
OccupationTotal Number of injuries resulting in— Average days
lost per temporary-total disabilityNumber Percent2 Death Permanent-par
tial disabilityTemporary-total
disability
Total............................................... - .................................... .......... 1,933 100.0 12 55 1,866 22Blacksmiths . . .................................. .............................................. 17 .9 17 16Camp personnel______ ____________________________________ 41 2.1 1 40 24Foremen____ _____________________________________ ________ 23 1.2 2 21 29Laborers._________________________________________________ 66 3.4 1 65 22Loaders------------------ ------------ — ................................................ 307 15.9 2 7 298 20Machinists and helpers______________ ____ __________________ 25 1.3 4 21 18River drivers...................... - ................... .................................... . 45 2.3 2 2 41 12Skidders........................................................................................... 111 5.8 4 107 29Swampers_________________________________________________ 68 3.5 1 67 21Teamsters _ _____________________________________________ 75 3.9 4 71 34Tractor operators ________________________________________ 22 1.2 22 13Truck drivers and helpers................................................ .............. 197 10.2 3 3 191 19Woodcutters....... ...................................................... ...................... 894 46.6 5 23 866 22Others____________________________________________________ 35 1.8 3 32 15Unclassified; insufficient data_______________________________ 7 7 23
1 Figures for Pacific area not included because of difficulty in securing 2 percent based on classified cases only, separate data for pulpwood logging.
T able 11.— Disabling injuries in pulpwood logging in 1943 and 1944, classified by part of body injured and by operation 1
Part of body injuredTotal number of
injuries
Operation
Engineering
Fellingand
buckingSkidding
andyarding
Loadingand
unloadingTransportation
Riverdriving
Equipment
maintenance
Campmaintenance
OtherUnclassified; in
sufficient data
Total............ ............................................. 1,933 96 903 109 318 302 45 107 26 11 16Head____________ ____ _______________ 162 13 98 2 13 21 2 10 1 2
Eye(s).................. .............................. 76 8 50 1 5 3 8 1Brain or sk u ll...... ......... ...... ........—- 19 2 13 1 2 1Other................................................... 67 3 35 1 7 16 2 2 1
Trunk................................................ -___ 559 20 227 33 109 119 9 31 5 4 2Chest (lungs), ribs, etc____________ 232 6 92 16 41 55 5 14 1 2Back......... .............. .......................... 192 9 83 9 45 31 3 8 3 1Abdomen......................... ................. 38 2 14 1 9 10 1 1Hip(s) or pelvis____ ____ __________ 24 1 5 3 3 9 2 1Shoulder_________________________ 55 1 24 4 8 9 1 6 2Other................................................... 18 1 9 3 5
Upper extremities..................................... 412 26 184 16 70 60 6 34 13 1 2Arm(s)................. ................... ........... 89 3 48 3 12 12 3 6 1 1Hand(s) (including wrist).................. 139 12 58 6 21 25 1 9 5 1 1Finger (s) or thumb (s)........................ 184 11 78 7 37 23 2 19 7
Lower extremities..................................... 769 37 383 56 123 91 26 32 7 6 8Leg(s)............ ..................................... 396 17 211 35 50 48 11 14 2 5 3Foot or feet (including ankle)............ 285 16 132 19 50 29 14 17 3 1 4Toe(s)______ _____ _____ __________ 88 4 40 2 23 14 1 1 2 1
Body general.............................. .............. 22 7 1 2 8 2 2Unclassified; insufficient data__________ 9 4 1 1 3
1 Figures for Pacific area not included because of difficulty in securing separate data for pulpwood logging.
22
Digitized for FRASER http://fraser.stlouisfed.org/ Federal Reserve Bank of St. Louis

T able 12.— Disabling injuries in pulpwood logging in 1948 and 1944, classified by agency and extent of disability 1
Total Number of injuries resulting in— Average days lost per temporary-total disa
bilityAgency
Number Percent1 2 Death Permanent-partial disability
Temporary-totaldisability
Total___________________________________________ — .......... . 1,933 100.0 12 55 1,866 22Yarding equipment_______ ______ ____________________ _____ 62 3.2 3 59 27Vehicles_______ ____ _____________ ______ ___________________ 144 7.5 3 8 133 31
Motor_______________ _______ __________________________ 82 4.3 3 5 74 36Animal or tractor drawn________________________________ 43 2.2 3 40 27Other ______________________________________ 19 1.0 19 23
Animals and insects _____________________________________ 43 2.2 43 18Hand tools _ _ _ ___________ ___________________________ 472 24.7 9 463 18
Ax or hatchet . __________ _ _______________________ 244 12.8 8 236 19Cant hook or peavey _ _________________•______________ 19 1.0 19 22Pulp hook _ ________________________________________ 121 6.3 121 16Saw „ . ___________ _ ____________________ 36 1.8 35 21Other______ ____ ______________________________________ 63 2.8 1 52 14
Chemicals and poisonous vegetation_________________________ 16 .8 16 19Working surfaces _______ __________________________ ■ 274 14.3 8 266 24
Ground_______________________________________________ 214 11.2 7 207 21"Roads ___ ______________________ 44 2.3 1 43 38Other _ _ __ _ _ _______________ 16 .8 16 25
Logs8 (chips, limbs, etc.)___________________________________ 482 25.2 1 10 471 21Trees8 (chips, limbs, etc.)_____________ _____________________ 209 10.9 3 8 198 25Other. ____ _ __ ________________________________________ 216 11.2 5 9 201 22Unclassified j insufficient data 16 16 20
1 Figures for Pacific area not included because of difficulty in securing sep- 8 Pulpwood is classified as a tree until it is felled; after felling, pulpwood isarate data for pulpwood logging. classified as a log.
2 Percent based on classified cases only.
T able 13.— Disabling injuries in pulpwood logging in 1948 and 1944, classified by agency and region 1
AgencyTotal injuries Northeastern region Great Lakes region Southern region
Number Percent2 Number Percent2 Number Percent2 Number Percent2
Total.......... ...................... ............................... .............................. 1,933 100.0 896 100.0 705 100.0 332 100.0
Yarding equipment__________________________ ____ __________ 62 3.2 24 2.7 26 3.7 12 3.6Vehicles.................................................................. ........................ 144 7.5 65 6.2 47 6.8 42 12.7
Motor------- ------------------------------------------------------------ ------ 82 4.3 28 3.2 17 2.4 37 11.2Animal or tractor drawn---------------------- ------ -------------------- 43 2.2 18 2.0 24 3.5 1 .3Other. ........................... ........... .............. ................................. 19 1.0 9 1.0 « 6 .9 4 1.2
Animals and insects.------ ----------------------- --------------------- -------- 43 2.2 18 2.0 21 3.0 4 1.2Hand tools........... ..................... ............................................ ........... 472 24.7 234 26.3 145 20.9 93 28.1
Ax or hatchet...________ ____ _____________________ _____ 244 12.8 119 13.5 69 10.0 56 17.0Canthook or peavey................. ................................. .............. 19 1.0 4 .4 14 2.0 1 .3Pulp hook— ------- -------------------------------------------- --------- - 121 6.3 82 9.2 25 3.6 14 4.2Saw................................................................... ........... ............ . 35 1.8 11 1.2 12 1.7 12 3.6Other..................... ........... ................................................... . £3 2.8 18 2.0 25 3.6 10 3.0
Chemicals and poisonous vegetation....... .................................. . 16 .8 7 .8 8 1.2 1 .3Working surfaces......... ................................................................... 274 14.3 118 13.2 141 20.3 15 4.5
Ground-............. ........................................................................ 214 11.2 93 10.4 107 15.4 14 4.2Roads_________ ____ ____ ______ ___________ ____________ 44 2.3 18 2.0 25 3.6 1 .3Other _______ ______________ _______________________ 16 .8 7 .8 9 1.3
Logs8 (chips, limbs, etc.).......................... — ................................. 482 25.2 213 23.9 168 24.1 101 30.5Trees8 (chips, limbs, etc.)............ ........................................ ........ 209 10.9 102 11.4 69 9.9 38 11.5Other.................... ............................. .............. ............................. 215 11.2 120 13.5 70 10.1 25 7.6Unclassified; insufficient data________________________________ 16 5 10 1
1 Figures for Pacific area not included because of difficulty in securing sep- 8 Pulpwood is classified as a tree until it is felled; after felling, pulpwood isarate data for pulpwood logging. classified as a log.
2 Percent based on classified cases only.
23
Digitized for FRASER http://fraser.stlouisfed.org/ Federal Reserve Bank of St. Louis
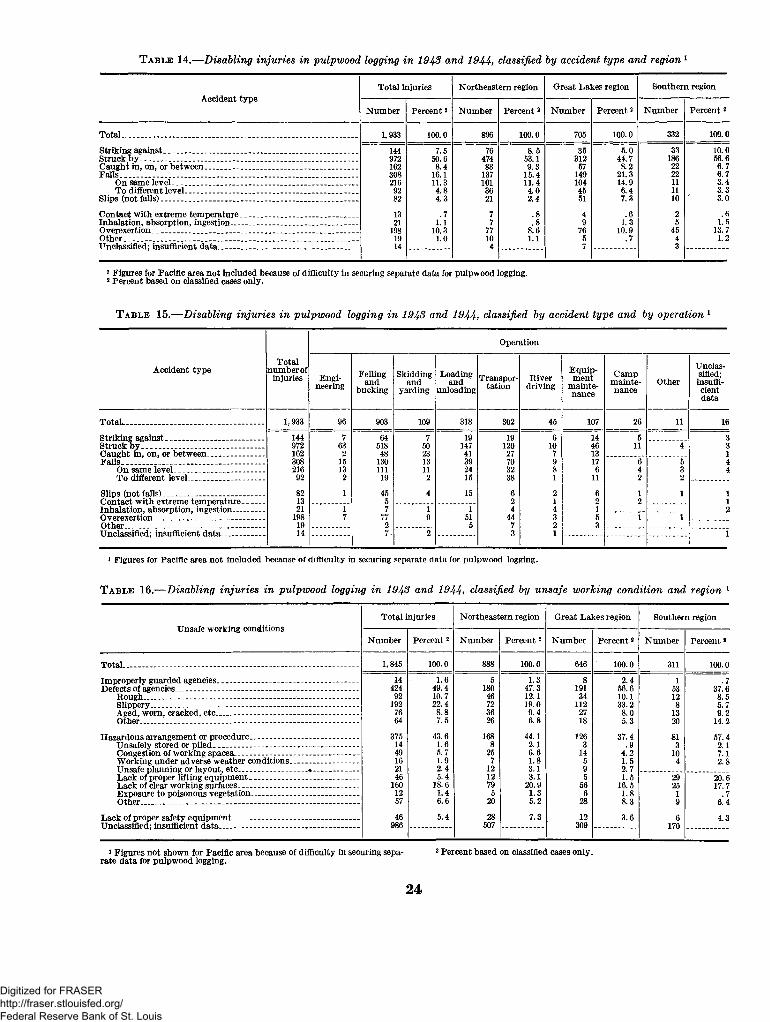
T able 14.— Disabling injuries in pulpwood logging in 1943 and 1944, classified by accident type and region
Accident typeTotal injuries Northeastern region Great Lakes region Southern region
Number Percent2 Number Percent2 Number Percent2 Number Percent2
Total.................................................................................................. 1,933 100.0 896 100.0 705 100.0 332 100.0
Striking against........................................... .................................. 144 7.5 76 8.5 35 5.0 33 10.0Struck by ............................................................................. ......... 972 50.6 474 53.1 312 44.7 186 56.6Caught in, on, or between................. ............................. .............. 162 8.4 83 9.3 57 8.2 22 6.7Falls. ........................................................................................ ........ 308 16.1 137 15.4 149 21.3 22 6.7
On same level.............................................................................. 216 11.3 101 11.4 104 14.9 11 3.4To different level....... —............................ ................................. 92 4.8 36 4.0 45 6.4 11 3.3
Slips (not falls)....................................... .......................................... 82 4.3 21 2.4 51 7.3 10 3.0Contact with extreme temperature. ............................................... 13 .7 7 .8 4 .6 2 .6Inhalation, absorption, ingestion.......................... ........................ 21 1.1 7 .8 9 1.3 5 1. 5Overexertion__________________ _____ ____ _____ _____ ________ 198 10.3 77 8.6 76 10.9 45 13.7Other.......................... .................................... ........... ......... .......... 19 1.0 10 1.1 5 .7 4 1.2Unclassified; insufficient data ______________________ ________ 14 4 7 3
1 Figures for Pacific area not included because of difficulty in securing separate data for pulpwood logging.2 Percent based on classified cases only.
T able 15.— Disabling injuries in pulpwood logging in 1943 and 1944, classified by accident type and by operation 1
Accident typeTotal
number of injuries
Operation
Engineering
Fellingand
buckingSkidding
andyarding
Loadingand
unloadingTranspor
tationRiver
drivingEquipment
maintenance
Campmaintenance
OtherUnclassified;insufficientdata
TotaL................................ ........................ 1,933 96 903 109 318 302 45 107 26 11 16Striking against_______________________ 144 7 64 7 19 19 6 14 5 3Struck b y ........................................- ......... 972 63 518 50 147 120 10 46 11 4 3Caught in, on, or between____________ 162 2 48 23 41 27 7 13 1Falls.......................................................... 308 15 130 13 39 70 9 17 6 5 4
On same level_____ _______ ________ 216 13 111 11 24 32 8 6 4 3 4To different level_________________ 92 2 19 2 15 38 1 11 2 2
Slips (not falls)....... .................................. 82 1 45 4 15 6 2 6 1 1 1Contact with extreme temperature_____ 13 5 2 1 2 2 1Inhalation, absorption, ingestion_______ 21 1 7 1 1 4 4 1 2O verexertion_________________________ 198 7 77 9 51 44 3 5 1 1Other _____________________________ 19 2 5 7 2 3Unclassified; insufficient data__________ 14 7 • 2 3 1 1
* Figures for Pacific area not included because of difficulty in securing separate data for pulpwood logging.
T able 16.— Disabling injuries in pulpwood logging in 1943 and 1944, classified by unsafe working condition and region 1
Unsafe working conditionsTotal injuries Northeastern region Great Lakes region Southern region
Number Percent2 Number Percent2 Number Percent2 Number Percent2
1,845 100.0 888 100.0 646 100.0 311 100.0Improperly guarded agencies--------- ----------------------- ------------ 14 1.6 5 1.3 8 2.4 1 .7Defects of agencies___________ ______ — ------ ------------------------ 424 49.4 180 47.3 191 56.6 53 37.6
Rough........................................... ........................................ 92 10.7 46 12.1 34 10.1 12 8.5Slippery..---------- ------------------------------------------ ----- --------- - 192 22.4 72 19.0 112 33.2 8 5.7Aged, worn, cracked, etc____________________________ ____ 76 8.8 36 9.4 27 8.0 13 9.2Other........... ..................... ............. ........................................... 64 7.5 26 6.8 18 5.3 20 14.2
Hazardous arrangement or procedure....... .................................. 375 43.6 168 44.1 126 37.4 81 57.4Unsafely stored or piled---------------- -------- - ........................... - 14 1.6 8 2.1 3 .9 3 2.1Congestion of working spaces........ ......................................... - 49 5.7 25 6.6 14 4.2 10 7.1Working under adverse weather conditions------- ---------------- 16 1.9 7 1.8 5 1.5 4 2.8Unsafe planning or layout, etc________________«__________ 21 2.4 12 3.1 9 2.7Lack of proper lifting equipment......... ................................... 46 5.4 12 3.1 5 1.5 29 20.6Lack of clear working surfaces____________________________ 160 18.6 79 20.9 56 16.5 25 17.7Exposure to poisonous vegetation.------------------------------------ 12 1.4 5 1.3 6 1.8 1 .7Other_____________ _____________ ____ ____ _____________ 57 6.6 20 5.2 28 8.3 9 6.4
Lack of proper safety equipment______________________ ______ 46 5.4 28 7.3 12 3.6 6 4.3Unclassified; insufficient data __________________-___________ 986 507 309 170
1 Figures not shown for Pacific area because of difficulty in securing sepa- 2 Percent based on classified cases only,rate data for pulpwood logging.
24
Digitized for FRASER http://fraser.stlouisfed.org/ Federal Reserve Bank of St. Louis
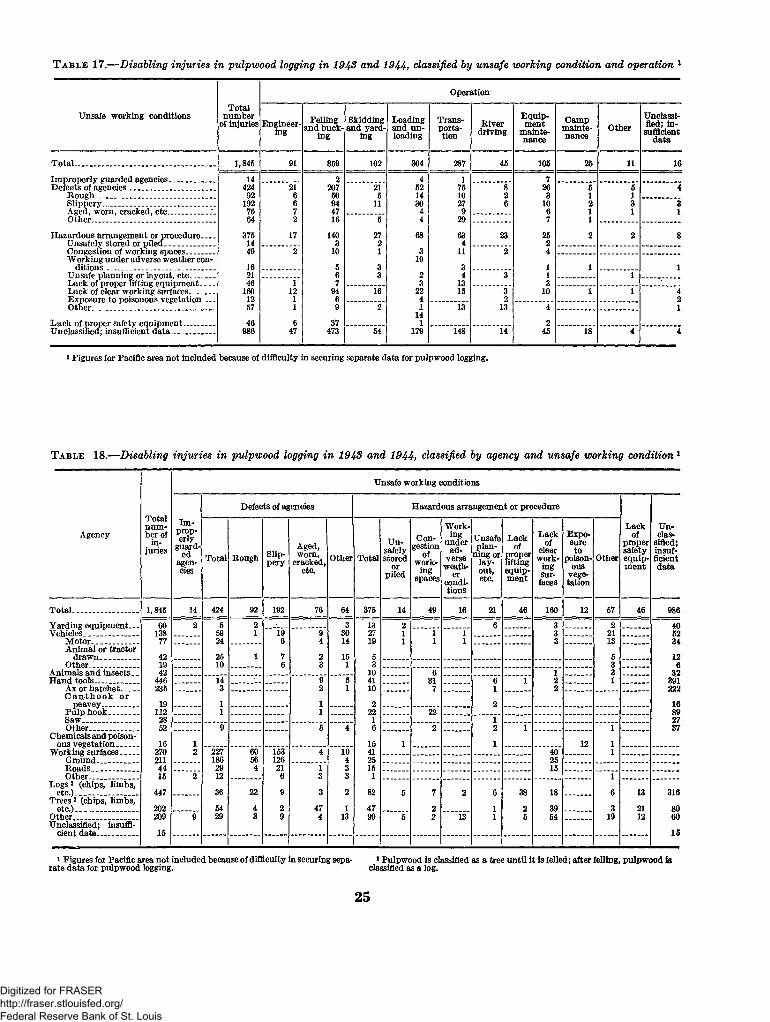
T a b l e 17 .— Disabling injuries in pulpwood logging in 1948 and 1944) classified by unsafe working condition and operation 1
Operation
Unsafe working conditionsTotal
number of injuries Engineer
ingFelling
and bucking
Skidding and yard
ingLoading and unloading
Transportation
Biverdriving
Equipment
maintenance
Campmaintenance
OtherUnclassified; insufficient
data
Total........................................................... 1,845 91 859 102 304 287 45 105 25 11 16Improperly guarded agencies__________ 14 2 4 1 7Defects of agencies.................................... 424 21 207 21 52 75 8 26 5 5 4
Bough__________________ _____ ___ 92 6 50 5 14 10 2 3 1 1Slippery............................................... 192 6 94 11 30 27 6 10 2 3 3Aged, worn, cracked, etc_________ 76 7 47 4 9 6 1 1 1Other____________________________ 64 2 16 5 4 29 7 1
Hazardous arrangement or procedure___ 375 17 140 27 68 63 23 25 2 2 8Unsafely stored or piled.............. ...... 14 3 2 4 2Congestion of working spaces______ 49 2 10 1 3 11 2 4Working under adverse weather con 19
ditions________ _________________ 16 5 3 3 1 1 1Unsafe planning or layout, etc______ 21 6 3 2 4 3 1 1Lack of proper lifting equipment___ 46 1 7 3 13 3Lack of clear working surfaces......... 160 12 94 16 22 15 3 10 1 1 4Exposure to poisonous vegetation___ 12 1 6 4 2 2Other___ _______ _________________ 57 1 9 2 1 13 13 4 1
Lack of proper safety equipment_______ 46 6 37141 2
Unclassified; insufficient data.................. 986 47 473 54 179 148 14 45 18 4 4
1 Figures for Pacific area not included because of difficulty in securing separate data for pulpwood logging.
T a b l e 18.— Disabling injuries in pulpwood logging in 1948 and 1944) classified by agency and unsafe working condition1
Unsafe working conditions
Total number of
injuries
Defects of agencies Hazardous arrangement or procedure
AgencyIm
properly
guarded
agencies
Total Bough Slippery
Aged,worn,
cracked,etc.
Other TotalUn
safelystored
orpiled
Congestion
ofwork
ingspaces
Working
underad
verseweath
erconditions
Unsafe plan
ning or layout, etc.
Lockof
properliftingequipment
Lackof
clearwork
ingsurfaces
Exposureto
poisonous
vegetation
Other
Lackof
propersafetyequipment
Unclas
sified;insufficientdata
Total........................... 1,845 14 424 92 192 76 64 375 14 49 16 21 46 160 12 57 46 986Yarding equipment—. Vehicles __________
60 2 5 2 3 13 2 6 3 2 40138 59 1 19 9 30 27 1 1 i 3 21 52
Motor. _______ 77 24 6 4 14 19 1 1 1 3 13 34Animal or tractor
drawn_________ 42 25 1 7 2 15 5 5 12Other. ................... 19 10 6 3 1 3 3 6
Animals and insects. _ 42 10 6 1 3 32Hand tools___ „ _ _ 446 14 9 5 41 31 6 1 2 1 391
Ax or hatchet____ 235 3 2 1 10 7 1 2 222C an th ook or
peavey____ ;_ 19 1 1 2 2 16Pulp hook_______ 112 1 1 22 22 89Saw........................ 28 1 i 27Other................. 52 9 5 4 6 2 2 1 1 37
Chemicals and poisonous vegetation_____ 16 1 15 1 1 12 1
Working surfaces____ 270 2 227 60 153 4 10 41 40 1Ground................. 211 186 56 126 4 25 25Roads___________ 44 29 4 21 1 3 15 15Other___________ 15 2 12 6 3 3 1 1
Logs2 (chips, limbs, etc.)- .................... 447 36 22 9 3 2 82 5 7 2 6 38 18 6 13 316
Trees2 (chips, limbs, etc.)______________ 202 54 4 2 47 1 47 2 1 2 39 3 21 80
Other,........................ 209 9 29 3 9 4 13 99 5 2 13 1 5 54 19 12 60Unclassified; insuffi
cient data _ 15 15
1 Figures for Pacific area not included because of difficulty in securing sepa- 2 Pulpwood is classified as a tree until it is felled; after felling, pulpwood israte data for pulpwood logging. classified as a log.
25
Digitized for FRASER http://fraser.stlouisfed.org/ Federal Reserve Bank of St. Louis

T able 19.— Disabling injuries in pulpwood logging in 1948 and 1944, classified by unsafe act and region1
Unsafe actTotal injuries N ortheastem region Great Lakes region Southern region
Number Percent2 Number Percent2 Number Percent2 Number Percent2
Total............................................................................................................ . 1,933 100.0 896 100.0 705 100.0 332 100.0Operating without authority....................................................................... 26 1.7 14 2.0 9 1.6 3 1.2Operating or working at unsafe speeds........................................................ 29 1.9 14 2.0 6 1.1 9 3.6Using unsafe equipment, etc......................................................................... 684 45.1 322 45.2 232 41.7 130 52.2
Unsafe use of equipment........................................................................ 17 1.1 9 1.3 5 .9 3 1.2Gripping objects insecurely, etc..... ........................................................ 179 11.8 87 12.2 64 11.5 28 11.2Carrying tools in unsafe manner............................................................ 16 1.1 7 1.0 6 1.1 3 1.2Using hand tools in unsafe manner........................................................ 462 30.4 215 30.1 153 27.5 94 37.8O ther...................................................................................................... 10 .7 4 .6 4 .7 2 .8
Unsafe loading, placing, planning, etc.......................................................... 229 15.1 128 18.0 56 10.1 45 18.1Arranging objects unsafely...................................................................... 69 4.5 38 5.3 16 2.9 15 6.0Improper planning of felling operation.................................................. 99 6.5 57 8.1 24 4.3 18 7.3Unloading objects unsafely..................................................................... 64 3.6 30 4.2 14 2.5 10 4.0Other........................................................................................................ 7 .5 3 .4 2 .4 2 .8
Taking unsafe position or posture............................................................. . 529 34.9 224 31.5 247 44.2 58 23.3Riding in unsafe position........................................................................ 23 1.5 12 1.7 8 1.4 3 1.2Exposure to falling or sliding objects...................................................... 60 4.0 35 4.9 23 4.1 2 .8Inattention to footing.............................................................................. 256 16.9 100 14.0 133 23.8 23 9.3Lifting incorrectly................................................................................... 131 8.6 53 7.5 60 10.8 18 7.2Other........................................................................................................ 59 3.9 24 3.4 23 4.1 12 4.8
Other. ............................................................................................................. 20 1.3 9 1.3 7 1.3 4 1.6Unclftssififtd; insufficient data___ ... ___ 416 185 148 83
1 Figures for Pacific area not included because of difficulty in securing sep- 2 Percent based on classified cases only, arate data for pulpwood logging.
T able 20.— Disabling injuries in pulpwood logging in 1948 and 1944, classified by unsafe act and operation 1
Unsafe actTotal number of
injuries
Operation
Engineering
Fellingand
buckingSkidding
andyarding
Loadingand
unloadingTransportation
Riverdriving
Equipment
maintenance
Campmaintenance
OtherUnclassified; in
sufficient data
Total.......................................................... 1,933 96 903 109 318 302 45 107 26 11 16Operating without authority ________ 26 2 11 6 1 3 3Operating or working at unsafe speed___ 29 1 6 3 3 14 1 i
Using unsafe equipment, etc.................... 684 44 386 19 101 82 5 30 12 4 1Tlnsafft usa of equipment 17 8 3 2 2 2Gripping objects insecurely, etc____ 179 7 51 10 55 34 2 16 4Carrying tnnls in unsafe manner 16 1 11 2 1 1Using hand tools in unsafe manner. _ 462 35 313 4 43 44 3 9 8 3other _ _ _ 10 1 3 2 2 1 1
Unsafe loading, placing, planning, etc__ 229 4 120 7 55 35 2 4 2Arranging objects unsafely_________ 69 3 19 6 20 16 4 1Improper planning of felling opera
tions - - ............... 99 1 97 1Unloading objects unsafely________ 54 2 1 32 17 1 iother - _____ ___ - 7 2 3 1 1
Taking unsafe position or posture........... 529 18 212 47 95 88 28 26 8 4 3Riding in unsafe position............... 23 1 1 2 2 15 1 1Exposure to falling or sliding objects. 60 1 18 20 10 9 2Inattention to footing......................... 256 10 125 11 38 31 15 15 7 2 2Lifting incorrectly, etc _ ____ 131 3 51 8 34 29 3 1 1 1Other____ __ ________________ 59 3 17 6 11 13 1 7 i
Other..................................................... . 20 6 1 4 2 3 3 1Unclassified; insufficient data................... 416 27 162 26 59 78 7 40 4 3 10
* Figures for Pacific area not included because of difficulty in securing separate data for pulpwood logging.
26 U. S. GOVERNMENT PRINTING OFFICE: 1948
Digitized for FRASER http://fraser.stlouisfed.org/ Federal Reserve Bank of St. Louis

Digitized for FRASER http://fraser.stlouisfed.org/ Federal Reserve Bank of St. Louis
Recent Bureau o f Labor Statistics Reports on Industrial Hazards and Working Conditions*
Injuries and accident causes in the longshore industry, 194$. Bulletin No. 764. Price 10 cents. (Out of print.)
A detailed analysis o f the hazards involved in loading and unloading ships. Includes sample safety codes and accident prevention suggestions.
Injuries and accident causes in the foundry industry, 194$* Bulletin No. 805. Price 15 cents.An analysis of foundry accidents and their causes, including accident prevention suggestions. Presents
comparisons based upon plant size, geographic location, first-aid facilities, type o f product, and departmental operations.
Injuries and accident causes in the slaughtering and meat-packing industry, 194$* Bulletin No. 855. Price 15 cents.
A detailed analysis of the hazards and of the prevailing causes of accidents in the meat industry, including comparisons based upon departmental, regional, and plantnsize factors. Also includes descriptions of typical accidents, accompanied by suggestions for the prevention o f similar occurrences.
Injuries and accident causes in the brewing industry, 1944* Bulletin No. 884. Price 15 cents.Presents a detailed account of the accident record of brewery workers during 1944, with frequency rate
comparisons based upon the operating divisions of the plants, the size o f the plants, and the geographic location of the plants. Also includes an analysis of the causes of brewery accidents and suggestions for the prevention of typical brewery accidents.
Accident-record manual for industrial plants. Bulletin No. 772. Price 10 cents.This manual contains an outline of simple and useful methods of accident recording and of the use of
such data for accident prevention. It also explains how to compute and use injury-frequency mid severity rates and how to determine the important causes o f accidents.
Work injuries in the United States during 1946* Bulletin No. 921. Price 10 cents.A collection of basic industrial injury data for each o f the major industries in the United States. Presents
national average injury-frequency and severity rates for each industry. Individual establishments may evaluate their own injury records by comparison with these data.
Impaired workers in industry. Bulletin No. 857. Price 5 cents.Graphic comparisons of the performance of impaired workers and of their unimpaired fellow workers
in terms o f output, efficiency, injury record, absenteeism, and stability on the job.
Hours of Work and Output. Bulletin No. 917. Price 35 cents.A study of the changes in efficiency, total output, absenteeism, and accidents resulting from changes
in the length of the workday or workweek.
Workmens Compensation and the Protection o f Seamen. Bulletin No. 869. Price 20 cents.A report on the financial protection afforded merchant seamen who are disabled because of injury or
disease while in the service of their vessels. Presents the status o f such seamen under both foreign and domestic legislation and examines the probable results of applying to seamen the recommendations of an Interdepartmental Committee for a workmen’s compensation act fitted to the existing rights o f merchant seamen.
♦For sale by Superintendent of Documents at prices indicated. How to order publications: Address your order to the Superintendent o f Documents, Government Printing Office, Washington 25, D . C ., with remittance in check or money order. Currency is sent at sender’s risk. Postage stamps not acceptable.
Digitized for FRASER http://fraser.stlouisfed.org/ Federal Reserve Bank of St. Louis