initiating coverage 17 apr 2017 interglobe...
TRANSCRIPT

INITIATING COVERAGE 17 APR 2017
Interglobe Aviation BUY
Clear skies!Indigo is India’s market leader in domestic aviation. Its cost leadership in a business with high fixed costs is a key advantage. Indian aviation is highly underpenetrated and provides structural growth opportunities. This, along with the narrowing price gap with alternative modes of transport, provides it with a strong growth impetus.
Higher competition in the industry has resulted in pressure on yields in the last few quarters. However, with the Industry’s load factor improving 5pp to 88% and moderate capacity addition of 14-16% expected over the next two years, pricing is expected to improve. Stable crude prices and a stronger rupee are additional tailwinds.
Indigo’s capital-light business model, which uses operating leases, allows for a higher dividend payout ratio. Its strong order pipeline of aircraft over the next decade provides growth visibility. We expect Indigo’s capacity (ASKM) to grow at 20.4% CAGR over FY16-19E. With improving yields (4.3%) in FY18, EBITDAR margin can improve by 140bps. PAT, which will fall ~20% in FY17E will bounce back, growing at 28% over FY17-19E.
Initiate coverage with a BUY. Our TP is Rs 1,210, valuing Indigo at a 16x FY19E P/E. The impact of GST on the industry remains a key monitorable.
Investment highlights Highly underpenetrated market: India is among the
most underpenetrated and fast-growing aviation
markets globally (0.08 seats per capita vs. 0.65/0.35 in Brazil/China, respectively). Having grown over 22% over the last 2 years, we expect demand to grow at a CAGR of 15-17% over the next 5 years, supported by the government’s policy incentives for regional connectivity and addition of new airports.
Cost leadership: Indigo is the cost leader, with veryefficient operations. Its strategy of running youngfleets with similar types of aircraft is the cornerstoneof its success With a delivery pipeline of 410 aircraft,its cost advantage will continue, along with improvingmarket share.
Bulk orders: Indigo’s strategy of ordering aircraft inbulk attracts huge discounts from the manufacturers.This helps in lowering ownership costs. We expecttrading profit to continue on the sale and leasebackof aircraft.
Operating lease: Globally, 40% of the fleet is underthe operating lease model now. With ample liquidityavailable, this model is now well developed, andoffers a capital-efficient option to airlines. This willremain the mainstay of funding of aircraft for Indigo.
Financial Summary (Rs mn) FY15 FY16 FY17E FY18E FY19E Revenue 139,253 161,399 188,908 235,917 277,690 EBITDAR 38,219 56,176 54,662 71,648 87,435 Net profit 12,956 19,897 15,584 20,993 25,542 Adj. EPS (Rs.) 42.2 55.2 43.2 58.3 70.9 P/E (x) 25.8 19.7 25.2 18.7 15.4 Div. Yield (%) 3.2 4.4 3.0 4.0 4.7 Source: Company, HDFC sec Inst Research
INDUSTRY AVIATION
CMP (as on 13 Apr 2017) Rs 1,090
Target Price Rs 1,210
Nifty 9,151
Sensex 29,461
KEY STOCK DATA
Bloomberg INDIGO IN
No. of Shares (mn) 361
MCap (Rs bn) / ($mn) 395/6,124
6m avg traded value (Rs mn) 342
STOCK PERFORMANCE (%)
52 Week high / low Rs 1,128/790
3M 6M 12M
Absolute (%) 23.9 16.7 5.9
Relative (%) 15.8 10.1 (9.1)
SHAREHOLDING PATTERN (%)
Promoters 85.88
FIs & Local MFs 1.11
FIIs 6.25
Public & Others 6.74
Source : BSE
Vishal Rampuria [email protected] +91-22-6171-7325
HDFC securities Institutional Research is also available on Bloomberg HSLB <GO>& Thomson Reuters

INTERGLOBE AVIATION : INITIATING COVERAGE
Undisputed leader Incorporated in 2006, Indigo is a low-cost carrier
(LCC). Its relentless focus on cost management andoperational efficiency has allowed it to stay aheadof the competition, and continuously increase itsmarket share.
Its market share increased from 14% in FY09 to 37%in FY16. The closure of Kingfisher (FY13) and issues inSpiceJet (FY14) have given Indigo a free run in theIndian aviation industry.
During FY11-16, its fleet size increased at a CAGR of22.4% to 107. Passenger growth has been equallystrong at 24%. Currently, it has a fleet of 126 aircraft.Its Passenger Load Factor (PLF) has mostly remainedin excess of 80%.
The airline focusses on the breadth of routes, whichhelps in efficient management of costs. As of 3QFY17,it runs 40 destinations (35 domestic and 5international), and has been adding only 2-3destinations each year.
It operates one class of aircraft, which helps in cost-effective repairs and overhauling, as it saves on spareparts and servicing costs. Its block hours are amongstthe highest in the domestic market at 11.4 hrs perday.
The contribution of passenger revenues stood at85%, while that of ancillary revenue was 13%.
Increasing Market Share Fleet And Destinations By Indigo
Source: DCGA, HDFC sec Inst Research Source: Company, HDFC sec Inst Research
Indigo leads in the domestic aviation market by a significant margin
Indigo has been increasing its market share every year
2532 33 37 40
5566
77
94
107
0
20
40
60
80
100
120
FY12
FY13
FY14
FY15
FY16
Destinations Aircraft
0%
5%
10%
15%
20%
25%
30%
35%
40%
45%
FY09
FY10
FY11
FY12
FY13
FY14
FY15
FY16
9MFY
17
IndiGo Jet Airways Air IndiaSpiceJet GoAir Kingfisher#Others*
Page | 2

INTERGLOBE AVIATION : INITIATING COVERAGE
PLF Mostly Above 80% For Indigo Operating Revenue Break-up (FY16)
Source: Company, HDFC sec Inst Research Source: Company, HDFC sec Inst Research
Strong Domestic Pax Growth Rate Correction In ATF Prices Supported Growth
Source: DCGA, HDFC sec Inst Research Source: DCGA, HDFC sec Inst Research
Ancillary revenue comprises advertisement income, cargo revenue, in-flight sales Correction in crude allowed the industry to cut fares, which has boosted demand
Pax Revenue
87%
Ancillary Revenue
12%
Others1%
72%
74%
76%
78%
80%
82%
84%
86%
-
5.0
10.0
15.0
20.0
25.0
30.0
35.0
40.0
45.0
FY10
FY11
FY12
FY13
FY14
FY15
FY16
ASKM (bn) RPKM (bn) Load Factor (%) - RHS
30,000
40,000
50,000
60,000
70,000
80,000
90,000
Jul-
13Se
p-13
Nov
-13
Jan-
14M
ar-1
4M
ay-1
4Ju
l-14
Sep -
14N
ov-1
4Ja
n-15
Mar
-15
May
-15
Jul-
15Se
p-15
Nov
-15
Jan-
16M
ar-1
6M
ay-1
6Ju
l-16
Sep-
16N
ov-1
6Ja
n-17
Avg Price (Rs/kl)
0%
5%
10%
15%
20%
25%
30%
35%
4045505560657075808590
FY11
FY12
FY13
FY14
FY15
FY16
9MFY
17
Passenger (Mn) Growth (Y-o-Y) (RHS)
Page | 3

INTERGLOBE AVIATION : INITIATING COVERAGE
The cost advantage: Indigo’s moat
Indigo is a cost leader in the Indian Aviation market
A majority of Indigo’s fleet (82%) is on operating lease
It runs very efficient operations, with a tight control on costs
Bulk orders
Indigo strategy of placing bulk orders helps it in procuring bargain discounts from aircraft manufacturers. Our back-of-the-envelope calculation shows that Indigo typically gets a 40-50% discount on the listed price. This leads to lower ownership costs. Indigo mostly uses the operating lease model to fund
its fleet. It sells the aircraft ordered at the current market price, then leases it back for six to seven years. This also helps it to earn trading profits. Price growth in the listed price of aircraft has also resulted in higher trading profit.
Single type of aircraft
Indigo has chosen A320 after much deliberation, with it being the next generation of aircraft from Airbus.
Its fleet comprises A320/A320Neos aircraft. Having a single type of aircraft helps in better management of repairs and overhauling costs with fewer spares, engineering costs etc. This also lowers pilot training costs.
Order Month Aircraft Qty Remarks Jun-05 A320 100 Delivered Jul-11 A320Neo 180 15 delivered till date Aug-15 A320Neo 250 To start from FY19 Source: Company
List Price in ($ Mn) CY12 CY13 CY14 CY15 CY16 CAGR
A320 88.3 91.5 93.9 97.0 98.0 2.6%
A320Neo 96.7 100.2 102.8 106.2 107.3 2.6% Source: Airbus
Ownership cost has been lowered through bulk orders. Our rough calculation shows that Indigo’s cost is 50-60% of the listed price Low repair and maintenance costs help to keep overall cost low
Page | 4

INTERGLOBE AVIATION : INITIATING COVERAGE
Domestic Airline Operators’ Snapshot
Carriers Launch
Year Type And Size of Current Fleet Order Book
Indigo 2006 A320 family : 126 410
TOTAL : 126
Jet Airways 1993
B737 family : 75+ 75
(incl. Jet Lite) ATR72 : 18, A330 : 7+
B777-300 : 4+
TOTAL – 114
Air India 1932 B747-400 : 5, B787-8 : 18 29
(incl. Air India Express, Indian Airlines, Alliance Air)
B777 family : 15+ A320 family : 61+
B737-800 : 17, CRJ700 family : 4
ATR42 : 4, ATR72 : 2
TOTAL – 132
SpiceJet 2005
B737 family : 34 190
DHC-8Q-402(NG) : 17
TOTAL – 51
Go Air 2005 A320 : 25 144
TOTAL : 25
Air Costa 2013
ERJ170-100LR : 2 50
ERJ190-100STD : 2
TOTAL : 4
Air Asia India 2014 A320 : 9 NA
TOTAL : 9 Source: Companies, Media sources
Most airlines maintain multiple classes of aircraft. Each type typically needs different kind of spares and engineers.
Page | 5

INTERGLOBE AVIATION : INITIATING COVERAGE
Young fleet
Indigo runs a young fleet which helps in lower repair and maintenance costs. Its fleet is replaced with new aircraft on expiry of the current operating lease, which is typically five to seven years.
Fleet Age Comparison
Source: Indigo RHP
Efficient operations
Indigo focusses on running its operations efficiently. Its on-time performance has been amongst the best, which has helped it create a strong brand image with passengers, especially business travellers.
Also, it focusses on the breadth of the destinations covered, rather than number of destinations. This leads to lower operational costs. Its block hours per day are amongst the highest in the domestic industry.
No frills
Indigo doesn’t offer any frills or royalty points, lounge access etc to its passengers, with a view to keep its costs low.
Unit Comparison Between Indian Players
Parameter (in Rs) Indigo SpiceJet Jet Airways
FY15 FY16 3QFY17 FY15 FY16 3QFY17 FY15 FY16 3QFY17 PLF (%) 79.8 84.0 87.3 81.4 90.6 91.2 82.8 82.1 79.6 Revenue/ASKM 3.94 3.77 3.47 3.58 3.94 3.83 4.68 4.43 4.20 Aircraft Fuel/ASKM 1.63 1.08 1.16 1.66 1.08 1.11 1.64 1.08 1.12 Employee Cost/ASKM 0.34 0.42 0.37 0.37 0.38 0.43 0.54 0.51 0.54 Ownership Cost/ASKM 0.67 0.74 0.70 0.82 1.06 0.71 0.86 0.83 0.76 Other Operating Exp./ASKM 0.90 0.92 0.94 1.41 1.52 1.33 2.09 1.95 1.85 Total Cost/ASKM 3.53 3.20 3.17 4.23 3.71 3.57 5.14 4.84 4.27 Source: Companies, HDFC sec Inst Research Comparison Of Cost With Global LCC US Cent Air Asia Indigo Ryanair CASK ex Fuel 1.84 3.03 2.0 CASK 3.20 4.74 3.4 Fleet 171 126 308 Source: Companies, HDFC sec Inst Research
Beyond six to seven years, the efficiency of the aircraft comes down, leading to higher operational costs (Higher fuel consumption, and repair and maintenance cost) The other operating cost component is significantly lower for Indigo, which is mainly attributed to lower maintenance cost and better cost management Spicejet has been boosting its revenue through higher PLF, while for Jet Airways, 60% is from international business which has better pricing Cost may not strictly comparable due to geographical difference in cost like landing charges, pilot cost, funding mix etc
2.7
3.2
3.9
4.1
5.9
8.9
0 2 4 6 8 10
AirAsia
Indigo
GoAir
Spicejet
Jet
Air India
Average fleet age (Yr)
Page | 6

INTERGLOBE AVIATION : INITIATING COVERAGE
Strong orderbook Indigo, which has a fleet size of 126 aircraft, has
pending orders of over 410 A320Neos with Airbus. These will be delivered over the next decade. Indigo follows a strategy of ordering aircraft in bulk, allowing it receive hefty discounts from Airbus. Further, the aircraft is financed through an operating lease of six to seven years by the sale and leasehold model.
This huge fleet expansion would continue to give Indigo an advantage over the competition. Over FY16-19E, Indigo’s fleet is expected to increase at a CAGR of 17% to 171, net of replacements. We believe that this fleet expansion would allow Indigo to further increase its market share from the current 42% to more than 50% by FY20.
ASKM is expected to grow at a CAGR of 20.4% on fleet expansion.
Outstanding Aircraft Orders Order Month Aircraft Qty Remarks
Jul-11 A320Neo 180 15 delivered till
date
Aug-15 A320Neo 250 To start from
FY19 Source: Company, HDFC sec Inst Research
Indigo’s Net Fleet Trend
Source: Company, HDFC sec Inst Research
Temporary glitch
Indigo has been facing delays in the delivery of A320Neo aircraft, owing to an issue with the engines. The aircraft are being fitted with Pratt and Whitney (PW) engines. However, these have been facing technical issues in the last few months. The engine supplier is working on resolving these over the next few months. We believe that this delay of additions to the fleet is short term, and plans for the medium to long-term remain intact.
Indigo has been aggressive in adding to its fleet size through large bulk orders The A320neo is up to 15% more energy-efficient than A320, and would help in lower fuel costs for Indigo
3955
6677
94107
133151
171
0
20
40
60
80
100
120
140
160
180
FY11
FY12
FY13
FY14
FY15
FY16
FY17
E
FY18
E
FY19
E
Fleet Size
Page | 7

INTERGLOBE AVIATION : INITIATING COVERAGE
Indian aviation: Great scope India’s domestic passenger (pax) traffic in revenue-
passenger-KMs (RPK) is expected to grow at 15-17% CAGR over FY16-20E.
As a LCC with a focussed strategy, Indigo is expected to increase its market share further.
Large potential market
The Indian aviation sector has had an impressive growth trajectory in the past decade (domestic pax traffic grew at ~10% CAGR.) Despite this, India remains a significantly underpenetrated market (0.08 seats per capita CY14 vs. 0.65/0.37/0.35 in Brazil/Russia/China respectively).
India is expected to grow faster than China, APAC and other developed countries (IMF’s real GDP forecast is 7.1% for India vs. 6.4/4.5% CAGR for China/APAC over CY14-19E). Domestic pax traffic is expected to show strong growth, considering 1.8x RPK vs. real GDP over the trailing decade.
Since FY15, crude prices have corrected 45% to USD55 per bbl. The outlook is benign, given the increasing supply of Shale Gas, drop in the cost of alternative energy, especially solar etc. As 30-40% of the total cost can be attributed to ATF, the sharp drop in its prices has allowed carriers to cut fares. Average fares are down 15-20% from FY15 levels. This has been the biggest driver of growth in the passenger traffic in recent years.
The narrowing gap between the fares of railways and airlines (as the Indian Railways rationalises AC fares, attempting to reduce passenger traffic losses), will increase demand for domestic aviation. Currently, the gap between the average LCC fare and 2nd class AC
train (one month advance booking) is upto ~35%. We believe that time saving in air travel also contributes to the growth in demand.
The new aviation policy (mainly RCS) will also encourage better connectivity to Tier-2 and Tier-3 cities via lower indirect taxation on ATF and other incentives. Many state governments, in their recent budgets, have announced a cut in VAT on ATF for the regional routes.
The number of domestic passengers is growing at a CAGR of 22% in the last two years, driven by very competitive fares. We expect domestic pax traffic to grow at a 15-17% CAGR between FY16 and FY20E owning to (1) Competitive airfares, (2) Significant under-penetration (3) Strong real GDP growth and (4) Policy support from the govt.
LCCs are gaining market share, and are best suited for emerging economies because of attractive ticket prices vs. FSCs. Since Indigo is a LCC with a leadership position, it is expected to be a key beneficiary of the global trend of LCCs gaining market share, as compared to full service airlines. The shift is supported by lower operational costs like aircraft costs, faster turnaround time and lower running costs etc. We expect Indigo’s market share to increase from the current 40% to 50% by FY20E. The reason for this is that a strong delivery pipeline translates into higher market share. Downside risks arise from any unexpected delay in fleet addition, inefficiency in fleet utilisation and pricing war in the sector.
The flight slot is increasingly becoming scarce at airports like Mumbai, Delhi, Pune etc. Incumbents like Indigo will enjoy a competitive advantage.
The underpenetrated Indian aviation market has a huge growth potential based on high correlation with real GDP, increasing tourism and optimism about the civil aviation policy India’s fleet size is expected to increase on a pickup in demand and taking into account the current order-book Low cost carriers (LCC) scored over Fully service carriers owing to lower operational cost
Page | 8

INTERGLOBE AVIATION : INITIATING COVERAGE
LCCs Gaining Ground (Market Share) Annual Seat Per Capita (CY14)
Source: Indigo RHP, CAPA Source: Indigo RHP, CAPA Strong Growth In Recent Times Drop In ATF Price Has Helped
0%
5%
10%
15%
20%
25%
30%
35%
4045505560657075808590
FY11
FY12
FY13
FY14
FY15
FY16
9MFY
17
Passenger (Mn) Growth (Y-o-Y) (RHS)
Source: DCGA, HDFC sec Inst Research Source: IOC, HDFC sec Inst Research
Globally, LCC has been increasing its market share, and India is no different. Passenger growth has been strong in recent times due to a cut in airfares and increased travel cost of railways Growth is expected to moderate to 14-15% over the next 2-3 years owing to a higher base
45.6% 49.8%60.8% 63.4% 62.2%
63.3%
0%
20%
40%
60%
80%
100%
FY11
FY12
FY13
FY14
FY15
FY16
FSC LCC
0.080.35 0.37 0.41 0.48 0.65
1.03 1.12
2.59
4.79
0.00
1.00
2.00
3.00
4.00
5.00
6.00
Indi
a
Chin
a
Rus
sia
Indo
nesi
a
Thai
land
Bra
zil
Mal
aysi
a
Japa
n
USA
Nor
way
30,000
40,000
50,000
60,000
70,000
80,000
90,000
Jul-
13Se
p-13
Nov
-13
Jan-
14M
ar-1
4M
ay-1
4Ju
l-14
Sep-
14N
ov-1
4Ja
n-15
Mar
-15
May
-15
Jul-
15Se
p-15
Nov
-15
Jan-
16M
ar-1
6M
ay-1
6Ju
l-16
Sep-
16N
ov-1
6Ja
n-17
Avg Price (Rs/kl)
Page | 9

INTERGLOBE AVIATION : INITIATING COVERAGE
Narrow Price Gap With Other Modes Falling Fares Have Supported Growth
Route Mode Fare# (Rs) Duration
(In Hrs)
Mum
bai-
Del
hi
Airfare (LCC) 4,500 2 Train Fare 1 AC 4,755 15.5 2 AC 4,105 15.5 3 AC 2,750 15.5
Chen
nai-
Mum
bai Airfare (LCC) 2,400 1.75
Train Fare 1 AC 3,700 23 2 AC 2,160 23 3 AC 1,495 23
# One month advance booking Source: Travel websites, HDFC sec Inst Research
-20%
-10%
0%
10%
20%
30%
40%
FY14
FY15
FY16
1QFY
17
2QFY
17
3QFY
17
Passenger Growth Change in Fares
Source: Indigo, HDFC sec Inst Research
Regional connectivity scheme Apart from the top 50 airports, air connectivity in
India is poor. The challenge is low demand, along with lack of infrastructure. To give a fillip to the underserved and neglected regions, the Civil Ministry came out with a Regional Connectivity Scheme (RCS), wherein operators made their subsidy bids to offer tickets at lower prices to run these routes. Key highlights are -
o 50% of the seats would be provided at Rs 2,500 per passenger for routes involving less than an hour’s travel time. The government would provide a viability funding gap to develop the route, based on the bid.
o States which are part of the scheme would cut ATF rates to 1%.
o The operator will get exclusivity of the routes under the scheme for three years.
o Waiver of airport charges.
According to recent media reports, 128 routes under the RCS have been awarded to five operators, outlaying a viability funding gap spend of Rs 2bn per annum. The operators are the Air India subsidiary Airline Allied Services, Air Deccan, Air Odisha, SpiceJet and Turbo Megha. They would be operating
19-78 seater aircraft.
GST: Key monitorable Under the present tax structure, service tax is levied
on airline tickets after an abatement of 60/40% for the economy/business class tickets respectively. Input credit on excise duty paid on ATF is not available. Under the proposed GST system, petroleum products would be outside the GST taxation regime. This means the current structure of zero-input tax continues. However, there is no clarity on whether the abatement provided in the current tax structure would continue with low tax rates. This remains a key montiorable.
Airlines provide more comfort and allow speedy travel vs. rails/roadways. We expect a gradual pax migration from railways to airlines. The recent surge in pricing introduced for faster trains (Rajdhani, Duranto & Shatadbi) has further narrowed the price difference The RCS scheme augurs for smaller airports. However, Indigo is currently out of the scheme, as it runs a larger fleet.
Page | 10
INTERGLOBE AVIATION : INITIATING COVERAGE
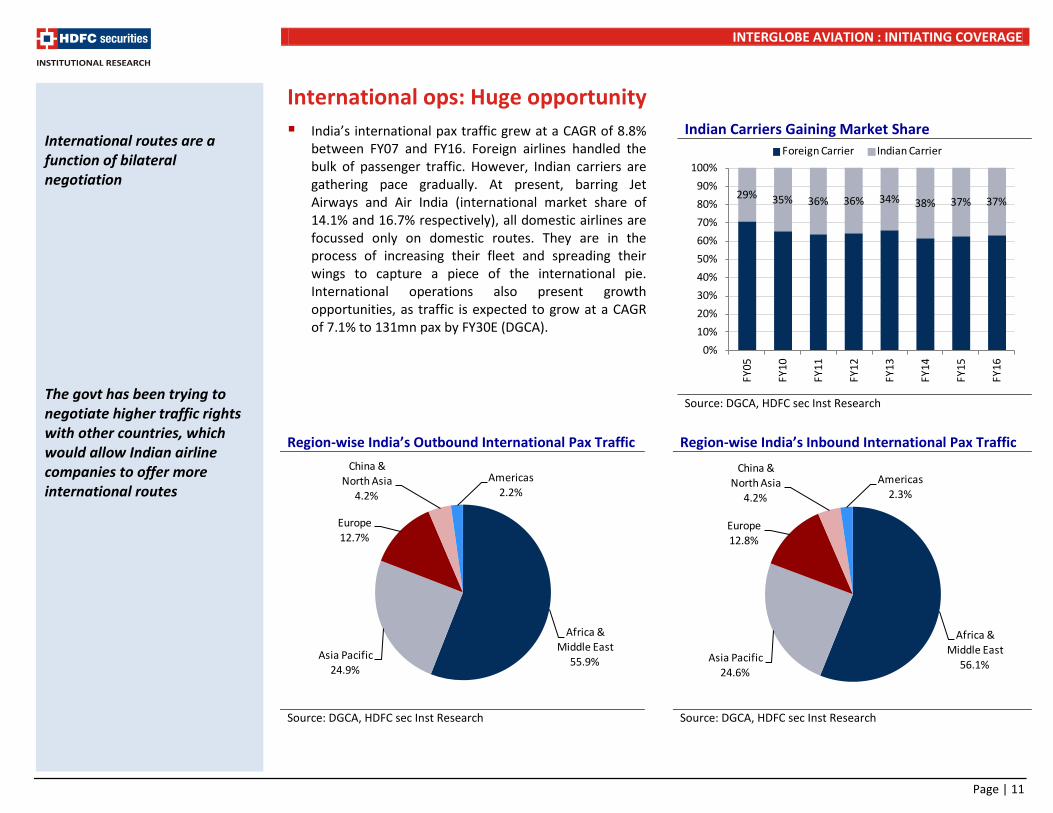
International ops: Huge opportunity India’s international pax traffic grew at a CAGR of 8.8%
between FY07 and FY16. Foreign airlines handled the bulk of passenger traffic. However, Indian carriers are gathering pace gradually. At present, barring Jet Airways and Air India (international market share of 14.1% and 16.7% respectively), all domestic airlines are focussed only on domestic routes. They are in the process of increasing their fleet and spreading their wings to capture a piece of the international pie. International operations also present growth opportunities, as traffic is expected to grow at a CAGR of 7.1% to 131mn pax by FY30E (DGCA).
Indian Carriers Gaining Market Share
Source: DGCA, HDFC sec Inst Research
Region-wise India’s Outbound International Pax Traffic
Region-wise India’s Inbound International Pax Traffic
Source: DGCA, HDFC sec Inst Research Source: DGCA, HDFC sec Inst Research
29% 35% 36% 36% 34% 38% 37% 37%
0%
10%
20%
30%
40%
50%
60%
70%
80%
90%
100%
FY05
FY10
FY11
FY12
FY13
FY14
FY15
FY16
Foreign Carrier Indian Carrier
Africa & Middle East
55.9%Asia Pacific24.9%
Europe12.7%
China & North Asia
4.2%
Americas2.2%
Africa & Middle East
56.1%Asia Pacific
24.6%
Europe12.8%
China & North Asia
4.2%
Americas2.3%
International routes are a function of bilateral negotiation The govt has been trying to negotiate higher traffic rights with other countries, which would allow Indian airline companies to offer more international routes
Page | 11

INTERGLOBE AVIATION : INITIATING COVERAGE
Yield pressure to ease, profitability to improve Yield has been under pressure owing to higher
capacity growth (ASKM) and load factor-led boost to the revenues
Yields is expected to improve from 1QFY18
Competitive pricing has hit profitability
Despite a pax growth of over 22% in the last two years, the yield for the industry has been under pressure, as most players have been focusing on increasing their passenger load factor.
However, with an industry PLF of 87-88% and expectations of a supply addition of 14-16% over the next two years, we expect yield and profitability to improve.
Indigo’s fleet size is expected to increase at a CAGR of 16.9% to 171 by FY19
We expect Indigo’s yield to drop from Rs 3.91 to Rs 3.51 in FY17, then gradually improve to Rs 3.75 in FY19
The gross margin per ASKM is expected to drop in FY17 to Rs 2.26 from Rs 2.65 in FY16. Based on our assumption of improvement in yield and benign oil prices and a stable currency, the gross margin is expected to improve to Rs 2.5 in FY19.
The EBITDAR margin will contract 590bps to 28.9% in FY17, then improve to 31.5% in FY19
Industry Load Factor Has Improved Due Pax Growth Yield Under Pressure In Last Few Quarters
Source: DCGA, HDFC sec Inst Research Source: Company, HDFC sec Inst Research
Fleet expansion, along with strategy to boost the load factor, has resulted in lower fares. The gross margin (RASK-fuel cost per ASKM) is expected to improve in FY18 Indigo’s yield is expected to improve in FY18, after declining in FY17. 1.0
1.5
2.0
2.5
3.0
3.5
3.0
3.2
3.4
3.6
3.8
4.0
4.2
4.4
4.6
FY15
1QFY
16
2QFY
16
3QFY
16
4QFY
16
1QFY
17
2QFY
17
3QFY
17
FY18
E
FY19
E
Yield per RASK Gross Margin per ASKM(RHS)
Rs Rs
60%
65%
70%
75%
80%
85%
90%
95%
Apr
-11
Sep-
11
Feb-
12
Jul-
12
Dec
-12
May
-13
Oct
-13
Mar
-14
Aug
-14
Jan-
15
Jun-
15
Nov
-15
Apr
-16
Sep-
16
Feb-
17
Page | 12

INTERGLOBE AVIATION : INITIATING COVERAGE
PAT to grow at a CAGR of 28% over FY17-19E Given the improvement in profitability, we expect
earnings to improve and grow in FY18. This follows a drop of 20% FY17. During FY17-19E, PAT is expected to grow at a CAGR of 28% to Rs 25.5bn in FY19. Given
Indigo’s low capital requirement and policy of distributing profit among the shareholders, we expect this to continue after listing too. We have built in a payout ratio of 70-75%.
Trend In Revenue OPASK And EBITDAR Margin Trends
0.29
0.05
0.41
0.57
0.24 0.33 0.38
24.4%19.6%
27.4%
34.8%
28.9% 30.4% 31.5%
0%
5%
10%
15%
20%
25%
30%
35%
40%
-
0.10
0.20
0.30
0.40
0.50
0.60
0.70
FY13
FY14
FY15
FY16
FY17
E
FY18
E
FY19
E
OPASK EBITDAR Margin % - RHS
Rs
Source: Company, HDFC sec Inst Research *revenue per ASKM Source: Company, HDFC sec Inst Research
Trend In PAT Payout To Remain High
0.0
10.0
20.0
30.0
40.0
50.0
60.0
70.0
80.0
-
5
10
15
20
25
30
FY15
FY16
FY17
E
FY18
E
FY19
E
PAT EPS - RHS
Rs bn
65%
70%
75%
80%
85%
0.0
10.0
20.0
30.0
40.0
50.0
60.0
FY15
FY16
FY17
E
FY18
E
FY19
E
DPS Pay Out Ratio - RHS
Source: Company, HDFC sec Inst Research *revenue per ASKM Source: Company, HDFC sec Inst Research
Profitability to improve on higher revenue growth and improvement in margins Operating profit (RASK-CASK) to improve in FY18 Payout is expected to be 70-80%, given low capital requirements
39 5566 77
94107
133151
171
0
50
100
150
200
250
300
FY11
FY12
FY13
FY14
FY15
FY16
FY17
E
FY18
E
FY19
E
Revenue (Rs bn) Fleet Size (Nos)
Page | 13

INTERGLOBE AVIATION : INITIATING COVERAGE
Key Assumptions FY15 FY16 FY17E FY18E FY19E Fleet Size 94 107 133 151 171 ASKM (in mn) 35,327 42,826 55,058 65,954 74,768 YoY Growth (%) 17.6% 21.2% 28.6% 19.8% 13.4% Load Factor 80% 84% 85% 85% 86% RPKM (in mn) 28,177 35,968 46,740 55,990 64,300 YoY Growth (%) 22.1% 27.6% 29.9% 19.8% 14.8% Yield (Rs) 4.36 3.91 3.51 3.66 3.75 YoY Growth (%) 1.5% (10.4%) (10.2%) 4.3% 2.5% Operating Revenue (Rs mn) 139,253 161,399 187,808 234,792 276,540 YoY Growth (%) 25.3% 15.9% 16.4% 25.0% 17.8%
RASK (Rs) 3.94 3.77 3.43 3.58 3.71 Aircraft Fuel/ASKM 1.63 1.12 1.17 1.19 1.20 Employee Cost/ASKM 0.34 0.42 0.37 0.38 0.39 Ownership Cost/ASKM 0.67 0.74 0.75 0.75 0.78 Other Operating Exp/ASKM 0.90 0.92 0.90 0.92 0.96 CASK (Cost per ASKM) 3.53 3.20 3.19 3.24 3.33 Ex-fuel CASK 1.90 2.08 2.02 2.05 2.13 OPASK (OP per ASKM) 0.41 0.57 0.24 0.34 0.39 Source: Company, HDFC sec Inst Research OPASK is Operating profit per ASKM
Page | 14

INTERGLOBE AVIATION : INITIATING COVERAGE
Operating lease model: Key positiveTrading profit on sale and leaseback
Indigo follows a strategy of ordering aircraft in bulk, which gives it a huge pricing advantage over other airlines. At the time of delivery, a sale and leaseback transaction at market price allows Indigo to earn the
difference in prices, which gets amortised over the operating period of the lease. This has contributed significantly to earnings. As the A320 class is the next generation of aircraft from Airbus which has higher fuel efficiency (upto 15%), we don’t expect any significant risk to earnings from such transactions.
Trading Has Contributed To Significant Profit
FY13 FY14 FY15 FY16
Incentives adjusted against lease Rent 3,588 3,607 3,553 3,566 Other operating income 111 373 589 755 Total 3,699 3,980 4,143 4,321 PBT 9,873 4,736 18,357 28,290 % of PBT 37% 84% 23% 15% Source: Company, HDFC sec Inst Research
Accounting Treatment Of Incentive For Sale And Leaseback Incentive Lease type Explanation Treatment
Cash Finance
lease
The Company receives non-refundable incentives from manufacturers in connection with the acquisition of aircraft and engines. In case of owned aircraft or aircraft under finance lease, incentives are recorded as a reduction to the cost of related aircraft and engines.
Decrease the cost of aircraft
Cash Operating
Lease
Incentives are deferred and reduced from the operating lease rentals on a straight line basis over the period of the related lease. In case of return of an aircraft before the expiry of the lease term, the unamortised balance of deferred incentive is recorded in the Statement of Profit and Loss.
Decrease rental exp shown in P&L for the lease term
Cash (from engine manufacturer)
Finance lease
Where the aircraft is held under finance lease, the incentives are deferred and recognised under the head ‘Other operating revenue’ in the Statement of Profit and Loss, on a straight line basis over the remaining lease period of the related lease.
The incentives are deferred and recognised under the head ‘Other operating revenue’ in P&L on SLM basis
Cash (from engine manufacturer)
Operating Lease
Incentives are deferred and reduced from the lease rentals on a straight line basis over the remaining lease period of the related lease.
Decrease rental exp shown in P&L for the lease term
Source: Company, HDFC sec Inst Research
Funding through the operating model helps in efficient allocation of capital Our rough calculation shows a profit of USD 7-10mn per aircraft on sale and leaseback Trading profit is real, owing to discounts during bulk sourcing, and is not a mere accounting entry
Page | 15

INTERGLOBE AVIATION : INITIATING COVERAGE
Why the operating lease model? The operating model has evolved over the last
decade driven by the glut in global liquidity, which has led to a sharp drop in global bond yields. Given the dip in yields, increasingly pension funds, family offices have turned towards aircraft financing, as it allows them to earn a higher yield (8 to 10%). Currently, 40% of the global commercial aircraft are under an operating lease model now. We also spoke to a lessor to gauge more insight on this model.
a) Lessors look for 8-10% equity IRR on investments made to finance the aircraft.
b) The lessor carries the risk of deployment of the aircraft on expiry of the lease period, typically
five to eight years. This calls for the need for expertise of the aircraft leasing business.
c) It’s a value proposition for the lessee, as it provides flexibility of aircraft along with low capital requirement.
d) Higher interest rates would increase the lease rate for the airline companies.
Top Lessor Fleet(Owned/ under mgt) GECAP 1,608 AerCap 1,279 BBAM 413 SMBC Aviation Capital 393 CIT Aerospace 313 Source: Airfinance Journal
$ mn Amt $ mn Year0 Year1 Year2 Year3 Year4 Year5 Year6 Airline cost 50 Equity -15 Equity 15 Lease Income 5.2 5.2 5.2 5.2 5.2 5.2 Debt 35 Interest paid -1.4 -1.4 -1.4 -1.4 -1.4 -1.4 Debt Cost 4.0% Scrap Value @60% 30 Lease Rate 10.70% Debt (Bullet repayment) -35 Target Equity IRR 8 to 10% Net Cash flow -15.0 4.0 4.0 4.0 4.0 4.0 -1.1 IRR 8.3% Source: Industry Sources, HDFC sec Inst Research
The operating lease model allows the airline company to be asset light 40% of the global commercial fleet is estimated to be under the operating lease model Indigo’s recent sale and leaseback transaction has been funded by Avolon, the Chinese lessor
Page | 16
INTERGLOBE AVIATION : INITIATING COVERAGE
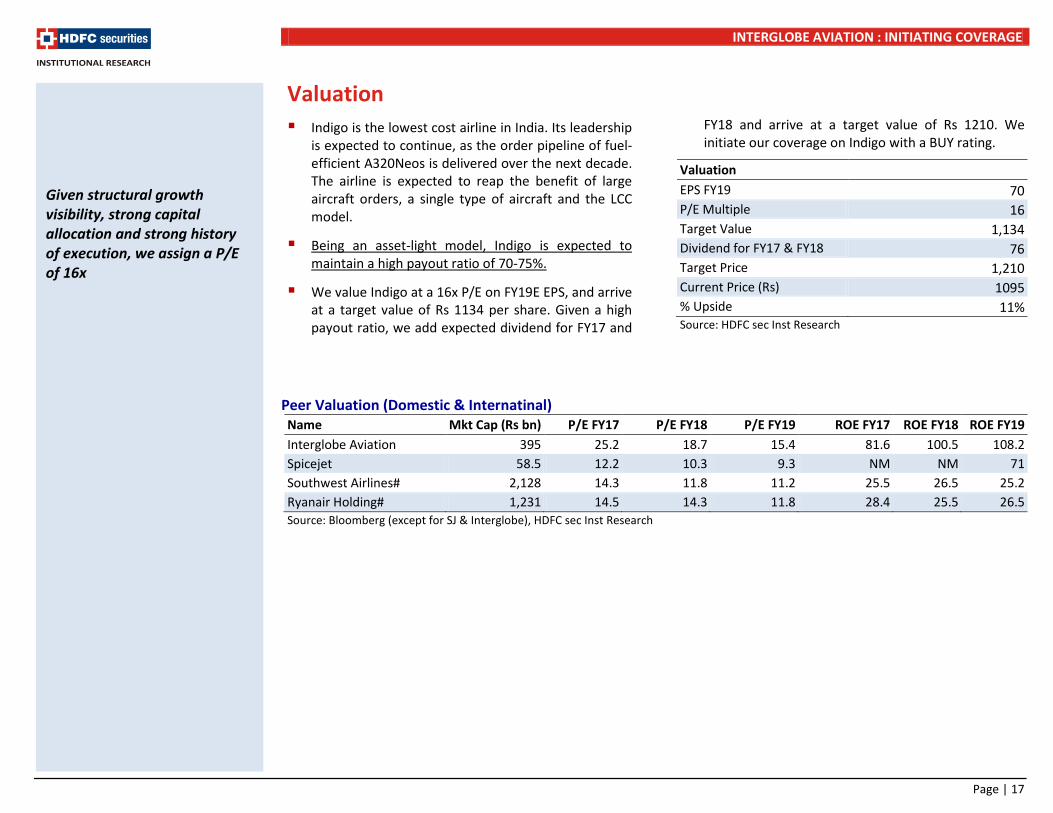
Valuation Indigo is the lowest cost airline in India. Its leadership
is expected to continue, as the order pipeline of fuel-efficient A320Neos is delivered over the next decade. The airline is expected to reap the benefit of large aircraft orders, a single type of aircraft and the LCC model.
Being an asset-light model, Indigo is expected to maintain a high payout ratio of 70-75%.
We value Indigo at a 16x P/E on FY19E EPS, and arrive at a target value of Rs 1134 per share. Given a high payout ratio, we add expected dividend for FY17 and
FY18 and arrive at a target value of Rs 1210. We initiate our coverage on Indigo with a BUY rating.
Valuation
EPS FY19 70 P/E Multiple 16 Target Value 1,134 Dividend for FY17 & FY18 76 Target Price 1,210 Current Price (Rs) 1095 % Upside 11% Source: HDFC sec Inst Research
Peer Valuation (Domestic & Internatinal) Name Mkt Cap (Rs bn) P/E FY17 P/E FY18 P/E FY19 ROE FY17 ROE FY18 ROE FY19 Interglobe Aviation 395 25.2 18.7 15.4 81.6 100.5 108.2 Spicejet 58.5 12.2 10.3 9.3 NM NM 71 Southwest Airlines# 2,128 14.3 11.8 11.2 25.5 26.5 25.2 Ryanair Holding# 1,231 14.5 14.3 11.8 28.4 25.5 26.5 Source: Bloomberg (except for SJ & Interglobe), HDFC sec Inst Research
Given structural growth visibility, strong capital allocation and strong history of execution, we assign a P/E of 16x
Page | 17

INTERGLOBE AVIATION : INITIATING COVERAGE
Key risks and sensitivity analysis Substantial risk of fuel prices: Currently, all airlines
are enjoying the benefit of lower crude oil prices (aircraft fuel accounts for ~30% of opex vs. 41% in FY15). As airlines have high earnings sensitivity to oil prices, a sudden jump will affect overall profitability.
Forex risk: Any adverse currency movement will result in a jump in costs for Indigo, as 70-80% of these are directly or indrectly linked to foreign currencies.
Competition: Airlines are a high fixed-cost business, with limited pricing power. High competition among incumbents or the entry of new player(s) can lead to a drop in yields and profitability.
Regulations: The government has announced a new Aviation Policy to boost passeneger traffic with the RCB scheme. However, this will take substantial time
to be successfully implemented. Any changes in the policy can impact the industry’s profitability.
Taxes: The industry is overburdened with high taxes on ATF, along with other charges like service tax on air tickets etc. Details of taxation of the sector under GST are not clear, and remain a key monitorable.
Infrastructure: Capacity augumentation at major airports like Mumbai and Pune, and the inception of new airports are both critical factors for the pax traffic to grow. The government has identified investment in new airports along with capacity augmentation to implement growth. Any delay in execution of these plans is another potential risk.
Equity supply overhang: Non-promoter shareholding stands at 15%, and the same needs to be increased to 25% over the next 18 months.
FY19 EPS Sensitivity With Load Factor And Yield
FY19 EPS Sensitivity With Crude Oil And Currency
Passenger Yield (Rs)
3.59 3.67 3.75 3.83 3.91 3.99
Lo
ad
Fact
or(%
)
84% 48.0 55.4 62.7 70.0 77.4 84.7 85% 51.9 59.4 66.8 74.2 81.6 89.1
86% 55.9 63.4 70.9 78.4 85.9 93.4
87% 59.8 67.4 75.0 82.6 90.2 97.8 88% 63.7 71.4 79.1 86.7 94.4 102.1
Crude Price (USD/bbl)
51 53 55 57 59 61
Rs
/USD
65 95.3 85.6 75.8 66.1 56.4 46.6 66 92.9 83.0 73.2 63.3 53.5 43.7
67 90.4 80.5 70.5 60.6 50.7 40.7
68 87.9 77.9 67.9 57.8 47.8 37.8 69 85.4 75.3 65.2 55.1 44.9 34.8
Source: HDFC sec Inst Research Source: HDFC sec Inst Research
Fuel price accounts for 30-35% of cost. Aviation is a high fixed cost business, and a low load factor would adversely impact profitability Indigo is susceptible to currency movement, as a majority of costs (65-70 %) are linked to movements in the USD
Page | 18

INTERGLOBE AVIATION : INITIATING COVERAGE
Company background Indigo is a LCC that enjoys a ~39% share of domestic
air traffic. It mainly focusses on domestic travel, with 35 domestic and five international destinations.
85% of the airline’s revenue comes from passenger tickets, while the remaining is generated from ancillary services including cargo, extra baggage charges, ticket cancellations, advertisements, in-flight food, etc.
Currently, Indigo has 126 aircraft (3QFY17) in its fleet, with outstanding orders to purchase over 400 aircraft by 2026.
82% of the aircraft are on an operating lease model, and the rest are company-owned or on a financial lease model.
Indigo’s ASKM And RPKM Trend
Indigo’s Domestic & International Pax Trend (mn)
Source: Company, HDFC sec Inst Research Source: Company, HDFC sec Inst Research
Key Management And Promoter Profile Name Designation Age (Approx) Professional Details
Aditya Ghosh President & Whole time Director 41 He is a Bachelor of Law and heads the operations and management of the company.
Rahul Bhatia Non-Executive Promoter Director 56 Bhatia has more than 25 years of experience in the travel industry. He holds an Electrical Engineering degree.
Rakesh Gangwal Non-Executive Promoter Director 63 He has over 30 years experience in the airline industry including a stint as CEO of US Airways.
Source: Company, HDFC sec Inst Research
Indigo has 42% market share with a fleet size of 126 in 3QFY17
72%
74%
76%
78%
80%
82%
84%
86%
-
5.0
10.0
15.0
20.0
25.0
30.0
35.0
40.0
45.0
FY10
FY11
FY12
FY13
FY14
FY15
FY16
ASKM (bn) RPKM (bn) Load Factor (%) - RHS
0
5
10
15
20
25
30
35
FY10
FY11
FY12
FY13
FY14
FY15
FY16
Indigo Domestic Pax Carried (mn)
Indigo International Pax carried (mn)
Rakesh Gangwal, one of the promoters, has substantial experience in the US Aviation Industry
Page | 19

INTERGLOBE AVIATION : INITIATING COVERAGE
Income Statement Year ending Mar (Rs mn) FY15 FY16 FY17E FY18E FY19E Net Revenues 139,253 161,399 188,908 235,917 277,690 Growth (%) 25.3 15.9 17.0 24.9 17.7 Aircraft Fuel 57,485 47,793 64,375 78,552 89,375 Employee Expenses 11,887 17,899 20,473 24,978 29,401 Lease Rental 19,522 26,122 33,068 41,430 50,879 Other Operating Expenses 31,662 39,530 49,397 60,738 71,478 EBITDA 18,697 30,055 21,594 30,219 36,556 EBITDA Margin (%) 13.4 18.6 11.4 12.8 13.2 EBITDA Growth (%) 269.0 60.7 (28.2) 39.9 21.0 EBITDAR 38,219 56,176 54,662 71,648 87,435 EBITDAR Margin (%) 27.4 34.8 28.9 30.4 31.5 Depreciation 3,022 5,031 5,143 5,520 5,590 EBIT 15,675 25,024 16,451 24,698 30,966 Other Income (Incl. EO Items) 3,838 4,614 6,314 5,985 6,706 Interest 1,155 1,349 3,039 2,692 2,196 PBT 18,357 28,290 19,727 27,991 35,475 Tax (Incl Deferred) 5,402 8,392 4,143 6,998 9,933 RPAT 12,956 19,897 15,584 20,993 25,542 EO (Loss) / Profit (Net Of Tax) - - - - - APAT 12,956 19,897 15,584 20,993 25,542 APAT Growth (%) 173.1 53.6 (21.7) 34.7 21.7 Adjusted EPS (Rs) 42.2 55.2 43.2 58.3 70.9 EPS Growth (%) 173.1 30.8 (21.7) 34.7 21.7
Source: Company, HDFC sec Inst Research
Balance Sheet Year ending March (Rs mn) FY15 FY16 FY17E FY18E FY19E SOURCES OF FUNDS
Share Capital - Equity 344 3,604 3,604 3,604 3,604 Reserves 3,863 14,739 16,256 18,299 21,707 Total Shareholders Funds 4,207 18,343 19,859 21,902 25,310 Total Debt 39,262 32,008 28,733 25,482 22,254 Other Long Term Liabilities 20,170 24,722 32,285 37,520 43,337 Deferred Tax (net) 4,091 5,180 5,180 5,180 5,180 Long Term Provisions & Incentives
13,840 12,589 16,822 19,651 22,856
TOTAL SOURCES OF FUNDS 81,570 92,842 102,878 109,735 118,938 APPLICATION OF FUNDS
Net Block 48,760 46,955 42,862 38,392 33,352 CWIP & Intangible Assets under Development
5 320 320 320 320
Investments 5,168 9,741 9,741 9,741 9,741 LT Loans & Advances 11,181 11,931 13,908 15,278 16,799 Fixed Deposits 16,056 14,978 14,978 14,978 14,978 Total Non-current Assets 81,170 83,924 81,810 78,709 75,190 Inventories 1,306 1,267 1,454 1,751 1,985 Debtors 1,046 1,571 1,294 1,616 1,902 Other Current Assets 2,612 3,993 3,882 4,848 5,706 Cash & Equivalents 19,994 37,187 48,265 64,694 83,412 Short Term Loans and Advances
1,556 2,249 2,588 3,232 3,804
Total Current Assets 26,513 46,267 57,483 76,140 96,809 Creditors 4,755 7,412 6,211 7,756 9,130 Other Current Liabilities, Provns & Incentives
21,358 29,937 30,203 37,358 43,931
Total Current Liabilities 26,113 37,349 36,414 45,114 53,061 Net Current Assets 400 8,917 21,069 31,026 43,748 TOTAL APPLICATION OF FUNDS
81,570 92,842 102,878 109,735 118,938
Source: Company, HDFC sec Inst Research
Page | 20

INTERGLOBE AVIATION : INITIATING COVERAGE
Cash Flow Statement Year ending Mar (Rs mn) FY15 FY16 FY17E FY18E FY19E Reported PBT 18,465 28,290 19,727 27,991 35,475 Non-operating & EO items (2,499) (1,222) (6,314) (5,985) (6,706) Interest expenses 1,037 1,157 3,039 2,692 2,196 Depreciation 3,022 5,031 5,143 5,520 5,590 Working Capital Change 7,765 3,497 (1,073) 6,471 5,997 Tax Paid (3,951) (5,761) (4,143) (6,998) (9,933) OPERATING CASH FLOW ( a ) 23,839 30,991 16,378 29,692 32,619 Capex (10,170) (2,318) (1,050) (1,050) (550) Free cash flow (FCF) 13,669 28,672 15,328 28,642 32,069 Investments - - 2,255 1,460 1,684 Non-operating Income 1,303 3,286 6,314 5,985 6,706 INVESTING CASH FLOW ( b ) (8,868) 966 7,520 6,394 7,840 Debt Issuance/(Repaid) 3,817 (10,241) 4,287 1,985 2,589 Interest Expenses (770) (825) (3,039) (2,692) (2,196) Others
FCFE 16,715 17,604 16,577 27,934 32,462 Share Capital Issuance - 12,138 - - - Dividend (16,228) (13,271) (14,068) (18,950) (22,134) FINANCING CASH FLOW ( c ) (13,181) (12,200) (12,819) (19,657) (21,741) NET CASH FLOW (a+b+c) 1,790 19,757 11,079 16,428 18,718 EO Items, Others
Closing Cash & Equivalents 39,836 60,974 72,985 89,413 108,131
Source: Company, HDFC sec Inst Research
Key Ratios
FY15 FY16 FY17E FY18E FY19E
EBITDAR Margin 27.4 34.8 28.9 30.4 31.5 EBITDA Margin 13.4 18.6 11.4 12.8 13.2 APAT Margin 9.3 12.3 8.2 8.9 9.2 RoE 307.6 176.5 81.6 100.5 108.2 RoIC (or Core RoCE) 28.1 44.4 40.0 72.7 153.7 RoCE 15.1 20.2 13.3 17.4 19.5 EFFICIENCY
Tax Rate (%) 29.4 29.7 21.0 25.0 28.0 Fixed Asset Turnover (x) 2.8 2.8 3.1 3.8 4.4 Inventory (days) 2.6 2.9 2.8 2.7 2.6 Debtors (days) 2.5 3.0 2.5 2.5 2.5 Other Current Assets (days) 6.8 9.0 7.5 7.5 7.5 Payables (days) 12.5 16.8 12.0 12.0 12.0 Other Current Liab & Provns (days)
46.3 48.7 48.7 48.7 48.7
Cash Conversion Cycle (days) (47) (51) (48) (48) (48) Debt/EBITDA (x) 2.1 1.1 1.3 0.8 0.6 Net D/E (x) 4.6 (0.3) (1.0) (1.8) (2.4) Interest Coverage (x) 13.6 18.6 5.4 9.2 14.1 PER SHARE DATA (Rs)
EPS 42.2 55.2 43.2 58.3 70.9 CEPS 52.0 69.2 57.5 73.6 86.4 Dividend 35.2 47.7 32.4 43.7 51.0 Book Value 13.7 50.9 55.1 60.8 70.2 VALUATION
P/E (x) 25.8 19.7 25.2 18.7 15.4 P/BV (x) 79.5 21.4 19.8 17.9 15.5 EV/EBITDA (x) 30.5 19.0 26.4 18.9 15.6 EV/Revenues (x) 4.1 3.5 3.0 2.4 2.1 OCF/EV (%) 4.2 5.4 2.9 5.2 5.7 FCF/EV (%) 2.4 5.0 2.7 5.0 5.6 FCFE/Mkt Cap (%) 4.3 4.5 4.2 7.1 8.3 Dividend Yield (%) 3.2 4.4 3.0 4.0 4.7
Source: Company, HDFC sec Inst Research
Page | 21

INTERGLOBE AVIATION : INITIATING COVERAGE
Rating Definitions BUY : Where the stock is expected to deliver more than 10% returns over the next 12 month period NEUTRAL : Where the stock is expected to deliver (-)10% to 10% returns over the next 12 month period SELL : Where the stock is expected to deliver less than (-)10% returns over the next 12 month period
Date CMP Reco Target 17-Apr-17 1,090 BUY 1,210
RECOMMENDATION HISTORY
700
800
900
1,000
1,100
1,200
1,300
Apr
-16
May
-16
Jun-
16
Jul-1
6
Aug
-16
Sep-
16
Oct
-16
Nov
-16
Dec
-16
Jan-
17
Feb-
17
Mar
-17
Apr
-17
Interglobe TP

INTERGLOBE AVIATION : INITIATING COVERAGE
Disclosure: I, Vishal Rampuria, CA, author and the name subscribed to this report, hereby certify that all of the views expressed in this research report accurately reflect our views about the subject issuer(s) or securities. We also certify that no part of our compensation was, is, or will be directly or indirectly related to the specific recommendation(s) or view(s) in this report. Research Analyst or his/her relative or HDFC Securities Ltd. does not have any financial interest in the subject company. Also Research Analyst or his relative or HDFC Securities Ltd. or its Associate may have beneficial ownership of 1% or more in the subject company at the end of the month immediately preceding the date of publication of the Research Report. Further Research Analyst or his relative or HDFC Securities Ltd. or its associate does not have any material conflict of interest. Any holding in stock – No
Disclaimer: This report has been prepared by HDFC Securities Ltd and is meant for sole use by the recipient and not for circulation. The information and opinions contained herein have been compiled or arrived at, based upon information obtained in good faith from sources believed to be reliable. Such information has not been independently verified and no guaranty, representation of warranty, express or implied, is made as to its accuracy, completeness or correctness. All such information and opinions are subject to change without notice. This document is for information purposes only. Descriptions of any company or companies or their securities mentioned herein are not intended to be complete and this document is not, and should not be construed as an offer or solicitation of an offer, to buy or sell any securities or other financial instruments. This report is not directed to, or intended for display, downloading, printing, reproducing or for distribution to or use by, any person or entity who is a citizen or resident or located in any locality, state, country or other jurisdiction where such distribution, publication, reproduction, availability or use would be contrary to law or regulation or what would subject HDFC Securities Ltd or its affiliates to any registration or licensing requirement within such jurisdiction. If this report is inadvertently send or has reached any individual in such country, especially, USA, the same may be ignored and brought to the attention of the sender. This document may not be reproduced, distributed or published for any purposes without prior written approval of HDFC Securities Ltd . Foreign currencies denominated securities, wherever mentioned, are subject to exchange rate fluctuations, which could have an adverse effect on their value or price, or the income derived from them. In addition, investors in securities such as ADRs, the values of which are influenced by foreign currencies effectively assume currency risk. It should not be considered to be taken as an offer to sell or a solicitation to buy any security. HDFC Securities Ltd may from time to time solicit from, or perform broking, or other services for, any company mentioned in this mail and/or its attachments. HDFC Securities and its affiliated company(ies), their directors and employees may; (a) from time to time, have a long or short position in, and buy or sell the securities of the company(ies) mentioned herein or (b) be engaged in any other transaction involving such securities and earn brokerage or other compensation or act as a market maker in the financial instruments of the company(ies) discussed herein or act as an advisor or lender/borrower to such company(ies) or may have any other potential conflict of interests with respect to any recommendation and other related information and opinions. HDFC Securities Ltd, its directors, analysts or employees do not take any responsibility, financial or otherwise, of the losses or the damages sustained due to the investments made or any action taken on basis of this report, including but not restricted to, fluctuation in the prices of shares and bonds, changes in the currency rates, diminution in the NAVs, reduction in the dividend or income, etc. HDFC Securities Ltd and other group companies, its directors, associates, employees may have various positions in any of the stocks, securities and financial instruments dealt in the report, or may make sell or purchase or other deals in these securities from time to time or may deal in other securities of the companies / organizations described in this report. HDFC Securities or its associates might have managed or co-managed public offering of securities for the subject company or might have been mandated by the subject company for any other assignment in the past twelve months. HDFC Securities or its associates might have received any compensation from the companies mentioned in the report during the period preceding twelve months from the date of this report for services in respect of managing or co-managing public offerings, corporate finance, investment banking or merchant banking, brokerage services or other advisory service in a merger or specific transaction in the normal course of business. HDFC Securities or its analysts did not receive any compensation or other benefits from the companies mentioned in the report or third party in connection with preparation of the research report. Accordingly, neither HDFC Securities nor Research Analysts have any material conflict of interest at the time of publication of this report. Compensation of our Research Analysts is not based on any specific merchant banking, investment banking or brokerage service transactions. HDFC Securities may have issued other reports that are inconsistent with and reach different conclusion from the information presented in this report. Research entity has not been engaged in market making activity for the subject company. Research analyst has not served as an officer, director or employee of the subject company. We have not received any compensation/benefits from the subject company or third party in connection with the Research Report.HDFC Securities Ltd. is a SEBI Registered Research Analyst having registration no. INH000002475
HDFC securities Institutional Equities Unit No. 1602, 16th Floor, Tower A, Peninsula Business Park, Senapati Bapat Marg, Lower Parel,Mumbai - 400 013 Board : +91-22-6171-7330www.hdfcsec.com
Page | 23