initial structural subsidence as reflected in morrowan and
TRANSCRIPT

University of Arkansas, FayettevilleScholarWorks@UARK
Theses and Dissertations
8-2016
Initial Structural Subsidence as Reflected inMorrowan and Atokan (Pennsylvanian) SubsurfaceStratigraphy, Northern Arkoma Basin, North-Central ArkansasFatimah Taher Nahi Al AsadiUniversity of Arkansas, Fayetteville
Follow this and additional works at: http://scholarworks.uark.edu/etd
Part of the Petroleum Engineering Commons, and the Stratigraphy Commons
This Thesis is brought to you for free and open access by ScholarWorks@UARK. It has been accepted for inclusion in Theses and Dissertations by anauthorized administrator of ScholarWorks@UARK. For more information, please contact [email protected], [email protected].
Recommended CitationAl Asadi, Fatimah Taher Nahi, "Initial Structural Subsidence as Reflected in Morrowan and Atokan (Pennsylvanian) SubsurfaceStratigraphy, Northern Arkoma Basin, North-Central Arkansas" (2016). Theses and Dissertations. 1698.http://scholarworks.uark.edu/etd/1698

Initial Structural Subsidence as Reflected in Morrowan and Atokan (Pennsylvanian) Subsurface
Stratigraphy, Northern Arkoma Basin, North-Central Arkansas
A thesis submitted in partial fulfillment
of the requirements for the degree of
Master of Science in Geology
by
Fatimah Taher Nahi Al_Asadi
University of Basra, Iraq
Bachelor of Science in Geology, 2011
August 2016
University of Arkansas
This thesis is approved for recommendation to the Graduate Council.
Dr. Doy Zachry
Thesis Director
Dr. Christopher Liner Ms. Jamie Woolsey
Committee Member Ex-Officio Member
Dr. Thomas A. (Mac) McGilvery
Committee Member

Abstract
The Arkoma Basin is a carboniferous foreland basin that is known for its prolific gas pro-
duction. The objective of this research is to study the initial subsidence of the basin by analyzing
the stratigraphic and structural features of the study area. This was accomplished through IHS
Petra, Surfer 13, and Win-Tensor software. Field work studies comprised a large part of this
study. Also, a seismic profile and Google earth elevation profiles are among the methods used to
study the initial subsidence of the Arkoma Basin. The study area within the basin represents a
transitional zone from the shelf into the northern portion of the basin. The defining formations in
this project are of Morrowan and Atokan age.
Within the vicinity of the Arkoma Basin in north-central Arkansas, the stratigraphic analy-
sis confirms a continuous thickening of the Middle Atoka interval south of the study area toward
the Ouachita thrust belt, determined through utilizing raster well logs. Furthermore, system tracts
were defined for each formation in this study, giving a general overview of the change in sea-
level associated with the process of subsidence of the basin.
Structural analysis presents distinctive features that dominated the study area. Both the
Mulberry and Clarksville master faults are east-west trending normal faults. These master faults
are considered to be growth syn-depositional faults, which are the main evidence for tectonic sub-
sidence of the basin. Additionally, the area shows a graben feature named Bullfrog Graben that is
considered significant evidence for the local flexure loading of the Arkoma basin.

©2016 by Fatimah Taher Nahi Al_Asadi
All Rights Reserved

Acknowledgment
My successful academic studies have involved lots of good people whom deserved to be
thanked.
I am particularly grateful for my sponsorship given by the Higher Committee for Educa-
tion Development in Iraq.
My overwhelming thanks extended to my supervisor, Professor Doy Zachry, who inspired
and supervised this research project as well as for his support and contribution throughout my the-
sis work, with his valuable suggestions, useful critiques, and sense of humor. Thank you does not
seem sufficient.
Special thanks go to my thesis committee for all of their help. Thanks to Dr. Thomas A.
(Mac) McGilvery for his valuable inputs that strengthened my thesis works, and for drafting the
figure in this contribution. I thank Dr. Christopher Liner for sharing his geological knowledge that
improved this project. I would like to express my deep gratitude to my committee member and
friend Ms. Jamie Woolsey for her assistance and generous help on IHS Petra, this work would
have not been possible without your valuable support.
I cannot overstate the importance of the involvement to one of the strongest teachers I
have ever known, Dr. Wathiq Gh. Abdulnaby at University of Basra, Department of Geology.
You have given me all of the support and confidence I needed not just in my thesis work but also
in my life.
Much research would not have been possible without the profound help of the Shields
Company, specifically to Mr. Tim Shields and Pat Shields, for providing with the seismic profile.
Also, I would like to thank the Arkansas geological society website for the free resources.

I thank my fellows: Josh Stokes for his help in Surfer and other associated aspects,
Minella Majenu, Elvis Bello, and Erik Brawner for their input and peer review. Special thanks for
Rahman Kareem for all of his help and support during my master’s journey.
Additionally, special thanks go out to the faculty and staff at the geosciences department,
especially for Ms. Lisa Milligan and Ms. JoAnn C. Kvamme for all of their encouragement, sup-
port, and tremendous help throughout my studies at the University of Arkansas.
I would like to thank my host family the Van Horns, for their support. I would also like to
give special thanks to my family back home in Iraq for all of their inspiration and encouragement
during my studies.

TABLE OF CONTENTS
CHAPTER 1 .............................................................................................................................. 1
INTRODUCTION ..................................................................................................................... 1
1.1 Problem Statement -------------------------------------------------------------------------------- 1
1.2 Location of Study Area --------------------------------------------------------------------------- 1
1.3 Previous Studies ----------------------------------------------------------------------------------- 4
1.4 Tectonic History of the Arkoma Basin --------------------------------------------------------- 5
1.4.1 Ozark Platform ---------------------------------------------------------------------------------- 6
1.4.2 Arkoma Basin ----------------------------------------------------------------------------- 6
1.4.3 Ouachita Fold Belt ---------------------------------------------------------------------- 11
1.5 Methodology -------------------------------------------------------------------------------------- 12
1.5.1 Log Analysis and Isopach Maps ------------------------------------------------------ 12
1.5.2 Field Techniques ------------------------------------------------------------------------ 13
CHAPTER 2 ............................................................................................................................ 15
ARKOMA BASIN STRATIGRAPHIC ANALYSIS ............................................................. 15
2.1 Regional Stratigraphy ---------------------------------------------------------------------------- 15
2.2 Log Signatures ------------------------------------------------------------------------------------ 15
2.3 Lithological and Stratigraphic Properties of Study Area ------------------------------------ 18
2.3.1 Morrowan Strata ------------------------------------------------------------------------- 22
2.4 Local Cross Sections Description -------------------------------------------------------------- 34
2.4.1 Cross Section A-A’ --------------------------------------------------------------------- 39
2.4.2 Cross Section B-B` ---------------------------------------------------------------------- 41
2.4.3 Cross Section C-C` ---------------------------------------------------------------------- 43
2.4.4 Cross Section D-D` --------------------------------------------------------------------- 45
2.4.5 Cross Section E-E` ---------------------------------------------------------------------- 47
2.4.6 Cross Section F-F` ---------------------------------------------------------------------- 49
2.6 Isopach Maps ------------------------------------------------------------------------------------- 50
2.6.1 Brentwood Interval Isopach Map ----------------------------------------------------- 51
2.6.2 Kessler Interval Isopach Map ---------------------------------------------------------- 52
2.6.3 Lower Atoka Interval Isopach Map --------------------------------------------------- 53
2.6.4 Middle Atoka Isopach Map ------------------------------------------------------------ 54
CHAPTER 3 ............................................................................................................................ 55
STRUCTURAL EVOLUTION OF THE ARKOMA BASIN ................................................. 55
3.1 Structural Analysis ------------------------------------------------------------------------------- 55

3.2 Previous Subsurface Studies -------------------------------------------------------------------- 55
3.3 Well logs and Seismic Profile Analysis ------------------------------------------------------- 56
3.4 Local Structure ----------------------------------------------------------------------------------- 60
3.5 Structural Contour Maps ------------------------------------------------------------------------ 61
3.5.1 Structural Contour Map of the Hale Formation Interval --------------------------- 62
3.5.2 Structural Contour Maps of the Bloyd Intervals ------------------------------------ 63
3.5.3 Structural Contour Map of the Lower Atoka Formation Interval ----------------- 64
3.5.4 Structural Contour Map of the Middle Atoka Formation Interval ---------------- 65
3.6 Local Cross Sections Description -------------------------------------------------------------- 66
3.6.1 (A-A`) Cross Section ------------------------------------------------------------------- 68
3.6.2 (B-B`) Cross Section -------------------------------------------------------------------- 70
3.6.3 (C-C`) Cross Section -------------------------------------------------------------------- 72
3.6.4 (D-D`) Cross Section ------------------------------------------------------------------- 74
3.6.5 (E-E`) Cross Section -------------------------------------------------------------------- 76
3.6.6 (F-F`) Cross Section -------------------------------------------------------------------- 78
3.6.7 (G-G`) Cross Section ------------------------------------------------------------------- 80
3.6.8 (AA-A`A`) Cross Section -------------------------------------------------------------- 82
3.6.9 (BB-B`B`) Cross Section --------------------------------------------------------------- 84
3.7 Google Earth Profiles ---------------------------------------------------------------------------- 86
3.8 Faults Analysis ----------------------------------------------------------------------------------- 87
3.9 Mulberry Fault ------------------------------------------------------------------------------------ 89
3.10 Clarksville Fault -------------------------------------------------------------------------------- 89
3.11 The Bullfrog Graben --------------------------------------------------------------------------- 91
3.12 Stereographic Projection ----------------------------------------------------------------------- 95
3.13 Structural Interpretation and Discussion ----------------------------------------------------- 98
CONCLUSION ...................................................................................................................... 100
REFRENCES ......................................................................................................................... 101
APPENDIX (1) ...................................................................................................................... 103
APPENDIX (2) ...................................................................................................................... 104
APPENDIX (3) ...................................................................................................................... 105
APPENDIX (4) ...................................................................................................................... 107

LIST OF FIGURES
Figure 1-1: Tectonic Provinces of the Arkoma Basin in Arkansas. Study area
is highlighted in the box, indicating the position for both the Cass Monocline
Fault (A) and the Mulberry Fault (B). ....................................................................................... 2
Figure 1-2: Location map of the study area in northcentral Arkansas within
Johnson and Pope counties. The Arkansas River crosses the southwestern
part of the area. .......................................................................................................................... 3
Figure 1-3: Geological Map for the research project highlighting the study
area. (A) the geological map of Arkansas (modified from Aransas Geological
Survey,1993), (B) the study area selected in terms of faults and counties, and
(C) the local area in terms of the structural boundaries (modified from
Cohoon in 2013). ....................................................................................................................... 9
Figure 1-4: A tectonic- stratigraphic diagram representing the development
of the Arkoma Basin during Mississippian and Pennsylvanian time. The
diagram illustrates the thickness increase and the time of sedimentation
during Middle Atokan time (modified from Houseknecht, 1986). .......................................... 10
Figure 1-5: The tectonic history of the Arkoma Basin. The diagram
represents the development of the basin from Precambrian through Devonian
rifting in A to B, whereas stages C to E represent the development of the
basin from Mississippian to Pennsylvanian time (modified from
Houseknecht, 1986). ................................................................................................................ 11
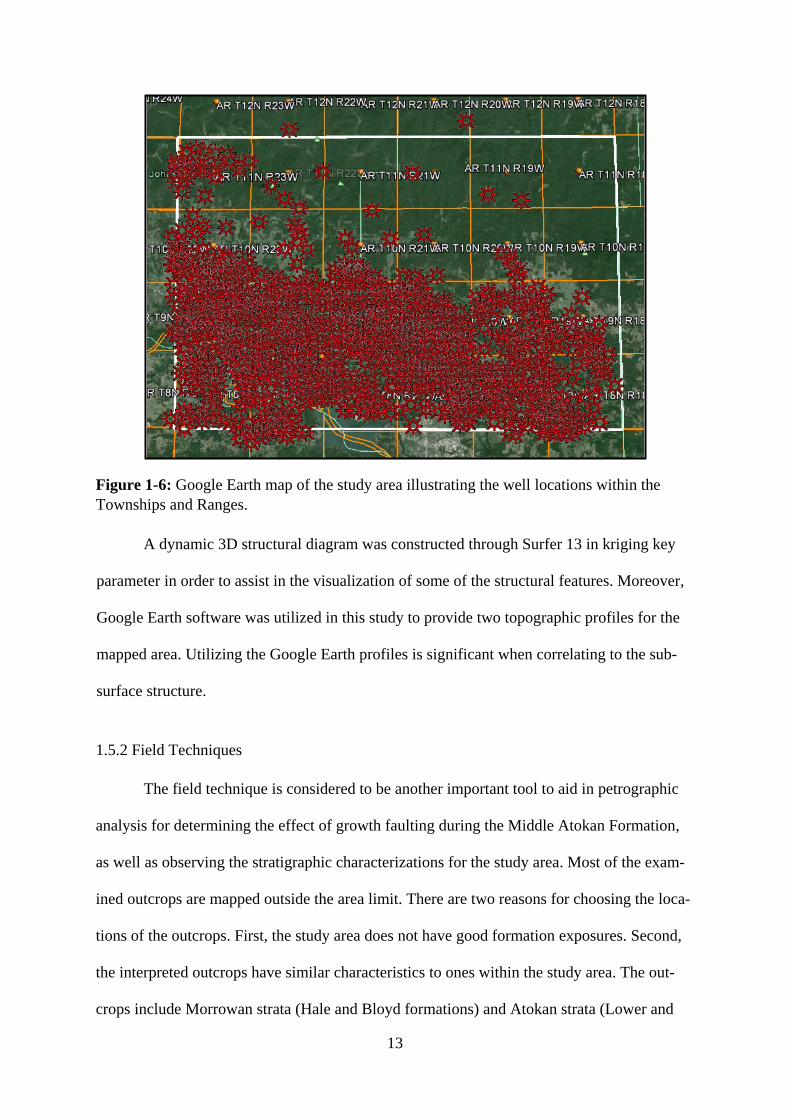
Figure 1-6: Google Earth map of the study area illustrating the well locations
within the Townships and Ranges. .......................................................................................... 13
Figure 2-2: Generalized stratigraphic column of the Morrowan and Atokan
series of the Pennsylvanian succession of northcentral Arkansas. (Modified
from McGilvery, 1982). ........................................................................................................... 20
Figure 2-3: Wireline well log showing the log signature for all of the
formation intervals for the study area highlighted with distinctive colors. ............................. 21
Figure 2-4: Prairie Grove Member along Arkansas 412. Photograph (A)
shows thick calcareous sandstone beds and photograph (B) displays the
development of cross bedding within the sandstone. Fossils in the sandstone
indicate a marine environment. ................................................................................................ 24
Figure 2-5: Photograph of the transitional contact between the Prairie Grove
and Brentwood Limestone members along Arkansas Highway 23 near
Huntsville. The outcrop displays a carbonate buildup generated by storm
activity...................................................................................................................................... 26

Figure 2-6: Sandstone- shale sequence in the Brentwood Limestone interval
along Arkansas 412 near Huntsville in Madison County. ....................................................... 26
Figure 2-7: Contact developed between the Brentwood Limestone and
Middle Bloyd Sandstone members along Arkansas Highway 16 south of
Huntsville. ................................................................................................................................ 27
Figure 2-8: Contact between the Brentwood and Middle Bloyd members of
the Bloyd Formation indicating abrupt change in the lithology. Cross bedding
dominates both the Brentwood and Middle Bloyd members along Arkansas
Highway 16 south of Huntsville. ............................................................................................. 28
Figure 2-9: (A) Limestone-shale sequence between the Kessler and Dye
Shale members. (B) The unconformable boundary between the Morrowan
and Atokan series. Both photos were taken along Interstate 49, south of
Fayetteville. .............................................................................................................................. 29
Figure 2-10: Lower Atoka outcrop along Highway 123 near Pelsor. Thick
cross bedded sandstone interval characterizes the outcrop. ..................................................... 31
Figure 2-11: A Lower Atoka interval outcrop along Highway 23. The
outcrop shows multiple sandstone and shale units. This pattern of
depositional strata shows a similar pattern to well log signature. ............................................ 32
Figure 2-12: Herringbone cross-stratification indicating the tidal
environment during the Lower Atoka deposition along Highway 123. ................................... 32
Figure 2-13: Middle Atoka interval along Arkansas 215. The outcrop is
characterized by thick sandstone intervals, which represent the lowest part of
the formation. ........................................................................................................................... 34
Figure 2-15: East –West regional stratigraphic cross section in northcentral
part of the Arkoma Basin depicting the main intervals for this study. The
cross section datum is the upper boundary for the Middle Atoka Formation. ......................... 38
Figure 2-16: East –West regional stratigraphic cross section in the
northcentral part of the Arkoma Basin depicting the main formation tops for
the study. .................................................................................................................................. 40
Figure 2-17: North-South regional stratigraphic cross section in the
northcentral part of the Arkoma Basin depicting the main intervals for the
study area. ................................................................................................................................ 42
Figure 2-18: North- South regional stratigraphic cross section of the Arkoma
Basin. ....................................................................................................................................... 44
Figure 2-19: E-E` North – South regional stratigraphic cross section in the
northcentral part of the Arkoma Basin. .................................................................................... 46

Figure 2-20: North- South regional stratigraphic cross section in the
northcentral part of the Arkoma Basin ..................................................................................... 48
Figure 2-21: The Brentwood interval isopach map. ............................................................... 51
Figure 2-22: The Kessler interval isopach map. ..................................................................... 52
Figure 2-23: The Lower Atoka interval isopach map, with faults bounded the
graben in red color. .................................................................................................................. 53
Figure 2-24: The Middle Atoka interval isopach map, highlighting the
Clarksville Fault in red color. .................................................................................................. 54
Figure 3-1: North- south cross section (modified from Zachry and
Sutherland, 1984). The section shows the thickening of the Atoka section on
the downthrown side of the growth normal faults. .................................................................. 56
Figure 3-2: The elevation value based on subsurface location in relation to a
mapped formation (modified from Tearpock and Bischke, 1991). ......................................... 57
Figure 3-3: Correlation of Gray “N”, Cagle, and Bluff Bee well logs,
indicating the variation in the Middle Atoka Formation thickness highlighted
in a red color. The section labeled missing section, in the Bluff Bee well
indicate that a fault cut the well ............................................................................................... 58
Figure 3-4: A north-south seismic profile showing the general normal faults,
for location see figure (-) (Shields Company, personal communication,
December 8, 2015). .................................................................................................................. 59
Figure 3-5: The geological map of the study area, depicting the regional
east- west trending faults (modified from Arkansas Geological Survey). ............................... 60
Figure 3-6: Structural contour map of the Hale Formation interval. ...................................... 62
Figure 3-7: Structural contour map of the Brentwood interval. .............................................. 63
Figure 3-8: Structural contour map of the Kessler interval. .................................................... 64
Figure 3-9: Structural contour map of the Lower Atoka interval. .......................................... 65
Figure 3-10: Structural contour map of the Middle Atoka interval. ....................................... 66
Figure 3-11: The orientation of the structural cross sections in the study area
in Google earth. ........................................................................................................................ 67
Figure 3-12: North to south structural cross section A-A`, with the Mulberry
(1) and Clarksville (2) faults in the black lines. ....................................................................... 69

Figure 3-13: North to south structural cross section B-B`, with the Mulberry
and Clarksville faults in the black lines. .................................................................................. 71
Figure 3-14: North to south structural cross section C-C`, with the Mulberry
and Clarksville faults in the black lines. .................................................................................. 73
Figure 3-15: North to south structural cross section D-D`, with the Mulberry
and Clarksville faults in the black lines. .................................................................................. 75
Figure 3-16: North to south structural cross section E-E`, with the Mulberry
and Clarksville Faults in the black lines. ................................................................................. 77
Figure 3-17: North to south structural cross section F-F`, with the Mulberry
and Clarksville faults in the black lines. .................................................................................. 79
Figure 3-18: North to south structural cross section G-G`, with the Mulberry
and Clarksville faults in the black lines. .................................................................................. 81
Figure 3-19: West to east structural cross section AA-A`A`, with the
bounding faults of the Bullfrog graben mapped in blue lines. ................................................. 83
Figure 3-20: West to east structural cross section BB-B`B`, with the
bounding faults of the graben mapped in blue lines. ............................................................... 85
Figure 3-21: Google earth elevation profiles showing cross sectional view of
the surface topography along the paths. (A) Elevational profile for northwest
to southeast path of the western part of the Mulberry Fault, (B) Elevational
profile for northwest to southeast path of the eastern part of the Mulberry
Fault, and (C) Elevational profile for east- west path of the central part of the
graben. ...................................................................................................................................... 87
Figure 3-23: The location of the study area in regard to both the Mulberry
and Clarksville fault zone with the boundary of the Ozark Plateaus and
Arkoma Basin placed (modified from Cohoon, 2013). ........................................................... 91
Figure 3-24: A 3D diagram of the Bullfrog Graben defined the Lower Atoka
structure contour map. ............................................................................................................. 92
Figure 3-25: The AA-A`A` east-west cross section on a proposed bending
normal fault. ............................................................................................................................. 93
Figure 3-26: Schematic illustrations of the flexural bending for the Bullfrog
Graben in the study area of the Arkoma Basin showing the two north-south
trending faults perpendicular to the Mulberry master fault (Sketched by Dr.
Thomas A. (Mac) McGilvery). ................................................................................................ 94
Figure 3-27: The principle stresses of a normal fault (Groshong, 2006). ............................... 95

Figure 3-28: Equal -area projection of lower hemisphere of (A) the Mulberry
Fault, (B) the Clarksville Fault, (C) the Bullfrog Graben. ....................................................... 96
Figure 3-29: Equal-area projection that presents integrated structural features
of the study area. ...................................................................................................................... 97
Figure 3-30: Equal-area projection in Win-Tensor software presenting the
greatest stress that is perpendicular to the faults surfaces in solid read arrows.
(A) represents the main directions of the three principle stresses on the
Mulberry Fault, (B) represents the major stresses on the Clarksville Fault,
and (C) represents the major stresses on the Bullfrog Graben. ................................................ 98

LIST OF TABLES
Table 2-1: Stratigraphic column representing the Morrowan and Atokan
Series with members and units names (modified from Zachry, 1983). ................................... 19
Table 3-1: Measured strikes and dips for the Mulberry and Clarksville
master faults, and fault bounded graben, generated based on the structural
contour maps and cross sections. ............................................................................................. 88

1
CHAPTER 1
INTRODUCTION
1.1 Problem Statement
The Arkoma Basin is one of several petroleum basins in the United States. It extends
from west-central Arkansas to southeastern Oklahoma over an area about 33,800 sq. mi
(Perry, 1995). Sedimentary rocks in the modern Arkoma Basin record a history of basin for-
mation as a structural feature. The beginning of basin subsidence may be documented in the
stratigraphic units of the basin. The structural characterization of the basin reflects a distinc-
tive faulting pattern, interpreted to be caused by normal faults. The growth faulting in the
Arkoma Basin developed during Pennsylvanian time. The inception of Arkoma Basin devel-
opment is recorded in late Mississippian and early Pennsylvanian time.
This study focuses on the Morrowan, Lower Atoka, and Middle Atoka (Carbonifer-
ous, Paleozoic) in the Arkoma Basin of north-central Arkansas. The sequence of deposition
in the Middle Atoka Formation provides valuable insight in timing of faulting in the develop-
ment of the Arkoma Basin (Buchanan and Johnson, 1968). A model based on structure and
stratigraphic analysis is presented in this study.
The purpose is to document the tectonic history of the Arkoma Basin in terms of sedi-
mentation, subsidence, and growth faulting. This study provides an interpretation of the sub-
surface by documenting the changes in structure and stratigraphy of the basin in northcentral
Arkansas. In order to achieve this objective, several methods were utilized.
1.2 Location of Study Area
The Arkoma is bordered on the north by the Ozark Uplift and on the south by the
Ouachita fold belt (Figure 1.1). It is located in the northern part of the Arkoma Basin of
north-central Arkansas. It is bounded to the north by Township 11N and to the south by
Township 8N. The western boundary is Range 23W and the eastern boundary is Range 18W

2
in Pope, Logan, and Johnson counties (Figure 1.2). The area for this study includes numerous
gas fields that are present within the thirty township area. It encompasses approximately
1,080 square miles in the Arkoma Basin.
Figure 1-1: Tectonic Provinces of the Arkoma Basin in Arkansas. Study area is highlighted
in the box, indicating the position for both the Cass Monocline Fault (A) and the Mulberry
Fault (B).
A
B
N

3
Figure 1-2: Location map of the study area in northcentral Arkansas within Johnson and
Pope counties. The Arkansas River crosses the southwestern part of the area.

4
1.3 Previous Studies
The Arkoma Basin is one of the main gas producing basins in the United States. Nu-
merous studies have been published on significant aspects of Morrowan and Atokan strata in
northern Arkansas. Morrowan and Atokan formations of the Pennsylvanian section were
studied with an emphasis on natural gas producing reservoirs. The studies have examined dif-
ferent aspects of the Arkoma Basin, including lithology, stratigraphy, and tectonic settings.
Most models for the Arkoma Basin have focused on tectonics as the dominant mecha-
nism for controlling the depositional environment. A growth fault model was presented by
Buchanan and Johnson (1968) to explain the development of the Middle and Lower Atoka
formations. They described the model by producing structural cross sections to emphasize the
role of tectonics in in shaping the basin. During the development of these tectonically driven
listric growth faults, an increase in sediment supply was also occurring and has been at-
tributed to the same tectonic activity.
Delavan (1985) completed a subsurface stratigraphic framework of the Bloyd For-
mation in the Arkoma Basin in Arkansas. The study focused on Morrowan strata. Deposi-
tional settings were discussed by examining and correlating mechanical well logs from petro-
leum exploration wells. His subsurface cross-sections and isopach maps suggested that Mor-
rowan strata gradually thicken to the east within the basin.
Houseknecht (1986) conducted a study on the development of the Arkoma Basin in
relation to tectonic activities, deducing that syn-depositional movement along normal faults
was the main control for the development of depositional facies in early Atokan time. He also
presented a tectonic model for the basin that emphasized the Ouachita Orogeny's role in shap-
ing the Arkoma Basin (Figure 1-5).
Goff (1989) focused on the structural configuration of the Hunton Group in northcen-
tral Arkansas. She described the change in depositional patterns throughout geological time

5
utilizing isopach maps. The structural study emphasized the association of natural gas accu-
mulations with normal faults that resulted from the extensional forces.
Jameson (1998) interpreted two 2D seismic profiles and correlated more than 70 well
logs in order to document the stratigraphic and structural styles in northwestern Arkansas. He
prepared cross sections from well logs that revealed a diverse subsurface structural style.
LaGrange (2002) determined the depositional characteristics and reservoir perfor-
mance in the Lower Atoka Formation. He studied the potential source of sediment deposits
with detailed analysis, suggesting that the main source consisted of sedimentary rocks from
the Appalachians with sediments transported across the cratonic interior.
Pontiff (2007) defined the stratigraphic framework of the middle Bloyd sandstone of
the Morrowan section in Franklin, Johnson and Pope counties of northcentral Arkansas. She
examined the changes in lithology during the transition of the depositional regime from
braided stream to marine deposits.
1.4 Tectonic History of the Arkoma Basin
In Arkansas, the regional geology consists of three tectonic provinces from north to
south; the Ozark Platform, Arkoma Basin, and Ouachita Fold and Thrust Belt (Figure 1-1).
The study area lies within the northcentral part of the Arkoma Basin. The development of the
basin occurred during Early Pennsylvanian time. The Arkoma Basin is one of several fore-
land basins that formed during various phases of the Ouachita Orogeny. Geologically, the ba-
sin is bounded by tectonic boundaries as a result of subduction and a sequence of collision
events between the North American continental margin and the Sabine terrain. The Arkoma
is a peripheral foreland basin that is associated with the Ouachita Fold Belt of Arkansas and
Oklahoma. The basin is approximately 50 miles wide and 250 miles long (Delavan. 1985).

6
1.4.1 Ozark Platform
The northern portion of Arkansas is composed of the Ozark Uplift or Ozark Dome,
which covers about 12% of the state of Arkansas. The Ozark Platform was formed about 1.5
billion years ago as a part of the North American Continent (Cohoon, 2013). The southern
margin of this stable platform was broken by series of extensional normal faults as it evolved
into the Arkoma foreland basin during the early Pennsylvanian (340-320 M.A) (Jameson,
1998). The Ozark Uplift is centered in southern Missouri, northeastern Oklahoma, the north-
ern part of Arkansas, and the very southeastern corner of Kansas. The southern boundary of
the uplift extends across the northern part of both Franklin and Crawford counties in Arkan-
sas. The sediments in the southern and western flanks of the Ozark Platform in Arkansas are
dominated by clastic sediments and calcareous mudstone. The sediments that were domi-
nantly deposited during pre-Pennsylvanian time were composed of limestone, whereas during
the Pennsylvanian, the sediments were composed mostly of interbedded sandstone and shale.
The southern flank of the Ozark Plateau is bounded by the Mulberry Fault character-
ized as a transitional zone between the Ozark Uplift and Arkoma Foreland Basin. Moyer
(1985) identified the actual location of the transitional zone, which extends from the Cass
Fault System on the Ozark Plateau to the Mulberry Fault in the Arkoma Basin in Arkansas.
The study area is located in the southern part of the transitional zone between the Ozark Plat-
form and Arkoma Basin (Figure 1-1).
1.4.2 Arkoma Basin
The Arkoma is a foreland basin with an elongate shape. It extends from the east
across northcentral Arkansas westward into the southeastern part of Oklahoma. In Arkansas,
the basin is bordered by the Ozark Uplift to the north and by the Ouachita Fold Belt to the
south (Figure 1-3). The southern part of the Arkoma Basin is characterized by a series of

7
thrust faults. The basin is described as a synclinorium composed of Paleozoic strata (House-
knecht, 1987). The strata exhibit southerly dips which range from less than one degree on the
Ozark Platform to eight degrees on the northern flank of the Arkoma Basin. The northern part
of the Arkoma Basin is dominated by numerous northwest to southeast trending faults and
asymmetrical folds (McGilvery, 1982). During the Pennsylvanian, clastic sediments filled the
basin forming the Hale and Atokan formations, while carbonate sediments covered the upper
part of the Morrowan series, specifically in the Kessler and Brentwood members of the Bloyd
Formation. The sediments that filled the Arkoma were derived from the southern margin of
the North American Craton (Long, 2005)
The basin contains a series of faults and folds, both at the surface and in the subsur-
face that resulted from extensional forces associated with the development of the Arkoma
Basin. These forces were referred to as the Ouachita Orogeny (Figure 1-4). They resulted in
the uplift of the Ozark Plateau, causing trends of anticlines, synclines, and both normal and
reverse faults (Delavan. 1985) (Figure 1-3). The compressional tectonic effect migrated
northward during the Middle Pennsylvanian (McGilvery, 1982). The Arkoma Basin develop-
ment started in the Early to Middle Atokan time, approximately 320 MY ago, when most of
the subsidence took place in the basin. Sediments were deposited in thicknesses up to 25,000
feet (5.5 km) simultaneously with the fault driven subsidence in the basin (Figure 1-4)
(Houseknecht, 1986).
Houseknecht (1986) illustrated the tectonic events of the Arkoma Basin from late Pre-
cambrian to early Paleozoic time. Figure 1-5 represents the geological time series of Arkoma
Basin development. The first tectonic series (A) of the Arkoma Basin recorded the opening
of the proto-Atlantic Ocean basin during the late Precambrian to Cambrian time. The second
tectonic stage (B) beginning in the Late Cambrian to Early Mississippian time, represented
the onset of the ocean basin closure due to the northern encroachment of “Llanoria” (Figure

8
1-5). By Early Mississippian to Early Atokan time (C), as a result of southward subduction
beneath Llorania, resulting in series of east-west trending normal faults. The basin started to
form through the generation of growth faults and an increase in sediment supply from the
east side of the basin. Houseknecht states that during the Early to Middle Atokan time (D),
the ocean closure was completed. He also suggested that there was reactivation of the normal
growth faults later causing the development of the foreland basin. During Middle to Late
Atokan time (E), the Arkoma Basin development continued to result in complex structural
deformation adjacent to the Ouachita Mountains (Houseknecht and Kacena, 1983). During
the fourth and fifth tectonic stages, the Middle Atoka Formation experienced major facies
thickening, which was controlled mainly by the increase of accommodation space for the re-
ceived sediments.

9
Fig
ure
1-3
: G
eolo
gic
al M
ap f
or
the
rese
arch
pro
ject
hig
hli
ghti
ng t
he
study a
rea.
(A
) th
e geo
logic
al m
ap o
f A
rkan
sas
(modi-
fied
fro
m A
ransa
s G
eolo
gic
al S
urv
ey,1
993),
(B
) th
e st
udy a
rea
sele
cted
in t
erm
s of
fault
s an
d c
ounti
es, an
d (
C)
the
loca
l ar
ea
in t
erm
s of
the
stru
ctura
l boundar
ies
(modif
ied f
rom
Cohoon i
n 2
013).

10
Figure 1-4: A tectonic- stratigraphic diagram representing the development of the Arkoma
Basin during Mississippian and Pennsylvanian time. The diagram illustrates the thickness in-
crease and the time of sedimentation during Middle Atokan time (modified from House-
knecht, 1986).

11
Figure 1-5: The tectonic history of the Arkoma Basin. The diagram represents the develop-
ment of the basin from Precambrian through Devonian rifting in A to B, whereas stages C to
E represent the development of the basin from Mississippian to Pennsylvanian time (modified
from Houseknecht, 1986).
1.4.3 Ouachita Fold Belt
The Arkoma Basin is bounded on the southern margin by the Ouachita Fold and
Thrust Belt Zone (Figure 1-1). The Ouachita Belt is defined to the north by the trace of the
Choctaw Thrust Fault in Oklahoma and the Ross Creek Thrust Fault in Arkansas (Sutherland,
1988), while the southern boundary is defined by the Gulf Coastal Plain or the South Central
Plains, which are dominated by Cretaceous deposits. This area is characterized by extreme
structural deformation, resulting in numerous thrust faults, synclines, and anticlines.

12
1.5 Methodology
Two important methods were used in this study; well log analysis and field tech-
niques. Using these methods provided a simple understanding of the depositional environ-
ment that existed during Arkoma Basin subsidence. The analysis of these procedures is im-
portant for generating a depositional model for the basin.
1.5.1 Log Analysis and Isopach Maps
Well log data and field studies are the primary methods to accomplish this study. The
wireline log study is a preliminary approach used to provide better understanding of the geol-
ogy of the study area. Within the study area, 1549 wells (Figure 1-6) were processed using
IHS Petra log software. The well logs are important for constructing structural and strati-
graphic cross sections, as well as building structural contour and isopach maps. Well logs
were used to construct a grid of north-south and east-west cross-sections for the area of inter-
est in order to understand the subsurface structure and stratigraphy. The raster well logs were
correlated using the gamma ray and resistivity curves to pick the tops based on the identical
well log signature in type logs of relatively close distance within the study area. The wells
were selected based on location, drilling depth, and the quality of the log curves. Units that
were identified by examining boundaries on the well logs include the Hale, Bloyd (Kessler
and Brentwood members), Lower Atoka (the base of the Casey unit), and Middle Atoka
(Tackett) formations.
Isopach maps for most of the Morrowan and the Atokan formations were generated
by examination of the well logs from IHS Petra. Furthermore, understanding the variation in
the formation thickness provided more evidence for the growth faults that were generated
during the Middle Atokan Formation in relation to the facies thickness change, either thick-
ening or thinning as sediments were deposited in the basin.
13
Figure 1-6: Google Earth map of the study area illustrating the well locations within the
Townships and Ranges.
A dynamic 3D structural diagram was constructed through Surfer 13 in kriging key
parameter in order to assist in the visualization of some of the structural features. Moreover,
Google Earth software was utilized in this study to provide two topographic profiles for the
mapped area. Utilizing the Google Earth profiles is significant when correlating to the sub-
surface structure.
1.5.2 Field Techniques
The field technique is considered to be another important tool to aid in petrographic
analysis for determining the effect of growth faulting during the Middle Atokan Formation,
as well as observing the stratigraphic characterizations for the study area. Most of the exam-
ined outcrops are mapped outside the area limit. There are two reasons for choosing the loca-
tions of the outcrops. First, the study area does not have good formation exposures. Second,
the interpreted outcrops have similar characteristics to ones within the study area. The out-
crops include Morrowan strata (Hale and Bloyd formations) and Atokan strata (Lower and

14
Middle Atoka formations). Field studies are significant to present the reflection of the deposi-
tional environment through the selected facies. Also, they provide an important tool in assist-
ing the subsurface correlation of stratigraphic cross-sections and the subsequent maps gener-
ated from the well log signatures.

15
CHAPTER 2
ARKOMA BASIN STRATIGRAPHIC ANALYSIS
2.1 Regional Stratigraphy
Stratigraphic analysis is significant in order to reconstruct a model for the depositional
settings within a chronostratigraphic framework for the Arkoma Basin. In other words, it pro-
vides a powerful tool for understanding sedimentary basin evaluation. Also, it is important
for presenting the general geological settings for gas producing areas, specifically in the
northcentral part of the Arkoma Basin since the stratigraphic traps are considered to be one of
the main traps for hydrocarbons.
The Arkoma Basin is characterized by several unconformities within the stratigraphic
column. The study area has two main unconformities that bound the Pennsylvanian. The first
unconformity separates the Chesterian and Morrowan series (about 325 Ma), and the second
one separates the Morrowan and Atokan series (about 313 Ma). Unconformities in the
Arkoma Basin are also important in identifying the sequence boundaries for the system tracts.
2.2 Log Signatures
In terms of subsurface stratigraphic analysis, wire-line logs are considered to be one
of the most common types of geologic data used. The raster log images were used to study
the subsurface stratigraphy of the Arkoma Basin. Even though wire-line logs do not provide
direct information about lithologic and stratigraphic interpretations, they are helpful in
providing some related information about petrophysical properties of penetrated strata. For
the purpose of this study, the electric logs that are mostly depended on are gamma ray (GR),
resistivity, and conductivity curves.
Well log data provide significant information for interpreting parasequence sets
within the mapped formations. Figure 2-1 shows a well log, highlighting the formations ex-
amined in this study. Each formation shows some change in the strata thickness, associated

16
with the depositional environments. The change in thickness within a selected formation re-
veals different parasequence types. The Hale Formation displays an upward thickening-coars-
ening pattern within sandstone intervals. This thickening suggests progradational parase-
quence sets. Whereas, the Bloyd intervals (Kessler and Brentwood) are difficult to interpret
because of their different lithology (carbonate deposits), and the thinner intervals compared
to other intervals in this study. Additionally, both Atokan formations (Lower and Middle)
display aggradational parasequence sets due to the change in the thickness of sandstone and
shale intervals.
Each interval in this study is interpreted to represent a high-stand system tract, which
is due to the location of the study area along the northern margin of the basin. Generally, the
slope of the Arkoma Basin represents high-stand system depositional pattern. However,
within the slope location, low-stand system deposits might be present. The low-stand deposits
are interpreted to represent the lowest depositional area within the same location. In order to
justify the change in the system tracts, a detailed study is required for each individual for-
mation interval.

17
Fig
ure
2-1
: D
etai
l w
ell
log o
f th
e M
orr
ow
an (
Kes
sler
, B
rentw
ood, an
d H
ale
form
atio
ns)
and A
tokan
(T
acket
t an
d C
asey
for-
mat
ions)
in
the
Rik
er 2
wel
l. T
he
figure
show
s gam
ma
ray
(G
R),
res
isti
vit
y (
ILD
), a
nd c
ond
uct
ivit
y (
CIL
D).
Als
o, th
e w
ell
show
s th
e th
ick s
equen
ces
of
sandst
on
e, l
imes
tone,
and s
hal
e in
terv
als,
as
wel
l as
the
resp
onse
of
par
aseq
uen
ce p
atte
rns.

18
2.3 Lithological and Stratigraphic Properties of Study Area
The stratigraphic section of the Arkoma Basin in Arkansas is composed mainly of
sandstone, shale, and limestone units (Figure 2-2). During the Pennsylvanian, the stratal pat-
terns and changes in the lithofacies distribution were controlled mainly by the relative change
in sea level. The change in sea level is represented by various transgressive and regressive
depositional sequences, which are reflected by the deposits of terrestrial and marine origin
(Pontiff, 2007).
The stratigraphy of the study area includes the Hale and Bloyd formations of the Mor-
rowan series and the Lower and Middle Atoka formations of the Atokan series in the Penn-
sylvanian. The sedimentary rocks of both the Morrowan and lower Atokan were deposited on
a stable shelf in the Arkoma Basin in northwestern Arkansas. The Morrowan series of the
Arkoma Basin is composed of two members; Hale and Bloyd formations (Table 2.1). The
Hale Formation consists of two members; a lower, Cane Hill Member, composed of calcare-
ous siltstone, sandstone and shale, and an upper, Prairie Grove Member, composed of calcar-
eous sandstone with fossiliferous sandstone lenses, comprising the upper Hale Formation
(Delavan, 1985). The lithologic facies of the Morrowan sections indicate a marine environ-
ment. The lower and middle members of the Atokan Formation consist primarily of thick in-
tervals of sandstone, siltstone, and shale that represent the passive margin of the Arkoma Ba-
sin (Houseknecht, 1986). Both well logs (Figure 2-3) and field techniques are used in this
study to assist in the general description of the formations.

19
Table 2-1: Stratigraphic column representing the Morrowan and Atokan Series with mem-
bers and unit’s names (modified from Zachry, 1983).

20
Figure 2-2: Generalized stratigraphic column of the Morrowan and Atokan series of the
Pennsylvanian succession of northcentral Arkansas. (Modified from McGilvery, 1982).

21
Figure 2-3: Wireline well log showing the log signature for all of the formation intervals for
the study area highlighted with distinctive colors.

22
2.3.1 Morrowan Strata
The Morrowan Series (Early Pennsylvanian) is composed of a succession of alternat-
ing layers of sandstone, siltstone, shale, and limestone that accumulated on a passive conti-
nental margin. Several studies have been conducted to analyze the Morrowan strata. Due to
the fact that the Morrowan deposits have potential for natural gas production, numerous wire-
line logs are available for subsurface studies. In addition, the outcrop exposures of the Mor-
rowan succession provide more stratigraphic information to relate subsurface studies from the
wireline logs to surface exposures. Morrowan strata consist of the Hale and overlying Bloyd
formations (Figure 2-5).
The Hale Formation (Lower Morrowan) is separated from underlying Mississippian
rocks by a regional disconformity (Delavan, 1985). The Hale interval is mainly composed of
alternating sandstone and shale units in surface and subsurface observations. It consists of
two members in northwest Arkansas: the lower Cane Hill and upper Prairie Grove members.
The Cane Hill Member of the Hale Formation overlies the Pennsylvanian– Mississip-
pian contact in Arkansas. It is composed mainly of silty shale intervals interbedded with non-
calcareous siltstone, shale, and thin-bedded, fine-grained sandstone intervals (Studebaker,
2014). The upper Hale interval is composed of thin bedded sandstone units, while the lower
interval is composed of interbedded sandstone with shale units. The lower interval is well ex-
pressed on wireline logs (Figure 2-1). However, in this study, they are combined in one inter-
val for ease interpretation.
The Prairie Grove Member of the Hale Formation (Figure 2-4) unconformably over-
lies the Cane Hill Member and underlies the Brentwood Member of the Bloyd Formation. It
is mainly composed of fine to medium grained fossiliferous, cross bedded sandstone with
lenses of highly fossiliferous sandy limestone as well as oolitic limestone. Honeycomb

23
weathering is a very typical characteristic of the surface exposure of the Prairie Grove (Stu-
debaker, 2014). The surface outcrop along Highway 412 presents highly cross-bedded sand-
stones (Figure 2-4 (B)). Also, it is well-expressed in wireline logs (Figure 2-1) as a thick
blocky signature of sandstone, reflected by low gamma readings, with little shale in the Prai-
rie Grove interval.
Both field studies and well log analyses indicate that the Cane Hill and Prairie Grove
members are characteristic of a marine environment, indicated by wavy stratification, ripple
marks, and burrows. These outcrop observations suggest that the Cane Hill Member was de-
posited in shore zone, tidal flat environments and the overlying Prairie Grove was deposited
in near shore, shallow marine settings. This indicates an upward deepening, transgressive sys-
tems tract.

24
Figure 2-4: Prairie Grove Member along Arkansas 412. Photograph (A) shows thick calcare-
ous sandstone beds and photograph (B) displays the development of cross bedding within the
sandstone. Fossils in the sandstone indicate a marine environment.
A
B

25
The Bloyd Formation overlies the upper strata of the Prairie Grove Member and un-
derlies Atokan strata of the Casey unit (Lower Atoka Formation). The boundary between the
Bloyd and Lower Atoka Formation is characterized by a major unconformity, the Morrowan-
Atokan boundary. The Bloyd interval is divided into the following four members, listed in as-
cending order: Brentwood Limestone, Woolsey Shale (very western part of Arkoma) and the
middle Bloyd sandstone (substituting the Woolsey Shale in most parts of the Arkoma Basin),
Dye Shale, and Kessler Limestone (McGilvery, 1982). These intervals are characterized by a
heterogeneous sequence of predominantly marine shale, sandstone, siltstone, and limestone
units in northwest Arkansas (Delavan, 1985). The Bloyd Formation accumulated over a broad
ramp that was gently sloping toward the central part of Arkansas prior to the development of
the Arkoma foreland basin. In general, the Bloyd Formation members were deposited in shal-
low marine and non-marine environments. Both field studies and wire-line well logs are used
to identify the Bloyd Formation members in this study.
Lithologies must be identified to understand the sedimentary environments that con-
trol the deposition of the Bloyd member. The Brentwood Limestone Member composes the
lower part of the Bloyd Formation. It overlies the Prairie Grove Member of the Hale For-
mation and underlies the Middle Bloyd Member of the Bloyd Formation. The boundary be-
tween the Bloyd and Hale formations is interpreted as a sharp boundary that represented by
thin shale interval (Figure 2-5). The Brentwood Member is described as a succession of alter-
nating strata of limestone and shale that were deposited in shallow marine environments. The
thin bedded shales are described as dark colored, fissile, and non-calcareous (McGilvery,
1982), which was supported by field observations (Figure 2-6). The well log interpretation
(Figure 2-1), shows some lateral variations in the Brentwood facies, indicated by thin lime-
stone beds (low gamma ray readings) separated by shale facies.

26
Figure 2-5: Photograph of the transitional contact between the Prairie Grove and Brentwood
Limestone members along Arkansas Highway 23 near Huntsville. The outcrop displays a car-
bonate buildup generated by storm activity.
Figure 2-6: Sandstone- shale sequence in the Brentwood Limestone interval along Arkansas
412 near Huntsville in Madison County.
The Woolsey Shale Member was deposited over the Brentwood Member. It is com-
posed of fissile, medium to dark grey, thinly laminated, non-calcareous shale interbedded
with thin, brown siltstone, representing terrestrial sediments that were deposited in a conti-
nental environment that trailed a regressing Morrowan sea. The Woolsey Shale sequences
terminate at another unconformity in the Morrowan overlain by the marine “caprock” of the
Brentwood Limestone
Prairie Grove

27
Dye Shale Member. East of the Arkoma Basin, the Woolsey Shale interval passes into an
equivalent interval of the Middle Bloyd sandstone deposits.
The boundary between the Brentwood and underlying Middle Bloyd members is de-
scribed as a sharp boundary (Figure 2-7). The Middle Bloyd Formation (Figure 2-8) is com-
posed of fine to medium grained sandstone, with cross-stratification. Pontiff (2007) described
the middle Bloyd sandstone as composed of conglomeratic sandstones, which is interpreted
to be deposited along the shelf and outer margins of the Arkoma. In addition to the record of
the repetitive sections and the evidence of unidirectional current patterns, these evidences
suggest that the middle Bloyd sandstone unit was deposited by a braided stream system
within the overall marine deposits of the Morrowan strata.
The fossiliferous, marine deposits of the caprock at the base of the overlying Dye
Shale Member suggested that these deposits were brought by transgression of late Morrowan
seas (McGilvery, 1982).
Figure 2-7: Contact developed between the Brentwood Limestone and Middle Bloyd Sand-
stone members along Arkansas Highway 16 south of Huntsville.
Middle Bloyd Sandstone
Brentwood Limestone

28
Figure 2-8: Contact between the Brentwood and Middle Bloyd members of the Bloyd For-
mation indicating abrupt change in the lithology. Cross bedding dominates both the Brent-
wood and Middle Bloyd members along Arkansas Highway 16 south of Huntsville.
The Dye Shale Member was unconformably deposited above the Woolsey and middle
Bloyd sandstone members. The Dye Shale Member is underlain by the caprock, which refers
to thin layers that are composed of calcareous sandstone or sandy limestone. The caprock re-
flects a transgressive surface that marks the return of a marine environment succeeding the
interval of terrestrial Woolsey deposits (Delavan, 1985). Also, the caprock represents the ini-
tial transgression and the re-building of marine deposits (McGilvery, 1982). The Dye Shale
Member is composed of dark gray to black shale and siltstone. McGilvery (1982) referred to
the caprock as the basal part of the Dye Shale Member that was deposited in shallow marine
conditions. Although these members (Woolsey, the caprock, and Dye Shale) have been stud-
ied in detail in previous theses, they have not been utilized in the subsurface studies of the
Arkoma Basin.
The Dye Shale is conformably overlain by the Kessler Limestone (Figure 2-9). The
Kessler Member is overlain unconformably by the Lower Atokan Formation. It is composed
dominantly of bioclastic, oolitic limestones and sometimes a sequence of interbedded shale
Middle Bloyd Sandstone
Brentwood Limestone

29
and limestone (Studebaker, 2014). The Kessler Limestone Member is present at the surface
and in the subsurface, making it easy to identify. In surface exposures (Figure 2-9), the Kess-
ler Member was deposited in thin layers of limestone atop dark shale representing the Dye
Shale Member. Also, wireline logs record low gamma ray readings in the thin interval for the
Kessler Member (Figure 2-1). McGilvery (1982) described the Kessler Member deposits to
represent the re-establishment of a carbonate shelf environment. Delavan (1985) described
the Kessler sediments as a result of mixing processes during deposition due to an increase in
siliciclastic sediments deposited within the carbonate sediments.
Figure 2-9: (A) Limestone-shale sequence between the Kessler and Dye Shale members. (B)
The unconformable boundary between the Morrowan and Atokan series. Both photos were
taken along Interstate 49, south of Fayetteville.
Kessler Member
Dye Shale Member
Trace Creek/ Atokan
Morrowan
A
B

30
For the purpose of this study, the Morrowan series has been divided into the following
three units based on well log interpretations: Hale, Brentwood, and Kessler intervals. They
are divided to define the top of the Hale and the top and base of the Bloyd Formation.
2.3.2 Atokan Description
The Atokan is a thick succession of shallow marine deposits (Zachry, 1983). The in-
terval is subdivided into the following three formations, the Upper, Middle, and Lower
Atoka. These formations are based on the structural configuration of the Arkoma Basin. The
Lower Atoka represents the last deposits on the stable Ozark Platform before its transition
into the Arkoma Foreland Basin during the Middle Atokan. The focus of this study is to im-
prove the understanding of the structure and timing of this transition. The sediments were
transported to the basin from source areas to the east in the Appalachian region. Additionally,
the higher rate of sediment accumulation is attributed to the closing and reduction of the ba-
sin area, which confined the transport of the sediments through the time. In early to middle
Atokan time, the sedimentary facies were deposited as a result of deep water environment to
the south and west of the study area, while shallow marine and fluvial-deltaic facies were de-
posited to the north on the Arkoma shelf.
At the surface, the contact is with the Trace Creek Shale. Because in the basin/sub-
surface, it is with the Spiro sandstone (Figure 2-9 (B)). The Lower Atoka is composed of
about seven to eight sandstone lithostratigraphic units; Spiro, Patterson, Cecil Spiro, Dunn C,
Lower Jenkins, Upper Jenkins, and Sells (Table 2-1). These units are bounded by intervals of
shale. Also, the Atokan units were deposited on a stable shelf environment in highly destruc-
tive delta systems. The shale intervals of the Lower Atoka Formation show upward coarsen-
ing toward the sandstone facies (Figure 2-1). Also, the shale intervals are considered to be
good indicators for an open-shelf environment during multiple cycles of transgression and re-
gression of delta progradation (Jameson, 1998). The Lower Atoka Formation shows a gentle

31
thickening due to stable shallow marine to shore zone environment. The Spiro Unit repre-
sents the first Atoka sandstone above the Morrowan Kessler Member in most parts of the ba-
sin. For the purpose of this study, the base of the Casey Unit represents the last sandstone
unit in the Lower Atoka Formation as a boundary to the Middle Atoka Formation. In this
study, the Lower Atoka Formation is mapped through wireline logs to represent one interval.
This study focuses on mapping the Casey Unit as the upper contact of the Lower Atoka For-
mation. Additionally, the Lower Atoka Formation is studied in the field to highlight the
boundary between the Morrowan and Atokan series and to provide more information about
the depositional environment (Figure 2-10 to 2-12).
Figure 2-10: Lower Atoka outcrop along Highway 123 near Pelsor. Thick cross bedded
sandstone interval characterizes the outcrop.

32
Figure 2-11: A Lower Atoka interval outcrop along Highway 23. The outcrop shows multi-
ple sandstone and shale units. This pattern of depositional strata shows a similar pattern to
well log signature.
Figure 2-12: Herringbone cross-stratification indicating the tidal environment during the
Lower Atoka deposition along Highway 123.
The Middle Atoka Formation is considered to be the thickest formation in the Arkoma
Basin. It averages (1500 to 3500 feet) in the study area. The increase in thickness compared
to the Lower Atoka is due to the increase in sediment supply as increased subsidence (House-
knecht, 1986). The Middle Atoka Formation is subdivided into five units: Casey, Freiburg,
Moyer, Areci, Tackett, and Morris (Table 2-1). These intervals are described by Woolsey

33
(2007) as shale-dominated units separated by sandstone intervals. Even though the shale in-
tervals dominate the Middle Atoka interval, the sandstone units are much thicker than in the
Lower Atoka Formation (Figure 2-13). These intervals of sandstone and shale were deposited
in high constructive delta systems that are characterized by prograding facies south of the ba-
sin (Zachry, 1983). For this study, the base of the Middle Atoka Formation is mapped as the
top of the Casey Unit as a distinctive boundary from the Lower Atoka. Also, the top of the
Middle Atoka is mapped using the top of the Tackett Unit as its upper boundary. The Casey
and Tackett units are mapped using wire line logs.

34
Figure 2-13: Middle Atoka interval along Arkansas 215. The outcrop is characterized by
thick sandstone intervals, which represent the lowest part of the formation.
2.4 Local Cross Sections Description
For a comprehensive analysis of the stratigraphy of the study area, six cross sections
were constructed; two west-east strike sections and four north-south dip sections (Figure 2-
14). The regional cross sections (A -A and B-B’) extend west to east from east Johnson
County to central Pope County. These cross sections include the Morrowan and Atokan for-
mations. From base to top, the identified formation intervals are the Hale, Brentwood, Kess-
ler, Lower, and Middle Atoka intervals. The stratigraphic cross sections are flattened on the

35
top of the Middle Atoka interval. All of the intervals are identified in the wireline logs se-
lected for the cross sections. The Gamma ray log (GR) is the primary curve used to correlate
the intervals in this study. These cross sections define the development of the lithostrati-
graphic-sequence of the stratigraphic framework, the depositional environment, and deposi-
tional timing.
It is essential to understand the differences in the orientation of the stratigraphic cross-
sections. The stratigraphic, dip oriented cross sections reflect landward to basinward changes
in stratigraphy and depositional facies. The stratigraphic, strike orient sections reflect lateral
facies continuity or change along strike. For this study, both types of cross sections are used
in order to provide an accurate visualization for the change in the depositional facies verti-
cally or horizontally. Additionally, it is important to distinguish the type of stratigraphic con-
tacts between the mapped intervals for the stratigraphic interpretation purposes. A sharp con-
tact may represent a flooding surface or an unconformity. Since the base of the Hale For-
mation is not mapped, it is difficult to interpret the increase in its thickness. The base of the
Bloyd Formation is represented by the Brentwood interval, and the top of the formation is
represented by the Kessler interval.
In general, knowing the type of facies contacts is important in the stratigraphic inter-
pretation. Facies contacts represent the boundaries between two facies joined through Wal-
ther’s Law. The contact between the Bloyd and Hale formations shows as a sharp contact.
This type of sharp contact results from a maximum flooding surface. The contact between the
Lower Atoka Formation and the Kessler Member showed a sharp contact as well. This sharp
contact boundary may not have displayed substantial erosional relief, but it shows some later-
ally varying depths of erosion between Lower Atoka and Kessler indicating an unconformity
boundary. However, the boundary between the Lower and Middle Atoka formations shows a
gradual change in the boundary which relates to the similarity in the depositional facies for

36
both formations. The point is sharp contacts can result from different conditions, they are
“non-unique”. Therefore, it is very important to understand the contact when interpreting the
contact character.

37
Fig
ure
2-1
4:
ear
th i
mag
e fo
r th
e re
gio
nal
cro
ss s
ecti
ons
wit
h t
he
loca
tion i
ndic
ated
by T
ow
nsh
ips
and R
ange.

38
Fig
ure
2-1
5:
Eas
t –W
est
regio
nal
str
atig
rap
hic
cro
ss s
ecti
on i
n n
ort
hce
ntr
al p
art
of
the
Ark
om
a B
asin
dep
icti
ng t
he
mai
n
inte
rval
s fo
r th
is s
tudy. T
he
cross
sec
tion d
atum
is
the
upper
boundar
y f
or
the
Mid
dle
Ato
ka
Form
atio
n.

39
2.4.1 Cross Section A-A’
Cross section A-A` is the northernmost west to east cross section in the study area (Figure
2-15). It extends from the west in east Johnson County to the east in central Pope County in
Township 11N, Ranges 23W-20W (Figure 2-14). The coveys distance of approximately 23 miles.
Five well logs were used to construct this cross section. These well logs are not equally spaced in
terms of the horizontal distance.
The Bloyd Formation shows a constant lateral thickness along the northern part of the
study area. The increase in depth is about 60 feet deep toward the west side of the cross section.
The Lower Atoka interval shows a lateral increase in its thickness toward the west side of the
cross section. This increase is gradual in thickness due in part to the shallow depositional stable
environment of the stable Arkoma shelf. The lower Atoka thickness increases to 540 feet in thick-
ness between the western and eastern most wells. The Middle Atoka interval thickness increases
as well to the very western side of the study area. The increase is about 300 feet. In essence, the
increase in the Bloyd strata is more likely to have been controlled stratigraphically. However, the
increase in thickness in the Lower and Middle Atoka intervals is more likely to have been caused
by structural control.

40
Fig
ure
2-1
6:
Eas
t –W
est
regio
nal
str
atig
rap
hic
cro
ss s
ecti
on i
n t
he
nort
hce
ntr
al p
art
of
the
Ark
om
a B
asin
dep
icti
ng t
he
mai
n f
or-
mat
ion t
ops
for
the
study.

41
2.4.2 Cross Section B-B`
Cross section B-B` is the southernmost west to east cross section in the study area (Figure
2-16). It extends from the west in east Johnson County to the east in central Pope County in
Township 8N, Range 22W-18W (Figure 2-14). The cross section covers a distance of approxi-
mately 26 miles horizontally. The well logs are not spaced equally. Similar to the cross section A-
A`, the Bloyd interval shows a constant lateral thickness along the southern part of the study area.
The two west-east stratigraphic sections display similar thickness. The thickness of the Bloyd
Formation displays a lateral gentle increase to the western side of the study area. This increase is
minimal (about 40 feet thick) comparing to both the Lower and Middle Atoka intervals. In con-
trast, The Lower Atoka Formation displays a minimal decrease in the strata thickness about 60
feet to the west side of the area. It is hard to interpret the main control for the depositional strata
in this cross section since the well logs are not equivalently picked over the 26 miles of the total
area. However, the Middle Atoka Formation is increased by about 540 feet in thickness to the
western side of the study area.

42
C
C`
Fig
ure
2-1
7:
Nort
h-S
outh
reg
ional
str
atig
raphic
cro
ss s
ecti
on i
n t
he
nort
hce
ntr
al p
art
of
the
Ark
om
a B
asin
dep
icti
ng t
he
mai
n i
nte
r-
val
s fo
r th
e st
udy a
rea.

43
2.4.3 Cross Section C-C`
Cross section C-C` is located at the very far western edge of Johnson County in Town-
ships 10N-9N, Range 23W (Figure 2-17). It extends north-south in the study area (Figure 2-14).
The overall distance that covered by this cross section is about seven miles. Five well logs are
used in this cross section. The change in the depositional style is due to a fault. This study area is
part of the Mulberry Fault zone system (see chapter 3). The fault presented between the well JJG
LANDS and well EUREKA BRICK & TILE. The Bloyd interval of this cross section indicates a
constant vertical depositional style for the whole cross section. Also, it displays a lateral gentle
decrease in the thickness to the northern side. Also, the Bloyd Formation strata show gradual thin-
ning of the study area. The decrease in the measured thickness of the Bloyd interval is about 120
to 80 feet. The Lower Atoka Formation follows the same depositional style. The thickness of the
Lower Atoka also shows a decrease to the northern part of the area (approximately 60 feet). The
thickness decrease is measure previously in the cross section B-B`. The Middle Atoka interval
thickness is also reduced by about 660 feet to the north side of the area.

44
D
D`
Fig
ure
2-1
8:
Nort
h-
South
reg
ional
str
atig
raphic
cro
ss s
ecti
on o
f th
e A
rko
ma
Bas
in.

45
2.4.4 Cross Section D-D`
Cross section D-D` is located at the western side of Johnson County in Townships 10N-
8N, Range 22W (Figure 2-18). This cross section covers a distance of approximately eight miles
(Figure 2-14). The units in this cross section are affected by the Mulberry Fault zone as the previ-
ous cross section. The Bloyd Formation shows a nearly perfect constant thickness that extends
from south to north. The Bloyd Formation shows a constant thickness extent. The Lower Atoka
interval follows the same depositional style as the previous cross section (C-C`). It shows a gradu-
ally gentle decrease in its thickness to the north side of the cross section. The measured thickness
of the Lower Atoka Formation reveals a value of 240 feet of differences between the southern part
and the northern part of the cross section. As a result, the Lower Atoka interval is thinner to the
northern side of the two north-south cross sections, specifically in Townships 10N to 8N. The
Middle Atoka Formation thickness is also reduced by about 540 feet to the northern portion of the
area. Comparing to the previous cross section, the decrease in thickness is dropping by 120 feet as
mapping toward the eastern part of the study area.

46
Fig
ure
2-1
9:
E-E
` N
ort
h –
South
reg
ional
str
atig
rap
hic
cro
ss s
ecti
on i
n t
he
nort
hce
ntr
al p
art
of
the
Ark
om
a B
asin
.
E`
E

47
2.4.5 Cross Section E-E`
Cross section E-E` is located at the central part of Pope County in Townships 10N-8N,
Range 20W (Figure 2-19). This closely spaced cross section covers a distance of approximately
11 miles. The well logs in this cross section are spaced relatively close distance. In this cross sec-
tion, the mapped units for the Morrow and Atoka intervals show a gradual change to the north of
the cross section. The Bloyd Formation interval reveals upward thickening to the southern side of
the study area. The observed increase in the thickness of the Bloyd interval is about 60 feet de-
scending south from the shelf into the southern portion of the basin. The Lower Atokan interval
increases about 340 feet from north to south. Thickening occurs in the shale intervals of the
Lower Atoka interval, whereas, the thickening in the Middle Atoka interval occurs at the sand-
stone intervals. The Middle Atoka strata increase about 900 feet northward. That major increase
in thickness indicates the role of syn-depositional faulting effect on controlling the depositional
strata of the Middle Atoka.

48
F
F`
Fig
ure
2-2
0:
Nort
h-
South
reg
ional
str
atig
raphic
cro
ss s
ecti
on i
n t
he
nort
hce
ntr
al p
art
of
the
Ark
om
a B
asin

49
2.4.6 Cross Section F-F`
Cross section F-F` is located in the very far eastern edge of Pope County in Townships
10N-8N, Range 20W (Figure 2-20). This cross section covers a distance of approximately 10
miles. In similarity with the cross sections C-C` and D-D`, this cross section reveals a continuous
increase in the thickness of the mapped intervals for the Morrowan and Atoka formations toward
the southern portion of the study area. The thickness displays a gradual increase to the southern
part. The Bloyd Formation interval reveals a constant thickness interval from north to south. The
Bloyd Formation thickness is approximately 180 feet. The constant thickness interval of the
Bloyd formation is similar to the one shown in section (D-D`). The Lower Atoka strata increase to
about 120 feet from north to south. The Lower Atoka interval thickness increases gradually along
with the syn-depositional faulting system, which is important in terms of the Arkoma Basin devel-
opment. Additionally, the Middle Atoka strata reveals a thinning upward pattern to reveal a value
of approximately 780 feet of the whole measured section.

50
2.6 Isopach Maps
The cross sections indicate variations in the thickness of stratigraphic units. Four isopach
maps were generated using Golden Software (Surfer 13). The first isopach map shows the Brent-
wood interval at the base of the Bloyd Formation. The Kessler interval isopach map is constructed
to include the rest of the units in the Bloyd as well as the Kessler. The two other isopach maps
represent the Lower, and Middle Atoka intervals. The generation of isopach maps is helpful in in-
terpreting the stratigraphic relationships of the geologic formations in the study area. Also, iso-
pach maps are helpful in the structural interpretation to determine the effect of important struc-
tural features, such as faults, anticlines, synclines, grabens, and horsts. For the purpose of this
chapter, the focus of isopach maps is mainly on understanding the stratigraphic relationships of
the Bloyd (Kessler and Brentwood intervals) and Atoka (Lower and Middle) formations (Figure
2-3).
Isopach maps provide critical information in terms of structural and stratigraphic controls
of sediment deposition. An isopach map for an interval can be a few feet thick, such as Kessler
and Brentwood intervals, or it can be several thousand thick, such as the Lower and Middle Atoka
formations. Both the Lower and Middle Atoka formation isopach maps show a gentle increase in
the stratal thickness to the northern and northeastern part of the formation intervals. These maps
will be described individually in this section.

51
2.6.1 Brentwood Interval Isopach Map
Figure 2-21: The Brentwood interval isopach map.
The Brentwood interval reaches a maximum thickness of about 200 feet in the western
most side of the study area, Townships 11N-10N, Range 23W, and a minimum thickness of
about 35 feet (Figure 2-21). The map shows that most of the mapped area indicates a slight de-
crease in average thickness compared to the Atoka intervals isopach maps. It is difficult to deter-
mine the general trend of thickening or thinning in the Brentwood isopach map. However, over-
all thickening appears to be on three parts of isopach maps, the northwestern part, central part,
and small area to the north eastern section. The three parts of the area showing a relative thicken-
ing (around 155 feet) compared to the other parts that suggest an overall a small thickness of
around 75 feet. The possible cause of these areas is either graben features or connected channels
that is related to the depositional environment.

52
2.6.2 Kessler Interval Isopach Map
Figure 2-22: The Kessler interval isopach map.
The Kessler interval of the Bloyd Formation (Figure 2-22) follows the same thickness pat-
tern as the Brentwood interval, with thickness ranging (30-240) feet. The isopach map of the
Kessler Interval indicates a continuous thickening in most portions of the interval, except for the
northeastern part of the map. In the wetren part of the isopach map, especially in Townships 11N-
8N, Range 22W, there is an obvious thinning, suggesting that there might be an increase in the
subsidence rate of the basin that provide more space for sediments to accommodate later in Lower
Atokan time. Additionally, this thickness map shows different depositional pattern to the south-
central portion of the area, especially in Township 8N, Range 21W, which suggest that there is an
increase in the thickness of the area from about 35 feet of the Kessler Interval to about 200 feet.

53
This pattern of thinning and thickening might be related to the depositional environment of the
underline Bloyd Formation of the Morrowan Series.
2.6.3 Lower Atoka Interval Isopach Map
Figure 2-23: The Lower Atoka interval isopach map, with faults bounded the graben in red color.
The Lower Atoka interval lies above the Kessler interval in the stratigraphic column (Fig-
ure 2-2). This interval (Figure 2-23) represents the total thickness of the Lower Atoka Formation,
which is significant to focus on because it represents deposition before the inception of the
Arkoma Basin subsidence. The Lower Atoka isopach map attains a maximum thickness of ap-
proximately 1750 feet in the northeastern part of the study area, in Township 10N, Range 20W,
and it attains a minimum thickness of approximately 55 feet in Township 10N, Range 19W. The
decrease in thickness in this part of the area may be controlled structurally. The isopach map
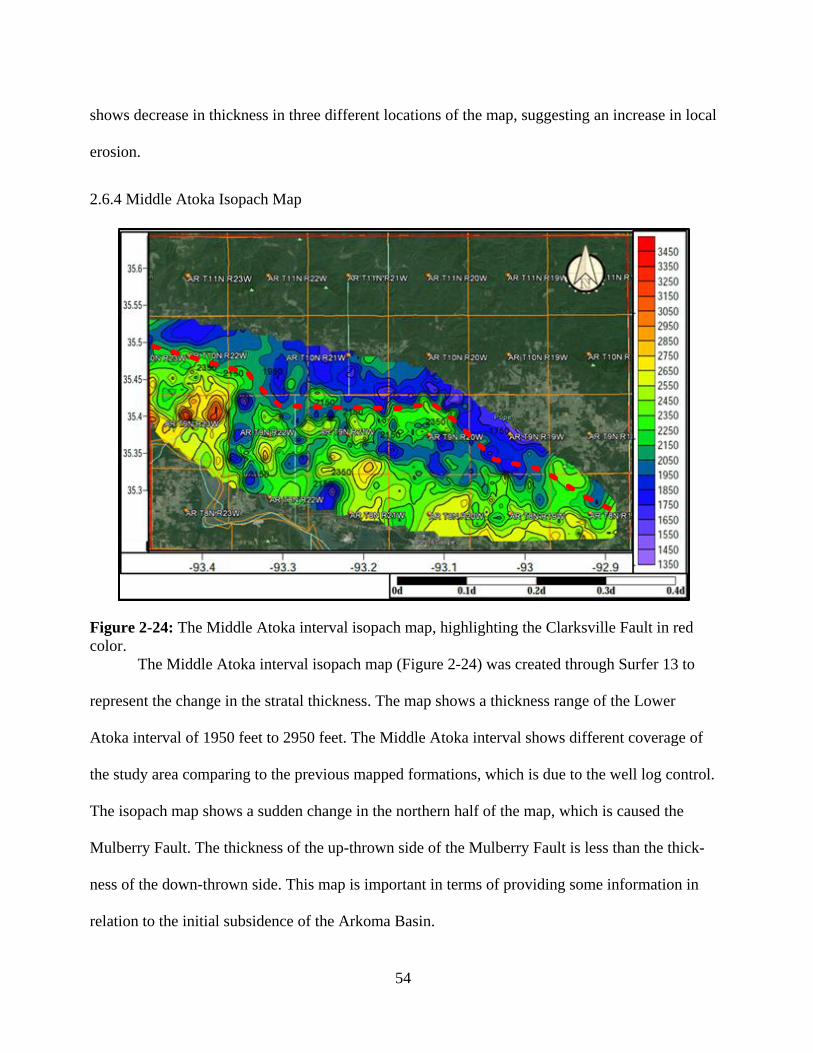
54
shows decrease in thickness in three different locations of the map, suggesting an increase in local
erosion.
2.6.4 Middle Atoka Isopach Map
Figure 2-24: The Middle Atoka interval isopach map, highlighting the Clarksville Fault in red
color.
The Middle Atoka interval isopach map (Figure 2-24) was created through Surfer 13 to
represent the change in the stratal thickness. The map shows a thickness range of the Lower
Atoka interval of 1950 feet to 2950 feet. The Middle Atoka interval shows different coverage of
the study area comparing to the previous mapped formations, which is due to the well log control.
The isopach map shows a sudden change in the northern half of the map, which is caused the
Mulberry Fault. The thickness of the up-thrown side of the Mulberry Fault is less than the thick-
ness of the down-thrown side. This map is important in terms of providing some information in
relation to the initial subsidence of the Arkoma Basin.

55
CHAPTER 3
STRUCTURAL EVOLUTION OF THE ARKOMA BASIN
3.1 Structural Analysis
The primary objective of subsurface structural analysis is to develop an understanding of
the overall structural behavior of rock deformation. This introduction aims to provide a short de-
scription for the most significant terminologies or elements of structural geometries that will be
discussed in this chapter. Explaining the structural classification in relation to the role of tectonics
is helpful in determining the affective stresses that caused the deformation on depositional strata.
Then, it provides valuable tool in the exploration for hydrocarbons.
The method used in this chapter is mapping formation intervals of the study area as inter-
preted on well logs through the IHS Petra. Formation tops picked on the well logs were trans-
ferred to Surfer 13 to generate structural contour maps. Finally, cross sections were made through
IHS Petra based on the generated structural maps to illustrate structural relationships in profile.
3.2 Previous Subsurface Studies
Several studies have been conducted on the structural configuration of the Arkoma Basin.
Prior to explaining the regional structure, it is important to have a general understanding for some
of the structural terminologies that have been used in this chapter. The Arkoma Basin is charac-
terized by series of normal faults. Those faults resulted from tectonic activities that are associated
with the Ozark Uplift and Ouachita Orogeny.
The main focus in this study is to analyze the normal faults in the study area. A complex
system of faulting (Figure 3-1) within the Lower to Middle Atoka formations was described as the
inception of the Aroma Basin development.

56
Figure 3-1: North- south cross section (modified from Zachry and Sutherland, 1984). The section
shows the thickening of the Atoka section on the downthrown side of the growth normal faults.
Most of the faults in the Arkoma Basin are east-west trending down to the south normal
faults. A master fault is one with major displacement. The growth faults in the Arkoma were gen-
erated during subsidence of the basin when sedimentation rates were high, Middle Atoka sedi-
ment accumulated during this time (Houseknecht, 1986).
3.3 Well logs and Seismic Profile Analysis
In order to describe the subsurface structure of the western-central Arkoma Basin, about
1550 raster logs and a migrated seismic reflection profile were utilized. Subsurface studies use
different logging elevations for structural purposes (Figure 3-2). These measurements include;
Kelly Bushing (KB), Measured Depth from the Kelly bushing (MD), True Vertical Depth (TVD),

57
Sub-Sea True Vertical Depth (SSTVD), and Subsea (SS) depth. For the purpose of this study, the
subsea true vertical depth (SSTVD) measurement was used. SSTVD refers to the vertical distance
or depth from sea level to the mapped subsurface formation (Tearpock and Bischke, 1991).
Figure 3-2: The elevation value based on subsurface location in relation to a mapped formation
(modified from Tearpock and Bischke, 1991).
Wireline log correlations can document repeated or a missing section (Figure 3-3). A re-
peated section is defined as “a part of stratigraphic section appearing twice on a log as the result
of a reverse fault, and consequently lengthen the section” (Tearpock and Bischke, 1991). In addi-
tion, missing sections represent missing parts of a known formation, which usually occur as a re-
sult of a normal fault.
The study area also includes some deviated wells, especially to the southern part of the
area causing an increase in thickness for the depositional stratal.

58
Figure 3-3: Correlation of Gray “N”, Cagle, and Bluff Bee well logs, indicating the variation in
the Middle Atoka Formation thickness highlighted in a red color. The section labeled missing sec-
tion, in the Bluff Bee well indicate that a fault cut the well
The 2-D seismic profile (Figure 3-4) is perpendicular to the strike of east-west faults. The
profile shows various small normal faults as well as the Mulberry Fault. A graben was mapped to
the north of the Mulberry Fault. Most faults extend to the surface. However, it is difficult to deter-
mine if these faults transect the Middle Atoka Formation.

59
Fig
ure
3-4
: A
nort
h-s
outh
sei
smic
pro
file
show
ing t
he
gen
eral
norm
al f
ault
s, f
or
loca
tion s
ee f
igure
(-)
(S
hie
lds
Co
mpan
y,
per
sonal
com
munic
atio
n, D
ecem
ber
8, 2015).

60
3.4 Local Structure
After identifying the formation tops on the well logs, structural contour maps were con-
structed. In general, the geological map of Arkansas over the study area (Figure 3-5) shows nu-
merous east- west trending faults. The mapped formations at the surface include the Hale and
Bloyd formations of the Morrowan Series, and the Lower Atoka, and Middle Atoka intervals. The
geological map of the study area indicates numerous east-west trending faults similar to those
mapped in this study.
Figure 3-5: The geological map of the study area, depicting the regional east- west trending faults
(modified from Arkansas Geological Survey).
This section aims to delineate the most prominent structural features in the study area.
Even though the study area does not have good exposures, google earth provides valuable surface
profiles to show whether or not subsurface faults have affected the topography of the study area
(Figure 3-21).

61
3.5 Structural Contour Maps
The study area is located on the shelf and northern slope of the Arkoma Basin. Prior to
constructing the structural maps, formation intervals were mapped using IHS Petra. The data for
formations depths were exported to construct structural maps through Surfer 13. In order to match
the IHS Petra and Surfer 13 well log coverage, the maps were transferred to Google Earth to show
the actual coordinates for the structural maps in terms of townships and ranges. Generally, the
maps are oriented roughly in a slight southeast to northwest orientation. The orientation is con-
structed based on well log control in the study area.
Structural contour maps were generated for the Hale, Bloyd, and Lower and Middle Atoka
intervals (Figure 3-6 to 3-10). The maps show two major east-west trending normal faults cross-
ing the area in the northern and southern quadrants. These two master faults are mapped as lines
on the structural maps. Usually, faults have planar or smoothly curved in most of local structural
contour maps (Groshong, 2006). The maps for the Morrowan and Lower Atoka Formations define
an additional geological feature that is interpreted as a graben.
The northern most fault is the Mulberry Fault. Few publications mention that a second
master fault in the study area is the Clarksville Fault (Collier et al., 1907). For analyzing these
two master faults as well as several small faults, seven north-south and two east-west cross sec-
tions were constructed. In addition to the east-west trending faults, north-south trending faults are
discussed. The north-south faults are oriented perpendicular to the Mulberry Fault. The structural
contour maps revealed other structure evidence indicating the orientation of the two master faults
surfaces, and a major graben feature that exists at the top of the mapped designated region.

62
3.5.1 Structural Contour Map of the Hale Formation Interval
A structural contour map was generated to illustrate the structural geometry at the top of
the Hale interval (Figure 3-6). A few anomalies are present in the Hale structural map, specifi-
cally in the central part of the contour map. The Hale interval dips steeply into the basin, which is
highlighted by the change in color from red (shallow) to blue (deep). The two east-west trending
master faults can be observed on all of the structural maps, except for the Middle Atoka interval.
The Mulberry Fault extends from Township 11N and Range 24W to Township 9N and Range
18W. The Clarksville master fault extends from Township 10N and Range 23W to Township 8N
and Range 18W. These two master faults are recognized because of the rapid change in spacing of
the contour lines. Also, the structural map shows that there is a sudden change of the Mulberry
Fault at the central part. The change represents a decrease in the depth, represented by the contour
lines. This decreased was bounded by two small or antithetic faults that are trending in the oppo-
site direction of each other forming a graben.
Figure 3-6: Structural contour map of the Hale Formation interval.

63
3.5.2 Structural Contour Maps of the Bloyd Intervals
The overall structure of the Kessler and Brentwood intervals of the Bloyd Formation are
very similar to that of the Hale interval (Figure 3-7 and 3-8). The area has a good well logs cover-
age. The master faults cutting the Bloyd intervals are located at the same location as the faults in
Hale interval. Also, the east-west trending faults cross the area in almost a straight line. The iso-
pach maps in chapter two for the Kessler and Brentwood intervals (Figure 2-24 and Figure 2-25)
do not show an obvious thickening as a result of faulting. It leads to interpreting that the move-
ments on master faults are either not active or they were generated after the Morrowan time. Sev-
eral regional small east-west trending normal faults are recognized through the cross sections.
Figure 3-7: Structural contour map of the Brentwood interval.

64
Figure 3-8: Structural contour map of the Kessler interval.
3.5.3 Structural Contour Map of the Lower Atoka Formation Interval
The Lower Atoka structure map (Figure 3-9) has similar structural pattern to the one of the
Morrowan formations. The map indicates the effect of the master faults to the north and south
portion of the map. In addition, the graben at the lower Atoka level is more well defined because
the top Lower Atoka picks can be identified in most of the wells. The two master faults separated
the formation into three parts. Strata on the up-thrown block of the Mulberry Fault are thinner
than on the down-thrown block. The same is the case for the Clarksville Fault to the south. In
general, the structural map for the Lower Atoka interval shows some structural changes south of
the study area. The displacement between the up-thrown side of the Mulberry Fault and the down-
thrown side of the Clarksville Fault is about 2500 ft.

65
Figure 3-9: Structural contour map of the Lower Atoka interval.
3.5.4 Structural Contour Map of the Middle Atoka Formation Interval
The Middle Atoka Formation interval structure map has different structural style in com-
parison to the Morrowan maps (Figure 3-10). The change in the structural configuration of the
Middle Atoka interval resulted in difficulty in identifying the Mulberry and Clarksville faults at
this horizon. One of the master faults shows a dramatic structural change. It crosses the northern
part of the study area from west in Township 10N and Range 23W to east between Township 9N
and 8N and Range 19W and 18W. Initially, it is difficult to identify which one of the master faults
is affecting the area just by analyzing the structural contour map alone. However, the cross sec-
tions (Figures 3-12 to 3-19) indicate that it is the Clarksville Fault because the Middle Atoka in-
terval is eroded on the up-thrown side of the Mulberry Fault. In fact, this change of the Middle
Atoka unit in relation to the extensional master fault suggests evidence for the inception point of
the subsidence in the Arkoma Basin. The graben feature is hard to identify in this map, but it is
easy to describe within the east-west cross sections. Also, the Google earth profile (Figure3-21)
shows obvious surface depression on the topography of the graben. The hanging wall of the

66
mapped fault blocks is interpreted to be have undergone varying amounts of local erosion after
they were uplifted by the tectonic activity of the Arkoma Basin.
Figure 3-10: Structural contour map of the Middle Atoka interval.
3.6 Local Cross Sections Description
A structure contour map alone cannot represent a complete picture of the subsurface. A
series of structural cross sections were constructed to illustrate the various structures in profile.
By combining structure maps and cross sections, one can develop a better understanding of the 3-
dimensional aspect of the structural configuration. In general, a cross section that is perpendicular
to the strike of the structural feature, such as a normal fault is called “dip section”. A cross section
that is parallel to the strike is called “strike section” (Figure 3-11). In other words, the first seven
cross sections (A-A` to G-G`), drawn from the North West to the South East dip sections. The
reason for picking the dip orientation is that they are perpendicular to the master faults in the
structure contour maps. Since the contour maps indicate a different structural style in the area
above the central part of the Mulberry Fault, the strike cross section (AA-A`A`) is constructed.
Also, the strike cross section (BB-B`B`) is constructed to provide a significant indication for the

67
graben structural style north of the Mulberry Fault that does not affect the Clarksville Fault south
of the study area.
All of the cross sections are north of the Arkansas River, except for the southern part of
the cross section (B-B`), as most of the well logs south of the river are deviated wells. Most of the
deviated well logs were avoided due to untrue thickness representation. The orientation of the
cross section is important because the local structure might result in some distortion of the subsur-
face geometry. The master faults on the cross sections are represented in black lines, while the
small faults are represented by red solid lines in order to distinguish between them on the cross
sections.
Figure 3-11: The orientation of the structural cross sections in the study area in Google earth.

68
3.6.1 (A-A`) Cross Section
Cross section A-A` is located at the western part of the study area (Figure 3-12). This
cross section extends from the north in Townships 9N-11N, Range 23W in Johnson County (Fig-
ure 3-11). The cross section contains seven well logs (see Appendix 2). The well logs are spaced
relatively close to each other. The wells are spaced at approximately 1 to 3 miles apart. This cross
section covers a distance of 13.5 miles. The two master normal faults are mapped in black lines.
The thickness of both the Bloyd and Lower Atoka intervals is relatively constant through the
cross section. In contrast, the Middle Atoka interval thickness increases moving toward the south-
ern part of the area. The thickening of the Middle Atoka is due to syn-depositional faulting. The
Middle Atoka shows regional erosion of the up-thrown side of the Mulberry Fault, which has a
displacement of about 2,170 feet, whereas the Clarksville Fault indicate a smaller displacement
compared to the Mulberry Fault of about1,080 feet.
The cross section shows an additional normal fault that has a displacement of about 960
feet. It indicates a semi horst and graben structural features with the last two additional faults. For
the purpose of this study, the description of the cross sections defines the structural configuration
with the term highs and lows instead of horst and graben. This pattern of high and low structures
was described as the result of reactivation of normal faults that occurred during the last phases of
Ouachita compression (McGilvery and Houseknecht, 2000). The Mulberry Fault dips in a low an-
gle between 45 and 50 degrees to the south east. The interpreted seismic profile (Figure 3-4) sup-
ports the measurements to define a value of 45 degrees for the Mulberry Fault. On the other side,
the Clarksville Fault is dipping in a high angle of about 83 degrees.

69
Fig
ure
3-1
2:
Nort
h t
o s
outh
str
uct
ura
l cr
oss
sec
tion A
-A`,
wit
h t
he
Mulb
erry
(1)
and C
lark
svil
le (
2)
fault
s in
the
bla
ck l
ines
.
A
A`
1
2

70
3.6.2 (B-B`) Cross Section
Cross section B-B` is located at the western side of the study area (Figure 3-11). (B-B`)
cross section extends from the north to south in Townships 9N-11N, Ranges 22W- 23W in John-
son County. The cross section contains six well logs (Figure 3-13). The well logs are picked to be
closely spaced in order to provide more detailed illustration of the structure of the area. The well
logs were selected to cover a total area of 14.66 miles from north to south. The wells are spaced
between 2 to 3 miles of each other. The cross section (B-B`) shows similar faulting pattern to the
cross section (A-A`).
Since the base of the Hale Formation is not mapped, it is hard to determine the total thick-
ness of the Morrowan. However, the cross section shows a constant thickness of the Bloyd for-
mation interval. Also, the Lower Atoka interval is thinner to the central part of the mapped sec-
tion. The Middle Atoka interval shows a different depositional pattern compared to the other
mapped formations. It is interpreted to show a decrease in its thickness to the northern part of the
cross section, which is related to the previously described local erosion.
The master faults show major displacement on the Morrowan and Lower Atokan for-
mations, while it is hard to measure the displacement on the Middle Atoka due to the local ero-
sion on the up-thrown side of the Mulberry Fault. The Mulberry Fault in this section has a dis-
placement of about 1,880 feet, whereas the Clarksville Fault indicates a smaller displacement
comparing to the Mulberry Fault of 600 feet. Unlike the previous pattern for the master faults
with the highs and lows structures, the faults show a stepped pattern, with a gradual deepening to
the south.

71
Fig
ure
3-1
3:
Nort
h t
o s
outh
str
uct
ura
l cr
oss
sec
tion B
-B`,
wit
h t
he
Mulb
erry
and C
lark
svil
le f
ault
s in
the
bla
ck l
ines
.
B
B`
2
1

72
3.6.3 (C-C`) Cross Section
Cross section C-C` is located at the western side of the study area (Figure 3-11). It extends
from northeast to southwest in Townships 9N-10N, Ranges 22W-23W in Johnson County. Seven
well logs are used in the cross section from north to south (Figure 3-14). The distance between the
well logs are spaced between one to two miles. Additionally, the cross section covers a total area
of 12.8 miles. Some of the well logs in this cross section penetrate deep enough to reach the
Boone Formation. Furthermore, this cross section indicates similar style of down to the basin,
stepped faulting to cross section (B-B`). The thickness of both Bloyd and Lower Atoka intervals
is calculated. In general, thickness of the Lower Atoka and Bloyd formations remains constant as
previous cross sections indicated. To the south, a continuous increase in the thickness of the Mid-
dle Atoka is recognized. The increase in Middle Atoka Formation thickness is about 1820 feet.
The master faults show major displacement on the Morrowan and Lower Atokan for-
mations. As the Middle Atokan is not penetrated by the Mulberry Fault due to the local erosion,
the displacement on fault for the Middle Atoka is not included. The displacement on the Mulberry
Fault is about 1,680 feet at the top Lower Atoka, while it is calculated to be about 2,100 feet on
the Clarksville Fault.

73
Fig
ure
3-1
4:
Nort
h t
o s
outh
str
uct
ura
l cr
oss
sec
tion C
-C`,
wit
h t
he
Mulb
erry
and C
lark
svil
le f
ault
s in
the
bla
ck l
ines
.
C
C`
1
2

74
3.6.4 (D-D`) Cross Section
Cross section D-D` is located in the middle part of the study area (Figure 3-11). This cross
section extends from the north in Townships 10N-8N, Ranges 21W-22W in Pope County. The
cross section is constructed using nine well logs (Figure 3-15). The spacing of the well logs in this
cross section ranges between one and a half to two miles from north to south. The total distance
covered by this cross section is about 14 miles. The well logs are not deep enough to provide a
detail analysis of the Morrowan and Lower Atoka strata in the cross section. However, it appears
that both Bloyd and Lower Atoka formations have relatively constant thickness over the study
area. To the northeastern side of the study area, the Middle Atoka Formation contains the entire
stratigraphic succession. Unlike the previous cross sections. The complete Middle Atoka is pre-
served on D-D`. This is defined by the consistent Top Tackett pick and correlation on all of the
well logs. Note that there is only a subtle basinward thickness increase in the Middle Atoka. The
complete section of the all formations is due to the structural configuration of the study area.
Also, there is no strong evidence for the effect of the erosion on this part of the study area, espe-
cially on the up-thrown side of the Mulberry Fault because of the present of all formations.
The cross section shows three small faults that are distributed randomly in the area in ad-
dition to the two master faults. The Mulberry Fault displaced the strata vertically of about 1,340
feet, while the Clarksville Fault showed smaller displacement compared to the Mulberry Fault of
about 620 feet. Additionally, the cross section shows series of highs and lows structural features
that constructed by the small faults to the south of the cross section. The Mulberry Fault shows a
dip in a high angle about 83 degrees, which is the highest dip in the area for the fault, whereas the
Clarksville Fault dips in a lower angle of about 63 degrees.

75
Fig
ure
3-1
5:
Nort
h t
o s
outh
str
uct
ura
l cr
oss
sec
tion D
-D`,
wit
h t
he
Mulb
erry
and
Cla
rksv
ille
fau
lts
in t
he
bla
ck l
ines
.
D
D`
1
2

76
3.6.5 (E-E`) Cross Section
Cross section E-E’ is located at the eastern part of the study area (Figure 3-11). This cross
section extends from the north in Townships 10N-8N, Ranges 20W-21W in Pope County. The
cross section is constructed using seven well closely spaced (Figure 3-16). The cross section co-
vers an area of 11.6 miles. Similar to the cross section (D-D`), this cross section has good well log
control to map all of the formation tops. As described in the previous cross sections, the thickness
of the Bloyd and Lower Atoka formations is constant. However, the Middle Atoka Formation
thickness shows an increase of about 1,070 feet.
This section is characterized by some individual small faults. Also, there is little evidence
for the effect of erosion in this part of the area as seen along the western side. The Mulberry Fault
shows minor displacement of about 560 feet in comparison to the Clarksville Fault that has a
layer displacement of approximately 1,180 feet.
Additionally, the structure map shows thicker intervals to the southern portion as a result of fault-
ing. The mapped faults show down to the basin stepped pattern as the strata are gently dipping to
the south. The master Mulberry Fault dips 73 degrees, and the Clarksville Fault dips 55 degrees
toward the southeastern part of the study area.

77
Fig
ure
3-1
6:
Nort
h t
o s
outh
str
uct
ura
l cr
oss
sec
tion E
-E`,
wit
h t
he
Mulb
erry
and C
lark
svil
le F
ault
s in
the
bla
ck l
ines
.
E
E`
2
1

78
3.6.6 (F-F`) Cross Section
Cross section F-F` is located at the eastern part of the study area (Figure 3-11). This cross
section is mapped from the north in Townships 10N-8N, Ranges 19W-20W in Pope County. Nine
well logs were used to construct this cross section, and they are spaced in a range between one to
three miles (Figure 3-17). This cross section covers a total distance of approximately 14.5 miles
from north to south. Like cross section (E-E`), this cross section provides different structural and
stratigraphic configurations for the Middle Atoka. At the northern part of the cross section, it is
obvious that local erosion has affected the up-thrown side of the Mulberry Fault. Moreover, the
depositional rate of the Middle Atoka increased simultaneously with the increase of the accom-
modation space, which provides additional space of sediment to be transported and deposited at
the southeastern part of the study area. The syn-depositional fault movement is suggested by sig-
nificant thickening of the Middle Atoka on the down thrown side of the key faults. This estab-
lishes the timing for the onset of the tectonic development of the Arkoma Foreland Basin. This
section shows some evidence in relation to syn-depositional faults.
Four small faults in addition to the master faults are mapped. The small faults are mapped
with uncertainty since they might result from stratigraphic controls rather than structural. The
Middle Atoka Formation indicates a recognizable increase in thickness of about 1600 feet to the
south of the cross section. The increase in thickness is controlled by series of normal faults. The
vertical displacements along the master faults are measured to reveal a value of about 1,800 feet
for the Mulberry and 360 feet of the Clarksville faults. Finally, the cross section shows series of
down to the basin step faulting. It seems that the faults in this part of the region are either not re-
activated or they reactivated later after the sediments deposition increased.

79
Fig
ure
3-1
7:
Nort
h t
o s
outh
str
uct
ura
l cr
oss
sec
tion F
-F`,
wit
h t
he
Mulb
erry
and C
lark
svil
le f
ault
s in
the
bla
ck l
ines
.
F
F`
2
1

80
3.6.7 (G-G`) Cross Section
Cross section G-G` is located at the far eastern part of the study area (Figure 3-11). This
cross section extends from the north in Townships 10N-8N, Ranges 18W-19W in Pope County.
Eight well logs were utilized to construct this cross section. The well logs are chosen to be in a
range of between one to two miles, and to cover a total distance of approximately 13 miles from
north to south (Figure 3-18). Cross section (G-G`) is interpreted to have four normal faults that
originated in a step faulting style. This cross section is significant in terms of syn-depositional
faulting aspect, which is important in interpreting the initial subsidence of the Arkoma Basin.
As in most of the structural cross sections, the up-thrown side of the Mulberry Fault is
eroded. Therefore, it is impossible to determine if there was syn-depositional fault movement and
thickening of the Middle Atoka in the down thrown side. Descending south from the shelf into ba-
sin, the stratal thickness of the Middle Atoka Formation steady increases. The overall southward
increase in thickness of the stratigraphic sequence of the Middle Atoka is due to the increase in
the subsidence rate of the basin. Moreover, the syn-depositional faults do not cross the whole in-
terval of the Middle Atoka Formation. The displacement on the two master faults is measured to
reveal a value of 1,530 feet of the Mulberry and 1,400 feet of the Clarksville. Similar to the previ-
ous cross section (F-F`), step faulting pattern characterized the G-G` cross section. There appears
to be significant expansion and thickening of the Middle Atoka on the down thrown side of the
southernmost fault. this growth fault may have pre-dated the Mulberry Fault.

81
Fig
ure
3-1
8:
Nort
h t
o s
outh
str
uct
ura
l cr
oss
sec
tion G
-G`,
wit
h t
he
Mulb
erry
and
Cla
rksv
ille
fau
lts
in t
he
bla
ck l
ines
.
1
2

82
3.6.8 (AA-A`A`) Cross Section
Cross section (AA-A`A`) is located in in both Johnson and Pope counties through Town-
ships 11N-9N, Ranges 23W-18W of the study area (Figure 3-11). The section contains eleven
well logs that span about thirty-two miles from west to east (Figure 3-19). The primary reason to
construct this cross section is to show the orientation of a graben in the area, which is perpendicu-
lar to the Mulberry Fault. The well logs in this cross section are spaced to show the overall struc-
tural configuration of the northern part of the area.
The Bloyd and Lower Atoka Formation thickness is relatively constant, while there is a
noticeable change in the Middle Atoka Formation. This cross section is interrupted by a graben
between well Brown and (1-9) and well Watson (1), with a vertical displacement range from
1,800 feet to 1,650 feet to the east. This cross section is included to emphasize the faults that form
the graben. Other faults were ignored. Generally, the cross section shows a pattern of step fault-
ing. However, the area might be controlled stratigraphically. The normal faults that bounded the
graben are north-south trending faults. These faults are varying in dips. The western fault dips at a
low angle of 48 degrees, while the eastern fault dips at a high angle of 77 degrees. Therefore,
these faults form asymmetrical graben.

83
Fig
ure
3-1
9:
Wes
t to
eas
t st
ruct
ura
l cr
oss
sec
tion A
A-A
`A`,
wit
h t
he
boundin
g f
ault
s of
the
Bull
frog g
raben
map
ped
in b
lue
lines
.
AA
A
`A`
Th
e B
ull
frog
Gra
ben

84
3.6.9 (BB-B`B`) Cross Section
Cross section (BB-B`B`) is located in both Johnson and Pope counties through Townships
9N-8N, Ranges 22W-20W (Figure 3-11). The section is constructed by utilizing eleven well logs
that span about thirty-one miles from west to east (Figure 3-20). Also, the spacing between the
well logs is based on constant distance between the well logs. This cross section is important in
terms of measuring the extension of the bounding faults of the graben. The cross section is con-
structed to be parallel to the Clarksville Fault.
It is significant to notice that the faults in this cross section are mapped in the same orien-
tation and location to the previous graben faults, but they form a step faulting pattern instead of
structural graben feature. The interpretation of the two east-west cross sections supports the idea
of that the graben might be newer than both the Mulberry and Clarksville faults as they are per-
pendicular to the Mulberry fault and displace the Middle Atoka Formation. The western fault dips
by four degrees, while the eastern fault dips by 16 degrees.

85
Fig
ure
3-2
0:
Wes
t to
eas
t st
ruct
ura
l cr
oss
sec
tion B
B-B
`B`,
wit
h t
he
boundin
g f
ault
s of
the
gra
ben
map
ped
in b
lue
lines
.

86
3.7 Google Earth Profiles
In this study, Google earth is used to generate three elevation profiles to aid in providing
additional information in terms of correlating the surface structure with the subsurface analysis.
The elevation profiles (Figure 3-21 A and B) represent north-south sections that are perpendicular
to the Mulberry Fault. The profile (Figure 3-21 A) covers a distance of 1.38, while the second
profile (Figure 3-21 B) covers 3.23 miles. The profiles show major vertical displacements on the
Mulberry Fault surface. Those profiles indicate that the Mulberry Fault reaches shallow depths to
the surface of approximately 1104 feet elevation, allowing future field studies to measure the dip
along the Mulberry Fault. Additional profiles are made in order to present further evidence for the
Clarksville Fault; however, the Clarksville Fault does not present major displacement on the sur-
face like the subsurface vertical displacement.
Additionally, an east-west elevation profile is generated to correlate the surface with sub-
surface structure of the mapped graben (Figure 3-21 C). The profile is mapped to cover a distance
of 8.58 miles. In correlation with the subsurface cross section (AA-A`A`), the graben shows
asymmetrical geometry. However, the faults that bound the graben do not present obvious evi-
dence on the surface of the graben profiles like the Mulberry Fault profiles. See appendix 2 for a
topographic map.
A

87
Figure 3-21: Google earth elevation profiles showing cross sectional view of the surface topogra-
phy along the paths. (A) Elevational profile for northwest to southeast path of the western part of
the Mulberry Fault, (B) Elevational profile for northwest to southeast path of the eastern part of
the Mulberry Fault, and (C) Elevational profile for east- west path of the central part of the gra-
ben.
3.8 Faults Analysis
There have been numerous publications to describe the fault components and terminolo-
gies. This section aims to define the only components that are related to this study (Figure 3-22).
B
C

88
Cross-section
Strike
(The Mulberry
Fault) (degree)
Dip
Angle
Strike
(The Clarksville
Fault)
Dip
Angle
A-A` 200 50 198 83
B-B` 199 54 197 70
C-C` 200 47 197 67
D-D` 196 82 196 63
E-E` 195 73 197 55
F-F` 194 53 197 79
G-G` 197 61 198 72
Graben/West Fault Graben/East Fault
AA-A`A` 115 48 290 77
Table 3-1: Measured strikes and dips for the Mulberry and Clarksville master faults, and fault
bounded graben, generated based on the structural contour maps and cross sections.
The average dip of the Mulberry Fault results in a value of about 50 degrees, which is rel-
atively close to the value observed on the seismic profile of 45 (Figure 3-4), while the Clarksville
Fault dips an average of about 70 degrees. Even though the Mulberry Fault dips at a lower degree
compared to the Clarksville Fault, it has a larger vertical displacement of an average of 1567 feet
compared to the Clarksville Fault, which has a displacement of an average 1050 feet. Generally,
the traditional dip for a normal fault is typically around 60 to 70 degrees (Tearpock and Bischke,
1991). Therefore, the Clarksville Fault is considered to be within this range. However, the Mul-
berry Fault dips at a lower angle.
Low-angle normal faults, such as the Mulberry Fault, tend to be widely recognized by
most structural geologists, especially in foreland basins. In general, normal faults have been de-
scribed as they were modified by the rotation of high angle faults. Also, several studies have de-

89
scribed low angle faults as listric faults. A listric fault can be defined as “a curved, concave up-
ward fault that is gradually flattened with depth” (Fossen, 2010). The explanation of listic faults
has been supported by many publications conducted in relation to the Arkoma Basin structure.
Eastern Arkoma Basin structure shows some evidence in terms of mapped listric normal faults
(VanArsdale and Schweig, 1990).
3.9 Mulberry Fault
The Mulberry fault is the most northern master east-west trending fault that dips to the
south (Figure 3-23). Numerous small faults and flexures have been recognized south of the Mul-
berry Fault. However, these structures are too small to be represented on the structural contour
maps. The Mulberry Fault crosses the study area in Townships 11N-9N, Ranges 23W-18W.
The Mulberry Fault may have been an existing extensional normal fault that was reac-
tivated as a result of flexural down bending during the convergent tectonic movement. Also, it has
been described as a result of the reactivation of pre-existing basement faults and then overlaid by
sedimentary strata (Long, 2005). The Mulberry Fault is the transitional zone between the Ozark
Platform and the Arkoma Basin to the southern boundary of the Boston Mountains. In the study
area, the Middle Atoka Formation strata have been eroded on the up-thrown side of the Mulberry
fault.
3.10 Clarksville Fault
The Clarksville fault is the second east-west- trending master fault that dips to the south of
the study area, north of the Arkansas River (Figure 3-23). It extends from Township 10N, Range
23W in the western part to Township 8N, Range 18W in the eastern part of the study area for a
distance of approximately 31 miles. The Clarksville Fault zone has not been regionally described

90
on the geological maps, and very little has been published in terms of its character. It was de-
scribed in 1907 for its economic importance of coal production in Arkansas. Also, it was inter-
preted to have a vertical displacement of about 500 feet according to Collier et al. (1907). The in-
terpretation of the Clarksville Fault is supported by the structural cross sections as well as the
structural contour maps in this study. The average vertical displacement on the fault is measured
to be about 1050 feet.
Based on the structural analysis of the Clarksville Fault, it seems that this fault was caused
by the flexural tectonic movement of the Arkoma Basin. Also, the fault might be caused by the
reactivation of preexisting normal faults that extended into the crystalline basement during early
Mississippian, or the Clarksville fault might have formed later in early Atokan time. This inter-
pretation is based on the analysis of the cross sections of the study area. Additionally, the fault is
a syn-depositional normal fault because of the increase in the depositional thickness of the Middle
Atokan Formation, as it indicated in cross sections (F-F`) and (G-G`) to the eastern part of the
study area.

91
Figure 3-23: The location of the study area in regard to both the Mulberry and Clarksville fault
zone with the boundary of the Ozark Plateaus and Arkoma Basin placed (modified from Cohoon,
2013).
3.11 The Bullfrog Graben
The structural contour map defines a graben, bounded by two north-south trending normal
faults (Figure 3-6 to 3-10). It has not been described in the previous literature. It is named the
“Bullfrog Graben” because of its association with the Bullfrog Valley. The Bullfrog Graben is lo-
cated along the Highway 164 near the Johnson-Pope counties line. A 3D diagram (Figure 3-24) is
design based on increasing the vertical exaggeration of the Lower Atoka Formation structural
contour map. The Lower Atoka Formation map (Figure 3-19) is considered to be the base map for
constructing the Bullfrog Graben because of the recognizable characterization of the graben com-
paring to the other formations in the study area.

92
Figure 3-24: A 3D diagram of the Bullfrog Graben defined the Lower Atoka structure contour
map.
The graben has a measured width of about 16.5 miles. The Bullfrog Graben displays
asymmetrical geometry. Previous publications in the Arkoma Basin interpreted several grabens
referred to as major synclinal features. However, most of these synclines were east-west trending
instead of north-south trending like the Bullfrog Graben. As shown in the cross section (AA-
A`A`), the Bullfrog Graben is bounded by two small normal faults. These faults are perpendicular
to the Mulberry Fault to the south. The Bullfrog Graben might be formed as a result from the
bending of a normal fault (Figure 3-25) since the faults bounded the graben do not cross the
Clarksville Fault as showing in the cross section BB-B`B`.

93
Figure 3-25: The AA-A`A` east-west cross section on a proposed bending normal fault.
The distribution of the north-south trending faults that bound the graben suggests that the
stresses caused by vertical flexural loading, which were higher on the western than the eastern
side because of the higher displacement that was caused by the faults. The measured slip on the
faults that bound the graben is approximately (1,800-1,650) feet. The slip on the faults indicates
that a comparative amount of deformation occurred as a result of flexure in responding to exten-
sional tectonic movement. The flexural bending of the upper part of the tectonic plate induced the
development of normal faults (Golf, 1989). Moreover, the flexural bending happened as a result
of preexisting zones of weakness in the strata, and that weakness was caused later by the genera-
tion of the normal faults (Figure 3-26).
The second explanation includes the effect of strike-slip faults. Strike-slip faults have been
inferred in some studies in northwestern part of the Arkoma Basin in Arkansas, but there are not
much published. Hudson (2000) reported a movement of strike-slip faulting in the southern part
of the Ozark Plateau, northern Arkoma Basin by using equal area projection.
Based on these two explanations, the Bullfrog Graben is a subsurface fault bounded in-
cised valley. Also, the graben was supplied by sediments in relation to sea-level cycles, specifi-
cally during the falling of sea level and filling. Due to the lack of well log control and field stud-
ies on the Bullfrog Graben, it is hard to determine which explanation is more reasonable.

94
Figure 3-26: Schematic illustrations of the flexural bending for the Bullfrog Graben in the study
area of the Arkoma Basin showing the two north-south trending faults perpendicular to the Mul-
berry master fault (Sketched by Dr. Thomas A. (Mac) McGilvery).

95
3.12 Stereographic Projection
The Arkoma Basin developed as a result of series of extensional tectonic movements, re-
sulting in series of normal faults. An extensional normal fault can be developed as a result of ap-
plying vertical stress to rock bodies leading the rock materials move or flowing in the direction of
least stress.
There are three kinds of stresses in which the dynamic analysis classification was based
on; the maximum (σ1), minimum (σ3), and intermediate (σ2), called principal stresses. The direc-
tion of the principal stresses is called the stress axes (Figure 3-27). The analysis of principal
stresses is significant in terms of interpreting the orientation of the stresses along fault surfaces.
Based on the orientation of principal stress axes or the slip fault and the amount of stress that have
been applied to rock surface layers, faults are broadly categorized into three types: normal, re-
verse, and strike-slip faults. For the purpose of this study, normal fault type is the only fault type
discussed. In essence, the structural kinematic classification deals with strain, while the dynamic
classification deals with stress. In a normal growth fault type, the maximum principle stress (σ1)
applied vertically to the fault surface.
Figure 3-27: The principle stresses of a normal fault (Groshong, 2006).
In order to determine the principle stress axes of the extensional master faults and Bullfrog
Graben, the Win-Tensor program was utilized. The Win-Tensor Program is free source software

96
that was developed originally by Delvaux (1993), available at http://www.damiendelvaux.be/Ten-
sor/tensor-index.html. Also, the Win-Tensor program is used to aid in the interpretation of stereo-
graphic displays in a lower hemisphere and equal-area projection. The generated stereonet pro-
vide some information about the general representation of both the master faults and graben (Fig-
ure 3-28 (A, B, and C)).
Figure 3-28: Equal -area projection of lower hemisphere of (A) the Mulberry Fault, (B) the
Clarksville Fault, (C) the Bullfrog Graben.
Having applied both the master faults and graben resulted in Figure 3-29 to represent the general
description of the structure of the study area.
A B
C

97
Figure 3-29: Equal-area projection that presents integrated structural features of the study area.
Also, the Win-Tensor software is helpful in terms of providing some information about
the direction of greatest principle stress that is applied to the structural features (Figure 3-30 (A,
B, and C)). The red arrow refers to the extensional tectonic movements. The major principle
stresses of the normal faults suggest that these east-west trending faults are constructional faults
based on the general strain regime, presented by Figure 3-30. Also, the north-south trending faults
that bound the Bullfrog Graben are interpreted to have the same extensional regime of tectonics in
the Arkoma Basin. Additionally, it is obvious that the maximum principle stress direction is 90
degrees with the fault surfaces for both the east-west and north-south faults. This interpretation
leads to the conclusion that the area has not been affected by the movement of strike-slip fault
system.

98
Figure 3-30: Equal-area projection in Win-Tensor software presenting the greatest stress that is
perpendicular to the faults surfaces in solid read arrows. (A) represents the main directions of the
three principle stresses on the Mulberry Fault, (B) represents the major stresses on the Clarksville
Fault, and (C) represents the major stresses on the Bullfrog Graben.
3.13 Structural Interpretation and Discussion
The general observation of the structural maps and cross sections reveals some unique
structural features. First, both cross sections and maps show two master faults and several small
faults that are distributed in the study area. The small faults are not definite because they might be
stratigraphically controlled rather than structurally. However, these small faults provide geomet-
rical evidence, such as the amount of vertical displacement. Most of these faults are east-west
trending. Also, north-south trending faults are observed. The north-south faults are important in

99
terms of forming the Bullfrog Graben feature in the northern part of the study area. The cross sec-
tions as well as the isopach map show a constant thickening to the south of the study area in the
Middle Atoka Formation. Most of the thickening occurs on the downthrown side of the faults, in-
dicating syn-depositional faulting. Additionally, some of the described cross sections produced a
fault stepping pattern, which probably is caused by the change in the attitude of the fault plane
with respect to the movement on the fault surfaces.
Buchanan and Johnson (1968) described two types of normal fault patterns in the Arkoma
Basin. The first type is faulting that originated during the middle Atokan time. This kind of faults
is interpreted to be in the shallower reaches of the foreland basin. For the purpose of this study,
this kind of faulting is named the Middle Atokan faults. The second type of faulting is the faults
that are in the deeper part of the Arkoma Basin. This kind of faulting does not persist above the
Middle Atoka Formation. In this study, the second described faulting is called pre-Middle Atokan
faults. Most of the mapped faults in the area, especially the master faults, are considered to be pre-
Middle Atokan faults since these faults do not persist above the Middle Atoka Formation in some
cross sections. Also, there is a recognizable thickening in the same formation, which is indicated
that these faults are syn-depositional faults.

100
CONCLUSION
Stratigraphic and structural data from an area (1,080 square miles) at the northern margin
of the Arkoma Basin provide critical information about basinal development during the Carbonif-
erous. Data were derived from field exposures and 1549 wireline logs supplemented by a seismic
line. Geomorphic profiles derived from Google Earth were also utilized. Carboniferous units in-
vestigated included the Hale and Bloyd formations of Morrowan age and the Lower and Middle
Atoka of Atokan age. A dramatic thickness increase during Middle Atoka time accompanied in-
creased subsidence rates enhanced by growth faults particularly during Middle Atoka sedimenta-
tion that produced thick sections on the downthrown side. This study presented a comprehensive
analysis of subsidence history in the Arkoma foreland basin.
Structural and isopach contour maps and regional stratigraphic and structural cross sec-
tions were constructed to examine the general characteristics of the basin. Thickness of analyzed
intervals varied across the study area, ranging from hundreds to thousands feet thick. The varia-
tion in thickness is described in terms of the change in the depositional environments. Shallow
marine environment, were the dominated facies that generated thick successions of Atokan depos-
its.
Two master east-west trending normal faults were analyzed; the Mulberry and Clarksville
resulted from reactivation during compressional stress regimes. These faults facilitated subsid-
ence, providing more space to accommodate Morrowan and Atokan sediments. Evidence from the
Lower Atoka structure map suggested a local flexure bending in the northern-central part of the
study area. The local flexure was represented by the Bullfrog Graben that took place after deposi-
tion. During Middle Atokan time, flexure and syn-depositional normal faults were accompanied
by subsidence indicating the inception of the Arkoma Basin formation.

101
REFRENCES
Buchanan, R.S., and F.K. Johnson, 1968, Bonanza gas field a model for Arkoma basin growth
faulting, in L.M. Cline, ed., A guidebook to the geology of the western Arkoma basin and
Ouachita Mountains: OCGS, Guidebook, p. 75-85.
Cohoon, R., R., Ed. D, and PG., 2013, Roadside Geology Series 01, Arkansas Geological Survey.
Collier, A. J., White, D., and Girty, G. H., 1907, The Arkansas coal field (No. 326), Geological
Survey (US).
Delavan, G., 1985, Subsurface Lithostratigraphy and Stratigraphic Framework of the Bloyd
Formation (Morrowan) in Franklin, Johnson, and Pope Counties, Arkansas: [Master’s
Thesis, unpublished], University of Arkansas, Fayetteville, 81p.
Fossen, H., 2010, Structural geology, Cambridge University Press.
Goff, R.A., 1989, Stratigraphic and Structural Controls of Hunton Group Production, Bonanza
and Massard-Prairie Fields, Sebastian County, Arkansas: [Master’s Thesis], University of
Arkansas, Fayetteville.
Houseknecht, D.W., and Kacena, J.A., 1983, Tectonic and Sedimentary Evolution of the Arkoma
Foreland Basin, Tectonic-Sedimentary Evolution of the Arkoma Basin and Guidebook to
Deltaic Facies, Hartshorne Sandstone, v. 1, p. 3-33.
Houseknecht, D.W., 1986, Evolution from passive margin to foreland basin--the Atoka Formation
of the Arkoma basin, south-central U.S.A.: International Association of Sedimentologists
Special Publication 8, p. 327-345.
Hudson, M. R., 2000, Coordinated strike-slip and normal faulting in the southern Ozark dome of
northern Arkansas: Deformation in a late Paleozoic foreland. Geology, 28(6), 511-514.
Jameson, E.W., 1998, A geological transect of the Arkoma Basin in Northwest Arkansas:
[Master’s Thesis, unpublished], University of Arkansas, Fayetteville.
LaGrange, K.R., 2002, Characterization of Lower Atoka Formation, Arkoma Basin, Central
Arkansas: [Master thesis]: Louisiana State University and Agricultural and Mechanical
College, 2 p.
Long, W., A., 2005, The Mulberry Fault Zone: An Analysis of Subsurface Geometry and Timing
of Fault Displacement: [Master’s Thesis, unpublished], University of Arkansas, Fayette
ville.
McGilvery, T. A. and Houseknecht, D. W., 2000, Depositional systems and diagenesis of slope
and basin facies, Atoka Formation, Arkoma Basin in Johnson, K. S. (ed.) Marine clastics
in the southern Midcontinent, 1997 symposium: Oklahoma Geological Survey Circular
103, p. 129-140.

102
McGilvery, T., A., 1982, Lithostratigraphy of the Brentwood and Woolsey Members, Bloyd
Formation (Type Morrowan) in Washington and Western Madison Counties, Arkansas:
[Master’s Thesis, unpublished], University of Arkansas, Fayetteville.
Moyer, C., 1985, Subsurface Stratigraphy of the Prairie Grove Member, Hale Formation
(Morrowan), in Franklin and Logan Counties, Arkansas [Master’s Thesis, unpublished]
University of Arkansas, Fayetteville, 82p.
Perry, W.J., Jr., 1995, Arkoma Basin Province (062), in D.L. Gautier, G.L. Dolton, K.I. T
Takahashi, and K.L. Varnes, (editors) 1995 National assessment of United States oil and
gas resources: Results, methodology, and supporting data: U.S. Geological Survey Digital
Data Series DDS-30, Release 2, one CD-ROM, Web accessed 5 November 2010,
http://certmapper.cr.usgs.gov/data/noga95/prov62/text/prov62.pdf.
Pontiff, J.L., 2007, Regional Stratigraphic Framework of Morrowan Strata, Northern Arkoma
Basin: [Master’s Thesis, unpublished], University of Arkansas, Fayetteville, 86p.
Studebaker, E. (2014). Structural and stratigraphic transition from the Arkoma shelf into the
Arkoma Basin during basin subsidence; Arkoma Basin, northwest Arkansas (Order No.
1554340). Available from Dissertations & Theses @ University of Arkansas Fayetteville;
ProQuest Dissertations & Theses Global. (1527053046). Retrieved from
http://search.proquest.com.library.uark.edu/docview/1527053046?accountid=8361.
Sutherland, P.K., 1988, Late Mississippian and Pennsylvanian Depositional History in the
Arkoma Basin Area, Oklahoma and Arkansas, Geological Society of America Bulletin, v.
100, p.1787-1802.
Tearpock, D.J., and Bischke, RE., 1991, Applied Subsurface Geological Mapping. Prentice-Hall,
Inc., Englewood Cliffs, New Jersey, 648 p.
VanArsdale, R. B., and Schweig, E. S., III, 1990, Subsurface Structure of the Eastern Arkoma
Basin: Bulletin-American Association of Petroleum Geologists, v. 74, no. 7, p. 1030-
1037.
Woolsey, J., A., 2007, Sequence Stratigraphy and Depositional Dynamics Basal Atoka Formation
(Orr-Patterson Members), Middle Pennsylvanian, Arkoma Basin, Central Arkansas:
[Master’s Thesis, unpublished], University of Arkansas, Fayetteville.
Zachry, D. L. (1983). In Houseknecht D. W. (Ed.), Sedimentological framework of the Atoka
formation, Arkoma basin, Arkansas Soc. Econ. Paleontology and Mineral, Midcont. Sect.
Retrieved from http://0search.proquest.com.library.uark.edu/docview/50951621?ac-
countid=8361 .

103
APPENDIX (1)
A map displays on the Google Earth showing the study area highlighted in white and approximate
locations for the outcrops including; (1 in Figure 2-4), (2 in Figure 2-5), (3 in Figure 2-6), (4 in
Figure 2-7), (5 in Figure 2-9), (6 in Figure 2-10), (7 in Figure 2-11), and (8 in Figure 2-13).

104
APPENDIX (2)
A t
opogra
phic
map
for
the
Bull
frog G
raben
.

105
APPENDIX (3)
A-A`
B-B`
C-C`
D-D`
Well Label Field Name API County KB TACKETT CASEY KESSLER BRENTWOOD HALE
09N 23W 07 RIKER 2 SPADRA 10557 JOHNSON 381 2188 4223 5805 5962 6180
09N 23W 01 RAINS 1-1 SPADRA 10781 JOHNSON 512 1672 3652 5446 5568 5759
09N 21W 06 SLOVER CREEK 1-6 ROSS 10379 POPE 534 1474 3444 4816 4950 5129
09N 21W 02 UTLEY HAROLD 1-2 ROSS 10218 POPE 439 1618 3509 4955 5084 5305
09N 20W 01 TAYLOR L" 2" DOVER 10465 POPE 585 1048 2824 3839 3942 4126
Well Label Field Name API County KB TACKETT CASEY KESSLERBRENTWOOD HALE
08N 22W 07 LAMB 2 KNOXVILLE 10750 JOHNSON 380 4132 6863 8049 8099 8167
08N 22W 13 SOUTHLAND 2 KNOXVILLE 10603 POPE 703 3585 5732 7004 7063 7126
08N 19W 07 POTTER 2-7 MORELAND 10579 POPE 875 1935 3985 5097 5150 5205
08N 19W 11 RAINWATER A" 2" MORELAND 10434 POPE 707 761 2940 4052 4126 4214
08N 18W 09 ARKANSAS KRAFT 1-9 OAK GROVE 10179 POPE 496 1078 3317 4504 4578 4689
Well Label Field Name API County KB TACKETT CASEY KESSLER BRENTWOOD HALE
10N 23W 09 CITY OF CLARKSVILLE 1 LUDWIG 10433 JOHNSON 775 714 2756 3881 4008 4083
10N 23W 21 JJG LANDS 1-21 LUDWIG 10846 JOHNSON 686 612 2734 4101 4235 4351
09N 23W 03 EUREKA BRICK & TILE 4 SPADRA 10525 JOHNSON 555 1744 4497 5843 5961 6056
09N 23W 10 CALLAHAN 2-10 SPADRA 10526 JOHNSON 517 1593 4333 5626 5736 5819
09N 23W 15 VOLA 2-15 SPADRA 10195 JOHNSON 479 1560 4220 5478 5610 5714

106
E-E`
F-F`
Well Label Field Name API County KB TACKETT CASEY KESSLERBRENTWOOD HALE
10N 22W 27 THOMPSON MOUNTAIN 1-2 ROSS 10594 JOHNSON 702 1351 3044 4236 4324 4443
10N 22W 34 WILKENS 1-34 ROSS 10772 JOHNSON 735 1215 2857 3774 3918 4012
09N 22W 15 CONAWAY 1 ROSS 10474 JOHNSON 369 2655 4378 5371 5471 5621
09N 22W 27 BLACKARD 1 ROSS 10501 JOHNSON 379 2618 4688 6005 6068 6212
08N 22W 02 TACKETT 3 KNOXVILLE 10521 JOHNSON 674 3202 5477 6876 7025 7109
Well Label Field Name API County KB TACKETT CASEY KESSLER BRENTWOOD HALE
08N 21W 22 BAILEY 1-22 KNOXVILLE 10245 POPE 389 3343 5913 7417 7534 7620
09N 21W 22 HOGREFE 3-22 ROSS 10354 POPE 457 2342 4386 5828 5884 5944
09N 21W 10 JOHNSON O" 4" ROSS 10644 POPE 737 2047 4036 5339 5436 5500
10N 21W 34 STRONG-TAYLOR 1 SILEX 10185 POPE 617 1733 3647 4845 4909 4973
10N 21W 27 SILEX GAS UNIT 5 SILEX 10092 POPE 888 909 2540 3714 3758 3797

107
APPENDIX (4)
A-A`
B-B`
C-C`
Well Label Field Name API County KB TACKETT CASEY BRENTWOOD KESSLER HALE
11N 23W 03 MOONEY 1-3 OZONE 10319 JOHNSON 1964 868 2074 1923 2183
11N 23W 16 ES 12006 1-16 WILDCAT 10347 JOHNSON 1805 1674 2947 2764 3059
11N 23W 32 STORMS 1-32 WILDCAT 10351 JOHNSON 430 1002 2874 4190 4092 4269
10N 23W 17 SOARD 1 LUDWIG 10242 JOHNSON 672 577 2682 4017 3855 4114
10N 23W 30 LOOPER A" 1" SPADRA 10376 JOHNSON 414 1205 3643 4779 4668 4955
09N 23W 06 WILLETT 1-6 SPADRA 10197 JOHNSON 1187 995 3444 4825 4694 4939
09N 23W 07 RIKER 2 SPADRA 10557 JOHNSON 381 1918 3805 5556 5449 5633
Well Label Field Name API County KB TACKETT CASEY KESSLER BRENTWOOD HALE
11N 22W 09 PURNELL 1 WILDCAT 10169 JOHNSON 1250 631 1870 1946 2047
11N 22W 29 WOODS MOUNTAIN 1 WILDCAT 10151 JOHNSON 1900 966 2162 2221 2287
10N 22W 18 GRAVES 1-18 LUDWIG 10899 JOHNSON 553 3039 4577 4660 4717
10N 23W 26 HORACE TOLBERT 1 LUDWIG 10043 JOHNSON 716 2326 3894 4869 4943 5009
09N 23W 03 EUREKA BRICK & TILE 3 SPADRA 10503 JOHNSON 535 2539 4635 5473 5559 5648
09N 23W 16 RIVERBEND A" 1" SPADRA 10480 JOHNSON 357 2174 4242 5692 5788 5878
Well Label Field Name API County KB TACKETT CASEY KESSLER BRENTWOOD HALE
BIBLER BROS INC 2-Jan WILDCAT 10236 JOHNSON 736 771 2127 2205 2286
TERRY 10-Feb WILDCAT 10237 JOHNSON 685 1405 2818 2860 2987
WHITKANACK 21-Jan HAGARVILLE 10738 JOHNSON 655 3068 4643 4731 4783
WHITKANACK 21-Jan HAGARVILLE 10738 JOHNSON 655 3068 4643 4731 4783
POMRENKE 1 ROSS 10278 JOHNSON 626 1042 3289 4786 4843 4907
CAMPBELL 1 ROSS 10616 JOHNSON 437 2980 5141 6604 6689 6788
LAMARK 18-Feb ROSS 10792 JOHNSON 432 3622 5874 7239 7324 7402
JOHNSON LINDA 25-Jan SPADRA 10782 JOHNSON 477 2793 5421 6891 6987 7087

108
D-D`
E-E`
F-F`
Well Label Field Name API County KB TACKETT CASEY KESSLER BRENTWOOD HALE
10N 21W 10 OZARK 1 WILDCAT 10259 POPE 867 1064 2832 3845 3946
10N 21W 15 RIGGS 1-15 SILEX 10319 POPE 686 987 2651 3725 3791
10N 21W 27 SILEX GAS UNIT 5 SILEX 10092 POPE 888 909 2466 3591 3661 3740
10N 21W 27 SILEX GAS UNIT 5 SILEX 10092 POPE 888 909 2466 3591 3661 3740
10N 21W 34 STRONG-TAYLOR 1 SILEX 10185 POPE 617 1733 3624 4833 4909 4973
09N 21W 09 BIBLER 4 ROSS 10637 POPE 885 2099 4086 5304 5392 5479
09N 21W 20 STEUBER UNIT 1 ROSS 10050 POPE 819 2686 4850 5975 6090 6171
09N 21W 29 MCCRAINE 1 ROSS 10680 POPE 611 3271 5306
08N 21W 06 NORDIN 6-1 KNOXVILLE 10098 POPE 860 2428 4860 6214 6279 6367
08N 22W 13 SOUTHLAND 2 KNOXVILLE 10603 POPE 703 3428 5891 7214 7280 7359
Well Label Field Name API County KB TACKETT CASEY KESSLER BRENTWOOD HALE
10N 20W 28 UTLEY 1-28 DOVER 10570 POPE 786 644 2537 4014 4077 4127
09N 20W 04 J C RENTFRO 1 DOVER 10013 POPE 773 1270 3148 4422 4575 4670
09N 20W 16 POWERS NEWTON 5 DOVER 10502 POPE 512 1264 2791 3994 4120 4195
09N 20W 20 CHURCHILL 1-20 NEW HOPE 10260 POPE 516 1700 3829 5182 5284 5372
08N 20W 06 PETERSON /A/ 1 FURGERSON 10223 POPE 714 2986 5399 6828 6907 7008
08N 21W 13 HARRISON 1-13 KNOXVILLE 10293 POPE 461 2059 4434 5755 5838 5918
08N 21W 24 UNDERHILL 1 KNOXVILLE 10308 POPE 403 3187 5714 7124 7220 7279
Well Label Field Name API County KB TACKETT CASEY KESSLER BRENTWOOD HALE
10N 19W 13 CURTIS 10-19 1-13HFAYETTEVLLE SHALE10682 POPE 604 673 1465 1527 1623
10N 19W 34 T B DAVIS 1 SCOTTSVILLE 63 POPE 754 1210 2310 2399 2493
09N 19W 09 BROWN 1-9 SCOTTSVILLE 10593 POPE 588 696 1792 1861 1960
09N 19W 17 BIBLER BROS INC 1-17 DOVER 10236 POPE 719 1461 2834 4181 4247 4335
09N 19W 20 WELSH 1-20 DOVER 10250 POPE 759 1303 2747 3960 4053 4132
09N 19W 30 HOGINS 1-30 DOVER 10529 POPE 623 936 2948 4288 4385 4464
08N 19W 06 BURTON 1 MORELAND 10581 POPE 788 1773 3824 5313 5384 5475
08N 20W 12 PARKER 2-12 MORELAND 10414 POPE 660 1816 4294 5751 5821 5909
08N 20W 24 NOWLIN 2-24 MORELAND 10352 POPE 486 3059 5955 7280 7324 7405

109
G-G`
AA-A`A`
BB-B`B`
Well Label Field Name API County KB TACKETT CASEY BRENTWOOD KESSLER HALE
10N 18W 29 COSSEY 29-1 HECTOR 10411 POPE 791 1015 2328 2243 2429
09N 18W 05 BIFFLE 1-5 HECTOR 10294 POPE 752 857 2084 1996 2166
09N 18W 18 HURLEY 1-18 WILDCAT 10093 POPE 722 817 1986 1851 2078
09N 18W 19 BEWLEY 1-19 MORELAND 10453 POPE 720 1683 2879 2797 3002
09N 19W 36 CAGLE 1-36 MORELAND 10272 POPE 672 903 2863 4402 4328 4504
08N 19W 13 PHAGAN 1-13 MORELAND 10263 POPE 653 471 2921 4484 4399 4575
08N 19W 23 GENERAL COUNCIL 1-23MORELAND 10482 POPE 571 1607 4250 5344 5270 5441
08N 19W 35 GRAY N" 1" MORELAND 10473 POPE 508 2686 6512 7708 7638 7773
Well Label Field Name API County KB TACKETT CASEY KESSLER BRENTWOOD HALE
11N 23W 16 ES 12006 1-16 WILDCAT 10347 JOHNSON 1805 1674 2764 2947 3059
11N 22W 29 WOODS MOUNTAIN 1 WILDCAT 10151 JOHNSON 1900 966 2162 2221 2287
10N 22W 12 BIBLER BROS INC 1-2 WILDCAT 10236 JOHNSON 736 771 2127 2205 2286
10N 22W 12 WATSON 1 WILDCAT 63 JOHNSON 771 1479 2711 2823 2920
10N 21W 29 STUMBAUGH 1-29 SILEX 10359 JOHNSON 805 1408 3107 4527 4591 4775
10N 21W 34 STRONG-TAYLOR 1 SILEX 10185 POPE 617 1733 3624 4833 4909 4973
10N 21W 36 YERINA 1-36 DOVER 10671 POPE 767 1600 3126 4496 4631 4751
09N 20W 04 J C RENTFRO 1 DOVER 10013 POPE 773 1270 3148 4422 4575 4670
09N 20W 01 BIBLER 1 DOVER 10018 POPE 680 869 2620 3775 3875 3944
09N 19W 09 BROWN 1-9 SCOTTSVILLE 10593 POPE 588 696 1792 1861 1960
09N 18W 18 HURLEY 1-18 WILDCAT 10093 POPE 722 817 1851 1986 2078

110
Well Label Field Name API County KB TACKETT CASEY KESSLER BRENTWOOD HALE
09N 23W 06 WILLETT 1-6 SPADRA 10197 JOHNSON 1187 995 3444 4694 4825 4939
09N 23W 03 EUREKA BRICK & TILE 4 SPADRA 10525 JOHNSON 555 1740 4723 5879 5961 6056
09N 22W 19 PATTERSON 2-19 KNOXVILLE 10304 JOHNSON 445 2250 5221 6459 6568 6655
09N 22W 28 BLUFF BEE 1-28 KNOXVILLE 10396 JOHNSON 582 3489 5118 6337 6424 6527
08N 21W 06 NORDIN 6-1 KNOXVILLE 10098 POPE 860 2428 4860 6214 6279 6367
08N 21W 13 HARRISON 1-13 KNOXVILLE 10293 POPE 461 2059 4434 5755 5838 5918
08N 20W 18 HARRISON 1-18 FURGERSON 10303 POPE 477 2363 4944 5913 5962 6054
08N 20W 22 R N BARTON 22-1 FURGERSON 10138 POPE 427 3184 5890 7308 7401 7477
08N 20W 24 NOWLIN 2-24 MORELAND 10352 POPE 486 3059 5955 7280 7324 7405
08N 19W 29 BRADEN 1 MORELAND 10333 POPE 476 2946 5847 7206 7265 7346
08N 19W 35 GRAY N" 1" MORELAND 10473 POPE 508 2686 6512 7638 7708 7773