initial performance of ipos and the bankruptcy risk: a
TRANSCRIPT
Research in Business and Management
ISSN 2330-8362
2015, Vol. 2, No. 2
www.macrothink.org/rbm 34
Initial Performance of IPOs and the Bankruptcy Risk: A
Comparison of Internet Firms and the Traditional Firms
Nguyen Quang My
Alliant School of Management, Alliant International University
10455 Pomerado Rd, San Diego, CA, USA 92131
Peter S. Kim
Alliant School of Management, Alliant International University
10455 Pomerado Rd, San Diego, CA, USA 92131
Mustafa Sayim (Corresponding author)
Alliant School of Management, Alliant International University
10455 Pomerado Rd, San Diego, CA, USA 92131
E-mail: [email protected]
Received: June 16, 2015 Accepted: July 10, 2015 Published: July 31, 2015
doi:10.5296/rbm.v2i2.7811 URL: http://dx.doi.org/10.5296/rbm.v2i2.7811
Abstract
This study examines whether Internet Firms’ IPOs have more of a tendency to fail than
Traditional Firms’ IPOs. IPO issue has long been known as an interesting yet complicated
topic to explore. There are heated debates on whether Internet Firm IPOs outperform or
underperform Traditional Firm IPOs. In other words, whether investment risks associated
with Internet Firms are different than Traditional Firms? Should investment decision-making
process be different for Internet Firms than Traditional Firms? In this study, Internet Firms
are defined as companies that are providing goods and services through Internet. Furthermore,
all other types of companies are considered as Traditional Firms. The Z-score formula for
predicting bankruptcy of Altman (1968) was utilized. Then the two-way factorial ANOVA
was conducted with the type I error as 0.05 to test the Z-Score across 12 quarters from
January 2012 to December 2014. The findings revealed that both Internet Firms and
Traditional Firms generally had similar risks as no one type of firms showed significantly
higher risks than the other.
Keywords: IPOs; Internet Firms, Traditional Firms; and Z-Score Altman Model
Research in Business and Management
ISSN 2330-8362
2015, Vol. 2, No. 2
www.macrothink.org/rbm 35
1. Introduction
One of the major ways to raise capital to support firms’ operations, investments and other
activities is to go public. It is widely observed that going public is becoming one of
worldwide trends nowadays. However, the IPO process brings various challenges and
opportunities for both offering firms and investors (Barbagallo, 2014). Consequently,
understanding performance trends of IPOs could open more comprehensive understanding for
investors, practitioners and researchers. In this paper, we hope that this research would
encourage other scholars and experts to explore further on risks and opportunities that are
associated with Internet Firms as the business world is rapidly changing, contents and facts
included in financial statements of modern business world have significantly changed.
There are considerable amount of research on investors’ decision making and their rationale
on IPOs (Aggarwal & Rivoli, 1990; Anlin, Roger & Kuei-Ling Pan, 2002; Dominic, Sunil &
Kenton, 2003; Hanley, 1993; Weber & Willenborg, 2003). Previous studies were applied
various models such as Market Model and Fama-French Three-Factor Model to identify
better ways to invest in IPOs. However, it is clearly proven that financial crisis are recurring
and many investors find themselves dumbfounded as many sophisticated investors also find
themselves in a big hole of losses from the financial crisis (Goldman & Sosin, 1979; Rajan,
2008). For an example, the 2008 finance crisis made a considerable influence on the stock
market throughout the world. As a result, many investors were seriously worried and afflicted
when most of US stock indexes in 2009 fell down to the lowest floor in the last 15 years. The
investors’ confidence on the US stock market had decreased dramatically, which caused many
firms to stay away from IPOs (Fuhrman, 2012). Yet, some experts hoped for a re-bound in US
stock market like Stephen Wood, chief market strategist at Russell Investments. He noted that
this crisis has just been the creative destruction to create good stories for IPOs (Wood, 2010).
But, this was just an expectation when most of the European economics went into the
recession subsequently. During 2009 – 2010, there were significantly low IPO activities as
Sham Gad (2011) indicated that “The IPO market basically died during the 2009-2010
recession because stock valuations were low across the market. IPO stocks couldn't justify a
high offering valuation when existing stocks were trading in value territory, so most chose not
to test the market”. Soon, as Stephen Wood hoped, in 2011, IPO activities started to gain
momentum. In 2011, there were 338 IPOs and 24 of the 338 IPOs were Internet Firm IPOs
according to Renaissance Capital (2011). Therefore, this study investigates the bankruptcy
risk on the Internet Firms IPOs from January 2012 to December 2014. The two-way factorial
ANOVA was conducted with the type I error as 0.05 to test the Z-Score across 12 quarters
from 2012 to 2014. The results showed that there was no statistical significant difference in
the total of Z-score between Internet Firms and Traditional Firms (p-value of main effect and
interaction effects > 0.05). Particularly, the one-way ANOVA also was conducted with the
type I error as 0.05 to test the Z-score in detailed information across 12 quarters from 2012 to
2014. The results showed that there was no statistical significant difference in the total of
Z-score between Internet Firms and Traditional Firms in every quarter (all of the p-values >
0.05). The results showed that both Internet Firms and Traditional Firms generally had
similar risks as no one type of firms showed significantly higher risks than the other.
Based on our best knowledge, this paper is to be the first to compare the bankruptcy risk both
Internet Firms and Traditional Firms. The results of this paper can provide helpful
information to investors in evaluating the risk of internet firms.
The rest of the study is organized as follows. Section 2 examines literature review, Section 3
presents the model and methodology, Section 4 discusses data, Section 5 evaluates the
findings and finally, Section 6 concludes the study.
Research in Business and Management
ISSN 2330-8362
2015, Vol. 2, No. 2
www.macrothink.org/rbm 36
2. Literature Review
2.1 The underpricing and lack of information
Many of the previous studies mainly concentrated on IPOs in the bull markets such as IPOs
in during dot-com era (early 1990s) and housing bubble era (early 2000s) (Aggarwal &
Rivoli, 1990). Consequently, they implied that if IPO shares were highly attractive and
investors would make a significant profit in the early aftermarket (Aggarwal & Rivoli, 1990).
In other words, the underpricing of IPOs based on the information asymmetry in the issuance
market, which may not reflect genuinely stocks. In terms of efficient pricing and risk
assessment, however, IPO firms are characteristically different from firms that have a public
trading history; there is a lack of information concerning IPO firms, and therefore potentially
greater uncertainty associate with their valuation (Weber & Willenborg, 2003). This suggests
that financial models and investment decision-making process may not be correctly
considering factors.
2.2 IPOs’ Initial Performances
Based on the research of Anlin, Roger and Kuei-Ling Pan (2002), by applying Market Model
and Fama-French Three-Factor Model to measure Taiwan’s IPO trends from 1992 to 1994,
they supposed that the short-term performance of IPOs tends to be poor, but is regarded as
normal return pattern for an ordinary asset in long-term. However, there are different results
in other findings such as Jelic, Saadouni and Briston (2001), which showed that Malaysian
IPOs with high long-term return up to 3-year after listing (1980-1995); Dominic, Sunil and
Kenton (2003) stated that IPOs in Mauritius (1989-1998) are underpricing the initial
performance but it is good in the long term.
By contrast, many other findings examined that IPO long-run performance is worse than the
market performance. For example, the two-year holding period return of American IPOs
findings of Hanley (1993) showed that IPO long-run performance is poor (1983 – 1987); long
term post-IPO performance ( 1998 – 2007) declines when compared to peers and the market
(Vance & Mascarenhas, 2014); the three-year holding period of Americans from 1988 - 1991
was supposed to be poor (Carter, Dark & Singh, 1998); Kooli and Suret (2004) also find the
underperformance in Canadian’s IPOs (1991 – 1998); or even there are a negative long‐run
Spanish abnormal stock returns (1987 – 1997) that existed in the IPO aftermarket (Alvarez &
Gonzalez, 2005). It seems that the underpricing of IPOs has just been a short-run
phenomenon (Ritter, 1991).
2.3 The international comparing trends of previous researches
Previous research also focuses on comparing the performance of many IPO groups, which
help create necessary assumptions to the literature. These groups usually depend on the needs
of the domestic stock market such as the trends of “A-share and B-share IPOs”, which has
been regarded as typical differentiation of China. Chen, Firth and Kim (2000) had showed
differences and economic factors, which determine the trends of these IPO groups (1992 –
1995). Another comparison is often a concern in the market, which is the “Private
Equity-backed Firms’ IPO vs Non-private Equity-backed Firms’ IPO” (Van Frederikslust &
Van der Geest, 2001). Or the “Privatization IPOs and Non-privatization IPOs” is also an
emerging topic of the stock market such as the findings of EO Lyn and Zychowicz (2003) in
Poland and Hungary (1991 – 1998); or Choi and Nam’s (1998) short-term performance
findings with 185 privatization IPOs from 30 countries over the period from 1981 to 1997.
One more comparison, the “Family‐owned Business and Non-family Business IPOs” is one
of the emerging trends of many researchers such as Peter et al. (2005); Ehrhardt and Nowak
Research in Business and Management
ISSN 2330-8362
2015, Vol. 2, No. 2
www.macrothink.org/rbm 37
(2001); Mazzola and Marchisio (2002). Regarding to IPOs in USA, a famous study of a
finance researcher group: Krishnan, Ivanov, Masulis and Singh (2011) raised a special IPO
group – Venture Capital Reputation, which is very popular in American IPOs (1993-2004).
2.4 Previous researches on Internet Firm IPOs – one of popular yet intriguing issues
Refer to Internet Firm IPOs, Bartov, Mohanram and Seethamraju (2002) and Hand (2000)
had previous research on the valuation of Internet Firms after IPOs. They found that “Net
firms’ lack of profitability has its roots in their huge investments in intangible marketing
brand assets aimed at rapidly seizing a dominant market-share position” (Hand, 2000).
Botman, Roosenboom and Goot (2004) also showed that “market value is negatively related
to net income in the Internet bubble period before April 1, 2000 in both European and U.S.
IPO markets”. On the other hand, some researchers supposed that this kind of company
tended to hurriedly “go public to grab market share. Internet Firms are buying other Internet
Firms at a furious pace” (Schultz & Zaman, 2001). As a result, the after IPO market would
exist non-surviving and surviving firms. The survivors are “associated with lower risk, higher
underwriter reputation, higher investor demand, lower valuation uncertainty, higher insider
ownership retention, a lower NASDAQ market level, and a higher offer-to-book ratio”
(Botman, Goot & Giersbergen, 2004). However, this kind of firm IPO is always potentially
faced with risks such as being acquired or going into bankruptcy (Botman, Goot &
Giersbergen, 2004). In other words, there seemed to be tantalizing parallels among the
Internet crash, the Internet bubble and the recent financial crisis (Bhattacharya, Demers &
Joos, 2010).
Generally, there were many differences in short-term and long-term IPO performances from
countries, years and analyzed samples. Therefore, this paper tends to focus on the
performances of American IPOs yet in a special perspective – the performance of Internet
Companies, which were supposed to have good IPOs in 2011 and compares them with
Traditional IPOs whether Internet Firm IPOs or Traditional Firm IPOs has more of a
tendency to fail. Moreover, researching these Internet IPOs’ performances would help
identify earlier warning signals about the failure risks and limiting losses for investors.
3. Methodology
This study defines Internet Firms and Traditional Firms based on the types of goods and
services that each firm provides. The term “Internet Firm” is defined as firms that offer goods
and services that are intangible and based on the Internet. In other words, a firm’s core
business model is based on Internet platform is considered as Internet Firm such as Facebook,
Yelp or Google. The term “Traditional Firm” is defined as the other firms. As a result, this
study uses data on 17 Internet Firm IPOs and 17 typical Traditional Firm IPOs, which offered
their first public offering on the major U.S. stock exchanges in 2011 (NASDAQ and NYSE).
This study utilizes the Altman Z-score to examine whether Internet Firms’ IPOs have more of
a tendency to bankrupt than Traditional Firms’ IPOs.
There are a lot of interests in development of corporate bankruptcy prediction models, yet
there is a lack of documentation concerning the firm-specific factors that are associated with
IPO firm failure (Demers and Joos, 2007). As a result, this study considers the Altman
Z-score model (Altman, 1968) as a suitable application to compare the performance of two
kinds of firm. The Altman Z-Score was found to be 72% accurate in predicting bankruptcy
for more than two years.
The original Z-score formula was as follows:
Z = 1.2T1 + 1.4T2 + 3.3T3 + 0.6T4 + 0.99T5
Research in Business and Management
ISSN 2330-8362
2015, Vol. 2, No. 2
www.macrothink.org/rbm 38
Where T1 = Working Capital / Total Assets measuring liquid assets in relation to the size of
the firm, T2 = Retained Earnings / Total Assets measuring profitability that reflects the firm's
age and earning power, T3 = Earnings before Interest and Taxes / Total Assets measuring
operating efficiency apart from tax and leveraging factors; it recognizes operating earnings as
being important to long-term viability, T4 = Market Value of Equity / Book Value of Total
Liabilities adding market dimension that can show up security price fluctuation as a possible
red flag, T5 = Sales/ Total Assets, is a standard measure for total asset turnover.
The Interpretation of Altman Z-Score:
- If Z > 2.99 -“Safe” Zones. The company is considered ‘Safe’ based on the financial
figures only.
- If 1.81 < Z < 2.99 -“Grey” Zones. This zone is an area where one should ‘Exercise
Caution’.
- If Z < 1.81 -“Distress” Zones. Probability of Financial insolvency or bankruptcy is Very
High.
We prefer to utilize the original Altman Z-score formula than other models to measure both
Internet and Traditional Firms. It is supposed that the T5 should be excluded to minimize the
effects of manufacturing-intensive asset turnover (Intania & Nugroho, 2014). However, this
study tends to concentrate on the meaning of asset turnover, which shows that one asset unit
creates the amount of sales.
As a result, the original Z-score is expected to be more comprehensive and effective. The first
variable (T1) is a good indicator of a firm's ability to control the operating performance in the
next few months. The second ratio (T2) is a good indicator of how in debt the firm is and
whether it has a history of profitability. The third ratio (T3) is to measure the efficiency in that
it indicates how many cents the firm generates in earnings for every dollar of assets it owns.
The fourth ratio (T4) is a fluid measure of the market's value in the firm (external
performance). The fifth ratio (T5) is nearly the same with the third one but it tends to focus on
the effectiveness of using sale and operation costs.
3.1 Data
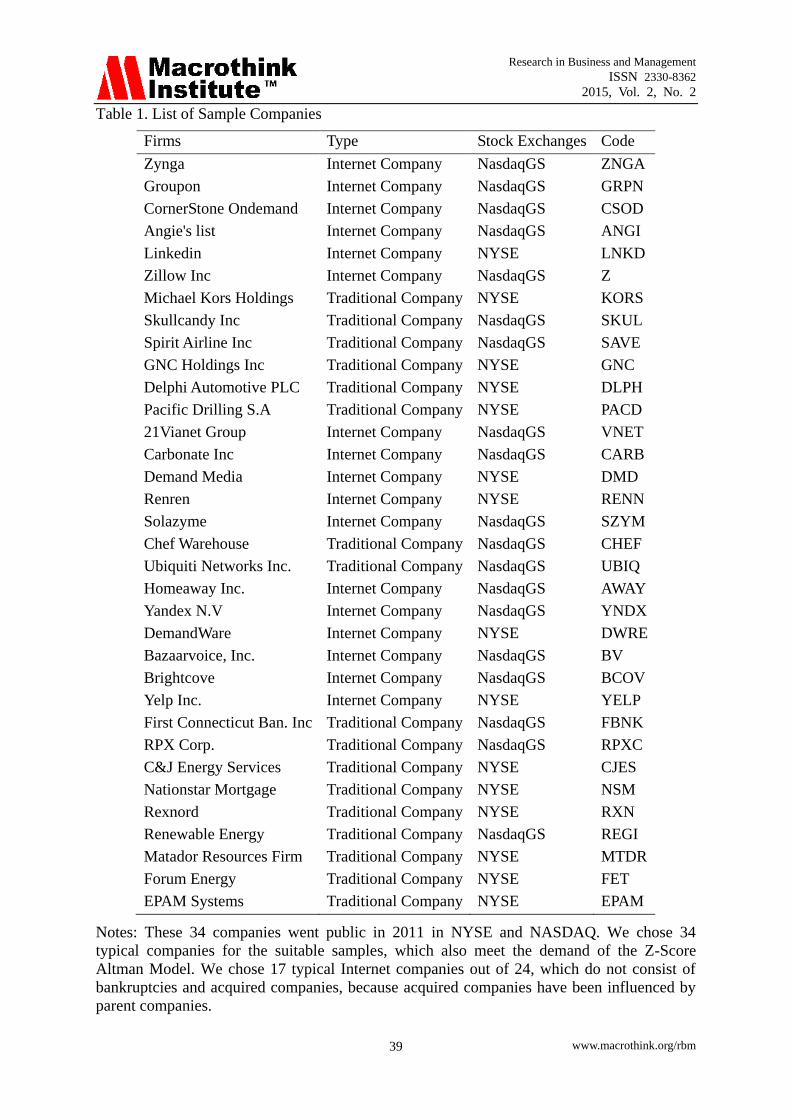
As mentioned earlier, this study chooses 34 IPOs in 2011, which consist of 17 Internet Firms
(out of 24 Internet IPOs in 2011) and 17 Traditional Firms (see Table 1). In 17 Internet Firms’
IPOs in 2011, bankrupted firms and acquired firms were excluded. The database contains
financial figures of 12 quarters from January 2012 to December 2014 and obtained from
http://bear.warrington.ufl.edu/ritter/ipodata.htm and companies’ websites, which is based on
the Z-score model. The Market Value of Equity is equal to the average price of each quarter
multiplied by the number of shares at the same time.
4. Findings
4.1 Descriptive Statistics
Table 2 and 3 are the summary statistics of the variables in this study. The mean of Z-Score of
internet companies is a greater than the mean of Z-score of traditional companies. In addition,
the standard deviation of Z-score of internet companies is higher than the standard deviation
of Z-score of traditional companies. This may suggest internet companies are more volatile
during this period.
Research in Business and Management
ISSN 2330-8362
2015, Vol. 2, No. 2
www.macrothink.org/rbm 39
Table 1. List of Sample Companies
Firms Type Stock Exchanges Code
Zynga Internet Company NasdaqGS ZNGA
Groupon Internet Company NasdaqGS GRPN
CornerStone Ondemand Internet Company NasdaqGS CSOD
Angie's list Internet Company NasdaqGS ANGI
Linkedin Internet Company NYSE LNKD
Zillow Inc Internet Company NasdaqGS Z
Michael Kors Holdings Traditional Company NYSE KORS
Skullcandy Inc Traditional Company NasdaqGS SKUL
Spirit Airline Inc Traditional Company NasdaqGS SAVE
GNC Holdings Inc Traditional Company NYSE GNC
Delphi Automotive PLC Traditional Company NYSE DLPH
Pacific Drilling S.A Traditional Company NYSE PACD
21Vianet Group Internet Company NasdaqGS VNET
Carbonate Inc Internet Company NasdaqGS CARB
Demand Media Internet Company NYSE DMD
Renren Internet Company NYSE RENN
Solazyme Internet Company NasdaqGS SZYM
Chef Warehouse Traditional Company NasdaqGS CHEF
Ubiquiti Networks Inc. Traditional Company NasdaqGS UBIQ
Homeaway Inc. Internet Company NasdaqGS AWAY
Yandex N.V Internet Company NasdaqGS YNDX
DemandWare Internet Company NYSE DWRE
Bazaarvoice, Inc. Internet Company NasdaqGS BV
Brightcove Internet Company NasdaqGS BCOV
Yelp Inc. Internet Company NYSE YELP
First Connecticut Ban. Inc Traditional Company NasdaqGS FBNK
RPX Corp. Traditional Company NasdaqGS RPXC
C&J Energy Services Traditional Company NYSE CJES
Nationstar Mortgage Traditional Company NYSE NSM
Rexnord Traditional Company NYSE RXN
Renewable Energy Traditional Company NasdaqGS REGI
Matador Resources Firm Traditional Company NYSE MTDR
Forum Energy Traditional Company NYSE FET
EPAM Systems Traditional Company NYSE EPAM
Notes: These 34 companies went public in 2011 in NYSE and NASDAQ. We chose 34
typical companies for the suitable samples, which also meet the demand of the Z-Score
Altman Model. We chose 17 typical Internet companies out of 24, which do not consist of
bankruptcies and acquired companies, because acquired companies have been influenced by
parent companies.

Research in Business and Management
ISSN 2330-8362
2015, Vol. 2, No. 2
www.macrothink.org/rbm 40
Table 2. Z-Score Descriptive of Internet Companies
Mean Median Maximum Minimum Std. Dev. Skewness Kurtosis
Q42014 10.02 1.89 63.30 -0.67 17.76 2.35 5.12
Q32014 12.37 2.66 84.61 -3.00 22.75 2.54 6.50
Q22014 12.30 3.04 89.15 -0.93 22.81 2.85 8.53
Q12014 14.70 4.41 109.65 0.28 26.97 3.11 10.50
Q42013 13.62 4.55 89.79 0.61 22.85 2.77 8.06
Q32013 14.53 4.01 72.75 0.65 21.21 1.97 3.13
Q22013 10.67 3.38 48.34 0.01 14.94 1.89 2.62
Q12013 9.64 2.76 38.87 -0.28 12.36 1.64 1.62
Q42012 9.31 5.29 37.13 -0.16 10.22 1.66 2.42
Q32012 12.13 6.30 63.54 -0.05 15.72 2.51 7.14
Q22012 12.89 9.25 60.02 0.10 14.70 2.31 6.31
Q12012 14.20 9.57 66.97 0.35 16.13 2.47 7.12
Note: The Z-Score of 17 Internet Firms based on 5 variables was calculated for 12 quarters
(E.g.: Q12012: Quarter 1 year 20012), which is from January 2012 to December 2014.
Table 3. Z-Score Descriptive of Traditional Companies
Mean Median Maximum Minimum Std. Dev. Skewness Kurtosis
Q42014 4.60 2.39 22.01 0.15 5.85 2.09 4.25
Q32014 5.07 2.52 24.81 0.24 6.52 2.19 4.77
Q22014 5.45 2.57 28.50 0.22 7.37 2.38 5.81
Q12014 6.04 2.76 29.33 0.22 8.26 2.02 3.31
Q42013 5.78 2.81 27.88 0.14 7.74 2.07 3.64
Q32013 5.51 2.79 28.79 0.11 7.44 2.40 5.87
Q22013 4.66 2.58 26.37 0.06 6.62 2.66 7.43
Q12013 4.58 2.30 30.55 0.30 7.33 3.17 10.87
Q42012 4.16 2.40 26.47 0.32 6.24 3.20 11.29
Q32012 4.28 2.33 20.02 0.32 5.07 2.19 5.25
Q22012 5.02 2.50 21.36 0.23 6.21 1.86 2.60
Q12012 5.71 2.62 25.73 0.32 7.33 2.10 3.77
Note: The Z-Score of 17 Traditional Firms based on 5 variables was calculated for 12 quarters
(E.g.: Q12012: Quarter 1 year 20012), which is from January 2012 to December 2014.
4.2 The fairness of IPO opportunities
The independence of observation was assumed. However, the assumption of normality and
homogeneity were not met. As a result, the two-way factorial ANOVA is robust. The
assumption of Spheriscity was not assumed hence the Huynh-Feldt data was preferable (see
Table 4).
Research in Business and Management
ISSN 2330-8362
2015, Vol. 2, No. 2
www.macrothink.org/rbm 41
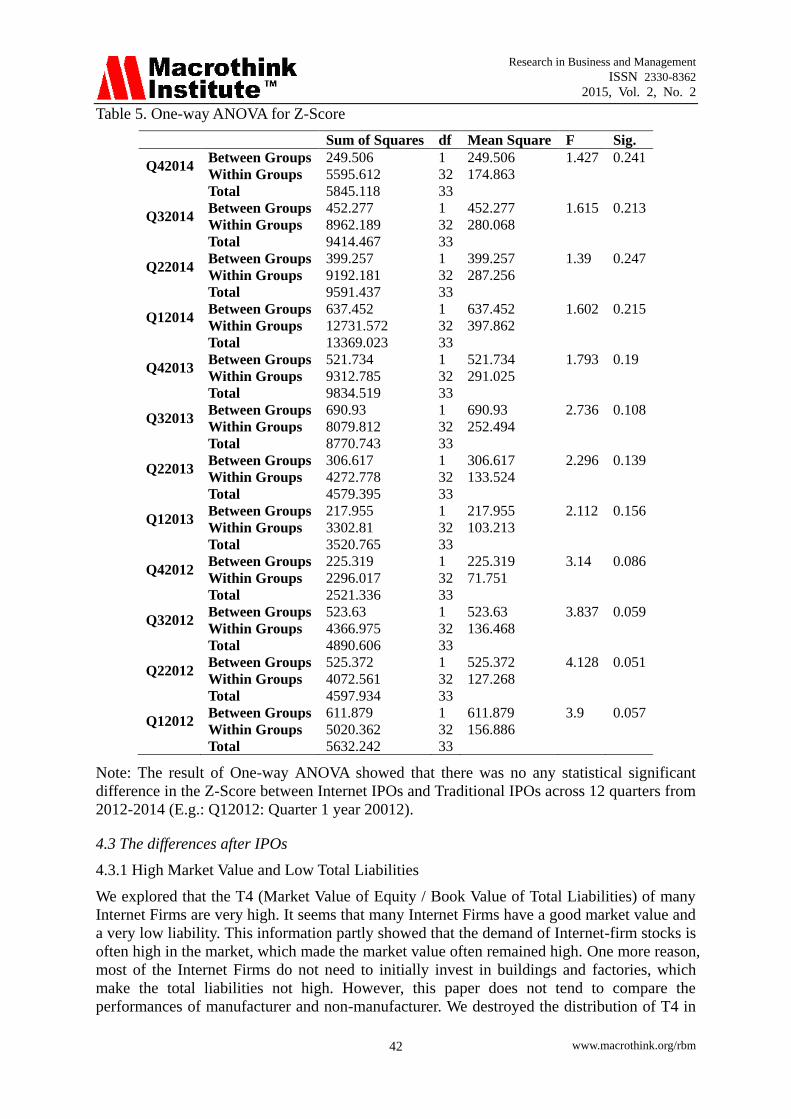
Table 5 shows the results of the one-way ANOVA with the type I error as 0.05 to test the
Z-score in detailed information across 12 quarters from January 2012 to December 2014. The
results showed that there was no statistical significant difference in the total of Z-score between
Internet Firms and Traditional Firms in every quarter (all of the p-values > 0.05).
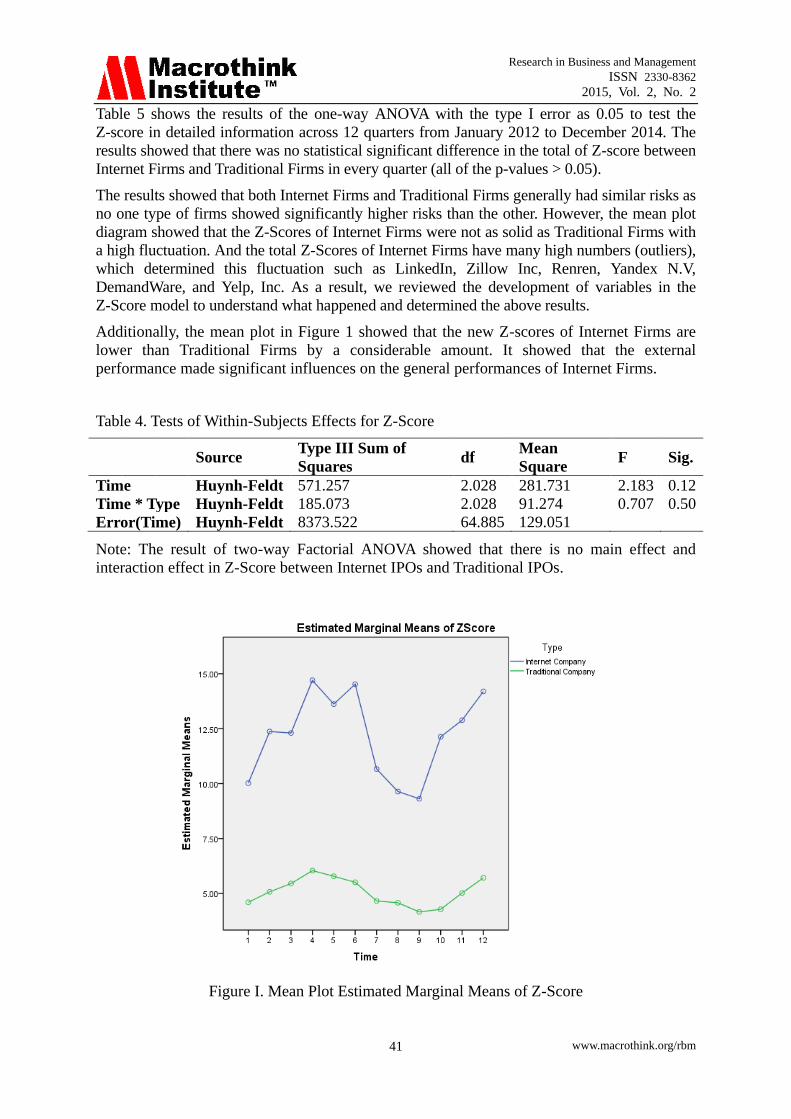
The results showed that both Internet Firms and Traditional Firms generally had similar risks as
no one type of firms showed significantly higher risks than the other. However, the mean plot
diagram showed that the Z-Scores of Internet Firms were not as solid as Traditional Firms with
a high fluctuation. And the total Z-Scores of Internet Firms have many high numbers (outliers),
which determined this fluctuation such as LinkedIn, Zillow Inc, Renren, Yandex N.V,
DemandWare, and Yelp, Inc. As a result, we reviewed the development of variables in the
Z-Score model to understand what happened and determined the above results.
Additionally, the mean plot in Figure 1 showed that the new Z-scores of Internet Firms are
lower than Traditional Firms by a considerable amount. It showed that the external
performance made significant influences on the general performances of Internet Firms.
Table 4. Tests of Within-Subjects Effects for Z-Score
Source Type III Sum of
Squares df
Mean
Square F Sig.
Time Huynh-Feldt 571.257 2.028 281.731 2.183 0.12
Time * Type Huynh-Feldt 185.073 2.028 91.274 0.707 0.50
Error(Time) Huynh-Feldt 8373.522 64.885 129.051
Note: The result of two-way Factorial ANOVA showed that there is no main effect and
interaction effect in Z-Score between Internet IPOs and Traditional IPOs.
Figure I. Mean Plot Estimated Marginal Means of Z-Score
Research in Business and Management
ISSN 2330-8362
2015, Vol. 2, No. 2
www.macrothink.org/rbm 42
Table 5. One-way ANOVA for Z-Score
Sum of Squares df Mean Square F Sig.
Q42014 Between Groups 249.506 1 249.506 1.427 0.241
Within Groups 5595.612 32 174.863
Total 5845.118 33
Q32014 Between Groups 452.277 1 452.277 1.615 0.213
Within Groups 8962.189 32 280.068
Total 9414.467 33
Q22014 Between Groups 399.257 1 399.257 1.39 0.247
Within Groups 9192.181 32 287.256
Total 9591.437 33
Q12014 Between Groups 637.452 1 637.452 1.602 0.215
Within Groups 12731.572 32 397.862
Total 13369.023 33
Q42013 Between Groups 521.734 1 521.734 1.793 0.19
Within Groups 9312.785 32 291.025
Total 9834.519 33
Q32013 Between Groups 690.93 1 690.93 2.736 0.108
Within Groups 8079.812 32 252.494
Total 8770.743 33
Q22013 Between Groups 306.617 1 306.617 2.296 0.139
Within Groups 4272.778 32 133.524
Total 4579.395 33
Q12013 Between Groups 217.955 1 217.955 2.112 0.156
Within Groups 3302.81 32 103.213
Total 3520.765 33
Q42012 Between Groups 225.319 1 225.319 3.14 0.086
Within Groups 2296.017 32 71.751
Total 2521.336 33
Q32012 Between Groups 523.63 1 523.63 3.837 0.059
Within Groups 4366.975 32 136.468
Total 4890.606 33
Q22012 Between Groups 525.372 1 525.372 4.128 0.051
Within Groups 4072.561 32 127.268
Total 4597.934 33
Q12012 Between Groups 611.879 1 611.879 3.9 0.057
Within Groups 5020.362 32 156.886
Total 5632.242 33
Note: The result of One-way ANOVA showed that there was no any statistical significant
difference in the Z-Score between Internet IPOs and Traditional IPOs across 12 quarters from
2012-2014 (E.g.: Q12012: Quarter 1 year 20012).
4.3 The differences after IPOs
4.3.1 High Market Value and Low Total Liabilities
We explored that the T4 (Market Value of Equity / Book Value of Total Liabilities) of many
Internet Firms are very high. It seems that many Internet Firms have a good market value and
a very low liability. This information partly showed that the demand of Internet-firm stocks is
often high in the market, which made the market value often remained high. One more reason,
most of the Internet Firms do not need to initially invest in buildings and factories, which
make the total liabilities not high. However, this paper does not tend to compare the
performances of manufacturer and non-manufacturer. We destroyed the distribution of T4 in
Research in Business and Management
ISSN 2330-8362
2015, Vol. 2, No. 2
www.macrothink.org/rbm 43
the Z-Score Model and we conducted a one-way ANOVA with a new Model:
Z = 1.2T1 + 1.4T2 + 3.3T3 + 0.6T4 + 0.99T5
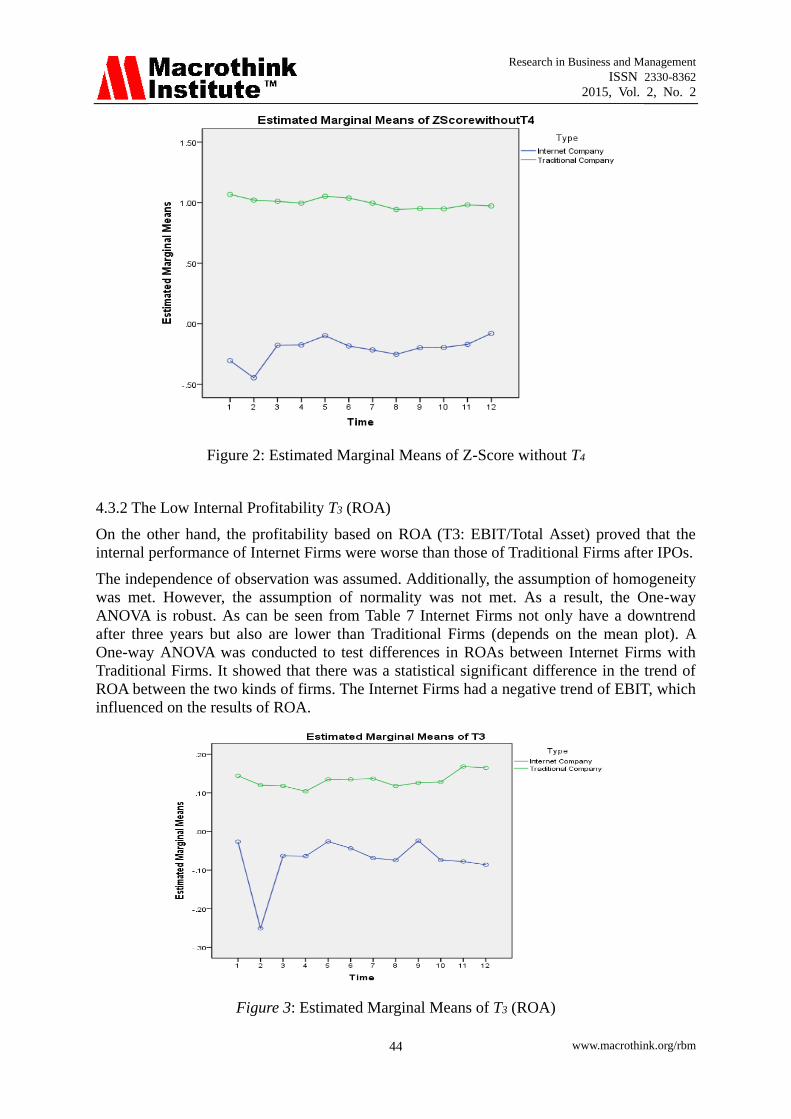
The independence of observation was assumed. And the assumption of normality was and
homogeneity was met. Table 6 summarizes the result of One-way ANOVA. It showed that there
was a statistical significant difference in the new Z-scores between Internet Firms and
Traditional Firms. Additionally, the mean plot showed that the new Z-scores of Internet Firms
are lower than Traditional Firms by a considerable amount (see Figure 2). It showed that the
external performance made significant influences on the general performances of Internet Firms.
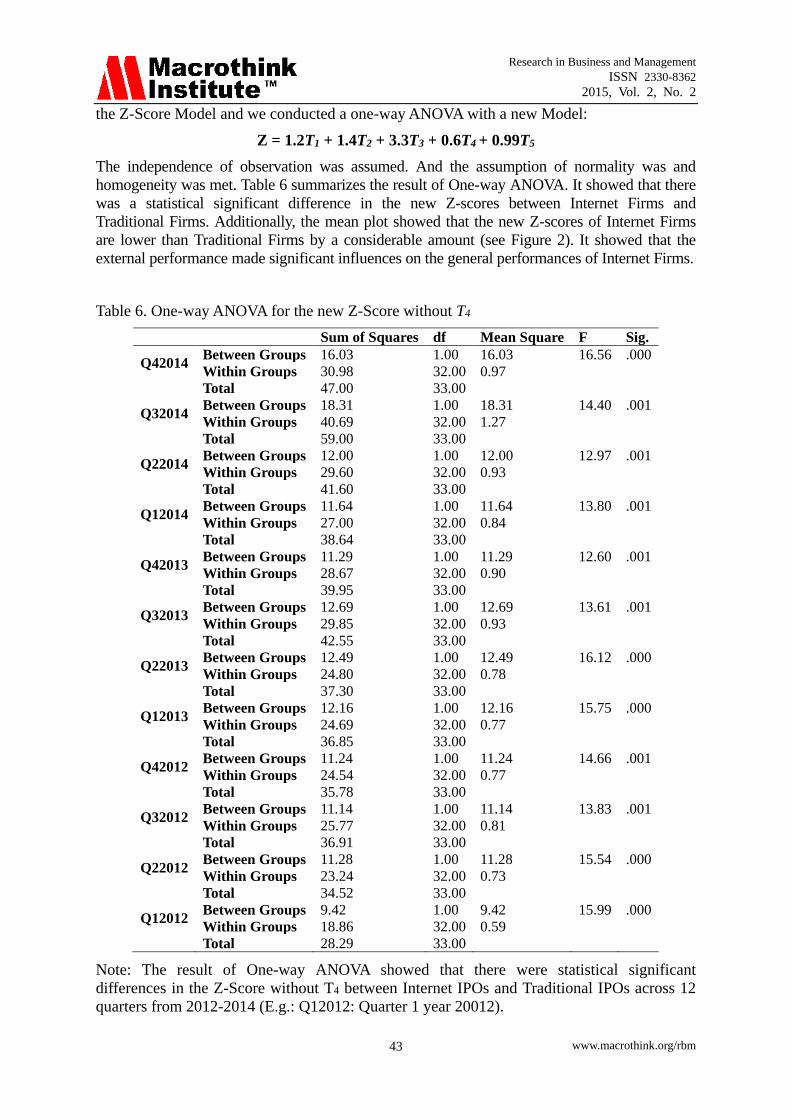
Table 6. One-way ANOVA for the new Z-Score without T4
Sum of Squares df Mean Square F Sig.
Q42014 Between Groups 16.03 1.00 16.03 16.56 .000
Within Groups 30.98 32.00 0.97
Total 47.00 33.00
Q32014 Between Groups 18.31 1.00 18.31 14.40 .001
Within Groups 40.69 32.00 1.27
Total 59.00 33.00
Q22014 Between Groups 12.00 1.00 12.00 12.97 .001
Within Groups 29.60 32.00 0.93
Total 41.60 33.00
Q12014 Between Groups 11.64 1.00 11.64 13.80 .001
Within Groups 27.00 32.00 0.84
Total 38.64 33.00
Q42013 Between Groups 11.29 1.00 11.29 12.60 .001
Within Groups 28.67 32.00 0.90
Total 39.95 33.00
Q32013 Between Groups 12.69 1.00 12.69 13.61 .001
Within Groups 29.85 32.00 0.93
Total 42.55 33.00
Q22013 Between Groups 12.49 1.00 12.49 16.12 .000
Within Groups 24.80 32.00 0.78
Total 37.30 33.00
Q12013 Between Groups 12.16 1.00 12.16 15.75 .000
Within Groups 24.69 32.00 0.77
Total 36.85 33.00
Q42012 Between Groups 11.24 1.00 11.24 14.66 .001
Within Groups 24.54 32.00 0.77
Total 35.78 33.00
Q32012 Between Groups 11.14 1.00 11.14 13.83 .001
Within Groups 25.77 32.00 0.81
Total 36.91 33.00
Q22012 Between Groups 11.28 1.00 11.28 15.54 .000
Within Groups 23.24 32.00 0.73
Total 34.52 33.00
Q12012 Between Groups 9.42 1.00 9.42 15.99 .000
Within Groups 18.86 32.00 0.59
Total 28.29 33.00
Note: The result of One-way ANOVA showed that there were statistical significant
differences in the Z-Score without T4 between Internet IPOs and Traditional IPOs across 12
quarters from 2012-2014 (E.g.: Q12012: Quarter 1 year 20012).
Research in Business and Management
ISSN 2330-8362
2015, Vol. 2, No. 2
www.macrothink.org/rbm 44
Figure 2: Estimated Marginal Means of Z-Score without T4
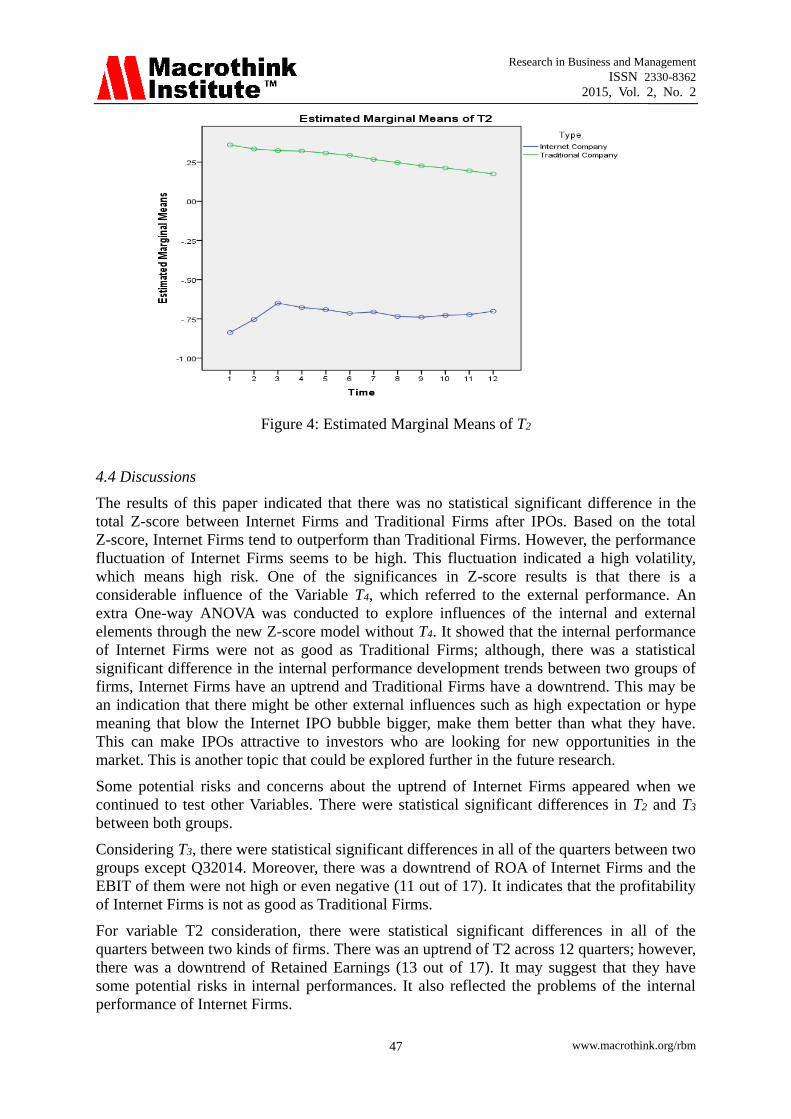
4.3.2 The Low Internal Profitability T3 (ROA)
On the other hand, the profitability based on ROA (T3: EBIT/Total Asset) proved that the
internal performance of Internet Firms were worse than those of Traditional Firms after IPOs.
The independence of observation was assumed. Additionally, the assumption of homogeneity
was met. However, the assumption of normality was not met. As a result, the One-way
ANOVA is robust. As can be seen from Table 7 Internet Firms not only have a downtrend
after three years but also are lower than Traditional Firms (depends on the mean plot). A
One-way ANOVA was conducted to test differences in ROAs between Internet Firms with
Traditional Firms. It showed that there was a statistical significant difference in the trend of
ROA between the two kinds of firms. The Internet Firms had a negative trend of EBIT, which
influenced on the results of ROA.
Figure 3: Estimated Marginal Means of T3 (ROA)

Research in Business and Management
ISSN 2330-8362
2015, Vol. 2, No. 2
www.macrothink.org/rbm 45
Additionally, the mean plot from Figure 3 showed that the new Z-scores of Internet Firms are
lower than Traditional Firms by a considerable amount (see Figure 3). It showed that the
external performance made significant influences on the general performances of Internet
Firms.
Table 7. One-way ANOVA for the Variable T3
Sum of
Squares df
Mean
Square F Sig.
Q42014 Between Groups 0.25 1.00 0.25 13.91 .001
Within Groups 0.57 32.00 0.02
Total 0.82 33.00
Q32014 Between Groups 1.17 1.00 1.17 3.54 .069
Within Groups 10.57 32.00 0.33
Total 11.74 33.00
Q22014 Between Groups 0.28 1.00 0.28 16.68 .000
Within Groups 0.53 32.00 0.02
Total 0.81 33.00
Q12014 Between Groups 0.24 1.00 0.24 17.73 .000
Within Groups 0.43 32.00 0.01
Total 0.67 33.00
Q42013 Between Groups 0.22 1.00 0.22 13.21 .001
Within Groups 0.53 32.00 0.02
Total 0.75 33.00
Q32013 Between Groups 0.27 1.00 0.27 12.02 .002
Within Groups 0.72 32.00 0.02
Total 0.99 33.00
Q22013 Between Groups 0.36 1.00 0.36 20.77 .000
Within Groups 0.55 32.00 0.02
Total 0.91 33.00
Q12013 Between Groups 0.31 1.00 0.31 16.31 .000
Within Groups 0.62 32.00 0.02
Total 0.93 33.00
Q42012 Between Groups 0.19 1.00 0.19 8.94 .005
Within Groups 0.68 32.00 0.02
Total 0.87 33.00
Q32012 Between Groups 0.35 1.00 0.35 14.83 .001
Within Groups 0.75 32.00 0.02
Total 1.10 33.00
Q22012 Between Groups 0.51 1.00 0.51 16.11 .000
Within Groups 1.02 32.00 0.03
Total 1.54 33.00
Q12012 Between Groups 0.53 1.00 0.53 24.14 .000
Within Groups 0.71 32.00 0.02
Total 1.24 33.00
Note: The result of One-way ANOVA showed that there were mostly statistical significant
differences in T3 between Internet IPOs and Traditional IPOs (except for Q32014) across 12
quarters from 2012-2014 (E.g.: Q12012: Quarter 1 year 20012).

Research in Business and Management
ISSN 2330-8362
2015, Vol. 2, No. 2
www.macrothink.org/rbm 46
4.3.3 Potential risks of negative Retained Earnings
It is the variable T2: Retained Earnings / Total Asset that created potentially risks for these
Internet Firms compared to Traditional Firms. Another One-way ANOVA was also conducted
to explore statistical significant differences in T2 (Retained Earnings / Total Asset) between
Internet Firms and Traditional Firms across 12 quarters. The independence of observation
was assumed. However, the assumption of normality and homogeneity were not met. As a
result, the One-way ANOVA is robust in Table 8.
Additionally, the mean plot from Figure 4 showed that the new Z-scores of Internet Firms are
lower than Traditional Firms by a considerable amount (see Figure 4). It showed that the
external performance made significant influences on the general performances of Internet Firms.
Table 8. One-way ANOVA for the Variable T2
Sum of Squares df Mean Square F Sig.
Q42014 Between Groups 12.160 1 12.160 21.349 .000 Within Groups 18.226 32 .570
Total 30.386 33
Q32014 Between Groups 10.057 1 10.057 26.585 .000 Within Groups 12.105 32 .378
Total 22.162 33
Q22014 Between Groups 8.038 1 8.038 20.384 .000 Within Groups 12.618 32 .394
Total 20.656 33
Q12014 Between Groups 8.461 1 8.461 20.420 .000 Within Groups 13.260 32 .414
Total 21.721 33
Q42013 Between Groups 8.473 1 8.473 18.168 .000 Within Groups 14.925 32 .466
Total 23.398 33
Q32013 Between Groups 8.626 1 8.626 19.168 .000 Within Groups 14.400 32 .450
Total 23.026 33
Q22013 Between Groups 8.043 1 8.043 20.582 .000 Within Groups 12.505 32 .391
Total 20.548 33
Q12013 Between Groups 8.184 1 8.184 20.615 .000 Within Groups 12.704 32 .397
Total 20.888 33
Q42012 Between Groups 7.924 1 7.924 19.020 .000 Within Groups 13.332 32 .417
Total 21.257 33
Q32012 Between Groups 7.504 1 7.504 19.089 .000 Within Groups 12.578 32 .393
Total 20.082 33
Q22012 Between Groups 7.152 1 7.152 21.669 .000 Within Groups 10.562 32 .330
Total 17.714 33
Q12012 Between Groups 6.521 1 6.521 23.602 .000 Within Groups 8.841 32 .276
Total 15.362 33
Note: The result of One-way ANOVA showed that there was statistical significant differences
in T2 between Internet IPOs and Traditional IPOs across 12 quarters from 2012-2014 (E.g.:
Q12012: Quarter 1 year 20012).
Research in Business and Management
ISSN 2330-8362
2015, Vol. 2, No. 2
www.macrothink.org/rbm 47
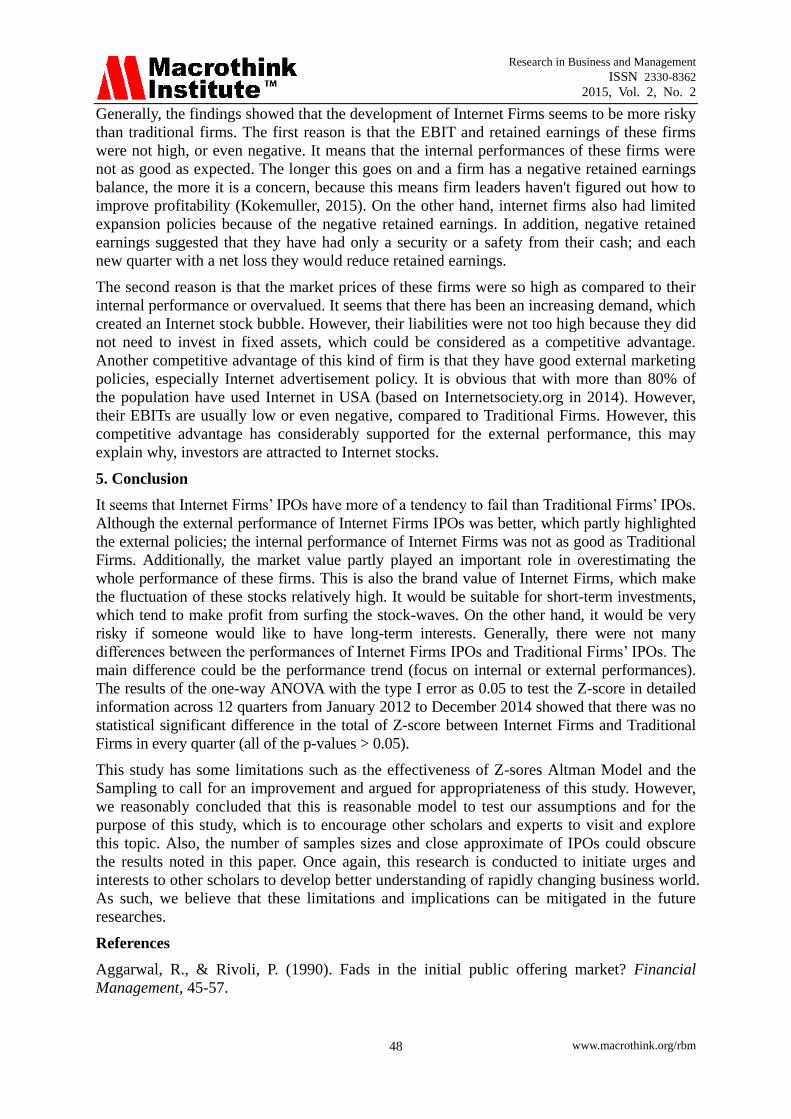
Figure 4: Estimated Marginal Means of T2
4.4 Discussions
The results of this paper indicated that there was no statistical significant difference in the
total Z-score between Internet Firms and Traditional Firms after IPOs. Based on the total
Z-score, Internet Firms tend to outperform than Traditional Firms. However, the performance
fluctuation of Internet Firms seems to be high. This fluctuation indicated a high volatility,
which means high risk. One of the significances in Z-score results is that there is a
considerable influence of the Variable T4, which referred to the external performance. An
extra One-way ANOVA was conducted to explore influences of the internal and external
elements through the new Z-score model without T4. It showed that the internal performance
of Internet Firms were not as good as Traditional Firms; although, there was a statistical
significant difference in the internal performance development trends between two groups of
firms, Internet Firms have an uptrend and Traditional Firms have a downtrend. This may be
an indication that there might be other external influences such as high expectation or hype
meaning that blow the Internet IPO bubble bigger, make them better than what they have.
This can make IPOs attractive to investors who are looking for new opportunities in the
market. This is another topic that could be explored further in the future research.
Some potential risks and concerns about the uptrend of Internet Firms appeared when we
continued to test other Variables. There were statistical significant differences in T2 and T3
between both groups.
Considering T3, there were statistical significant differences in all of the quarters between two
groups except Q32014. Moreover, there was a downtrend of ROA of Internet Firms and the
EBIT of them were not high or even negative (11 out of 17). It indicates that the profitability
of Internet Firms is not as good as Traditional Firms.
For variable T2 consideration, there were statistical significant differences in all of the
quarters between two kinds of firms. There was an uptrend of T2 across 12 quarters; however,
there was a downtrend of Retained Earnings (13 out of 17). It may suggest that they have
some potential risks in internal performances. It also reflected the problems of the internal
performance of Internet Firms.
Research in Business and Management
ISSN 2330-8362
2015, Vol. 2, No. 2
www.macrothink.org/rbm 48
Generally, the findings showed that the development of Internet Firms seems to be more risky
than traditional firms. The first reason is that the EBIT and retained earnings of these firms
were not high, or even negative. It means that the internal performances of these firms were
not as good as expected. The longer this goes on and a firm has a negative retained earnings
balance, the more it is a concern, because this means firm leaders haven't figured out how to
improve profitability (Kokemuller, 2015). On the other hand, internet firms also had limited
expansion policies because of the negative retained earnings. In addition, negative retained
earnings suggested that they have had only a security or a safety from their cash; and each
new quarter with a net loss they would reduce retained earnings.
The second reason is that the market prices of these firms were so high as compared to their
internal performance or overvalued. It seems that there has been an increasing demand, which
created an Internet stock bubble. However, their liabilities were not too high because they did
not need to invest in fixed assets, which could be considered as a competitive advantage.
Another competitive advantage of this kind of firm is that they have good external marketing
policies, especially Internet advertisement policy. It is obvious that with more than 80% of
the population have used Internet in USA (based on Internetsociety.org in 2014). However,
their EBITs are usually low or even negative, compared to Traditional Firms. However, this
competitive advantage has considerably supported for the external performance, this may
explain why, investors are attracted to Internet stocks.
5. Conclusion
It seems that Internet Firms’ IPOs have more of a tendency to fail than Traditional Firms’ IPOs.
Although the external performance of Internet Firms IPOs was better, which partly highlighted
the external policies; the internal performance of Internet Firms was not as good as Traditional
Firms. Additionally, the market value partly played an important role in overestimating the
whole performance of these firms. This is also the brand value of Internet Firms, which make
the fluctuation of these stocks relatively high. It would be suitable for short-term investments,
which tend to make profit from surfing the stock-waves. On the other hand, it would be very
risky if someone would like to have long-term interests. Generally, there were not many
differences between the performances of Internet Firms IPOs and Traditional Firms’ IPOs. The
main difference could be the performance trend (focus on internal or external performances).
The results of the one-way ANOVA with the type I error as 0.05 to test the Z-score in detailed
information across 12 quarters from January 2012 to December 2014 showed that there was no
statistical significant difference in the total of Z-score between Internet Firms and Traditional
Firms in every quarter (all of the p-values > 0.05).
This study has some limitations such as the effectiveness of Z-sores Altman Model and the
Sampling to call for an improvement and argued for appropriateness of this study. However,
we reasonably concluded that this is reasonable model to test our assumptions and for the
purpose of this study, which is to encourage other scholars and experts to visit and explore
this topic. Also, the number of samples sizes and close approximate of IPOs could obscure
the results noted in this paper. Once again, this research is conducted to initiate urges and
interests to other scholars to develop better understanding of rapidly changing business world.
As such, we believe that these limitations and implications can be mitigated in the future
researches.
References
Aggarwal, R., & Rivoli, P. (1990). Fads in the initial public offering market? Financial
Management, 45-57.
Research in Business and Management
ISSN 2330-8362
2015, Vol. 2, No. 2
www.macrothink.org/rbm 49
Altman, E. I. (1968). Financial ratios, discriminant analysis and the prediction of corporate
bankruptcy. The Journal of Finance, 23(4), 589-609.
Altman, E. I. (1968). Financial ratios, discriminant analysis and the prediction of corporate
bankruptcy. The Journal of Finance, 23(4), 589-609.
Altman, E. I. (2000). Predicting financial distress of firms: revisiting the Z-score and ZETA
models. Stern School of Business, New York University, 9-12.
Altman, E. I. (2002). Revisiting credit scoring models in a Basel 2 environment. Cedit Rating:
Methodologies Rationale and Default Risk. London Risk Book
Álvarez, S., & Gonzalez, V. M. (2005). Signaling and the Long‐run Performance of Spanish
Initial Public Offerings (IPOs). Journal of Business Finance & Accounting, 32(1‐2),
325-350.
Bartov, E., Mohanram, P., & Seethamraju, C. (2002). Valuation of Internet stocks—an IPO
perspective. Journal of Accounting Research, 40(2), 321-346.
Bhattacharya, N., Demers, E., & Joos, P. (2010). The relevance of accounting information in
a stock market bubble: evidence from Internet IPOs. Journal of Business Finance &
Accounting, 37(3‐4), 291-321.
Botman, M., Roosenboom, P. G. J., & van der Goot, L. R. T. (2004). Valuing Internet stocks
at the initial public offering. The Rise and Fall of Europe's New Stock Markets, 11, 131.
Botman, M., van der Goot, T., & van Giersbergen, N. P. (2004). What determines the survival
of Internet IPOs? Amsterdam School of Economics Research Institute (ASE-RI)
Carter, R. B., Dark, F. H., & Singh, A. K. (1998). Underwriter reputation, initial returns, and
the long‐run performance of IPO stocks. The Journal of Finance, 53(1), 285-311.
Chen, A., Chen, R. C., & Pan, K. L. (2002). The performance of initial public offerings
conditioning on issue information: The case of Taiwan. Asia Pacific Management Review,
7(2), 167-190.
Chen, G., Firth, M., & Kim, J. B. (2000). The post-issue market performance of initial public
offerings in China's new stock markets. Review of Quantitative Finance and Accounting,
14(4), 319-339.
Choi, S. D., & Nam, S. K. (1998). The short-run performance of IPOs of privately-and
publicly-owned firms: international evidence. Multinational Finance Journal, 2(3), 225-244.
Demers, E., & Joos, P. (2007). IPO failure risk. Journal of Accounting Research, 45(2),
333-371.
Ehrhardt, O., & Nowak, E. (2001). Private benefits and minority shareholder expropriation:
empirical evidence from IPOs of German family-owned firms (No. 2001/10). CFS Working
Paper.
Gannon G. (2011). Picking Net-Nets: Why Retained Earnings Matter. Retrieved from:
http://www.gurufocus.com/news/136426/picking-netnets-why-retained-earnings-matter
Gasbarro, D., Bundoo, S., & Zumwalt, J. K. (2003). Underpricing and aftermarket
performance of IPO firms in Mauritius. Journal of Emerging Market Finance, 2(3), 315-335.
Goldman, M. B., & Sosin, H. B. (1979). Information dissemination, market efficiency and the
frequency of transactions. Journal of Financial Economics, 7(1), 29-61.

Research in Business and Management
ISSN 2330-8362
2015, Vol. 2, No. 2
www.macrothink.org/rbm 50
Hand, J. R. (2000). Profits, losses and the non-linear pricing of Internet stocks. Available at
SSRN 204875.
Hanley, K. W. (1993). The underpricing of initial public offerings and the partial adjustment
phenomenon. Journal of financial economics, 34(2), 231-250.
Intania, R., & Nugroho, A. B. (2014). Correlation between Bankruptcy Score and Market
Performance: Developing Altman’s Z-Score Model. Paper presented at 7th Asia-Pacific
Business Research Conference, Bayview, Singapore.
Jaskiewicz, P., González, V. M., Menéndez, S., & Schiereck, D. (2005). Long‐run IPO
performance analysis of German and Spanish family‐owned businesses. Family Business
Review, 18(3), 179-202.
Jelic, R., Saadouni, B., & Briston, R. (2001). Performance of Malaysian IPOs: Underwriters
reputation and management earnings forecasts. Pacific-Basin Finance Journal, 9(5),
457-486.
Jim Barbagallo. 2014. IPO Communications: Challenges and Opportunities. Retrieved from:
http://pilotcommsgroup.com/2014/06/10/ipo-communications-challenges-opportunities.
Kooli, M., & Suret, J. M. (2004). The aftermarket performance of initial public offerings in
Canada. Journal of Multinational Financial Management, 14(1), 47-66.
Krishnan, C. N. V., Ivanov, V. I., Masulis, R. W., & Singh, A. K. (2011). Venture capital
reputation, post-IPO performance, and corporate governance. Journal of Financial and
Quantitative Analysis, 46(05), 1295-1333.
Lyn, E. O., & Zychowicz, E. J. (2003). The performance of new equity offerings in Hungary
and Poland. Global Finance Journal, 14(2), 181-195.
Mazzola, P., & Marchisio, G. (2002). The Role of Going Public in Family Businesses' Long‐Lasting Growth: A Study of Italian IPOs. Family Business Review, 15(2), 133-148.
Michael Kende. (2014). Global Internet Report. Retrieved from:
http://www.Internetsociety.org/sites/default/files/Global_Internet_Report_2014_0.pdf
Neil Kokemuller. (2015). The Impact of Negative Retained Earnings. Retrieved from:
http://smallbusiness.chron.com/impact-negative-retained-earnings-60298.html
Peter Fuhrman. (2012). Too Few IPOs Rather Than Too Many -- The Coming Crisis In China
Investing. Retrieved from:
http://seekingalpha.com/instablog/445816-peter-fuhrman/338951-too-few-ipos-rather-than-to
o-many-the-coming-crisis-in-china-investing
Rajan, R. (2008). Bankers’ pay is deeply flawed. Financial Times, 9.
Ritter, J. R. (1991). The long‐run performance of initial public offerings. The journal of
finance, 46(1), 3-27.
Schultz, P., & Zaman, M. (2001). Do the individuals closest to Internet Firms believe they are
overvalued? Journal of Financial Economics, 59(3), 347-381.
Sham G. (2011). How An IPO Is Valued. Retrieved from: http://www.investopedia.com/
articles/financial-theory/11/how-an-ipo-is-valued.asp
Steve Schaefer. (2010). The IPO Class of 2011. Retrieved from: http://www.forbes.com/2010/
12/21/ipo-class-2011-markets-equities-groupon-linkedin-hca.html

Research in Business and Management
ISSN 2330-8362
2015, Vol. 2, No. 2
www.macrothink.org/rbm 51
Stock Market Secular Trend Review. (2012). Retrieved from: http://www.prometheusmi.
com/2012/10/27/stock-market-secular-trend-review-4/
Trueman, B., Wong, M. F., & Zhang, X. J. (2000). The eyeballs have it: Searching for the
value in Internet stocks. Journal of Accounting Research, 137-162.
Van Frederikslust, R. A., & van der Geest, R. A. (2001). Initial returns and long-run
performance of private equity-backed initial public offerings on the Amsterdam Stock
Exchange. Rotterdam School of Management.
Vance, D. E., & Mascarenhas, B. (2014). Are there Simple Indicators as to Which IPOs
Outperform the Market over the Long Term? British Journal of Economics, Management &
Trade, 4(2), 183-196.
Weber, J., & Willenborg, M. (2003). Do expert informational intermediaries add value?
Evidence from auditors in microcap initial public offerings. Journal of Accounting Research,
41(4), 681-720.
Copyright Disclaimer
Copyright reserved by the author(s).
This article is an open-access article distributed under the terms and conditions of the
Creative Commons Attribution license (http://creativecommons.org/licenses/by/3.0/).