initial assessment of protected areas in … · strengthening national capacity in nature...
TRANSCRIPT
STRENGTHENING NATIONAL CAPACITY IN NATURE PROTECTION – PREPARATION FOR NATURA 2000 NETWORK
INITIAL ASSESSMENT OF PROTECTED AREAS IN ALBANIA USING THE MANAGEMENT EFFECTIVENESS
TRACKING TOOL
Prepared by:
Oliver Avramoski, Project Officer, Protected Areas, IUCN ECARO Boris Erg, Director, IUCN ECARO Tomasz Pezold, Programme Officer, Protected Areas, IUCN ECARO
JUNE 2016
Initial assessment of protected areas in Albania
i
Contents Executive summary ................................................................................................................................. 1
1. Introduction .................................................................................................................................... 3
1.1. Objectives and scope of the assessment ................................................................................ 5
1.2. Approach and methodology ................................................................................................... 5
2. Analysis of the results ..................................................................................................................... 8
2.1. Protected areas threats .......................................................................................................... 8
2.1.1. Residential and commercial development ................................................................... 11
2.1.2. Agriculture and aquaculture ......................................................................................... 12
2.1.3. Energy production and mining ...................................................................................... 13
2.1.4. Transportation and service corridors ............................................................................ 14
2.1.5. Biological resource use and harm ................................................................................. 15
2.1.6. Human intrusions and disturbance ............................................................................... 16
2.1.7. Natural system modification ......................................................................................... 17
2.1.8. Invasive and other problematic species and genes ...................................................... 18
2.1.9. Pollution entering or generated within protected area ............................................... 19
2.1.10. Geological events .......................................................................................................... 20
2.1.11. Climate change and severe weather ............................................................................. 21
2.1.12. Specific cultural and social threats ............................................................................... 21
2.2. Analysis of Assessment Form results .................................................................................... 23
2.2.1. Context .......................................................................................................................... 27
2.2.2. Planning ......................................................................................................................... 27
2.2.3. Inputs ............................................................................................................................ 28
2.2.4. Process .......................................................................................................................... 29
2.2.5. Outputs ......................................................................................................................... 30
2.2.6. Outcomes ...................................................................................................................... 30
3. Conclusions and recommendations .............................................................................................. 32
References ............................................................................................................................................ 34
Annexes ................................................................................................................................................. 35
Initial assessment of protected areas in Albania
ii
List of tables Table 1 Overview of protected areas in Albania by management category ........................................ 3 Table 2 Grouping of the questions in the assessment form in the six IUCN PAME Framework
elements and the maximum number of points that can be assigned to each element ......... 7 Table 3 Quantification of the level of significance of the generic threats presented in Data Sheet 2
of the METT ............................................................................................................................. 8
Initial assessment of protected areas in Albania
iii
List of figures
Figure 2 IUCN Framework for Evaluating Protected Area Management Effectiveness ..................... 6 Figure 3 Ranking of the threats by the total number of points assigned in the assessment of 54
protected areas ..................................................................................................................... 9 Figure 4 Ranking of the threats expressed as % of protected areas in which they have been
identified as a high-level threat (n=54) ............................................................................... 10 Figure 5 Distribution of high-level threats from Logging and wood harvesting (code 5.3) among the
management categories of protected areas ...................................................................... 10 Figure 6 Distribution of high-level threats from Fire and fire suppression (code 7.1) among the
management categories of protected areas ...................................................................... 10 Figure 7 Ranking of threats expressed as % of protected areas in which they have been identified
as a medium-level threat (n=54) ......................................................................................... 11 Figure 8 Ranking of threats expressed as % of protected areas in which they have been identified
as a low-level threat (n=54) ................................................................................................ 11 Figure 9 Significance of the threats in the category “Residential and commercial development
within a protected area” (a % of the total number of protected areas) ............................ 12 Figure 10 Significance of the threats in the category “Agriculture and aquaculture within a
protected area” (a % of the total number of protected areas) .......................................... 13 Figure 11 Significance of the threats in the category “Energy production and mining within a
protected area” (a % of the total number of protected areas) .......................................... 14 Figure 12 Significance of the threats in the category “Transportation and service corridors within a
protected area” (a % of the total number of protected areas) .......................................... 15 Figure 13 Significance of the threats in the category “Biological resource use and harm within a
protected area” (a % of the total number of protected areas) .......................................... 16 Figure 14 Significance of the threats in the category “Human intrusions and disturbance within a
protected area” (a % of the total number of protected areas) .......................................... 17 Figure 15 Significance of the threats in the category “Natural system modification” (a % of the total
number of protected areas) ................................................................................................ 18 Figure 16 Significance of the threats in the category “Invasive and other problematic species and
genes” (a % of the total number of protected areas) ......................................................... 19 Figure 17 Significance of the threats in the category “Pollution entering or generated within
protected area” (a % of the total number of protected areas) .......................................... 20 Figure 18 Significance of the threats in the category “Geological events” (a % of the total number of
protected areas) .................................................................................................................. 21 Figure 19 Significance of the threats in the category “Climate change and severe weather” (% of the
total number of protected areas) ....................................................................................... 22 Figure 20 Significance of the second-level threat categories of “Specific cultural and social threats”
(% of the total number of protected areas) ........................................................................ 22 Figure 21 Number of scores per question (% of the maximum scores) ............................................. 25 Figure 22 Distribution of scores per IUCN PAME Framework element (% of the maximum scores) . 25 Figure 23 Distribution of scores per IUCN PAME Framework element disaggregated by management
category (% of the maximum scores) ................................................................................. 26 Figure 24 Distribution of scores per IUCN PAME Framework element disaggregated by region (% of
the maximum scores).......................................................................................................... 26
Initial assessment of protected areas in Albania
iv
Figure 25 Effectiveness categories of “Context” ................................................................................ 27 Figure 26 Effectiveness categories of “Planning” ............................................................................... 27 Figure 27 Scores assigned to the questions on “Planning” (% of the maximum scores) ................... 27 Figure 28 Effectiveness categories of “Inputs” ................................................................................... 28 Figure 29 Scores assigned to the questions on “Inputs” (% of the maximum scores) ....................... 28 Figure 30 Effectiveness categories of “Process” ................................................................................. 29 Figure 31 Scores assigned to the questions on “Process” (% of the maximum scores) ..................... 29 Figure 32 Distribution of scores on “Outputs” ................................................................................... 30 Figure 33 Distribution of scores on “Outcomes” ................................................................................ 30 Figure 34 Scores assigned to the questions on “Outcomes” ............................................................. 30

Initial assessment of protected areas in Albania
v
Acronyms and Abbreviations
European Commission EC IUCN Regional Office for Eastern Europe and Central Asia IUCN ECARO Monument of Nature MN IUCN World Commission on Protected Areas IUCN WCPA Managed Nature Reserve MNR Management Effectiveness Tracking Tool METT Ministry of Environment of Albania MoE National Agency for Protected Areas NAPA National Park NP National Environment Agency NEA Protected Area Management Effectiveness Framework PAME Framework Protected Landscape PL Rapid Assessment and Prioritization of Protected Area Management RAPPAM Regional Administration for Protected Areas RAPA Resource Protection Area RPA Strict Nature Reserve SNR World Commission on Protected Areas of IUCN WCPA
Initial assessment of protected areas in Albania
vi
Acknowledgements This report was produced by the IUCN Regional Office for Eastern Europe and Central Asia, with input from Genti Kromidha, a Deputy Team Leader for the project “Strengthening national capacity in nature protection – preparation for Natura 2000 network.”
This report would not have been possible without the active participation from all the participants of the workshops organized within the project - their contribution was invaluable:
Abdul Cucaj, Chief of Management Section, RAPA Vlore Abdulla Hasanaj, Chief of Management Section, RAPA Durres Agim Dardha, Director, RAPA Shkoder Anila Sina, Chief of Management Section, RAPA Berat Ardian Koci, Director, RAPA Fier Ardiana Petri, Director of Management, Monitoring and Projects, NAPA Bajram Kullolli, Chief of Management Section, RAPA Elbasan Bekim Qosja, Director, RAPA Diber Besnik Hallaci, Director, RAPA, Kukës Blerant Lushaj, Management Expert, RAPA Kukës Edmond Krisafi, Chief of Management Section, RAPA Gjirokaster Eglantina Carapuli, expert, NAPA Enea Zenuni, Chief of Management Section, RAPA Fier Ervin Jaupaj, Chief of Management Section, RAPA Tirana Fatmir Brazhda, Director, RAPA Elbasan Fatos Nako, Director, RAPA Berat Gligor Dushi, Director, RAPA Gjirokaster Lorela Lazaj, Director, RAPA Vlore Mihallaq Qirjo, Director, RAPA Korça Naim Herri, Director, RAPA Durres Pjeter Toni, Director, RAPA Lezhë Shkelqim Hasa, Chief of Management Section, RAPA Diber Sulejman Xhepa, Chief of Management Section, NAPA Tonin Macaj, Management Expert, RAPA Shkoder Tonin Ndreka, Management Expert, RAPA Lezhë Vasil Male, Chief of Management Section, RAPA Korça Violeta Zuna, National Project Manager/Team Leader for UNDP Albania's Biodiversity Conservation and MPAs Programme Zamir Dedej, General Director, NAPA

Initial assessment of protected areas in Albania
1
Executive summary
This report has been prepared under the EU funded project “Strengthening national capacity in nature protection – preparation for Natura 2000 network.” The overall objective of the Project is to halt biodiversity loss through improved management of protected areas in Albania. Albania has made significant progress in expanding the network of protected areas from 5.2% of the country’s territory in 2005 to 16% in 2014. The main objective of this report is to assess the current state of protected areas constituting the Protected Areas Network in Albania with respect to technical aspects, institutional setup, legal gaps, human resources and equipment in view of the recent development in protected areas management in Albania. The assessment is based on data gathered using the Management Effectiveness Tracking Tool (METT). The findings presented here are intended to provide supporting information for the detailed planning of project activities as well as to support NAPA in improving management effectiveness of protected areas.
The latest edition of the map of the Albanian Protected Areas Network published by the Ministry of Environment represents 56 protected areas in six national categories. The National Agency for Protected Areas is the responsible institution for management of protected areas in Albania and the day-to-day management of protected areas is delegated to 12 Regional Administrations for Protected Areas as part of NAPA. In cooperation with NAPA, protected area managers from the 12 RAPA offices participated in a two-day workshop to assess protected areas they manage using the METT. More METT assessments were completed in the aftermath of the workshop with the total number of protected areas assessed reaching 51.
The results of the assessment show that wildfires are the most common threat to protected areas in Albania, whereas logging and wood harvesting is the most serious threat that causes degradation of their natural values in protected areas. In general, the threats related to the use of biological resources in protected areas are present in the vast majority of the protected areas in Albania. The data collected through the Assessment Forms reveal that the highest percentage of poor effectiveness is observed with respect to collection of fees (86.3%), availability of budget (80.4%), security of budget (74.5%), management of budget (78.4%), availability of equipment (68.6%) and maintenance of equipment (62.7%). The highest percentage of excellent scores was reported on the legal status of protected areas (100%) and condition of values (41.2%).
The analysis of the average scores by the IUCN PAME Framework elements clearly shows that the poor scores prevail in all of the six elements, except for the Context. If disaggregated by management category, these results show that national parks received better average scores than other protected areas categories on all of the six IUCN PAME Framework elements. This may be due to the fact that this category has received significant attention by both national authorities and international donors thus far: half of the existing management plans have been developed for the national parks in the country. The scoring of Assessment Form questions done by protected areas’ managers seem to show significant differences in the approach. Therefore, it is to a certain extent difficult to draw conclusions across the 51 protected areas assessed under this project. Nonetheless, there are trends that can be observed across the sample. For instance, results showed that the vast majority of the protected areas received less than 50% of the maximum possible scores on Planning (84.3% of the sites), Input (88.2% of the sites), Process (92.2% of the sites), and Output
Initial assessment of protected areas in Albania
2
(86.3% of the sites). Despite the poor results on these important elements, assessors’ evaluation of Outcomes is somewhat better and only 57.3% of the protect areas received less than 50% of the maximum possible scores on this element.
Assessors made several recommendations for improvement of the legal framework and also stressed the need to strengthen the enforcement of the existing regulations. Their comments in the Assessment forms clearly indicate that the insufficient level of knowledge and skills, as well as the lack of basic infrastructure and equipment are the major impediments to improving the management effectiveness of the protected areas in Albania. While the lack of financial resources is linked to many such impediments, the income generated by some protected areas (e.g. from entrance fees, permits for the use of resources, etc.) is being collected by the government without any repayment to the protected areas which generate the income.
The analysis in this report shows that the comparison between protected areas is difficult when the assessment is conducted by different people. This is related to the fact that the METT is a qualitative assessment methodology based on ‘expert judgement’ which is prone to errors and cognitive biases. This seems to be the case in particular with respect to the assessment of threats to the protected areas assessed under the project, despite the effort of the project team to promote the use of quantitative data. Therefore the results presented in this report need to be interpreted with caution, especially with respect to the comparison of the overall scores for the sites.

Initial assessment of protected areas in Albania
3
1. Introduction
There are 799 protected areas in Albania covering about 16% (4,600 km²) of its territory (see Table 1). The vast majority of protected areas in Albania have been designated in the category nature monument (750) and are mostly quite small in size. The category national park contributes most significantly in terms of coverage (46.1%), whereas the marine protected areas are largely underrepresented and currently account only for 2.9% (13,261 ha) of the surface of the national protected area system. A map of the Protected Areas Network produced by the Ministry of Environment (MoE 2014) represents only 56 protected areas in all of the six national management categories (see Figure 1); detailed information on these protected areas is presented in Annex I.
Table 1 Overview of protected areas in Albania by national management category
No. National protected area category
Protected areas (#) Area (ha) % of country’s
territory I Strict Nature Reserve 2 4,800 0,17 II National Park 15 210,501.4 7,32 III Nature Monument 750 3,610.74 0,13 IV Nature Managed Reserve 23 127,309.48 4,43 V Protected Landscape 5 99,501.3 3,46 VI Multiple Use Area 4 11,115 0,39
Total 799 456.837,92 15,89
Since February 2015, the newly established National Agency for Protected Areas is the responsible institution for the management of protected areas in Albania. Its main objectives are as follows:
- Protect, conserve, and develop natural resources and biodiversity through the management of a network of protected areas of national and international importance;
- Gather and disseminate information related to protected areas;
- Promote environmental education and public awareness for the protected areas in Albania; and
- Support sustainable economic activities inside the protected areas.
The Agency has a Directorate General, based in Tirana, and 12 Regional Administrations for Protected Areas. The Directorate General has two units: Management Directorate and Directorate for Financing and Services. The Management Directorate has three sub-units: Management Section, Control Section and Project Unit. Each RAPA is headed by a Regional Director and has two sections: Management and Administration Section and Monitoring Section. Currently there are 20 employees at NAPA, whereas the 12 RAPA have 204 employees, 108 of whom are rangers.

Initial assessment of protected areas in Albania
4
Figure 1 Protected Areas in Albania
(Source: Ministry of Environment, 2014)

Initial assessment of protected areas in Albania
5
1.1. Objectives and scope of the assessment
This report has been prepared by the IUCN Regional Office for Eastern Europe and Central Asia (IUCN ECARO) under the project “Strengthening national capacity in nature protection – preparation for Natura 2000 network,” financed by the European Union. The overall objective of the Project is to halt biodiversity loss through improved management of protected areas in Albania. Two specific objectives have been identified for the attainment of the overall objective:
– Implementation of at least five existing management plans for selected protected areas in Albania;
– Preparation of a preliminary list of Natura 2000 sites for the country in view of their future submission to the EC by the Albanian authorities.
The initial assessment of protected areas in Albania is one of the two activities related to the “Assessment of the state of protected areas and the national protected area system” and is based on data gathered using the Management Effectiveness Tracking Tool (METT). The main objective of this analysis is to assess the current state of all protected areas in Albania with respect to technical aspects, institutional setup, legal gaps, human resources and equipment.
In consultation with NAPA, the scope of the assessment was limited to 53 of the 56 protected areas presented on the map of the Protected Areas Network published by the Albanian Ministry of Environment in 2014.
1.2. Approach and methodology
This study follows the IUCN Framework for Evaluating Protected Area Management Effectiveness (IUCN PAME Framework). It was developed by the IUCN World Commission on Protected Areas and was presented in the sixth publication of the Best Practice Protected Area Guidelines Series – one of the six flagship knowledge products of IUCN (Hockings et al. 2000, Hockings et al. 2006). The IUCN PAME Framework has been used to design a number of methodologies, some of which are rapid, questionnaire-based assessments (RAPPAM1, METT) to more extensive assessments based on field monitoring.
The IUCN PAME Framework is based on the principle that good protected area management should follow a cyclical process with six stages or elements, as shown in Figure 2. The cycle begins with understanding the context of the protected area, including its values, the threats that it faces and opportunities available, its stakeholders, and the management and political environment. It progresses through planning: establishing a vision, goals, objectives and strategies to conserve values and reduce threats. In the third phase, inputs are allocated (staff, money and equipment) to work towards the objectives. The implementation stage is managed according to accepted processes and eventually produces outputs (goods and services), usually set out in the management plan. The assessment of outcomes is a critical component of the IUCN PAME Framework and includes impacts on biodiversity, society and economy. Outcomes concern the achievement of the
1 RAPPAM stands for Rapid Assessment and Prioritization of Protected Area Management (Ervin, 2003)

Initial assessment of protected areas in Albania
6
long-term objectives for a protected area, such as maintaining stable populations of target species or preservation of cultural values.
Figure 1 IUCN Framework for Evaluating Protected Area Management Effectiveness
The assessment was conducted using the Management Effectiveness Tracking Tool (METT) developed by WWF and the World Bank (Stolton et al. 2007). The METT is a rapid qualitative assessment tool based on a scorecard questionnaire. The scorecard includes all six elements of the IUCN PAME Framework, but places an emphasis on context, planning, inputs and process.
The METT has two main sections: datasheets and an assessment form. The datasheets comprise two separate sections: Data sheet 1 records details of the assessment and some basic information about the site, such as name, size and location etc.; Data sheet 2 provides a generic list of threats which protected areas can face. To help the assessors make an objective assessment, the project team provided a supplementary table with a list of the types of data and units which may be useful in the assessment of most of the 52 generic threats (see the tables in Annex II).
The assessment form comprises 30 questions presented in a table with three columns: score, comments/explanations and next steps. The assessment is made by assigning a simple score ranging between 0 (poor) to 3 (excellent) to each question, thus linking each of the scores to one of four possible choices available to the assessors. Four of the questions are supplemented by a set of three additional statements that give the opportunity to score more points. An overview of the questions and their association with the six IUCN PAME Framework elements and the maximum number of points that can be assigned to the elements is given in Table 2.
The METT provides a mechanism for monitoring progress towards more effective management over time in sites that will not afford to develop a more detailed monitoring
Initial assessment of protected areas in Albania
7
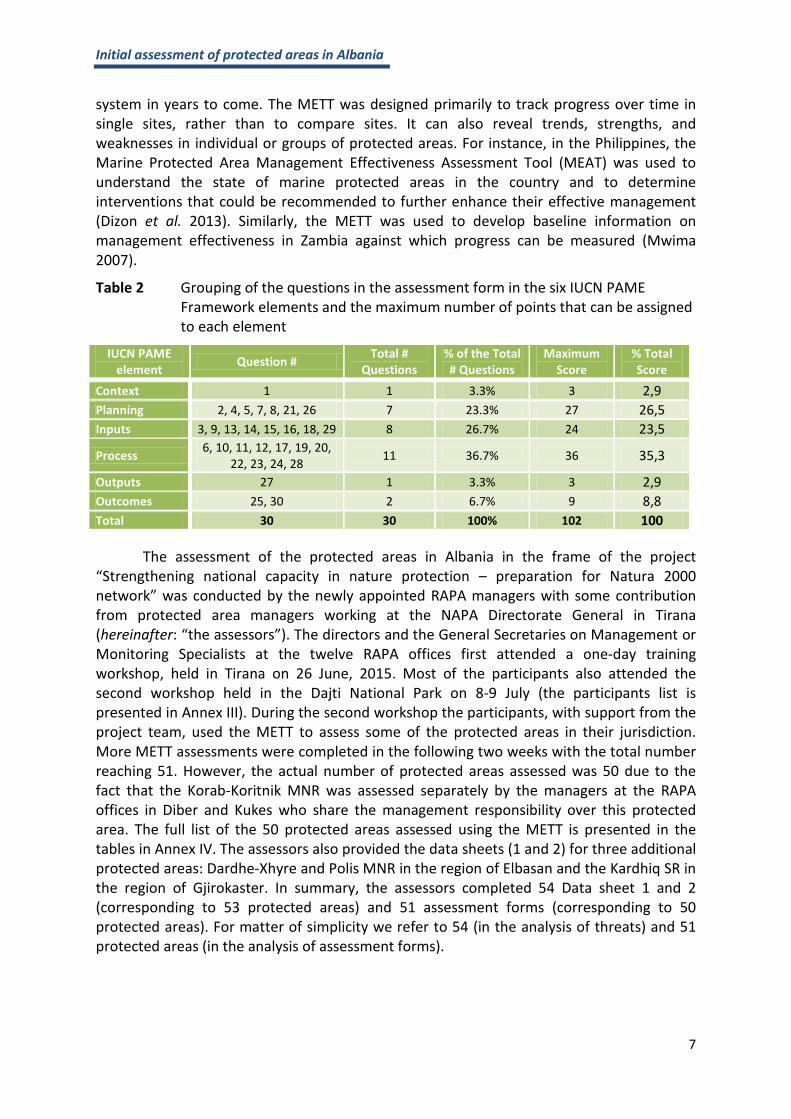
system in years to come. The METT was designed primarily to track progress over time in single sites, rather than to compare sites. It can also reveal trends, strengths, and weaknesses in individual or groups of protected areas. For instance, in the Philippines, the Marine Protected Area Management Effectiveness Assessment Tool (MEAT) was used to understand the state of marine protected areas in the country and to determine interventions that could be recommended to further enhance their effective management (Dizon et al. 2013). Similarly, the METT was used to develop baseline information on management effectiveness in Zambia against which progress can be measured (Mwima 2007).
Table 2 Grouping of the questions in the assessment form in the six IUCN PAME Framework elements and the maximum number of points that can be assigned to each element
IUCN PAME element Question # Total #
Questions % of the Total # Questions
Maximum Score
% Total Score
Context 1 1 3.3% 3 2,9 Planning 2, 4, 5, 7, 8, 21, 26 7 23.3% 27 26,5 Inputs 3, 9, 13, 14, 15, 16, 18, 29 8 26.7% 24 23,5
Process 6, 10, 11, 12, 17, 19, 20, 22, 23, 24, 28 11 36.7% 36 35,3
Outputs 27 1 3.3% 3 2,9 Outcomes 25, 30 2 6.7% 9 8,8 Total 30 30 100% 102 100
The assessment of the protected areas in Albania in the frame of the project “Strengthening national capacity in nature protection – preparation for Natura 2000 network” was conducted by the newly appointed RAPA managers with some contribution from protected area managers working at the NAPA Directorate General in Tirana (hereinafter: “the assessors”). The directors and the General Secretaries on Management or Monitoring Specialists at the twelve RAPA offices first attended a one-day training workshop, held in Tirana on 26 June, 2015. Most of the participants also attended the second workshop held in the Dajti National Park on 8-9 July (the participants list is presented in Annex III). During the second workshop the participants, with support from the project team, used the METT to assess some of the protected areas in their jurisdiction. More METT assessments were completed in the following two weeks with the total number reaching 51. However, the actual number of protected areas assessed was 50 due to the fact that the Korab-Koritnik MNR was assessed separately by the managers at the RAPA offices in Diber and Kukes who share the management responsibility over this protected area. The full list of the 50 protected areas assessed using the METT is presented in the tables in Annex IV. The assessors also provided the data sheets (1 and 2) for three additional protected areas: Dardhe-Xhyre and Polis MNR in the region of Elbasan and the Kardhiq SR in the region of Gjirokaster. In summary, the assessors completed 54 Data sheet 1 and 2 (corresponding to 53 protected areas) and 51 assessment forms (corresponding to 50 protected areas). For matter of simplicity we refer to 54 (in the analysis of threats) and 51 protected areas (in the analysis of assessment forms).
Initial assessment of protected areas in Albania
8
2. Analysis of the results
2.1. Protected areas threats
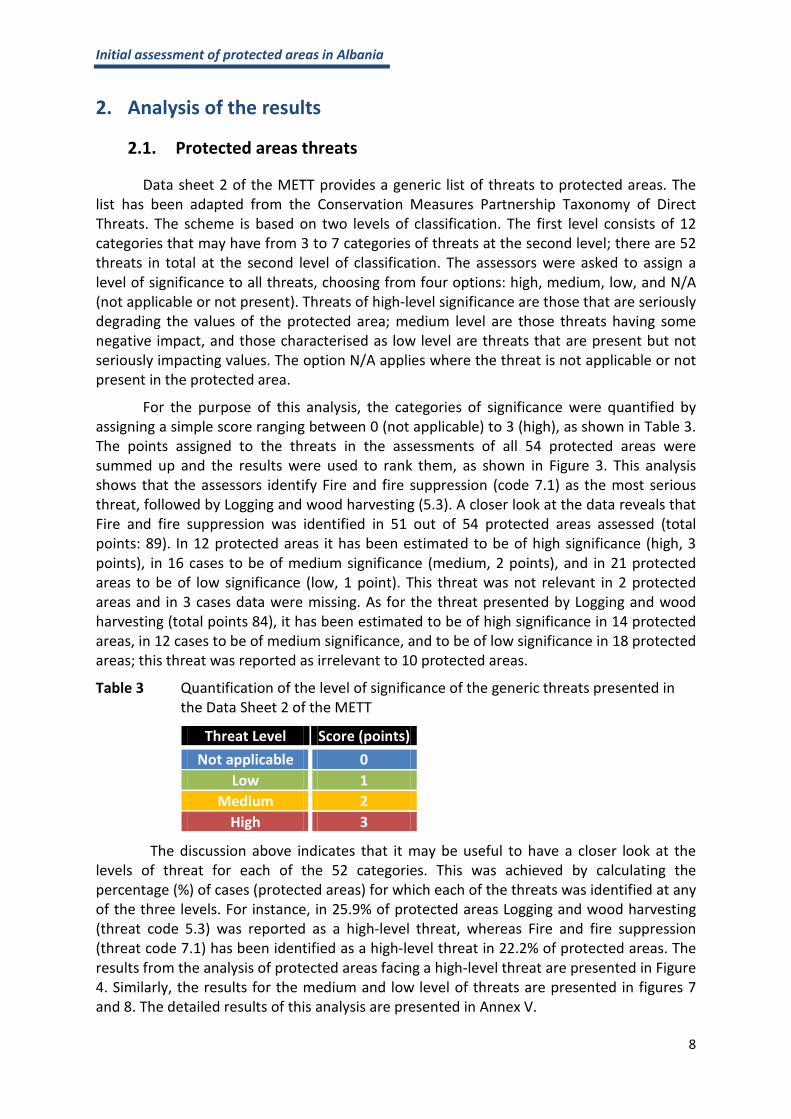
Data sheet 2 of the METT provides a generic list of threats to protected areas. The list has been adapted from the Conservation Measures Partnership Taxonomy of Direct Threats. The scheme is based on two levels of classification. The first level consists of 12 categories that may have from 3 to 7 categories of threats at the second level; there are 52 threats in total at the second level of classification. The assessors were asked to assign a level of significance to all threats, choosing from four options: high, medium, low, and N/A (not applicable or not present). Threats of high-level significance are those that are seriously degrading the values of the protected area; medium level are those threats having some negative impact, and those characterised as low level are threats that are present but not seriously impacting values. The option N/A applies where the threat is not applicable or not present in the protected area.
For the purpose of this analysis, the categories of significance were quantified by assigning a simple score ranging between 0 (not applicable) to 3 (high), as shown in Table 3. The points assigned to the threats in the assessments of all 54 protected areas were summed up and the results were used to rank them, as shown in Figure 3. This analysis shows that the assessors identify Fire and fire suppression (code 7.1) as the most serious threat, followed by Logging and wood harvesting (5.3). A closer look at the data reveals that Fire and fire suppression was identified in 51 out of 54 protected areas assessed (total points: 89). In 12 protected areas it has been estimated to be of high significance (high, 3 points), in 16 cases to be of medium significance (medium, 2 points), and in 21 protected areas to be of low significance (low, 1 point). This threat was not relevant in 2 protected areas and in 3 cases data were missing. As for the threat presented by Logging and wood harvesting (total points 84), it has been estimated to be of high significance in 14 protected areas, in 12 cases to be of medium significance, and to be of low significance in 18 protected areas; this threat was reported as irrelevant to 10 protected areas.
Table 3 Quantification of the level of significance of the generic threats presented in the Data Sheet 2 of the METT
Threat Level Score (points) Not applicable 0
Low 1 Medium 2
High 3
The discussion above indicates that it may be useful to have a closer look at the levels of threat for each of the 52 categories. This was achieved by calculating the percentage (%) of cases (protected areas) for which each of the threats was identified at any of the three levels. For instance, in 25.9% of protected areas Logging and wood harvesting (threat code 5.3) was reported as a high-level threat, whereas Fire and fire suppression (threat code 7.1) has been identified as a high-level threat in 22.2% of protected areas. The results from the analysis of protected areas facing a high-level threat are presented in Figure 4. Similarly, the results for the medium and low level of threats are presented in figures 7 and 8. The detailed results of this analysis are presented in Annex V.

Initial assessment of protected areas in Albania
9
Figure 2 Ranking of the threats by the total number of points assigned in the assessment of 54 protected areas
Initial assessment of protected areas in Albania
10
Figure 3 Ranking of the threats expressed as % of protected areas in which they have
been identified as a high-level threat (n=54)
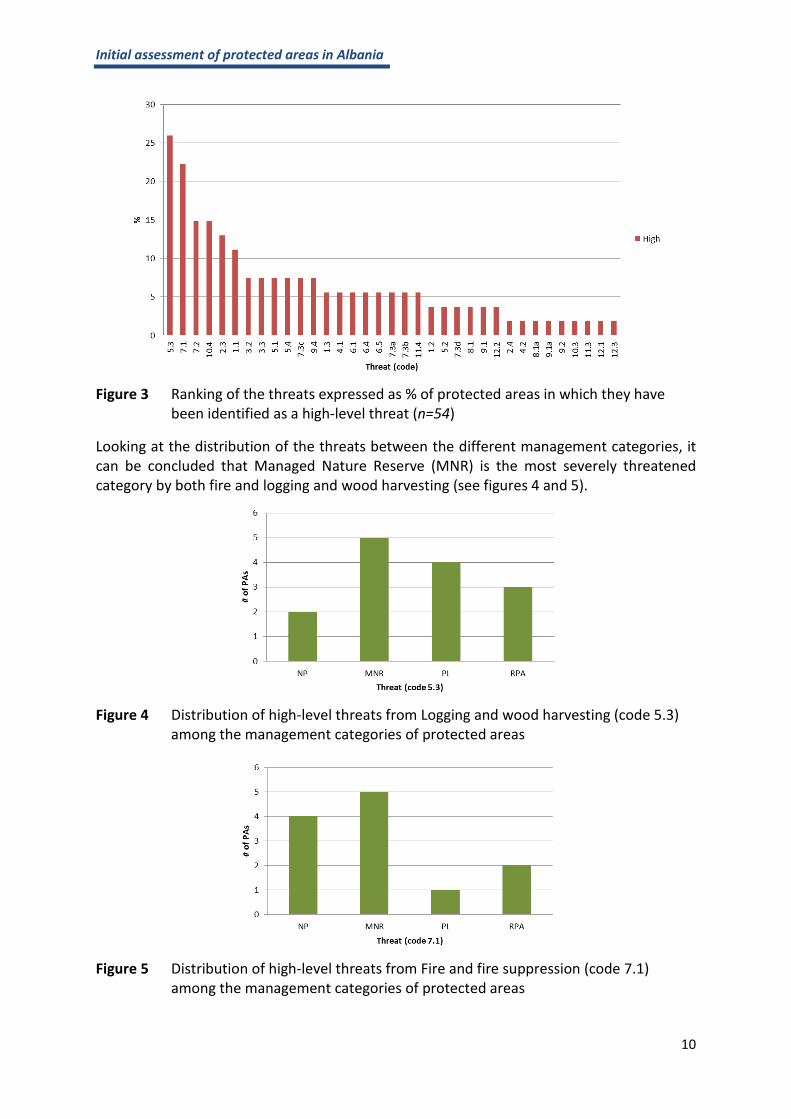
Looking at the distribution of the threats between the different management categories, it can be concluded that Managed Nature Reserve (MNR) is the most severely threatened category by both fire and logging and wood harvesting (see figures 4 and 5).
Figure 4 Distribution of high-level threats from Logging and wood harvesting (code 5.3)
among the management categories of protected areas
Figure 5 Distribution of high-level threats from Fire and fire suppression (code 7.1)
among the management categories of protected areas
Initial assessment of protected areas in Albania
11
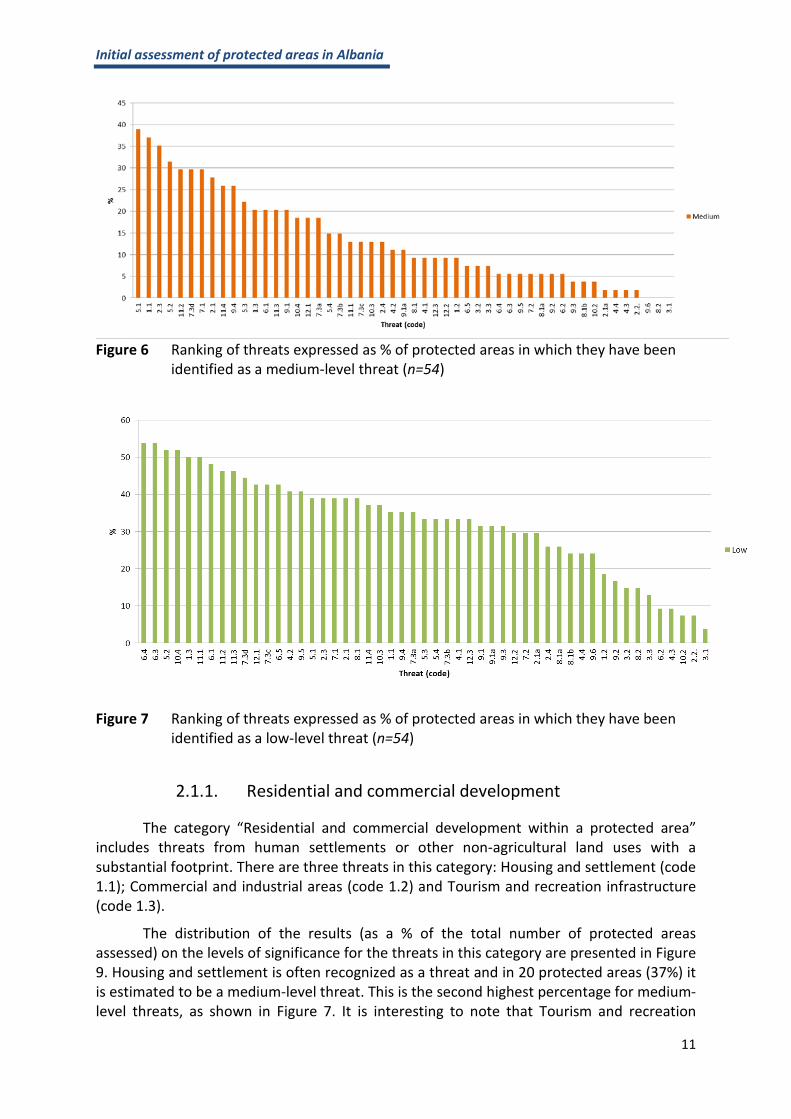
Figure 6 Ranking of threats expressed as % of protected areas in which they have been
identified as a medium-level threat (n=54)
Figure 7 Ranking of threats expressed as % of protected areas in which they have been
identified as a low-level threat (n=54)
2.1.1. Residential and commercial development
The category “Residential and commercial development within a protected area” includes threats from human settlements or other non-agricultural land uses with a substantial footprint. There are three threats in this category: Housing and settlement (code 1.1); Commercial and industrial areas (code 1.2) and Tourism and recreation infrastructure (code 1.3).
The distribution of the results (as a % of the total number of protected areas assessed) on the levels of significance for the threats in this category are presented in Figure 9. Housing and settlement is often recognized as a threat and in 20 protected areas (37%) it is estimated to be a medium-level threat. This is the second highest percentage for medium-level threats, as shown in Figure 7. It is interesting to note that Tourism and recreation

Initial assessment of protected areas in Albania
12
infrastructure development have been identified as a threat in 27 protected areas (50%), though at a low level. On the other hand, the threat from Commercial and industrial areas is not relevant to the vast majority of protected areas in Albania, although it has been estimated as a high-level threat for the Pishe Poro MNR in the region of Fier and the Pogradec Terrestrial/Aquatic Territory PL in the region of Korca.
Figure 8 Significance of the threats in the category “Residential and commercial
development within a protected area” (a % of the total number of protected areas)
2.1.2. Agriculture and aquaculture
The category “Agriculture and aquaculture within a protected area” includes threats from farming and grazing as a result of agricultural expansion and intensification, including silviculture, mariculture and aquaculture. There are five threats in this category: Annual and perennial non-timber crop cultivation (code 2.1); Drug cultivation (code 2.1a); Wood and pulp plantations (code 2.2); Livestock farming and grazing (code 2.3); and Marine and freshwater aquaculture (code 2.4).
The distribution of the results (as a % of the total number of protected areas assessed) on the levels of significance for the threats in this category are presented in Figure 10. Annual and perennial non-timber crop cultivation presents a threat to 36 protected areas (66.7%), although at low and medium levels. Wood and pulp plantations threaten only 5 protected areas and it is of medium level only in Pishe Poro MNR in the region of Fier. On the other hand, Livestock farming and grazing is relevant to 47 protected areas (87%). The high level of threat from Livestock farming and grazing has been reported for Zall Gjocaj NP, Dardhe-Xhyre MNR in the region of Elbasan, Levan MNR in the region of Fier, Krastafillak MNR and the Piskal-Shqeri PL in the region of Korce, as well as in Bjeshka e Oroshit RPA in the region of Lezhe. In the case of the Korab-Koritnik MNR, the managers from the Diber RAPA office estimated the level of threat as being high, whereas those at the Kukes RAPA

Initial assessment of protected areas in Albania
13
office estimated it as being medium. Freshwater aquaculture presents a high level of threat only in Zall Gjocaj NP in the region of Diber.
Figure 9 Significance of the threats in the category “Agriculture and aquaculture within a
protected area” (a % of the total number of protected areas)
2.1.3. Energy production and mining
The category “Energy production and mining within a protected area” includes threats from production of non-biological resources. There are three threats in this category: Oil and gas drilling (code 3.1); Mining and quarrying (code 3.2); and Energy generation, including from hydropower dams (code 3.3).
The distribution of the results (as a % of the total number of protected areas assessed) on the levels of significance for the threats in this category are presented in Figure 11. The overall picture is that the threats from Energy production and mining are not relevant to the vast majority of protected areas in Albania. Low level of threats form Oil and gas operations were reported for Pishe Poro Managed Nature Reserve in the region of Fier. A high level of threats from Mining and quarrying were reported for Luzni-Bulac RPA in the region of Diber, Shebenik-Jabllanice NP in the region of Elbasan, Pishe Poro MNR, and the Pogradec Terrestrial/Aquatic Territory PL in the region of Korca. High level of threats from Energy generation (including hydropower dams) were reported for Shebenik-Jabllanice NP, Kuturman MNR in the region of Elbasan, Bredhi Hotoves-Dangelli NP in the region of Gjirokaster and Korab-Koritnik MNR. In the latter case it is interesting to note that managers at the Diber RAPA office do not recognize this threat as relevant, whereas the managers at the Kukes RAPA office have identified it as a high-level threat.
Initial assessment of protected areas in Albania
14
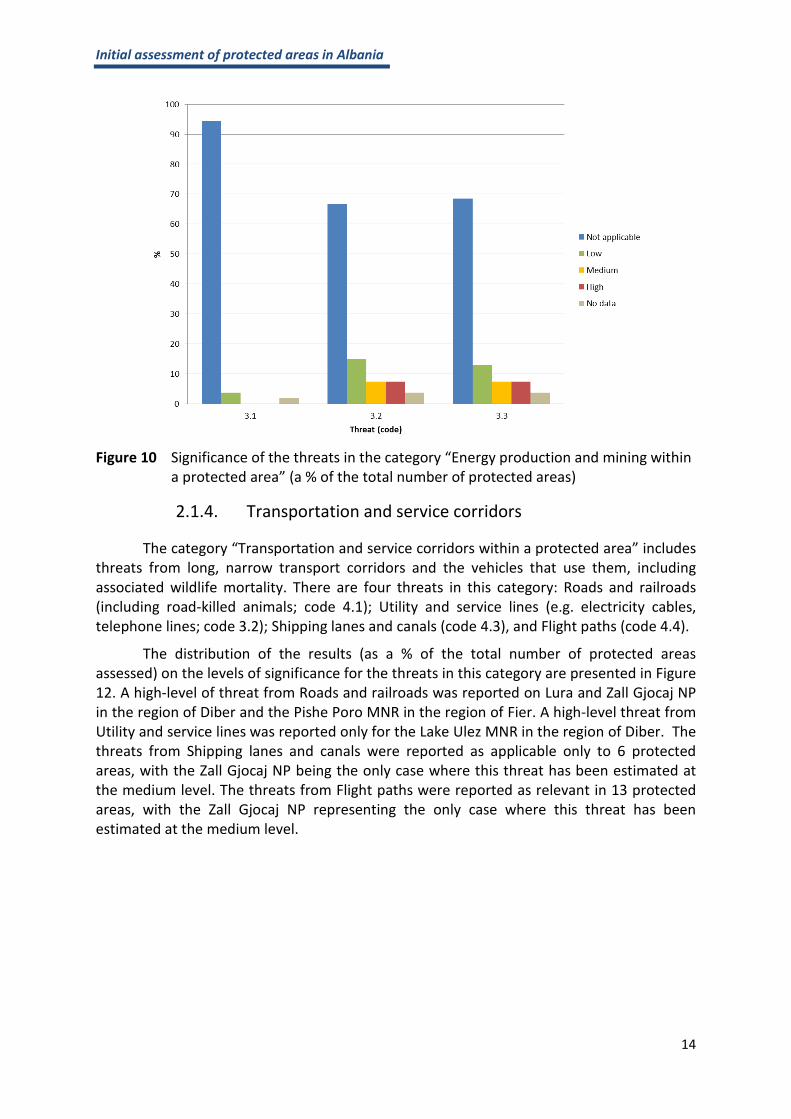
Figure 10 Significance of the threats in the category “Energy production and mining within
a protected area” (a % of the total number of protected areas)
2.1.4. Transportation and service corridors
The category “Transportation and service corridors within a protected area” includes threats from long, narrow transport corridors and the vehicles that use them, including associated wildlife mortality. There are four threats in this category: Roads and railroads (including road-killed animals; code 4.1); Utility and service lines (e.g. electricity cables, telephone lines; code 3.2); Shipping lanes and canals (code 4.3), and Flight paths (code 4.4).
The distribution of the results (as a % of the total number of protected areas assessed) on the levels of significance for the threats in this category are presented in Figure 12. A high-level of threat from Roads and railroads was reported on Lura and Zall Gjocaj NP in the region of Diber and the Pishe Poro MNR in the region of Fier. A high-level threat from Utility and service lines was reported only for the Lake Ulez MNR in the region of Diber. The threats from Shipping lanes and canals were reported as applicable only to 6 protected areas, with the Zall Gjocaj NP being the only case where this threat has been estimated at the medium level. The threats from Flight paths were reported as relevant in 13 protected areas, with the Zall Gjocaj NP representing the only case where this threat has been estimated at the medium level.

Initial assessment of protected areas in Albania
15
Figure 11 Significance of the threats in the category “Transportation and service corridors
within a protected area” (a % of the total number of protected areas)
2.1.5. Biological resource use and harm
The category “Biological resource use and harm within a protected area” includes threats from consumptive use of ‘wild’ biological resources including both deliberate and unintentional harvesting effects, as well as persecution or control of specific species, including hunting and killing of animals. There are four threats in this category: Hunting, killing and collecting terrestrial animals (including killing of animals as a result of human/wildlife conflict; code 5.1); Gathering terrestrial plants or plant products (non-timber; code 5.2); Logging and wood harvesting (code 5.3), and Fishing, killing and harvesting aquatic resources (code 5.4).
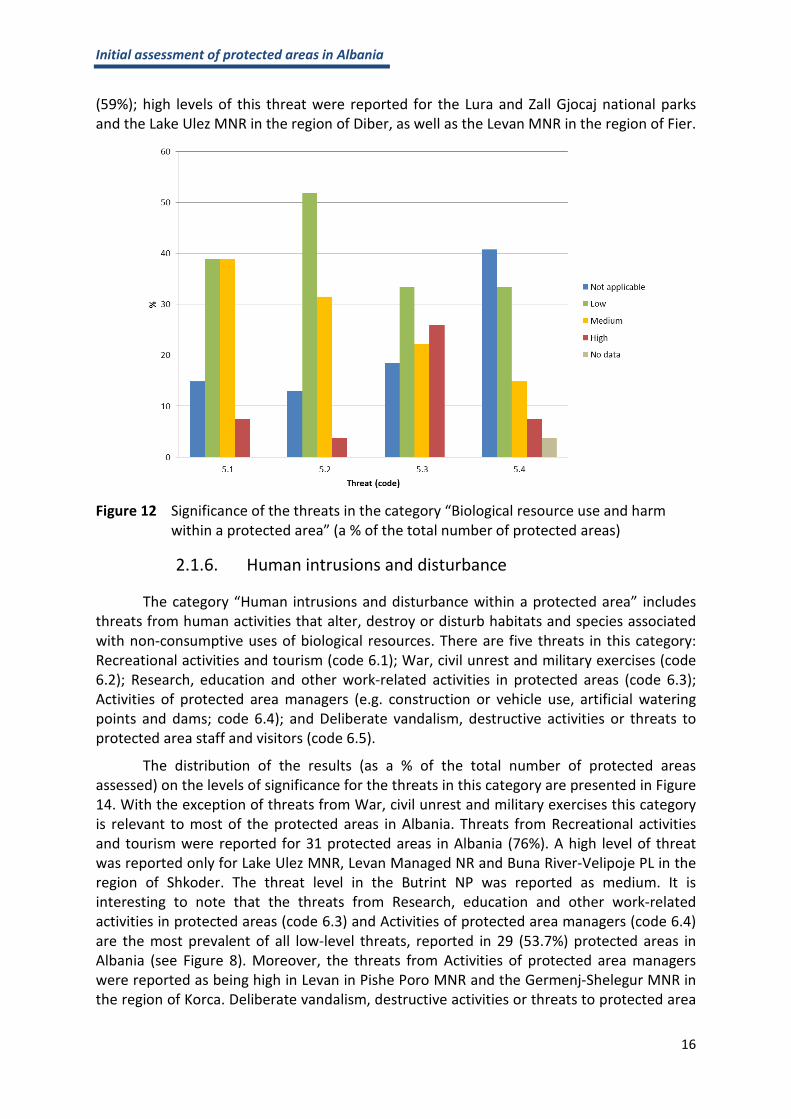
The distribution of the results (as a % of the total number of protected areas assessed) on the levels of significance for the threats in this category are presented in Figure 13. This category is relevant to the vast majority of the protected areas in Albania. It should be noted that the top high-level threat and two of the top five medium-level threats belong to this category (see figures 3 and 6 above).
Hunting, killing and collecting terrestrial animals (including killing of animals as a result of human/wildlife conflict; code 5.1) is reported as the most important medium-level threat (see Figure 7). It is also one of the most widespread threats, relevant to 46 protected areas (85%). It is interesting to note that the threat from gathering terrestrial plants or plant products was reported as being of a high level only in Lura and Zall Gjocaj national parks in the region of Diber. At the same time, this threat is widespread and of relevance to 47 protected areas (87%) in Albania. As mentioned previously, in 25.9% of protected areas, Logging and wood collection (threat code 5.3) represents a high-level threat. Fishing, killing and harvesting aquatic resources has been identified as a threat in 32 of the protected areas
Initial assessment of protected areas in Albania
16
(59%); high levels of this threat were reported for the Lura and Zall Gjocaj national parks and the Lake Ulez MNR in the region of Diber, as well as the Levan MNR in the region of Fier.
Figure 12 Significance of the threats in the category “Biological resource use and harm
within a protected area” (a % of the total number of protected areas)
2.1.6. Human intrusions and disturbance
The category “Human intrusions and disturbance within a protected area” includes threats from human activities that alter, destroy or disturb habitats and species associated with non-consumptive uses of biological resources. There are five threats in this category: Recreational activities and tourism (code 6.1); War, civil unrest and military exercises (code 6.2); Research, education and other work-related activities in protected areas (code 6.3); Activities of protected area managers (e.g. construction or vehicle use, artificial watering points and dams; code 6.4); and Deliberate vandalism, destructive activities or threats to protected area staff and visitors (code 6.5).
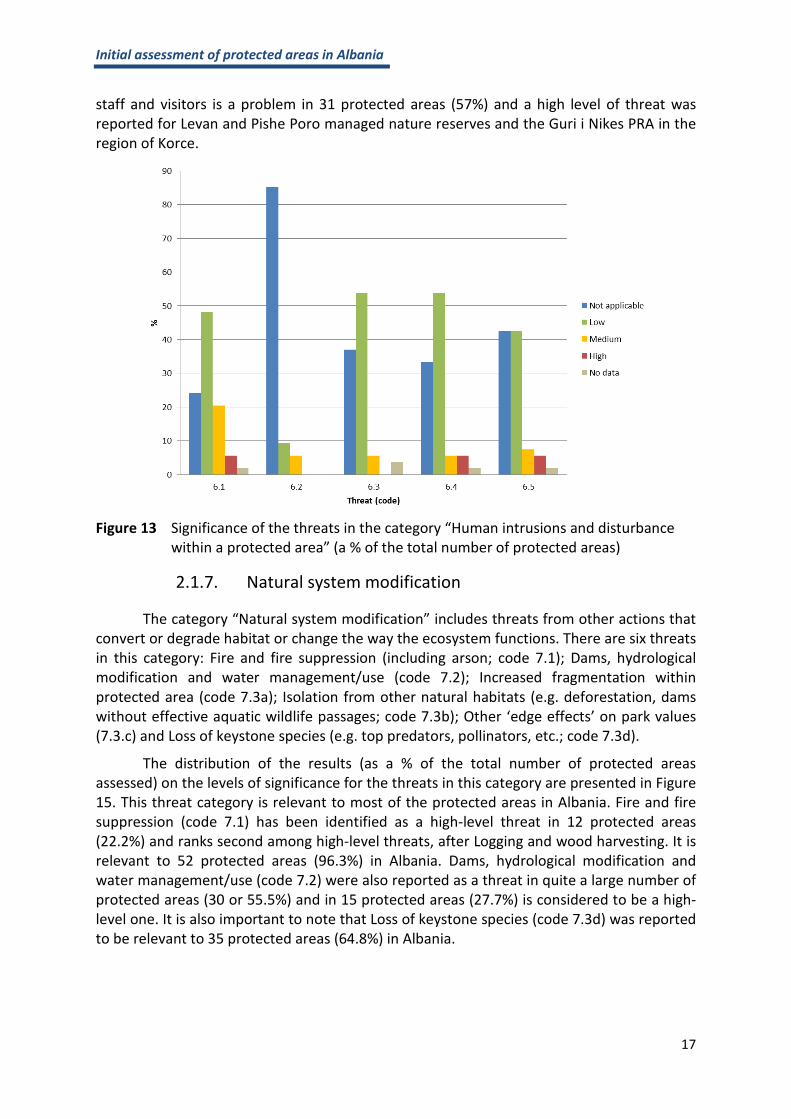
The distribution of the results (as a % of the total number of protected areas assessed) on the levels of significance for the threats in this category are presented in Figure 14. With the exception of threats from War, civil unrest and military exercises this category is relevant to most of the protected areas in Albania. Threats from Recreational activities and tourism were reported for 31 protected areas in Albania (76%). A high level of threat was reported only for Lake Ulez MNR, Levan Managed NR and Buna River-Velipoje PL in the region of Shkoder. The threat level in the Butrint NP was reported as medium. It is interesting to note that the threats from Research, education and other work-related activities in protected areas (code 6.3) and Activities of protected area managers (code 6.4) are the most prevalent of all low-level threats, reported in 29 (53.7%) protected areas in Albania (see Figure 8). Moreover, the threats from Activities of protected area managers were reported as being high in Levan in Pishe Poro MNR and the Germenj-Shelegur MNR in the region of Korca. Deliberate vandalism, destructive activities or threats to protected area
Initial assessment of protected areas in Albania
17
staff and visitors is a problem in 31 protected areas (57%) and a high level of threat was reported for Levan and Pishe Poro managed nature reserves and the Guri i Nikes PRA in the region of Korce.
Figure 13 Significance of the threats in the category “Human intrusions and disturbance
within a protected area” (a % of the total number of protected areas)
2.1.7. Natural system modification
The category “Natural system modification” includes threats from other actions that convert or degrade habitat or change the way the ecosystem functions. There are six threats in this category: Fire and fire suppression (including arson; code 7.1); Dams, hydrological modification and water management/use (code 7.2); Increased fragmentation within protected area (code 7.3a); Isolation from other natural habitats (e.g. deforestation, dams without effective aquatic wildlife passages; code 7.3b); Other ‘edge effects’ on park values (7.3.c) and Loss of keystone species (e.g. top predators, pollinators, etc.; code 7.3d).
The distribution of the results (as a % of the total number of protected areas assessed) on the levels of significance for the threats in this category are presented in Figure 15. This threat category is relevant to most of the protected areas in Albania. Fire and fire suppression (code 7.1) has been identified as a high-level threat in 12 protected areas (22.2%) and ranks second among high-level threats, after Logging and wood harvesting. It is relevant to 52 protected areas (96.3%) in Albania. Dams, hydrological modification and water management/use (code 7.2) were also reported as a threat in quite a large number of protected areas (30 or 55.5%) and in 15 protected areas (27.7%) is considered to be a high-level one. It is also important to note that Loss of keystone species (code 7.3d) was reported to be relevant to 35 protected areas (64.8%) in Albania.

Initial assessment of protected areas in Albania
18
Figure 14 Significance of the threats in the category “Natural system modification” (a % of
the total number of protected areas)
2.1.8. Invasive and other problematic species and genes
The category “Invasive and other problematic species and genes” includes threats from terrestrial and aquatic non-native and native plants, animals, pathogens/microbes or genetic materials that have or are predicted to have harmful effects on biodiversity following introduction, spread and/or increase. There are four threats in this category: Invasive non-native/alien plants (e.g. weeds; code 8.1); Invasive non-native/alien animals (code 8.1a); Pathogens (non-native or native but creating new/increased problems; code 8.1.b), and Introduced genetic material (e.g. genetically modified organisms; code 8.2).
The distribution of the results (as a % of the total number of protected areas assessed) on the levels of significance for the threats in this category are presented in Figure 16. This threat category is not very relevant to most protected areas that were assessed, except for Invasive non-native/alien plants (threat code 8.1) that is relevant to 28 protected areas (51.8%). High-level threats from Invasive non-native/alien plants were reported for the managed resource reserves Polis and Levan in the region of Elbasan and Fier, respectively. High-level threats from Invasive non-native/alien animals (code 8.1a) were reported only for Lake Shkodra MNR in the Shkodra region. No high-level threats were reported for Pathogens (non-native or native but creating new/increased problems; code 8.1.b) and Introduced genetic material (e.g. genetically modified; code 8.2).

Initial assessment of protected areas in Albania
19
Figure 15 Significance of the threats in the category “Invasive and other problematic
species and genes” (a % of the total number of protected areas)
2.1.9. Pollution entering or generated within protected area
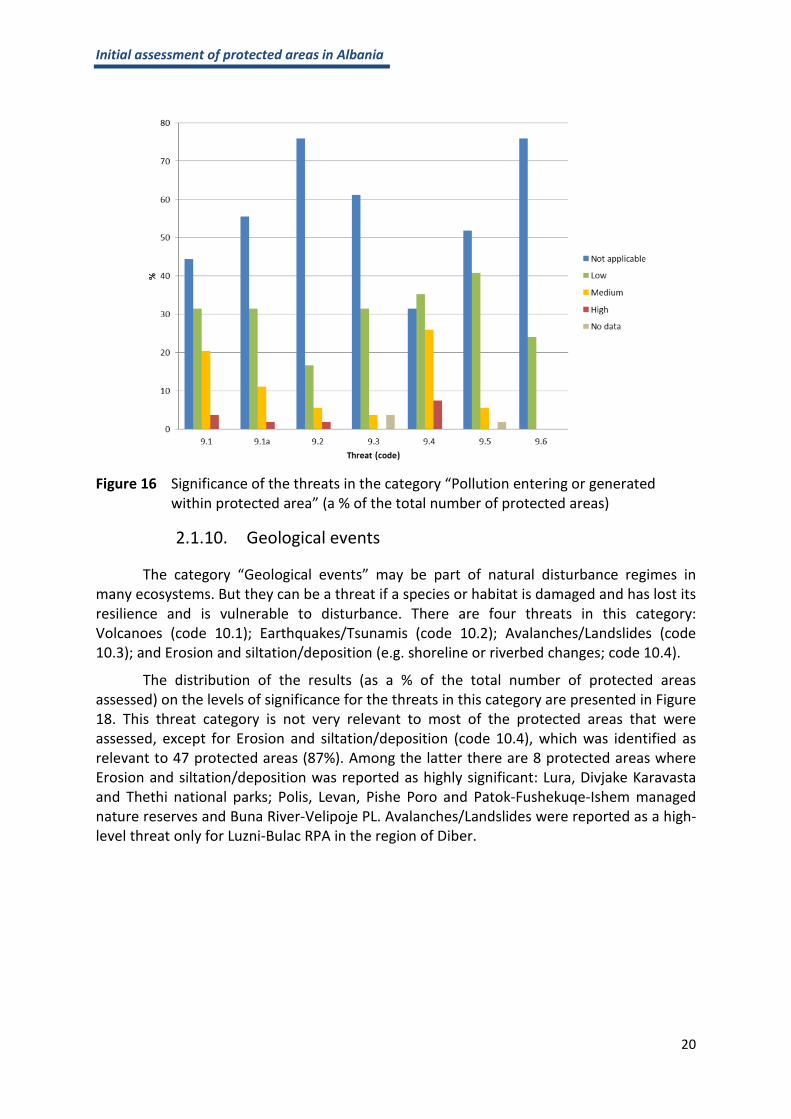
The category “Pollution entering or generated within protected area” includes threats from introduction of exotic and/or excess materials or energy from point and non-point sources. There are seven threats in this category: Household sewage and urban waste water (code 9.1); Sewage and waste water from protected area facilities (e.g. toilets, hotels, etc.; code 9.1a); Industrial, mining and military effluents and discharges (e.g. poor water quality discharge from dams, unnatural temperatures, de-oxygenated, other pollution; code 9.2); Agricultural and forestry effluents (e.g. excess fertilizers or pesticides; code 9.3); Garbage and solid waste (code 9.4); Air-borne pollutants (code 9.5); and Excess energy (e.g. heat pollution, lights, etc.; code 9.5).
The distribution of the results (as a % of the total number of protected areas assessed) on the levels of significance for the threats in this category are presented in Figure 17. This threat category is not very relevant to the protected areas that were assessed, except for the threat Sewage and waste water from protected area facilities (code 9.1) that was relevant to 30 protected areas (55.5%) and identified as a high-level threat only in Levant MNR in the Fier region and Prespa NP in the Korca region. High-level threats from Industrial, mining and military effluents and discharges (code 9.2) were reported only for the Levan MNR. Among other sources of pollution, Garbage and solid waste (code 9.4) were reported as a high-level threat in four protected areas: Prespa and Lura national parks, Levan MNR and the Pogradec Terrestrial/Aquatic Territory PL in the region of Korca. Overall, threats from Garbage and solid waste were reported as being relevant to 37 protected areas (68.5%).
Initial assessment of protected areas in Albania
20
Figure 16 Significance of the threats in the category “Pollution entering or generated
within protected area” (a % of the total number of protected areas)
2.1.10. Geological events
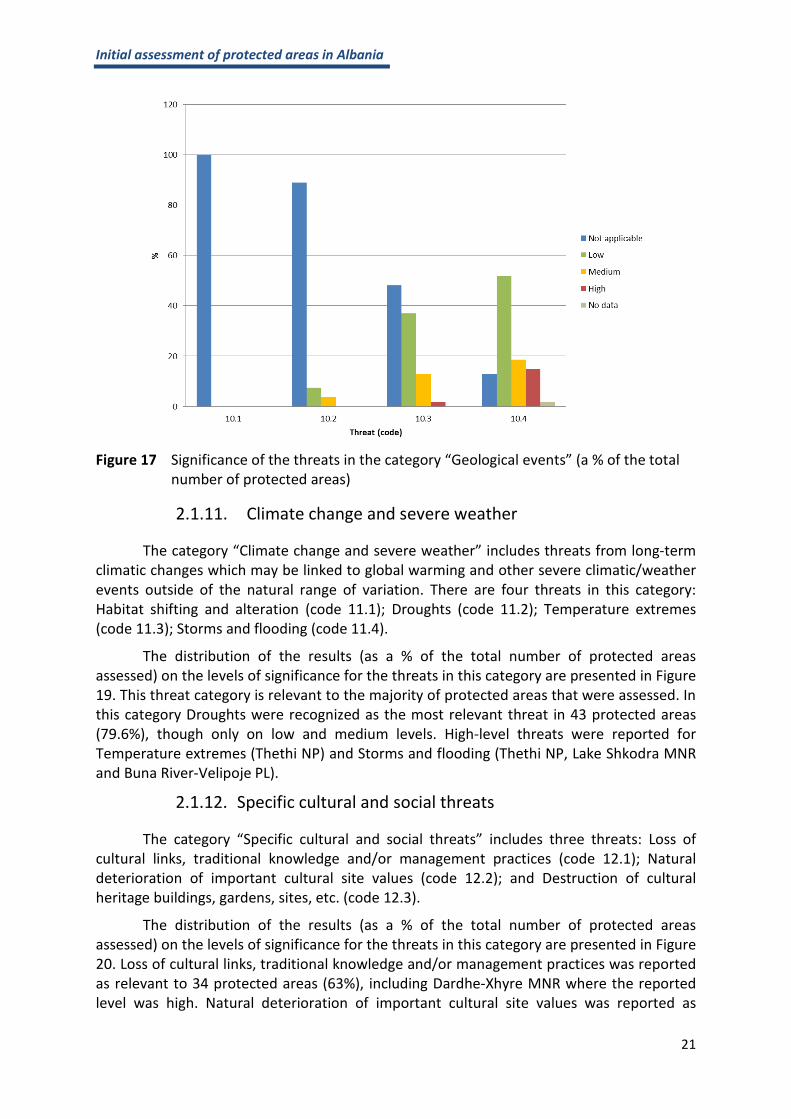
The category “Geological events” may be part of natural disturbance regimes in many ecosystems. But they can be a threat if a species or habitat is damaged and has lost its resilience and is vulnerable to disturbance. There are four threats in this category: Volcanoes (code 10.1); Earthquakes/Tsunamis (code 10.2); Avalanches/Landslides (code 10.3); and Erosion and siltation/deposition (e.g. shoreline or riverbed changes; code 10.4).
The distribution of the results (as a % of the total number of protected areas assessed) on the levels of significance for the threats in this category are presented in Figure 18. This threat category is not very relevant to most of the protected areas that were assessed, except for Erosion and siltation/deposition (code 10.4), which was identified as relevant to 47 protected areas (87%). Among the latter there are 8 protected areas where Erosion and siltation/deposition was reported as highly significant: Lura, Divjake Karavasta and Thethi national parks; Polis, Levan, Pishe Poro and Patok-Fushekuqe-Ishem managed nature reserves and Buna River-Velipoje PL. Avalanches/Landslides were reported as a high-level threat only for Luzni-Bulac RPA in the region of Diber.
Initial assessment of protected areas in Albania
21
Figure 17 Significance of the threats in the category “Geological events” (a % of the total
number of protected areas)
2.1.11. Climate change and severe weather
The category “Climate change and severe weather” includes threats from long-term climatic changes which may be linked to global warming and other severe climatic/weather events outside of the natural range of variation. There are four threats in this category: Habitat shifting and alteration (code 11.1); Droughts (code 11.2); Temperature extremes (code 11.3); Storms and flooding (code 11.4).
The distribution of the results (as a % of the total number of protected areas assessed) on the levels of significance for the threats in this category are presented in Figure 19. This threat category is relevant to the majority of protected areas that were assessed. In this category Droughts were recognized as the most relevant threat in 43 protected areas (79.6%), though only on low and medium levels. High-level threats were reported for Temperature extremes (Thethi NP) and Storms and flooding (Thethi NP, Lake Shkodra MNR and Buna River-Velipoje PL).
2.1.12. Specific cultural and social threats
The category “Specific cultural and social threats” includes three threats: Loss of cultural links, traditional knowledge and/or management practices (code 12.1); Natural deterioration of important cultural site values (code 12.2); and Destruction of cultural heritage buildings, gardens, sites, etc. (code 12.3).
The distribution of the results (as a % of the total number of protected areas assessed) on the levels of significance for the threats in this category are presented in Figure 20. Loss of cultural links, traditional knowledge and/or management practices was reported as relevant to 34 protected areas (63%), including Dardhe-Xhyre MNR where the reported level was high. Natural deterioration of important cultural site values was reported as

Initial assessment of protected areas in Albania
22
relevant to 25 protected areas (46.3%), with Polis and Dardhe-Xhyre MNRs being highly threatened. Destruction of cultural heritage buildings, gardens, sites, etc. was deemed relevant to 25 protected areas (46.3%), with Buna River-Velipoje PL experiencing a high level of this threat.
Figure 18 Significance of the threats in the category “Climate change and severe weather”
(% of the total number of protected areas)
Figure 19 Significance of the second-level threat categories of “Specific cultural and social
threats” (% of the total number of protected areas)

Initial assessment of protected areas in Albania
23
2.2. Analysis of Assessment Form results
In their “Guidance Notes for using the Tracking Tool,” the authors of the METT acknowledge that the whole concept of ‘scoring’ progress is fraught with difficulties and possibilities for distortion. The current system assumes, for example, that all the questions cover issues of equal weight, whereas in reality this is not necessarily the case. Scores would offer a better assessment of effectiveness if they were calculated as a percentage of each of the six elements of the IUCN PAME Framework (i.e. context, planning, inputs, process, outputs and assessments). Bearing this in mind, the analysis presented in this section focuses mostly on the six elements of the IUCN PAME Framework. On the other hand, as presented in Section 1.1 (Objectives and scope of the assessment), this report aims to help assess the current state of all protected areas in Albania, with a special emphasis on technical aspects, institutional setup, legal gaps, human resources, equipment, etc. To this end, the most relevant questions, including the comments from the respondents, were analysed in detail in the sections below related to each of the six elements of the IUCN PAME Framework.
As mentioned in Section 1.2 (Approach and Methodology), the assessment is made by assigning a simple score ranging between 0 (poor) to 3 (excellent) to each question, thus linking each score to one of four possible choices available to the assessors. It is important to recall that four of the questions are supplemented by a set of three additional statements that makes it possible to score more points. Since there are no alternatives for the supplementary questions which elaborate on key themes in the main questions, there could be only two values for each of them: zero points were assigned to the instances where the supplementary questions were omitted and one point was assigned to the cases where they were selected. For the purpose of this analysis, the data on individual protected areas were aggregated in two ways. First, for all protected areas the scores (number of points) were summed up for each of the six elements of the IUCN PAME Framework and also represented as a percentage of the maximum possible score for the relevant element (see Example 1 below). The results are presented in the tables in Annex IV, where the protected areas are listed by their management category. The data were also aggregated for all 34 questions in the Assessment Form by counting the number of times each of the alternative answers was chosen, and by representing them as a percentage of the total number of answers (that is 51; see Example 2). The detailed results of this analysis are presented in Annex VI.
To aid the visualisation of the results, the protected areas were grouped into one of the four effectiveness categories indicated by the following colour scheme:
0%<25% Category 1 Ineffective
25%<50% Category 2
50%<75% Category 3
>75% Category 4 Highly effective
Initial assessment of protected areas in Albania
24
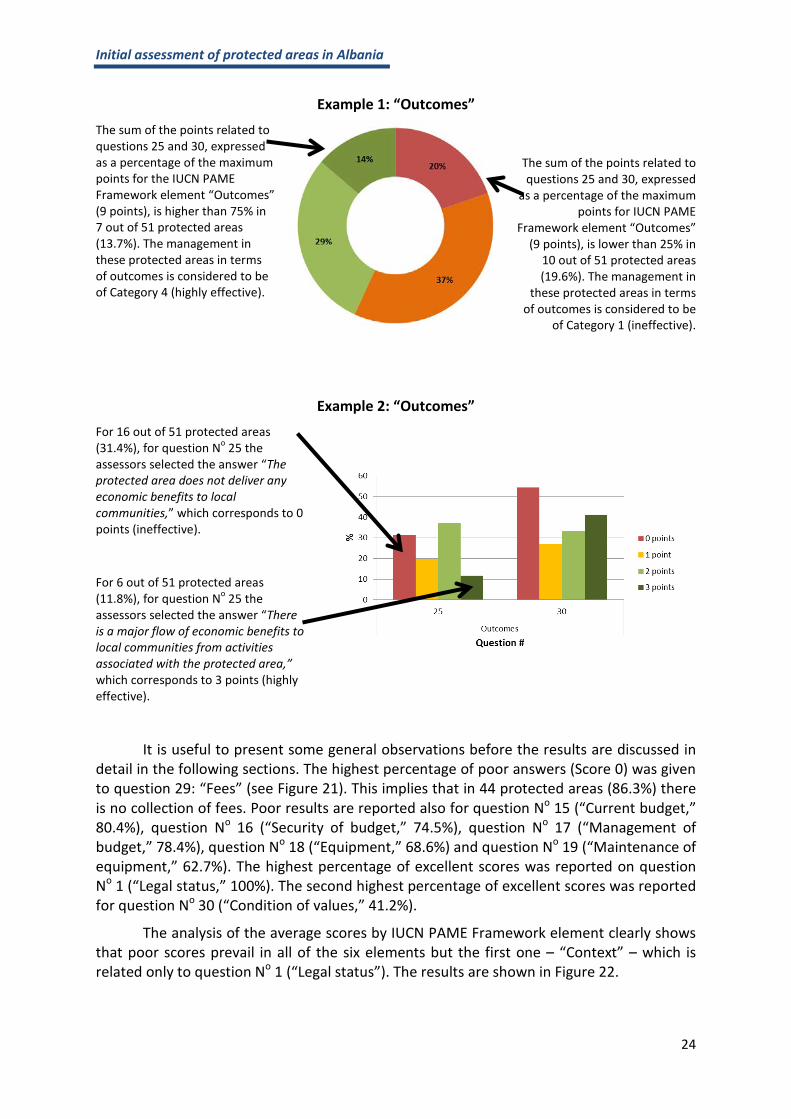
Example 1: “Outcomes” The sum of the points related to questions 25 and 30, expressed as a percentage of the maximum points for the IUCN PAME Framework element “Outcomes” (9 points), is higher than 75% in 7 out of 51 protected areas (13.7%). The management in these protected areas in terms of outcomes is considered to be of Category 4 (highly effective).
The sum of the points related to questions 25 and 30, expressed
as a percentage of the maximum points for IUCN PAME
Framework element “Outcomes” (9 points), is lower than 25% in
10 out of 51 protected areas (19.6%). The management in
these protected areas in terms of outcomes is considered to be
of Category 1 (ineffective).
Example 2: “Outcomes” For 16 out of 51 protected areas (31.4%), for question No 25 the assessors selected the answer “The protected area does not deliver any economic benefits to local communities,” which corresponds to 0 points (ineffective).
For 6 out of 51 protected areas (11.8%), for question No 25 the assessors selected the answer “There is a major flow of economic benefits to local communities from activities associated with the protected area,” which corresponds to 3 points (highly effective).
It is useful to present some general observations before the results are discussed in detail in the following sections. The highest percentage of poor answers (Score 0) was given to question 29: “Fees” (see Figure 21). This implies that in 44 protected areas (86.3%) there is no collection of fees. Poor results are reported also for question No 15 (“Current budget,” 80.4%), question No 16 (“Security of budget,” 74.5%), question No 17 (“Management of budget,” 78.4%), question No 18 (“Equipment,” 68.6%) and question No 19 (“Maintenance of equipment,” 62.7%). The highest percentage of excellent scores was reported on question No 1 (“Legal status,” 100%). The second highest percentage of excellent scores was reported for question No 30 (“Condition of values,” 41.2%).
The analysis of the average scores by IUCN PAME Framework element clearly shows that poor scores prevail in all of the six elements but the first one – “Context” – which is related only to question No 1 (“Legal status”). The results are shown in Figure 22.

Initial assessment of protected areas in Albania
25
Figure 20 Number of scores per question (% of the maximum scores)
Figure 21 Distribution of scores per IUCN PAME Framework element (% of the maximum
scores)
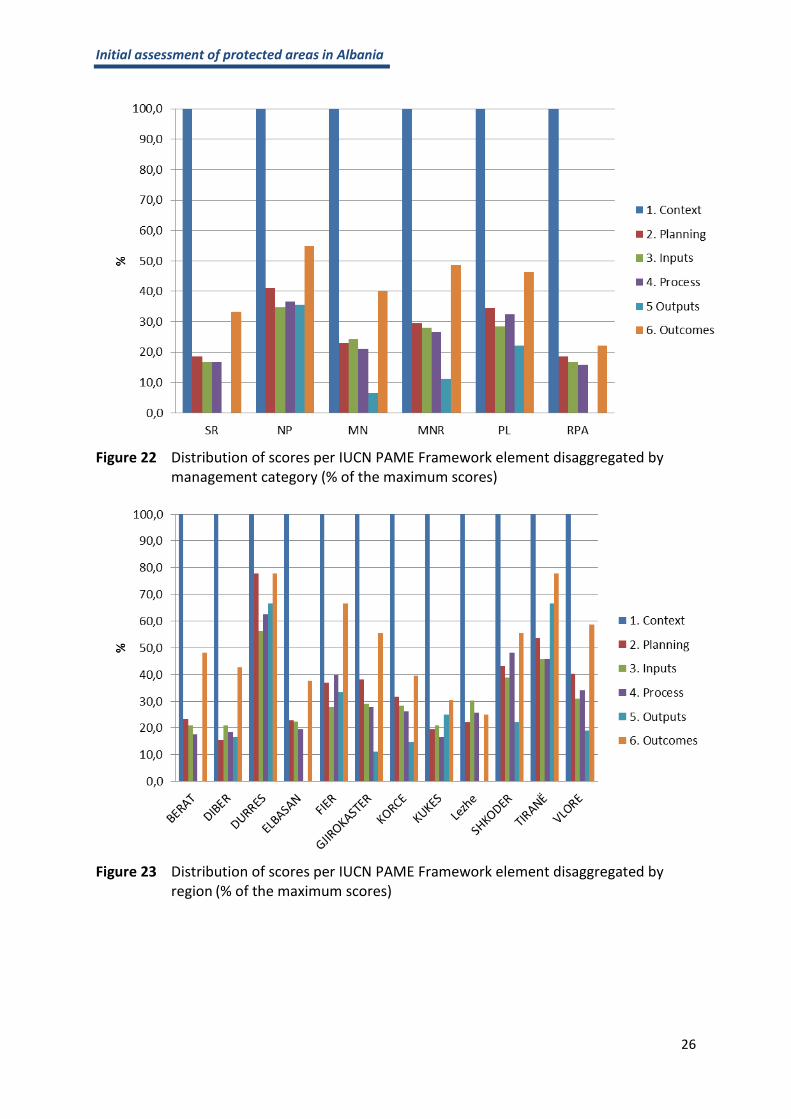
The results of this analysis can be disaggregated by a management category, as shown in Figure 23. According to this analysis, national parks show better average results on all six IUCN PAME Framework elements than other management categories. A similar analysis by which the data are disaggregated by region show that the region of Durres has better average results on all six IUCN PAME Framework elements than other regions in Albania (see Figure 24).
Initial assessment of protected areas in Albania
26
Figure 22 Distribution of scores per IUCN PAME Framework element disaggregated by
management category (% of the maximum scores)
Figure 23 Distribution of scores per IUCN PAME Framework element disaggregated by
region (% of the maximum scores)

Initial assessment of protected areas in Albania
27
2.2.1. Context
“Context” is the first element in the IUCN PAME Framework that provides the relevant background information needed for the planning and management. Most of the information in the METT on this element is provided in Data sheet 2. In the Assessment Form this element is represented only by the first question: “Legal status.” All assessed protected areas were legally established.
In their comments to the question, managers of Dajti Mountain NP noted that its new borders have not been mapped although the park was enlarged in 2006. Assessors also noted that the area of the Stravaj Managed Nature Reserve needs to be increased from 400 ha to 1200 ha.
Figure 24 Effectiveness categories of “Context”
2.2.2. Planning
“Planning” is the second element in the IUCN PAME Framework and concerns design features of a protected area – the physical, legal and institutional. As shown in Figure 26, the assessors reported weak effectiveness for 43 protect areas (84.3%) in terms of “Planning” (having less than 50% of the maximum possible scores). About half of the protected areas (25; 49%) lack management plans and only 5 protected areas (9.8%) are implementing the existing management plans. Poor results were also reported concerning planning for land and water (question No 21). More than half of the assessed protected areas are considered to have an appropriate design in terms of size and shape (question No 5). The majority of protected area (30; 58.8%) lack regulations, or in case they exist, their enforcement is considered to be weak. The assessors mentioned, among other things, the following issues in need of regulation: ban on hunting in protected areas, ban on introduction of allochthonous species, and need of regulations to control land use.
Figure 25 Effectiveness categories of “Planning”
Figure 26 Scores assigned to the questions on “Planning” (% of the maximum scores)

Initial assessment of protected areas in Albania
28
There is a strong positive correlation (r=0,93) between management effectiveness in terms of “Planning” and the total score of a protected area, which is statistically significant (α=3,87-23).
2.2.3. Inputs
“Inputs” is the third element in the IUCN PAME Framework that concerns the linkage between the level of resources available and management effectiveness. As can be seen from Figure 28, the assessors reported weak effectiveness for 44 protect areas (88.2%) in terms of “Inputs” (having less than 50% of the maximum possible scores).
Figure 27 Effectiveness categories of “Inputs”
Figure 28 Scores assigned to the questions on “Inputs” (% of the maximum scores)
As can be seen from Figure 29, poor results are notably reported with respect to the available budget (80.4%), security of budget (74.5%), availability of equipment (68.6%) and collection of fees (86.3%). It is interesting to note that the highest percentage of excellent scores was reported on question No 13 (“Staff numbers,” 17.6%); the second highest percentage of excellent scores was reported for question No 9 (“Resource inventory,” 15.7%). The assessors mentioned, among other things, the following issues in connection to the required inputs: low level of professionalism and the need for tailored training of staff to address their specific tasks. In some cases there is a lack of basic facilities and equipment, such as telephone lines, internet and printers. The assessors also mentioned that the income generated by some protected areas (e.g. from entrance fees, permits for resource use and other use) is transferred to the government and should be returned to the respective protected areas.
There is a strong positive correlation (r=0,867) between management effectiveness in terms of “Inputs” and the total score of a protected area, which is statistically significant (α=2.03-16).

Initial assessment of protected areas in Albania
29
2.2.4. Process
“Process” in the IUCN PAME Framework concerns the implementation of management actions according to accepted processes. As can be seen from Figure 30, the assessors reported weak effectiveness for 47 protect areas (92.2%) in terms of “Process” (having less than 50% of the maximum possible scores).
Figure 29 Effectiveness
categories of “Process”
Figure 30 Scores assigned to the questions on “Process” (% of the maximum scores)
As can be seen from Figure 31, poor results are notably reported with respect to
management of budget (78.4%), maintenance of equipment (62.7%), education and awareness (48.1%), involvement of local communities (63.2%) and cooperation with commercial tourism operators (62.7%). The highest percentage of excellent scores is observed with respect to maintenance of equipment (5.9%; national parks Prespa, Thethi and Karaburun Sazan), and demarcation of the boundary of some protected areas (5.9%; Lake Ulez and Rrushkull MNR and Buna River- Velipoje PL). With respect to the physical protection, the assessors often commented that the existing level and methods of control of activities in the protected areas are largely inadequate due to lack of staff (rangers), equipment, skills (e.g. patrolling methods), lack of physical infrastructure (no ranger posts or stations in the protected area), difficulty of access, among other elements. Most of the assessors reported that there is no budget for their regular operations and that equipment is lacking.
As mentioned in Section 2.1.6 (Human intrusions and disturbance), the threats from Research, education and other work-related activities in protected areas (threat code 6.3) was widespread, though at a low level (reported in 29 or 53.7% of protected areas). In their comments to question No 11, the assessors noted, among other things, that experts conducting research and scientific studies do not inform and engage protected area staff and that they are not addressing their management priorities and needs. In other protected areas, research has not been conducted for long periods of time and there is a lack of basic information needed for their effective management.
There is a strong positive correlation (r=0.96) between management effectiveness in terms of “Process” and the total score of a protected area, which is statistically significant (α=4.05-28).

Initial assessment of protected areas in Albania
30
2.2.5. Outputs
“Outputs” in the IUCN PAME Framework refers to goods and services which are usually outlined in management plans and work plans. In the Assessment Form this element is directly addressed only by question No 27 concerning visitor facilities. As can be seen from Figure 32, the assessors reported weak effectiveness for 44 protected areas (86.3%) in terms of “Outputs” (having less than 50% of the maximum possible scores). The highest scores (3) were reported for the following protected areas: national parks Valbona Valley, Karaburun-Sazan, Prespa, Qafshtame, and Dajti Mountain; Rrushkull MNR and the Mali me Gropa-Bize-Martanesh PL. Figure 31 Distribution of scores
on “Outputs”
There is a strong positive correlation (r=0.609) between management effectiveness in terms of “Outputs” and the total score of a protected area, which is statistically significant (α=2.08-6).
2.2.6. Outcomes
“Outcomes” in the IUCN PAME Framework concerns biodiversity, social, cultural and economic outcomes of protected area management. As can be seen from Figure 33, assessors reported weak effectiveness for 29 protected areas (57.3%) in terms of “Outcomes” (having less than 50% of the maximum possible scores). Yet, according to the data, this element in the IUCN PAME Framework appears to be the strongest of all. For instance, the condition of natural and cultural values was reported as being excellent in 21 protected areas which account for 41.2% of all protected areas. Apart from question 1 (“Legal status”) this is the highest mark of all questions.
Figure 32 Distribution of scores
on “Outcomes”
Figure 33 Scores assigned to the questions on “Outcomes”

Initial assessment of protected areas in Albania
31
The scores on the economic benefits the protected areas provide to local communities are also quite high. The highest scores were reported for the following protected areas: Bredhi i Drenoves NP, managed nature reserves Korab-Koritnik and Lake Ulez, the Luzni Bulac RPA and the protected landscapes of Buna River-Velipoje and Vjose-Narte. For instance, in the case of the Bredhi i Drenoves NP the assessors reported significant benefits, including firewood, grazing of domestic animals and non-timber forest products (e.g. medicinal plants).
There is a strong positive correlation (r=0.74) between management effectiveness in terms of “Outcomes” and the total score of a protected area, which is statistically significant (α=3.4-10).
Initial assessment of protected areas in Albania
32
3. Conclusions and recommendations
Wildfires have been identified as the most common threat to protected areas in Albania, followed by erosion/siltation, livestock farming and grazing, and collection of plants and animals (including hunting). Logging and wood harvesting, however, has been recognized as the most serious threat that causes degradation of natural values in 14 protected areas, followed by wildfires, erosion/siltation, hydrological modification and water management and livestock farming and grazing. The threat category “Biological resource use and harm within a protected area” is relevant to the vast majority of the protected areas. The most frequent high-level threat (Logging and wood harvesting) and two of the top five most frequent medium-level threats belong to this category (collection of plants and animals, including hunting). It is also worth noting that the activities conducted by protected area managers and researchers are the most prevalent of all low-level threats, according to the METT results.
Assessors reported that in the Korca region, 6 out of 9 protected areas face significant threats from logging and wood harvesting; in the Diber region 4 out of 8 protected areas face significant threats from wildfires. These examples reveal some tendencies among the evaluators in their scoring of threats. Protected area managers at the Diber RAPA office have identified the highest number of high-level threats (in total 36), followed by RAPA offices for the regions of Korce (22) and Fier (22). On the other hand, managers at the RAPA offices for the regions of Berat, Durres, and Vlore did not report any high-level threats. There seem to be significant differences among protected area managers in Albania on how they perceive and understand the various threats, and also about how they assess the level of significance or impact on the key natural values in the protected areas. These examples suggest that the comparison between protected areas is difficult when assessment is conducted by different people. This is related to the fact that most management effectiveness evaluations are based on ‘expert judgement’ which is prone to errors and cognitive biases. It should be emphasized that qualitative assessment tools, such as METT, are prone to what has been termed as ‘framing effects,’ whereby people have variable interpretations of what they are being asked to assess. This seems to be the case here, despite the effort to promote the use of quantitative data, such as those in Annex II.
There are also examples of an obvious discrepancy between the level of threats reported on a protected area and the overall score in the Assessment Form. For instance, the managers reported 12 high-level threats to Zall Gjocaj NP while giving it the highest overall score (76). This brings in focus the limitations in the interpretation of the scores assigned to the questions in the Assessment Form. As the authors of the METT write in their guidance on how to use the tool, all questions in the assessment questionnaire have equal weight, but in practice, this is not the case because some questions are more crucial to effectiveness than others. They therefore suggest that the assessors or reviewers need to be cautious about how they are going to interpret the overall scores obtained from the tool. They also suggest that the scores will provide a better assessment of effectiveness if calculated as a percentage for each of the six elements of the IUCN PAME Framework.
The analysis of the average scores by IUCN PAME Framework elements clearly shows that poor scores prevail in all six elements but Context. If disaggregated by management category these results also indicate that national parks show better average results than other management categories on all six IUCN PAME Framework elements. This may reflect
Initial assessment of protected areas in Albania
33
the fact that this category has received the highest attention by both national authorities and international donors thus far; half of the existing management plans (officially approved or not) have been developed for the national parks in Albania. If disaggregated by region, it is evident that the protected areas in the region of Durres have better average results on all of the six IUCN PAME Framework elements than those in other regions in Albania. This is the case despite the fact that there is no single management plan developed for the protected areas in this administrative region in Albania. This example also implies that there are important differences among the protected area managers in how they assign scores to the questions in the Assessment Form. Therefore, even if management effectiveness is calculated for each of the six IUCN PAME Frameworks separately, it is still difficult to draw conclusions across the 51 protected areas assessed under this project. Nonetheless, there are trends that can be observed across the sample. For instance, the vast majority of the protected areas received less than 50% of the maximum possible scores on Planning (84.3%), Input (88.2%), Process (92.2%), and Output (86.3%). Despite the poor results on these important elements, the assessors’ evaluation of Outcomes is relatively better as only 57.3% of the protect areas have received less than 50% of the maximum possible scores on this element. The highest percentage of poor answers (Score 0) is observed with respect to collection of fees (86.3%), availability of budget (80.4%), security of budget (74.5%), management of budget (78.4%), availability of equipment (68.6%) and maintenance of equipment (62.7%). The highest percentage of excellent scores (Score 3) was reported on the legal status of protected areas (100%) and condition of values (41.2%).
In the comment/explanation column of the Assessment Form the assessors mentioned the need of new regulation on hunting, introduction of allochthonous species, and land use in protected areas and stressed the difficulties in the enforcement of the existing regulations. With respect to the inputs needed for an effective management of protected areas, the assessors emphasized the insufficient levels of knowledge and skills, and the lack of professional training tailored to address the specific needs of the managers and the problems they face in the protected areas in their jurisdiction. Many protected areas lack basic management infrastructure, such as facilities, vehicles, monitoring equipment, telephone lines, access to the internet, computers, and basic office equipment. This certainly affects the physical protection of the protected areas, which is mainly inadequate and ineffective.
Despite the significant gaps in terms of inputs, the income generated by some protected areas (e.g. from entrance fees, permits for resource use and other use) is transferred to the government without any repayment to the protected areas which generate the income. Another issue the assessors often mentioned concerns the collaboration with experts conducting research and scientific studies. Protected area managers complained that they are often not informed about or involved in research activities, and that researchers do not address their management priorities and needs. In some protected areas, research has not been conducted for a long time and the managers lack basic information needed for their effective management.
The METT should not be the sole basis for monitoring of management effectiveness due to its limited focus on evaluation of outcomes. It is thus recommended that the findings presented in this report are used as a quick assessment of strengths and weaknesses of the protected areas network in Albania. On the other hand, the tool can still be effectively used to track progress over time in individual sites until a detailed monitoring system is
Initial assessment of protected areas in Albania
34
established in Albania. The regular use of the METT will offer protected area managers opportunities to reflect on ongoing challenges and also improve communication and cooperation with stakeholders.
References
Dizon, E.C., R.C. Geronimo, R. Quicho Jr. 2013. Benchmarking the management effectiveness of nationally-managed marine protected areas in the Philippines and policy recommendations.Final Report for USAID Coral Triangle Support Partnership (CTSP) and Conservation International – Philippines. September 2013.
Ervin, J.2003. WWF: Rapid Assessment and Prioritization of Protected Area Management (RAPPAM) Methodology. Gland, Switzerland: WWF.
Hockings, M.; Stolton, S. and Dudley, N. 2000. Evaluating Effectiveness: A Framework for Assessing the Management of Protected Areas. International Union for Conservation of Nature (IUCN), Gland, Switzerland and Cambridge, UK. x + 121pp.
Ministry of Environment 2014. Protected Area Network. Tirana: Ministry of the Environment.
Mwima, H. K. 2007. Synthesis of completed management effectiveness tracking tool for protected areas managed by the Zambia Wildlife Authority for the year 2007. The Ministry of Tourism, Environment and Natural Resources.
Stolton, S, M Hockings, N Dudley, K MacKinnon, T Whitten and F Leverington (2007 ) Reporting Progress in Protected Areas A Site-Level Management Effectiveness Tracking Tool: second edition. World Bank/WWF Forest Alliance published by WWF, Gland, Switzerland.
Initial assessment of protected areas in Albania
35
Annexes
Annex I: Protected Areas Network in Albania
Annex II: Quantification of protected areas threats: supplement to Data sheet 2
Annex III: Participants of the METT workshop, July 8-9, Hotel Dajti Tower, Dajti National Park
Annex IV: Scores given to protected areas aggregated by the six IUCN PAME Framework elements
Annex V: Analysis of the level of significance of threats to protected areas
Annex VI: Analysis of the scores on the questions in the Assessment Form
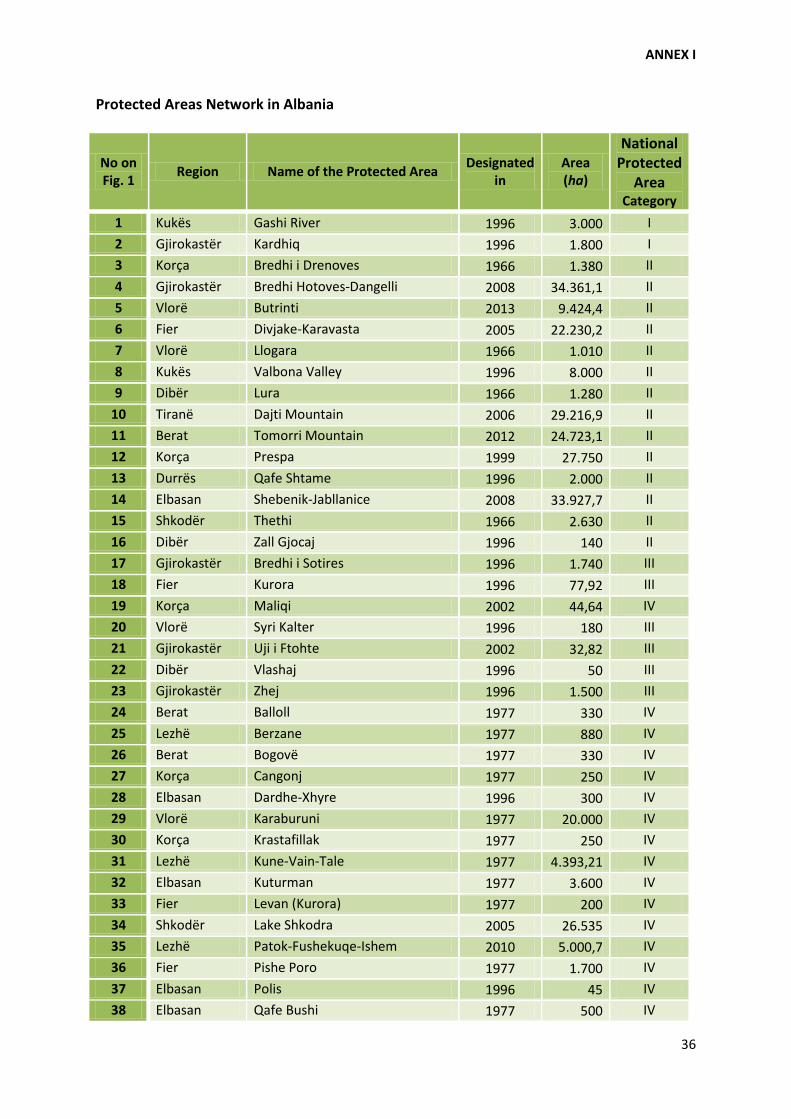
ANNEX I
36
Protected Areas Network in Albania
No on Fig. 1 Region Name of the Protected Area Designated
in Area (ha)
National Protected
Area Category
1 Kukës Gashi River 1996 3.000 I 2 Gjirokastër Kardhiq 1996 1.800 I 3 Korça Bredhi i Drenoves 1966 1.380 II 4 Gjirokastër Bredhi Hotoves-Dangelli 2008 34.361,1 II 5 Vlorë Butrinti 2013 9.424,4 II 6 Fier Divjake-Karavasta 2005 22.230,2 II 7 Vlorë Llogara 1966 1.010 II 8 Kukës Valbona Valley 1996 8.000 II 9 Dibër Lura 1966 1.280 II
10 Tiranë Dajti Mountain 2006 29.216,9 II 11 Berat Tomorri Mountain 2012 24.723,1 II 12 Korça Prespa 1999 27.750 II 13 Durrës Qafe Shtame 1996 2.000 II 14 Elbasan Shebenik-Jabllanice 2008 33.927,7 II 15 Shkodër Thethi 1966 2.630 II 16 Dibër Zall Gjocaj 1996 140 II 17 Gjirokastër Bredhi i Sotires 1996 1.740 III 18 Fier Kurora 1996 77,92 III 19 Korça Maliqi 2002 44,64 IV 20 Vlorë Syri Kalter 1996 180 III 21 Gjirokastër Uji i Ftohte 2002 32,82 III 22 Dibër Vlashaj 1996 50 III 23 Gjirokastër Zhej 1996 1.500 III 24 Berat Balloll 1977 330 IV 25 Lezhë Berzane 1977 880 IV 26 Berat Bogovë 1977 330 IV 27 Korça Cangonj 1977 250 IV 28 Elbasan Dardhe-Xhyre 1996 300 IV 29 Vlorë Karaburuni 1977 20.000 IV 30 Korça Krastafillak 1977 250 IV 31 Lezhë Kune-Vain-Tale 1977 4.393,21 IV 32 Elbasan Kuturman 1977 3.600 IV 33 Fier Levan (Kurora) 1977 200 IV 34 Shkodër Lake Shkodra 2005 26.535 IV 35 Lezhë Patok-Fushekuqe-Ishem 2010 5.000,7 IV 36 Fier Pishe Poro 1977 1.700 IV 37 Elbasan Polis 1996 45 IV 38 Elbasan Qafe Bushi 1977 500 IV
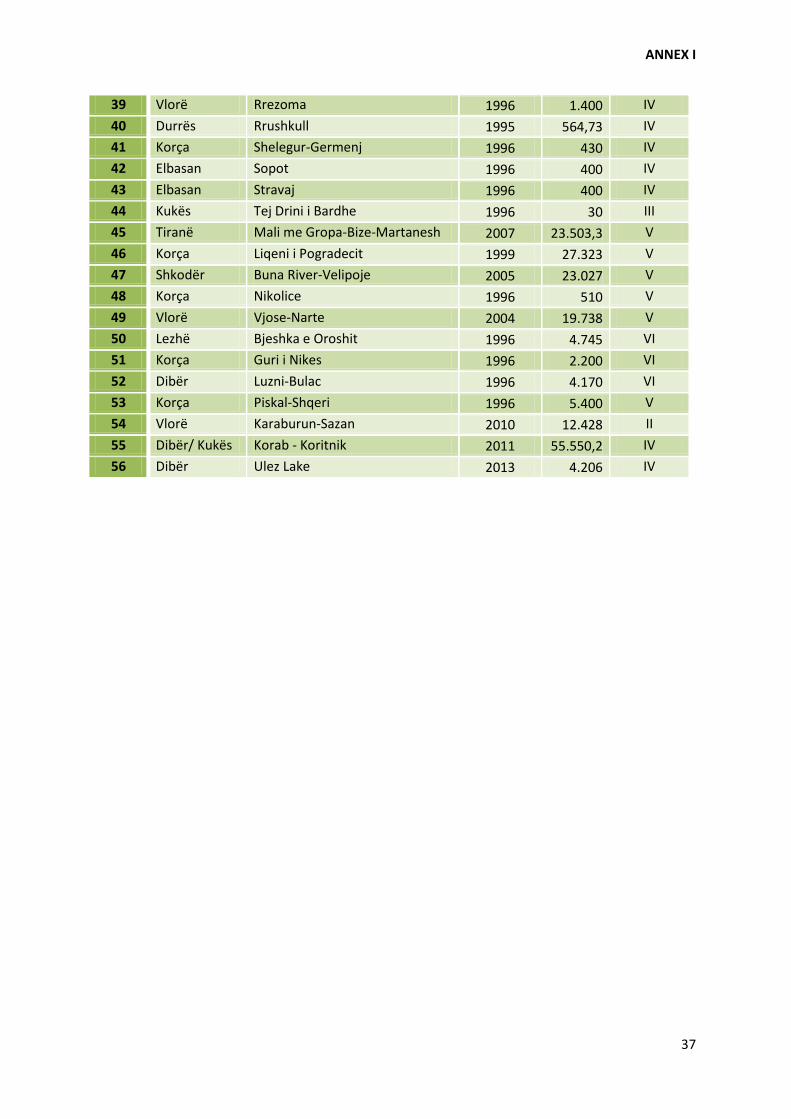
ANNEX I
37
39 Vlorë Rrezoma 1996 1.400 IV 40 Durrës Rrushkull 1995 564,73 IV 41 Korça Shelegur-Germenj 1996 430 IV 42 Elbasan Sopot 1996 400 IV 43 Elbasan Stravaj 1996 400 IV 44 Kukës Tej Drini i Bardhe 1996 30 III 45 Tiranë Mali me Gropa-Bize-Martanesh 2007 23.503,3 V 46 Korça Liqeni i Pogradecit 1999 27.323 V 47 Shkodër Buna River-Velipoje 2005 23.027 V 48 Korça Nikolice 1996 510 V 49 Vlorë Vjose-Narte 2004 19.738 V 50 Lezhë Bjeshka e Oroshit 1996 4.745 VI 51 Korça Guri i Nikes 1996 2.200 VI 52 Dibër Luzni-Bulac 1996 4.170 VI 53 Korça Piskal-Shqeri 1996 5.400 V 54 Vlorë Karaburun-Sazan 2010 12.428 II 55 Dibër/ Kukës Korab - Koritnik 2011 55.550,2 IV 56 Dibër Ulez Lake 2013 4.206 IV

ANNEX II
38
Quantification of protected areas threats: supplement to Data sheet 2
1. Residential and commercial development within a protected area Pressure Supporting data Unit 1. Housing and settlement Land use data (settlement), trend % (settlement
area/total area 2. Commercial and industrial areas Land use data (commercial or industrial
if available), trend %
3. Tourism and recreation infrastructure
Cadastre data (tourist infrastructure), trend
Number
2. Agriculture and aquaculture within a protected area
Pressure Supporting data Unit 2.1 Annual and perennial non-timber crop cultivation
Data from Regional Agriculture Directorate
% (cultivated area/total area)
2.1a Drug cultivation Data from Regional Agriculture Directorate
%
2.2 Wood and pulp plantations Data from Regional Agriculture Directorate
%
2.3 Livestock farming and grazing Data from Regional Agriculture Directorate, Directorate of Forests
% (pasture area/total area), Animal unit trend
2.4 Marine and freshwater aquaculture
Data from Regional Agriculture Directorate
Number & area
3. Energy production and mining within a protected area Pressure Supporting data Unit 3.2 Mining and quarrying Ministry of Environment/NEA
(Licensing), Directorate of Forests (area)
Number/area
3.3 Energy generation, including from hydropower dams
Ministry of Environment/NEA (Licensing)
Number, frequency
4. Transportation and service corridors within a protected area Pressure Supporting data Unit 4.1 Roads and railroads (include road-killed animals)
Road network layer (GIS), density, trends/plans
Km/ha by typology
4.2 Utility and service lines (e.g. electricity cables, telephone lines,)
OST and Telekom data if available Km/ha
4.3 Shipping lanes and canals Ministry of Transportation Km/ha 4.4 Flight paths Ministry of Transportation Number of
flights/day
5. Biological resource use and harm within a protected area Pressure Supporting data Unit 5.1 Hunting, killing and collecting terrestrial animals (including killing of animals as a result of human/wildlife conflict)
Environment inspectorate statistics, monitoring
Number of cases, number of traps,
5.2 Gathering terrestrial plants or plant products (non-timber)
Directorate of forests (contracts, statistics)
Number of licenses, quantity,

ANNEX II
39
typology 5.3 Logging and wood harvesting Directorate of forests (contracts,
statistics) Volume and area affected
5.4 Fishing, killing and harvesting aquatic resources
Ministry of Agriculture (Fishery) Quantity, number of fishermen
6. Human intrusions and disturbance within a protected area Pressure Supporting data Unit 6.1 Recreational activities and tourism
Tourism data (Ministry of Tourism), trend
Number of tourist, number of activities
6.2 War, civil unrest and military exercises
Land use (Military zones), type of activity
% area
6.3 Research, education and other work-related activities in protected areas
Monitoring, reports Number of activities
6.4 Activities of protected area managers (e.g. construction or vehicle use, artificial watering points and dams)
Reports Number and type of activities
6.5 Deliberate vandalism, destructive activities or threats to protected area staff and visitors
Monitoring, reports Number of events
7. Natural system modifications Pressure Supporting data Unit 7.1 Fire and fire suppression (including arson)
Directorate of Forests reports Number and area affected
7.2 Dams, hydrological modification and water management/use
Ministry of Environment Number and type of permissions/licenses, area
7.3a Increased fragmentation within protected area
Existing studies, monitoring Fragmentation index
7.3b Isolation from other natural habitat (e.g. deforestation, dams without effective aquatic wildlife passages)
Existing studies, monitoring Isolation index
7.3c Other ‘edge effects’ on park values
Existing studies, monitoring Index
7.3d Loss of keystone species (e.g. top predators, pollinators etc.)
Existing studies, monitoring Species richness
8. Invasive and other problematic species and genes Pressure Supporting data Unit 8.1 Invasive non-native/alien plants (weeds)
Existing studies Area, number, type
8.1a Invasive non-native/alien animals
Existing studies Number types
8.1b Pathogens (non-native or native but creating new/increased problems)
Existing studies Number of infections
8.2 Introduced genetic material (e.g. genetically modified organisms)
Existing studies

ANNEX II
40
9. Pollution entering or generated within protected area Pressure Supporting data Unit 9.1 Household sewage and urban waste water
Municipality data (are houses connected to a system)
Presence/absence, Typology,
9.1a Sewage and waste water from protected area facilities (e.g. toilets, hotels etc.)
Are facilities connected to a sewage system?
Presence/absence, Typology,
9.2 Industrial, mining and military effluents and discharges (e.g. poor water quality discharge from dams, e.g. unnatural temperatures, de-oxygenated, other pollution)
Monitoring Number and type of discharges
9.3 Agricultural and forestry effluents (e.g. excess fertilizers or pesticides)
Directorate of Agriculture (Data on fertilizers or pesticide use), chemical analysis
Quantity/area, presence of pollutants
9.4 Garbage and solid waste Is there a system for collecting, where are they deposited
Number of dumping sites
9.5 Air-borne pollutants Existing studies 9.6 Excess energy (e.g. heat pollution, lights etc.)
Existing studies
10. Geological events Pressure Supporting data Unit 10.1 Volcanoes N/A 10.2 Earthquakes/Tsunamis N/A 10.3 Avalanches/ Landslides Reports, monitoring Number and
severity of events 10.4 Erosion and siltation/ deposition (e.g. shoreline or riverbed changes)
Existing studies/monitoring Area affected, trend
11. Climate change and severe weather Pressure Supporting data Unit 11.1 Habitat shifting and alteration Existing studies 11.2 Droughts Existing studies 11.3 Temperature extremes Institute of Meteorology Temperature data 11.4 Storms and flooding Ministry of agriculture, Civil Emergency Number, area
affected, severity
12. Specific cultural and social threats Pressure Supporting data Unit 12.1 Loss of cultural links, traditional knowledge and/or management practices
Socio economic study
12.2 Natural deterioration of important cultural site values
Monitoring Number, quality
12.3 Destruction of cultural heritage buildings, gardens, sites etc.
Monitoring (statistics of events) Number

ANNEX III
41
Participants of the METT workshop, July 8-9, Hotel Dajti Tower, Dajti National Park
Name and Surname Title Unit Anila Sina Chief of Management Section RAPA, Berat Fatos Nako Director, RAPA RAPA, Berat Bekim Qosja Director RAPA, Diber Abdulla Hasanaj Chief of Management Section RAPA, Durres Naim Herri Director RAPA, Durres Fatmir Brazhda Director RAPA, Elbasan Enea Zenuni Chief of Management Section RAPA, Fier
Edmond Krisafi Chief of Management Section RAPA, Gjirokaster
Gligor Gjeci (Dushi) Director RAPA, Gjirokaster
Mihallaq Qirjo Director RAPA, Korça Vasil Male Chief of Management Section RAPA, Korça Besnik Hallaci Director RAPA, Kukës Blerant Lushaj Management expert RAPA, Kukës Pjeter Toni Director RAPA, Lezhë Tonin Ndreka Management expert RAPA, Lezhë Agim Dardha Director RAPA, Shkoder Tonin Macaj Management expert RAPA, Shkoder Ervin Jaupaj Chief of Management Section RAPA, Tirana Abdul Cucaj Chief of Management Section RAPA, Vlore Lorela Lazaj Director RAPA, Vlore Zamir Dedej General Director NAPA
Ardiana Petri Director of Management, Monitoring and Projects
NAPA
Sulejman Xhepa Chief of Management Section NAPA
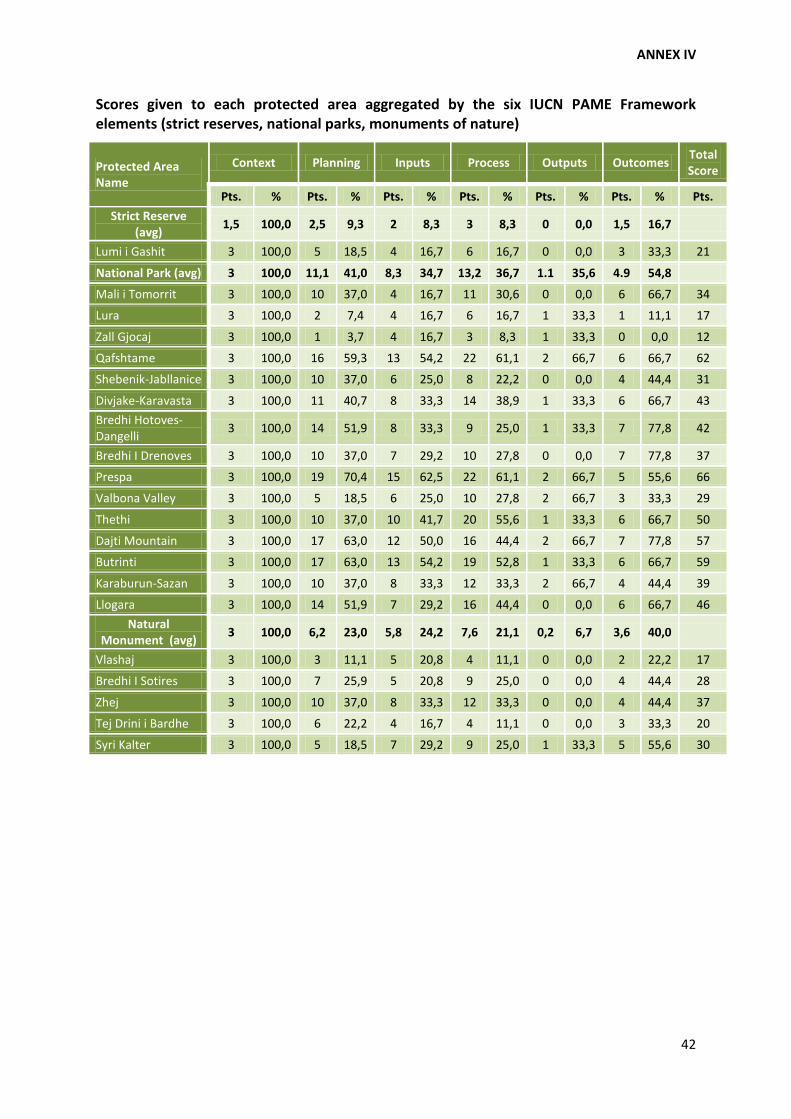
ANNEX IV
42
Scores given to each protected area aggregated by the six IUCN PAME Framework elements (strict reserves, national parks, monuments of nature)
Protected Area Name
Context Planning Inputs Process Outputs Outcomes Total Score
Pts. % Pts. % Pts. % Pts. % Pts. % Pts. % Pts. Strict Reserve
(avg) 1,5 100,0 2,5 9,3 2 8,3 3 8,3 0 0,0 1,5 16,7
Lumi i Gashit 3 100,0 5 18,5 4 16,7 6 16,7 0 0,0 3 33,3 21
National Park (avg) 3 100,0 11,1 41,0 8,3 34,7 13,2 36,7 1.1 35,6 4.9 54,8
Mali i Tomorrit 3 100,0 10 37,0 4 16,7 11 30,6 0 0,0 6 66,7 34
Lura 3 100,0 2 7,4 4 16,7 6 16,7 1 33,3 1 11,1 17
Zall Gjocaj 3 100,0 1 3,7 4 16,7 3 8,3 1 33,3 0 0,0 12
Qafshtame 3 100,0 16 59,3 13 54,2 22 61,1 2 66,7 6 66,7 62
Shebenik-Jabllanice 3 100,0 10 37,0 6 25,0 8 22,2 0 0,0 4 44,4 31
Divjake-Karavasta 3 100,0 11 40,7 8 33,3 14 38,9 1 33,3 6 66,7 43 Bredhi Hotoves-Dangelli 3 100,0 14 51,9 8 33,3 9 25,0 1 33,3 7 77,8 42
Bredhi I Drenoves 3 100,0 10 37,0 7 29,2 10 27,8 0 0,0 7 77,8 37
Prespa 3 100,0 19 70,4 15 62,5 22 61,1 2 66,7 5 55,6 66
Valbona Valley 3 100,0 5 18,5 6 25,0 10 27,8 2 66,7 3 33,3 29
Thethi 3 100,0 10 37,0 10 41,7 20 55,6 1 33,3 6 66,7 50
Dajti Mountain 3 100,0 17 63,0 12 50,0 16 44,4 2 66,7 7 77,8 57
Butrinti 3 100,0 17 63,0 13 54,2 19 52,8 1 33,3 6 66,7 59
Karaburun-Sazan 3 100,0 10 37,0 8 33,3 12 33,3 2 66,7 4 44,4 39
Llogara 3 100,0 14 51,9 7 29,2 16 44,4 0 0,0 6 66,7 46 Natural
Monument (avg) 3 100,0 6,2 23,0 5,8 24,2 7,6 21,1 0,2 6,7 3,6 40,0
Vlashaj 3 100,0 3 11,1 5 20,8 4 11,1 0 0,0 2 22,2 17
Bredhi I Sotires 3 100,0 7 25,9 5 20,8 9 25,0 0 0,0 4 44,4 28
Zhej 3 100,0 10 37,0 8 33,3 12 33,3 0 0,0 4 44,4 37
Tej Drini i Bardhe 3 100,0 6 22,2 4 16,7 4 11,1 0 0,0 3 33,3 20
Syri Kalter 3 100,0 5 18,5 7 29,2 9 25,0 1 33,3 5 55,6 30
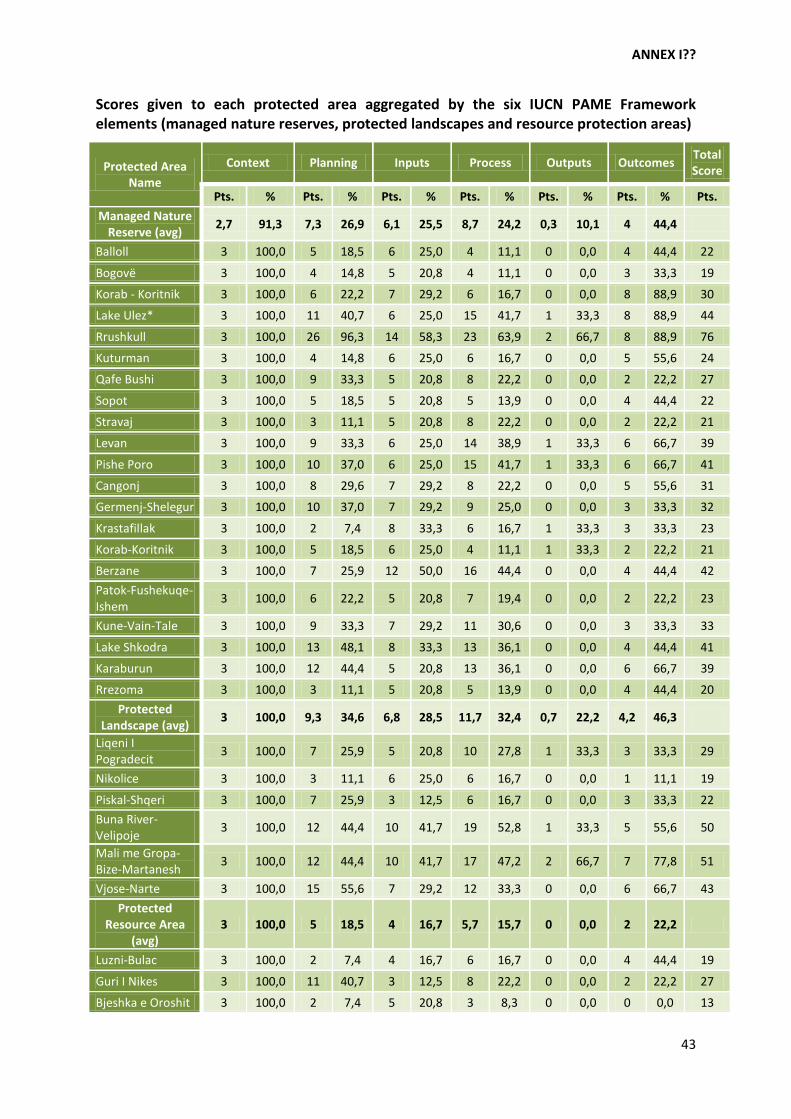
ANNEX I??
43
Scores given to each protected area aggregated by the six IUCN PAME Framework elements (managed nature reserves, protected landscapes and resource protection areas)
Protected Area Name
Context Planning Inputs Process Outputs Outcomes Total Score
Pts. % Pts. % Pts. % Pts. % Pts. % Pts. % Pts. Managed Nature
Reserve (avg) 2,7 91,3 7,3 26,9 6,1 25,5 8,7 24,2 0,3 10,1 4 44,4
Balloll 3 100,0 5 18,5 6 25,0 4 11,1 0 0,0 4 44,4 22
Bogovë 3 100,0 4 14,8 5 20,8 4 11,1 0 0,0 3 33,3 19
Korab - Koritnik 3 100,0 6 22,2 7 29,2 6 16,7 0 0,0 8 88,9 30
Lake Ulez* 3 100,0 11 40,7 6 25,0 15 41,7 1 33,3 8 88,9 44
Rrushkull 3 100,0 26 96,3 14 58,3 23 63,9 2 66,7 8 88,9 76
Kuturman 3 100,0 4 14,8 6 25,0 6 16,7 0 0,0 5 55,6 24
Qafe Bushi 3 100,0 9 33,3 5 20,8 8 22,2 0 0,0 2 22,2 27
Sopot 3 100,0 5 18,5 5 20,8 5 13,9 0 0,0 4 44,4 22
Stravaj 3 100,0 3 11,1 5 20,8 8 22,2 0 0,0 2 22,2 21
Levan 3 100,0 9 33,3 6 25,0 14 38,9 1 33,3 6 66,7 39
Pishe Poro 3 100,0 10 37,0 6 25,0 15 41,7 1 33,3 6 66,7 41
Cangonj 3 100,0 8 29,6 7 29,2 8 22,2 0 0,0 5 55,6 31
Germenj-Shelegur 3 100,0 10 37,0 7 29,2 9 25,0 0 0,0 3 33,3 32
Krastafillak 3 100,0 2 7,4 8 33,3 6 16,7 1 33,3 3 33,3 23
Korab-Koritnik 3 100,0 5 18,5 6 25,0 4 11,1 1 33,3 2 22,2 21
Berzane 3 100,0 7 25,9 12 50,0 16 44,4 0 0,0 4 44,4 42 Patok-Fushekuqe-Ishem 3 100,0 6 22,2 5 20,8 7 19,4 0 0,0 2 22,2 23
Kune-Vain-Tale 3 100,0 9 33,3 7 29,2 11 30,6 0 0,0 3 33,3 33
Lake Shkodra 3 100,0 13 48,1 8 33,3 13 36,1 0 0,0 4 44,4 41
Karaburun 3 100,0 12 44,4 5 20,8 13 36,1 0 0,0 6 66,7 39
Rrezoma 3 100,0 3 11,1 5 20,8 5 13,9 0 0,0 4 44,4 20 Protected
Landscape (avg) 3 100,0 9,3 34,6 6,8 28,5 11,7 32,4 0,7 22,2 4,2 46,3
Liqeni I Pogradecit 3 100,0 7 25,9 5 20,8 10 27,8 1 33,3 3 33,3 29
Nikolice 3 100,0 3 11,1 6 25,0 6 16,7 0 0,0 1 11,1 19
Piskal-Shqeri 3 100,0 7 25,9 3 12,5 6 16,7 0 0,0 3 33,3 22 Buna River-Velipoje 3 100,0 12 44,4 10 41,7 19 52,8 1 33,3 5 55,6 50
Mali me Gropa-Bize-Martanesh 3 100,0 12 44,4 10 41,7 17 47,2 2 66,7 7 77,8 51
Vjose-Narte 3 100,0 15 55,6 7 29,2 12 33,3 0 0,0 6 66,7 43 Protected
Resource Area (avg)
3 100,0 5 18,5 4 16,7 5,7 15,7 0 0,0 2 22,2
Luzni-Bulac 3 100,0 2 7,4 4 16,7 6 16,7 0 0,0 4 44,4 19
Guri I Nikes 3 100,0 11 40,7 3 12,5 8 22,2 0 0,0 2 22,2 27
Bjeshka e Oroshit 3 100,0 2 7,4 5 20,8 3 8,3 0 0,0 0 0,0 13
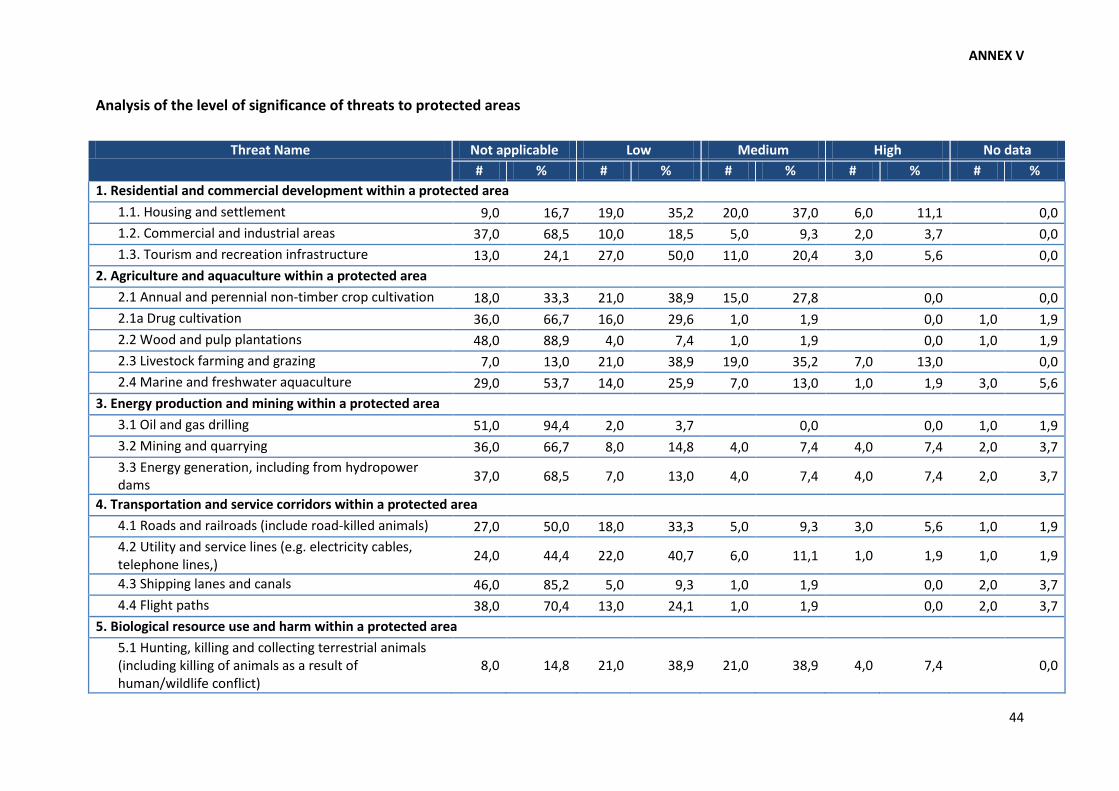
ANNEX V
44
Analysis of the level of significance of threats to protected areas
Threat Name Not applicable Low Medium High No data
# % # % # % # % # % 1. Residential and commercial development within a protected area
1.1. Housing and settlement 9,0 16,7 19,0 35,2 20,0 37,0 6,0 11,1 0,0 1.2. Commercial and industrial areas 37,0 68,5 10,0 18,5 5,0 9,3 2,0 3,7 0,0 1.3. Tourism and recreation infrastructure 13,0 24,1 27,0 50,0 11,0 20,4 3,0 5,6 0,0
2. Agriculture and aquaculture within a protected area 2.1 Annual and perennial non-timber crop cultivation 18,0 33,3 21,0 38,9 15,0 27,8 0,0 0,0 2.1a Drug cultivation 36,0 66,7 16,0 29,6 1,0 1,9 0,0 1,0 1,9 2.2 Wood and pulp plantations 48,0 88,9 4,0 7,4 1,0 1,9 0,0 1,0 1,9 2.3 Livestock farming and grazing 7,0 13,0 21,0 38,9 19,0 35,2 7,0 13,0 0,0 2.4 Marine and freshwater aquaculture 29,0 53,7 14,0 25,9 7,0 13,0 1,0 1,9 3,0 5,6
3. Energy production and mining within a protected area 3.1 Oil and gas drilling 51,0 94,4 2,0 3,7 0,0 0,0 1,0 1,9 3.2 Mining and quarrying 36,0 66,7 8,0 14,8 4,0 7,4 4,0 7,4 2,0 3,7 3.3 Energy generation, including from hydropower dams 37,0 68,5 7,0 13,0 4,0 7,4 4,0 7,4 2,0 3,7
4. Transportation and service corridors within a protected area 4.1 Roads and railroads (include road-killed animals) 27,0 50,0 18,0 33,3 5,0 9,3 3,0 5,6 1,0 1,9 4.2 Utility and service lines (e.g. electricity cables, telephone lines,) 24,0 44,4 22,0 40,7 6,0 11,1 1,0 1,9 1,0 1,9
4.3 Shipping lanes and canals 46,0 85,2 5,0 9,3 1,0 1,9 0,0 2,0 3,7 4.4 Flight paths 38,0 70,4 13,0 24,1 1,0 1,9 0,0 2,0 3,7
5. Biological resource use and harm within a protected area 5.1 Hunting, killing and collecting terrestrial animals (including killing of animals as a result of human/wildlife conflict)
8,0 14,8 21,0 38,9 21,0 38,9 4,0 7,4 0,0

ANNEX V
45
Threat Name Not applicable Low Medium High No data # % # % # % # % # %
5.2 Gathering terrestrial plants or plant products (non-timber) 7,0 13,0 28,0 51,9 17,0 31,5 2,0 3,7 0,0
5.3 Logging and wood harvesting 10,0 18,5 18,0 33,3 12,0 22,2 14,0 25,9 0,0 5.4 Fishing, killing and harvesting aquatic resources 22,0 40,7 18,0 33,3 8,0 14,8 4,0 7,4 2,0 3,7
6. Human intrusions and disturbance within a protected area 6.1 Recreational activities and tourism 13,0 24,1 26,0 48,1 11,0 20,4 3,0 5,6 1,0 1,9 6.2 War, civil unrest and military exercises 46,0 85,2 5,0 9,3 3,0 5,6 0,0 0,0 6.3 Research, education and other work-related activities in protected areas 20,0 37,0 29,0 53,7 3,0 5,6 0,0 2,0 3,7
6.4 Activities of protected area managers (e.g. construction or vehicle use, artificial watering points and dams)
18,0 33,3 29,0 53,7 3,0 5,6 3,0 5,6 1,0 1,9
6.5 Deliberate vandalism, destructive activities or threats to protected area staff and visitors 23,0 42,6 23,0 42,6 4,0 7,4 3,0 5,6 1,0 1,9
7. Natural system modifications 7.1 Fire and fire suppression (including arson) 2,0 3,7 21,0 38,9 16,0 29,6 12,0 22,2 3,0 5,6 7.2 Dams, hydrological modification and water management/use 24,0 44,4 16,0 29,6 3,0 5,6 8,0 14,8 3,0 5,6
7.3a Increased fragmentation within protected area 19,0 35,2 19,0 35,2 10,0 18,5 3,0 5,6 3,0 5,6 7.3b Isolation from other natural habitat (e.g. deforestation, dams without effective aquatic wildlife passages)
22,0 40,7 18,0 33,3 8,0 14,8 3,0 5,6 3,0 5,6
7.3c Other ‘edge effects’ on park values 17,0 31,5 23,0 42,6 7,0 13,0 4,0 7,4 3,0 5,6 7.3d Loss of keystone species (e.g. top predators, pollinators, etc.) 9,0 16,7 24,0 44,4 16,0 29,6 2,0 3,7 3,0 5,6
8. Invasive and other problematic species and genes 8.1 Invasive non-native/alien plants (e.g. weeds) 24,0 44,4 21,0 38,9 5,0 9,3 2,0 3,7 2,0 3,7 8.1a Invasive non-native/alien animals 34,0 63,0 14,0 25,9 3,0 5,6 1,0 1,9 2,0 3,7

ANNEX V
46
Threat Name Not applicable Low Medium High No data # % # % # % # % # %
8.1b Pathogens (non-native or native but creating new/increased problems) 37,0 68,5 13,0 24,1 2,0 3,7 0,0 2,0 3,7
8.2 Introduced genetic material (e.g. genetically modified organisms) 43,0 79,6 8,0 14,8 0,0 0,0 3,0 5,6
9. Pollution entering or generated within protected area 9.1 Household sewage and urban waste water 24,0 44,4 17,0 31,5 11,0 20,4 2,0 3,7 0,0 9.1a Sewage and waste water from protected area facilities (e.g. toilets, hotels, etc.) 30,0 55,6 17,0 31,5 6,0 11,1 1,0 1,9 0,0
9.2 Industrial, mining and military effluents and discharges (e.g. poor water quality discharge from dams, e.g. unnatural temperatures, de-oxygenated, other pollution)
41,0 75,9 9,0 16,7 3,0 5,6 1,0 1,9 0,0
9.3 Agricultural and forestry effluents (e.g. excess fertilizers or pesticides) 33,0 61,1 17,0 31,5 2,0 3,7 0,0 2,0 3,7
9.4 Garbage and solid waste 17,0 31,5 19,0 35,2 14,0 25,9 4,0 7,4 0,0 9.5 Air-borne pollutants 28,0 51,9 22,0 40,7 3,0 5,6 0,0 1,0 1,9 9.6 Excess energy (e.g. heat pollution, lights, etc.) 41,0 75,9 13,0 24,1 0,0 0,0 0,0
10. Geological events 10.1 Volcanoes 54,0 100,0 0,0 0,0 0,0 0,0 10.2 Earthquakes/Tsunamis 48,0 88,9 4,0 7,4 2,0 3,7 0,0 0,0 10.3 Avalanches/Landslides 26,0 48,1 20,0 37,0 7,0 13,0 1,0 1,9 0,0 10.4 Erosion and siltation/deposition (e.g. shoreline or riverbed changes) 7,0 13,0 28,0 51,9 10,0 18,5 8,0 14,8 1,0 1,9
11. Climate change and severe weather 11.1 Habitat shifting and alteration 19,0 35,2 27,0 50,0 7,0 13,0 0,0 1,0 1,9 11.2 Droughts 11,0 20,4 25,0 46,3 16,0 29,6 0,0 2,0 3,7 11.3 Temperature extremes 17,0 31,5 25,0 46,3 11,0 20,4 1,0 1,9 0,0
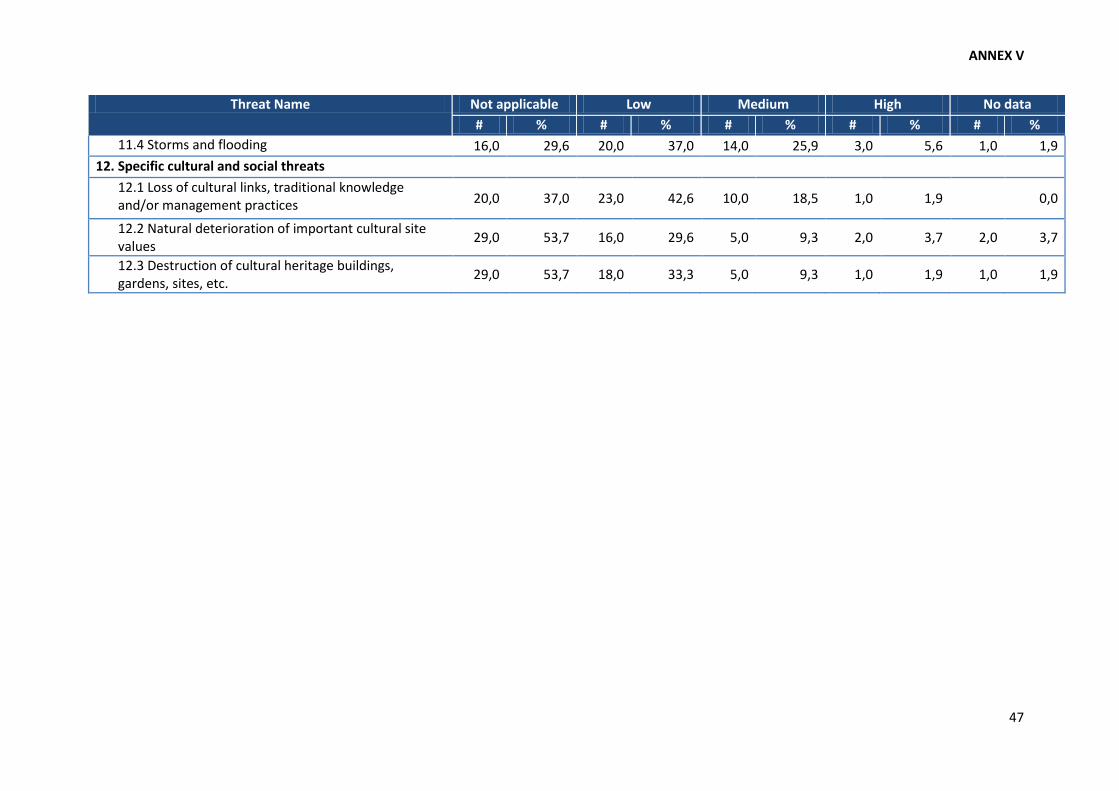
ANNEX V
47
Threat Name Not applicable Low Medium High No data # % # % # % # % # %
11.4 Storms and flooding 16,0 29,6 20,0 37,0 14,0 25,9 3,0 5,6 1,0 1,9 12. Specific cultural and social threats
12.1 Loss of cultural links, traditional knowledge and/or management practices 20,0 37,0 23,0 42,6 10,0 18,5 1,0 1,9 0,0
12.2 Natural deterioration of important cultural site values 29,0 53,7 16,0 29,6 5,0 9,3 2,0 3,7 2,0 3,7
12.3 Destruction of cultural heritage buildings, gardens, sites, etc. 29,0 53,7 18,0 33,3 5,0 9,3 1,0 1,9 1,0 1,9
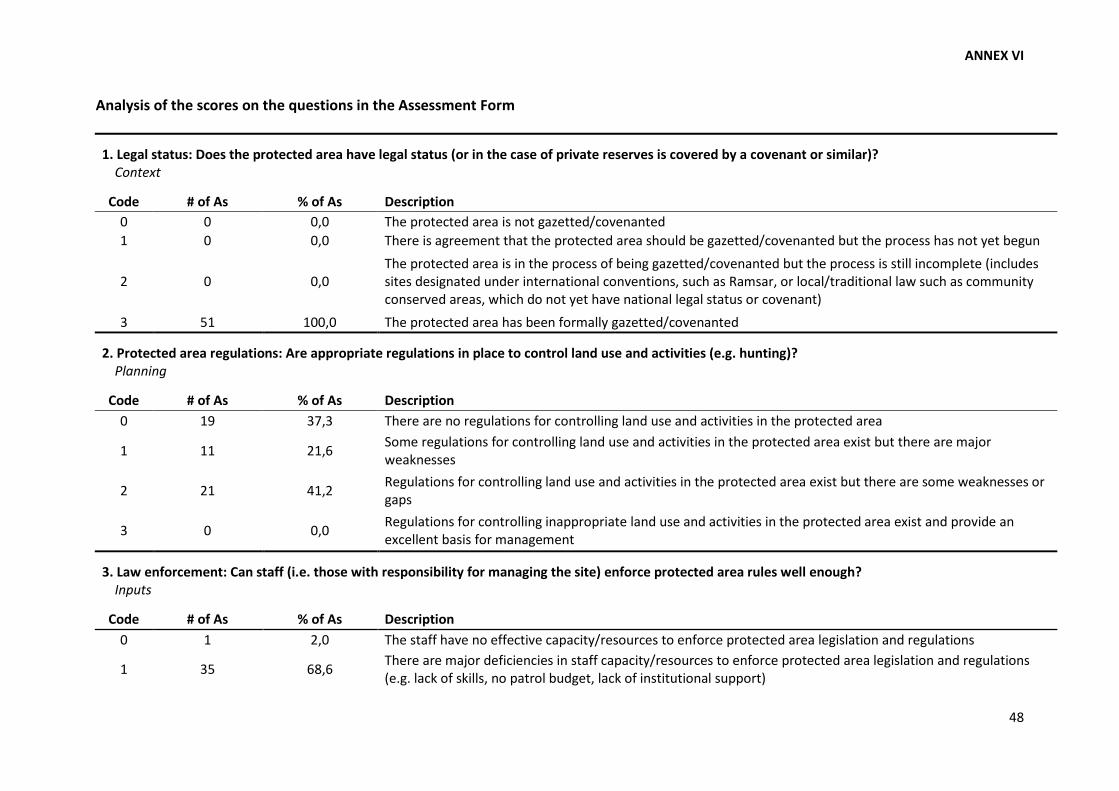
ANNEX VI
48
Analysis of the scores on the questions in the Assessment Form
1. Legal status: Does the protected area have legal status (or in the case of private reserves is covered by a covenant or similar)? Context
Code # of As % of As Description 0 0 0,0 The protected area is not gazetted/covenanted 1 0 0,0 There is agreement that the protected area should be gazetted/covenanted but the process has not yet begun
2 0 0,0 The protected area is in the process of being gazetted/covenanted but the process is still incomplete (includes sites designated under international conventions, such as Ramsar, or local/traditional law such as community conserved areas, which do not yet have national legal status or covenant)
3 51 100,0 The protected area has been formally gazetted/covenanted
2. Protected area regulations: Are appropriate regulations in place to control land use and activities (e.g. hunting)? Planning
Code # of As % of As Description 0 19 37,3 There are no regulations for controlling land use and activities in the protected area
1 11 21,6 Some regulations for controlling land use and activities in the protected area exist but there are major weaknesses
2 21 41,2 Regulations for controlling land use and activities in the protected area exist but there are some weaknesses or gaps
3 0 0,0 Regulations for controlling inappropriate land use and activities in the protected area exist and provide an excellent basis for management
3. Law enforcement: Can staff (i.e. those with responsibility for managing the site) enforce protected area rules well enough? Inputs
Code # of As % of As Description 0 1 2,0 The staff have no effective capacity/resources to enforce protected area legislation and regulations
1 35 68,6 There are major deficiencies in staff capacity/resources to enforce protected area legislation and regulations (e.g. lack of skills, no patrol budget, lack of institutional support)

ANNEX VI
49
2 14 27,5 The staff have acceptable capacity/resources to enforce protected area legislation and regulations but some deficiencies remain
3 1 2,0 The staff have excellent capacity/resources to enforce protected area legislation and regulations
4. Protected area objectives: Is management undertaken according to agreed objectives? Planning
Code # of As % of As Description 0 21 41,2 No firm objectives have been agreed for the protected area 1 12 23,5 The protected area has agreed objectives, but is not managed according to these objectives 2 16 31,4 The protected area has agreed objectives, but is only partially managed according to these objectives 3 2 3,9 The protected area has agreed objectives and is managed to meet these objectives
5. Protected area design: Is the protected area the right size and shape to protect species, habitats, ecological processes and water catchments of key conservation concern?
Planning Code # of As % of As Description
0 13 25,5 Inadequacies in protected area design mean achieving the major objectives of the protected area is very difficult
1 10 19,6 Inadequacies in protected area design mean that achievement of major objectives is difficult but some mitigating actions are being taken (e.g. agreements with adjacent land owners for wildlife corridors or introduction of appropriate catchment management)
2 18 35,3 Protected area design is not significantly constraining achievement of objectives, but could be improved (e.g. with respect to larger scale ecological processes)
3 10 19,6 Protected area design helps achievement of objectives; it is appropriate for species and habitat conservation; and maintains ecological processes such as surface and groundwater flows at a catchment scale, natural disturbance patterns etc.
6. Protected area boundary demarcation: Is the boundary known and demarcated? Process
Code # of As % of As Description
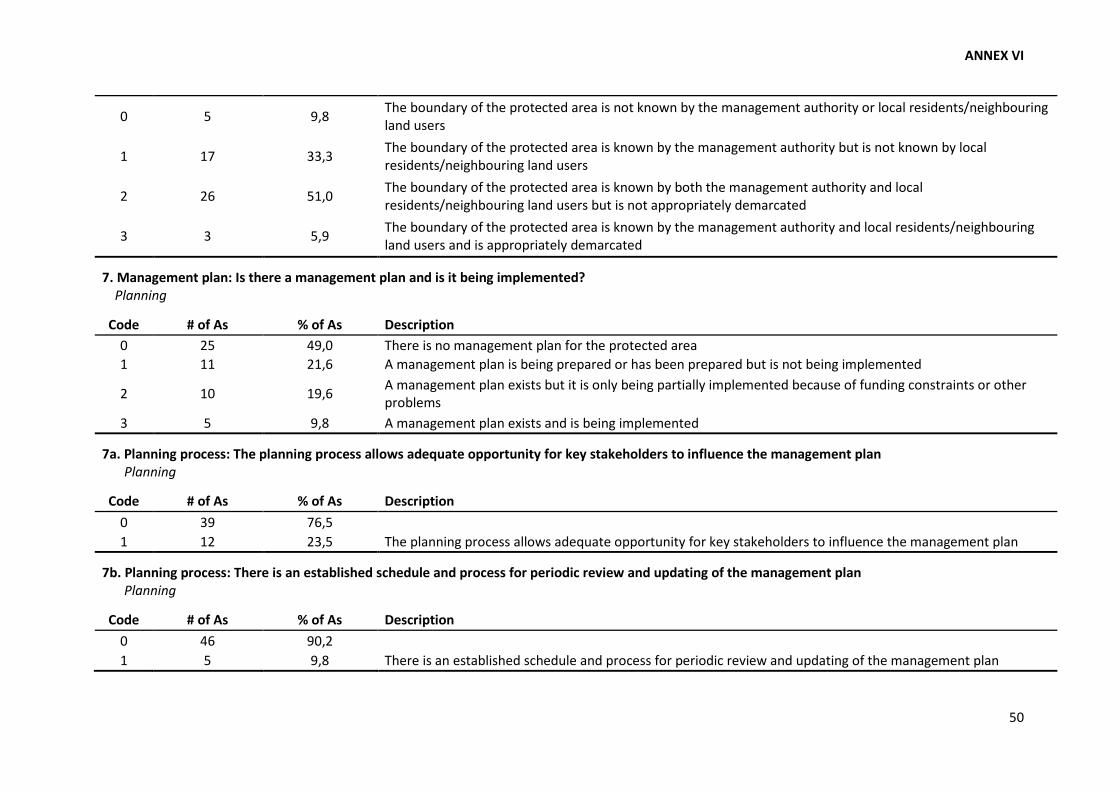
ANNEX VI
50
0 5 9,8 The boundary of the protected area is not known by the management authority or local residents/neighbouring land users
1 17 33,3 The boundary of the protected area is known by the management authority but is not known by local residents/neighbouring land users
2 26 51,0 The boundary of the protected area is known by both the management authority and local residents/neighbouring land users but is not appropriately demarcated
3 3 5,9 The boundary of the protected area is known by the management authority and local residents/neighbouring land users and is appropriately demarcated
7. Management plan: Is there a management plan and is it being implemented? Planning
Code # of As % of As Description 0 25 49,0 There is no management plan for the protected area 1 11 21,6 A management plan is being prepared or has been prepared but is not being implemented
2 10 19,6 A management plan exists but it is only being partially implemented because of funding constraints or other problems
3 5 9,8 A management plan exists and is being implemented
7a. Planning process: The planning process allows adequate opportunity for key stakeholders to influence the management plan Planning
Code # of As % of As Description 0 39 76,5 1 12 23,5 The planning process allows adequate opportunity for key stakeholders to influence the management plan
7b. Planning process: There is an established schedule and process for periodic review and updating of the management plan Planning
Code # of As % of As Description 0 46 90,2 1 5 9,8 There is an established schedule and process for periodic review and updating of the management plan

ANNEX VI
51
7c. Planning process: The results of monitoring, research and evaluation are routinely incorporated into planning Planning
Code # of As % of As Description 0 44 86,3 1 7 13,7 The results of monitoring, research and evaluation are routinely incorporated into planning
8. Regular work plan: Is there a regular work plan and is it being implemented Planning/Outputs
Code # of As % of As Description 0 15 29,4 No regular work plan exists 1 17 33,3 A regular work plan exists but few of the activities are implemented 2 15 29,4 A regular work plan exists and many activities are implemented 3 4 7,8 A regular work plan exists and all activities are implemented
9. Resource inventory: Do you have enough information to manage the area? Inputs
Code # of As % of As Description
0 5 9,8 There is little or no information available on the critical habitats, species and cultural values of the protected area
1 23 45,1 Information on the critical habitats, species, ecological processes and cultural values of the protected area is not sufficient to support planning and decision making
2 15 29,4 Information on the critical habitats, species, ecological processes and cultural values of the protected area is sufficient for most key areas of planning and decision making
3 8 15,7 Information on the critical habitats, species, ecological processes and cultural values of the protected area is sufficient to support all areas of planning and decision making
10. Protection systems: Are systems in place to control access/resource use in the protected area? Process/Outcome
Code # of As % of As Description
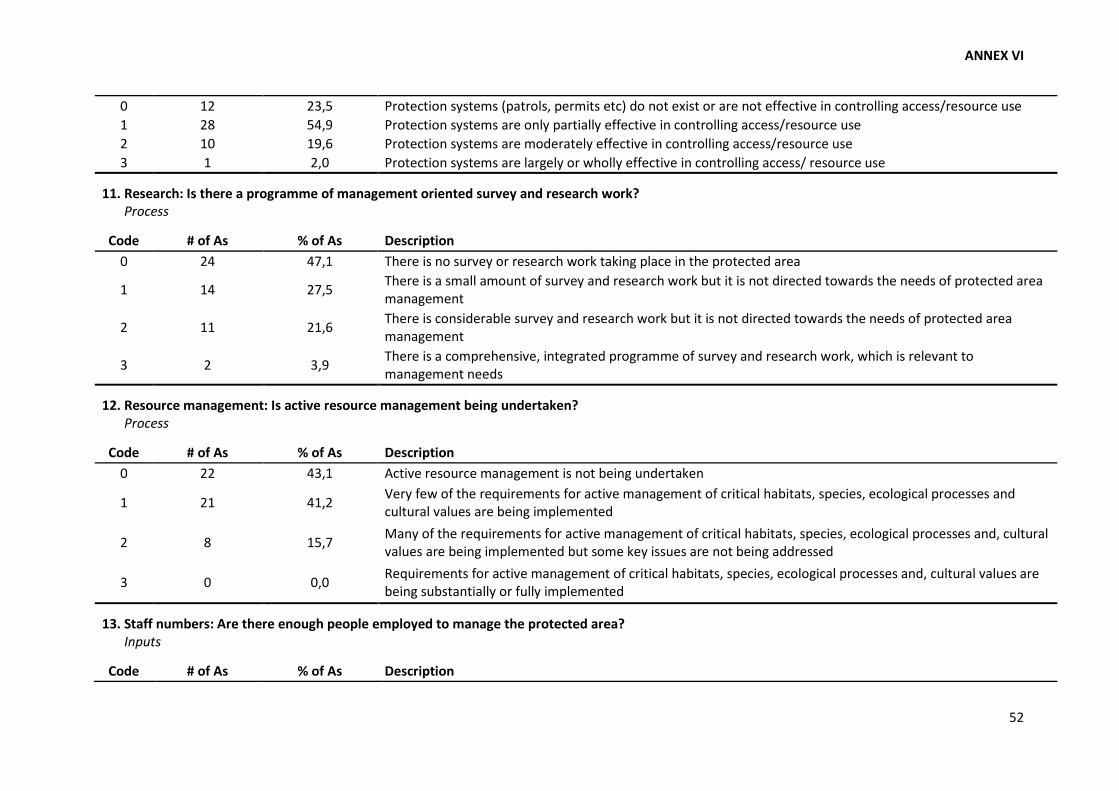
ANNEX VI
52
0 12 23,5 Protection systems (patrols, permits etc) do not exist or are not effective in controlling access/resource use 1 28 54,9 Protection systems are only partially effective in controlling access/resource use 2 10 19,6 Protection systems are moderately effective in controlling access/resource use 3 1 2,0 Protection systems are largely or wholly effective in controlling access/ resource use
11. Research: Is there a programme of management oriented survey and research work? Process
Code # of As % of As Description 0 24 47,1 There is no survey or research work taking place in the protected area
1 14 27,5 There is a small amount of survey and research work but it is not directed towards the needs of protected area management
2 11 21,6 There is considerable survey and research work but it is not directed towards the needs of protected area management
3 2 3,9 There is a comprehensive, integrated programme of survey and research work, which is relevant to management needs
12. Resource management: Is active resource management being undertaken? Process
Code # of As % of As Description 0 22 43,1 Active resource management is not being undertaken
1 21 41,2 Very few of the requirements for active management of critical habitats, species, ecological processes and cultural values are being implemented
2 8 15,7 Many of the requirements for active management of critical habitats, species, ecological processes and, cultural values are being implemented but some key issues are not being addressed
3 0 0,0 Requirements for active management of critical habitats, species, ecological processes and, cultural values are being substantially or fully implemented
13. Staff numbers: Are there enough people employed to manage the protected area? Inputs
Code # of As % of As Description

ANNEX VI
53
0 2 3,9 There are no staff 1 12 23,5 Staff numbers are inadequate for critical management activities 2 28 54,9 Staff numbers are below optimum level for critical management activities 3 9 17,6 Staff numbers are adequate for the management needs of the protected area
14. Staff training: Are staff adequately trained to fulfil management objectives? Inputs/Process
Code # of As % of As Description 0 3 5,9 Staff lack the skills needed for protected area management 1 36 70,6 Staff training and skills are low relative to the needs of the protected area
2 11 21,6 Staff training and skills are adequate, but could be further improved to fully achieve the objectives of management
3 1 2,0 Staff training and skills are aligned with the management needs of the protected area
15. Current budget: Is the current budget sufficient? Inputs
Code # of As % of As Description 0 41 80,4 There is no budget for management of the protected area
1 9 17,6 The available budget is inadequate for basic management needs and presents a serious constraint to the capacity to manage
2 1 2,0 The available budget is acceptable but could be further improved to fully achieve effective management 3 0 0,0 The available budget is sufficient and meets the full management needs of the protected area
16. Security of budget: Is the budget secure? Inputs
Code # of As % of As Description
0 38 74,5 There is no secure budget for the protected area and management is wholly reliant on outside or highly variable funding
1 13 25,5 There is very little secure budget and the protected area could not function adequately without outside funding
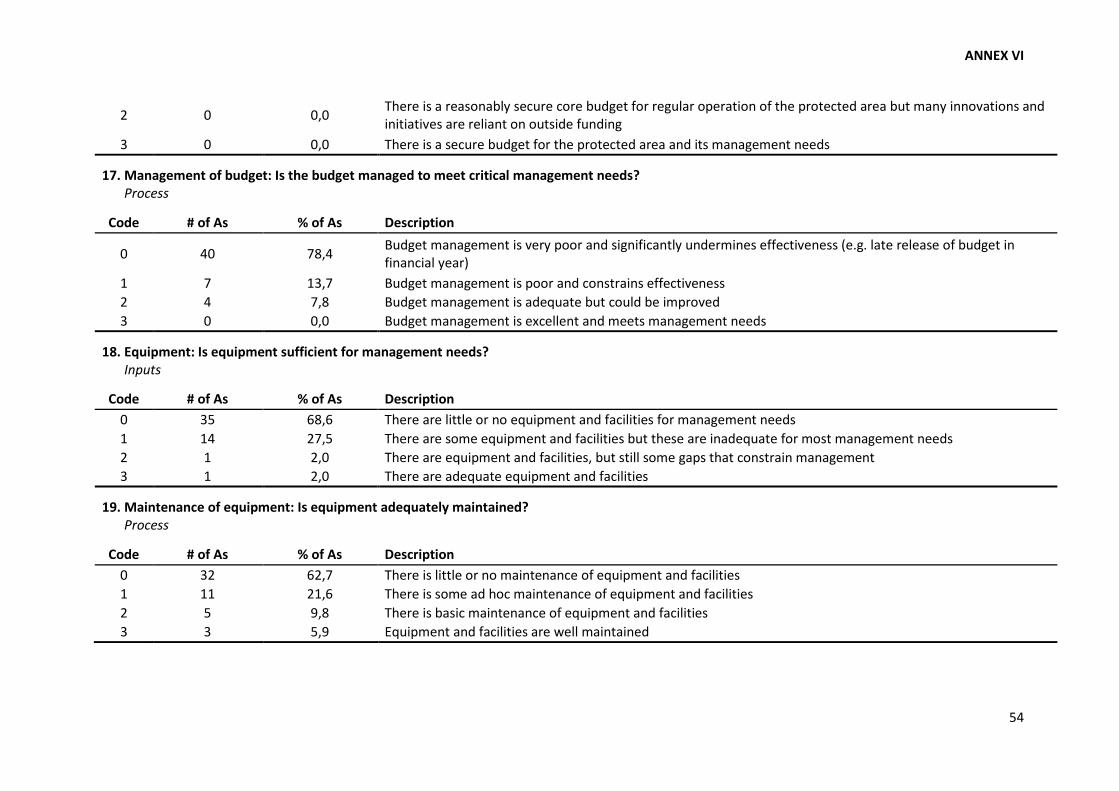
ANNEX VI
54
2 0 0,0 There is a reasonably secure core budget for regular operation of the protected area but many innovations and initiatives are reliant on outside funding
3 0 0,0 There is a secure budget for the protected area and its management needs
17. Management of budget: Is the budget managed to meet critical management needs? Process
Code # of As % of As Description
0 40 78,4 Budget management is very poor and significantly undermines effectiveness (e.g. late release of budget in financial year)
1 7 13,7 Budget management is poor and constrains effectiveness 2 4 7,8 Budget management is adequate but could be improved 3 0 0,0 Budget management is excellent and meets management needs
18. Equipment: Is equipment sufficient for management needs? Inputs
Code # of As % of As Description 0 35 68,6 There are little or no equipment and facilities for management needs 1 14 27,5 There are some equipment and facilities but these are inadequate for most management needs 2 1 2,0 There are equipment and facilities, but still some gaps that constrain management 3 1 2,0 There are adequate equipment and facilities
19. Maintenance of equipment: Is equipment adequately maintained? Process
Code # of As % of As Description 0 32 62,7 There is little or no maintenance of equipment and facilities 1 11 21,6 There is some ad hoc maintenance of equipment and facilities 2 5 9,8 There is basic maintenance of equipment and facilities 3 3 5,9 Equipment and facilities are well maintained
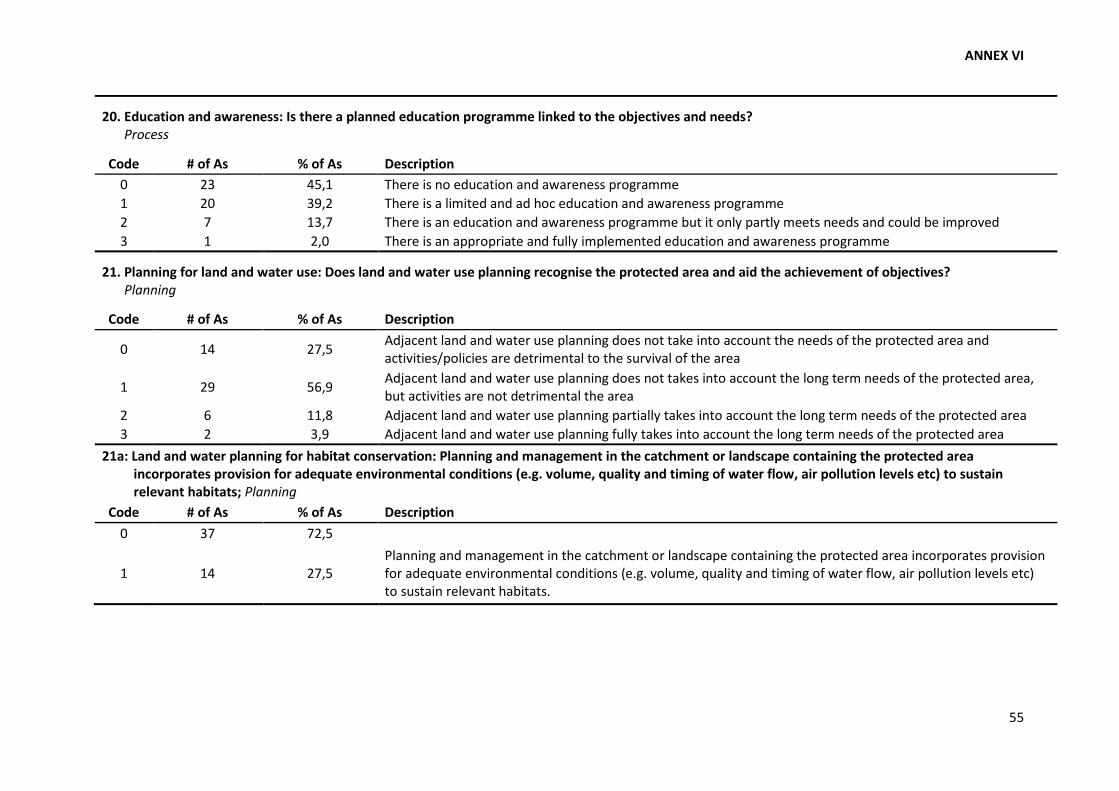
ANNEX VI
55
20. Education and awareness: Is there a planned education programme linked to the objectives and needs? Process
Code # of As % of As Description 0 23 45,1 There is no education and awareness programme 1 20 39,2 There is a limited and ad hoc education and awareness programme 2 7 13,7 There is an education and awareness programme but it only partly meets needs and could be improved 3 1 2,0 There is an appropriate and fully implemented education and awareness programme
21. Planning for land and water use: Does land and water use planning recognise the protected area and aid the achievement of objectives? Planning
Code # of As % of As Description
0 14 27,5 Adjacent land and water use planning does not take into account the needs of the protected area and activities/policies are detrimental to the survival of the area
1 29 56,9 Adjacent land and water use planning does not takes into account the long term needs of the protected area, but activities are not detrimental the area
2 6 11,8 Adjacent land and water use planning partially takes into account the long term needs of the protected area 3 2 3,9 Adjacent land and water use planning fully takes into account the long term needs of the protected area
21a: Land and water planning for habitat conservation: Planning and management in the catchment or landscape containing the protected area incorporates provision for adequate environmental conditions (e.g. volume, quality and timing of water flow, air pollution levels etc) to sustain relevant habitats; Planning
Code # of As % of As Description 0 37 72,5
1 14 27,5 Planning and management in the catchment or landscape containing the protected area incorporates provision for adequate environmental conditions (e.g. volume, quality and timing of water flow, air pollution levels etc) to sustain relevant habitats.
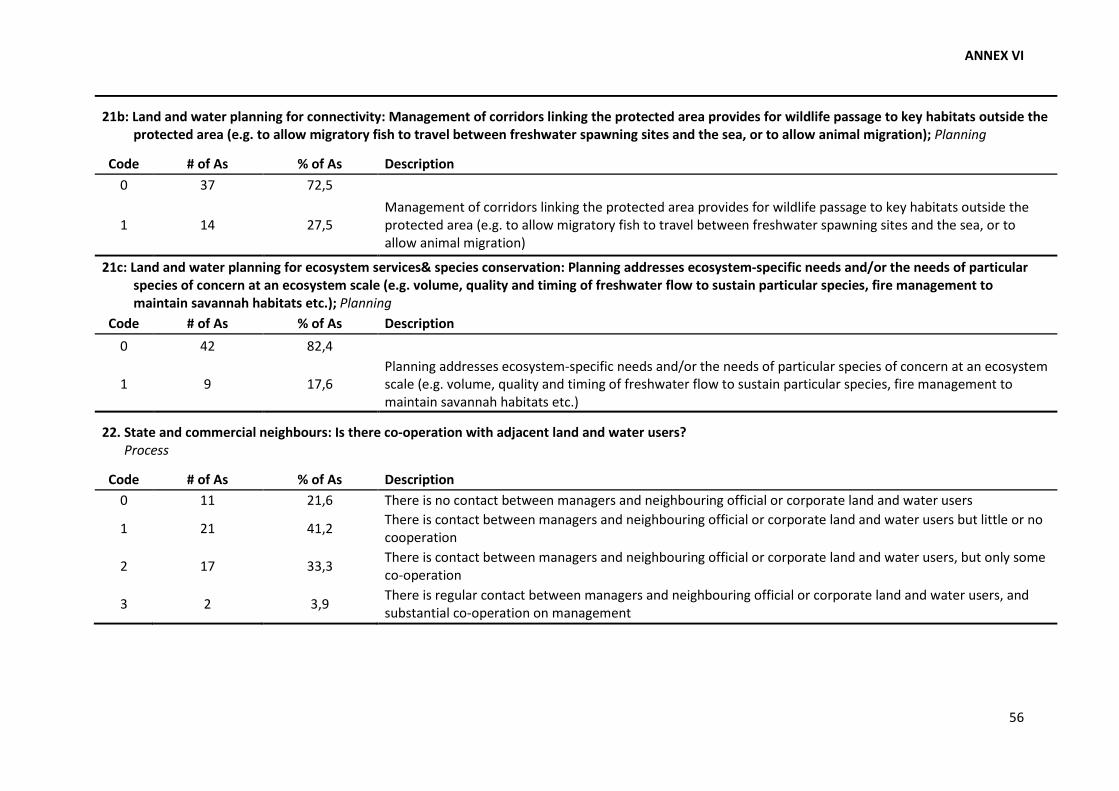
ANNEX VI
56
21b: Land and water planning for connectivity: Management of corridors linking the protected area provides for wildlife passage to key habitats outside the protected area (e.g. to allow migratory fish to travel between freshwater spawning sites and the sea, or to allow animal migration); Planning
Code # of As % of As Description 0 37 72,5
1 14 27,5 Management of corridors linking the protected area provides for wildlife passage to key habitats outside the protected area (e.g. to allow migratory fish to travel between freshwater spawning sites and the sea, or to allow animal migration)
21c: Land and water planning for ecosystem services& species conservation: Planning addresses ecosystem-specific needs and/or the needs of particular species of concern at an ecosystem scale (e.g. volume, quality and timing of freshwater flow to sustain particular species, fire management to maintain savannah habitats etc.); Planning
Code # of As % of As Description 0 42 82,4
1 9 17,6 Planning addresses ecosystem-specific needs and/or the needs of particular species of concern at an ecosystem scale (e.g. volume, quality and timing of freshwater flow to sustain particular species, fire management to maintain savannah habitats etc.)
22. State and commercial neighbours: Is there co-operation with adjacent land and water users? Process
Code # of As % of As Description 0 11 21,6 There is no contact between managers and neighbouring official or corporate land and water users
1 21 41,2 There is contact between managers and neighbouring official or corporate land and water users but little or no cooperation
2 17 33,3 There is contact between managers and neighbouring official or corporate land and water users, but only some co-operation
3 2 3,9 There is regular contact between managers and neighbouring official or corporate land and water users, and substantial co-operation on management
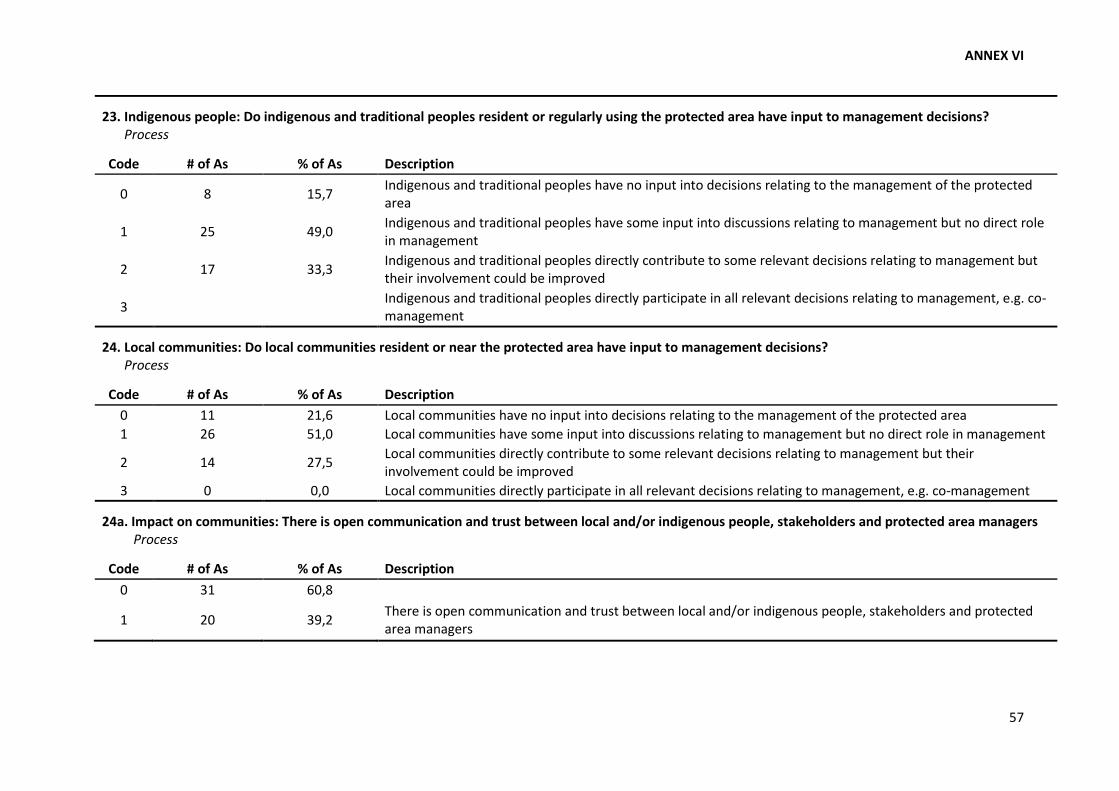
ANNEX VI
57
23. Indigenous people: Do indigenous and traditional peoples resident or regularly using the protected area have input to management decisions? Process
Code # of As % of As Description
0 8 15,7 Indigenous and traditional peoples have no input into decisions relating to the management of the protected area
1 25 49,0 Indigenous and traditional peoples have some input into discussions relating to management but no direct role in management
2 17 33,3 Indigenous and traditional peoples directly contribute to some relevant decisions relating to management but their involvement could be improved
3 Indigenous and traditional peoples directly participate in all relevant decisions relating to management, e.g. co-management
24. Local communities: Do local communities resident or near the protected area have input to management decisions? Process
Code # of As % of As Description 0 11 21,6 Local communities have no input into decisions relating to the management of the protected area 1 26 51,0 Local communities have some input into discussions relating to management but no direct role in management
2 14 27,5 Local communities directly contribute to some relevant decisions relating to management but their involvement could be improved
3 0 0,0 Local communities directly participate in all relevant decisions relating to management, e.g. co-management
24a. Impact on communities: There is open communication and trust between local and/or indigenous people, stakeholders and protected area managers Process
Code # of As % of As Description 0 31 60,8 1 20 39,2 There is open communication and trust between local and/or indigenous people, stakeholders and protected
area managers

ANNEX VI
58
24b. Impact on communities: Programmes to enhance community welfare, while conserving protected area resources, are being implemented Process
Code # of As % of As Description 0 44 86,3 1 7 13,7 Programmes to enhance community welfare, while conserving protected area resources, are being
implemented
24c. Impact on communities: Local and/or indigenous people actively support the protected area Process
Code # of As % of As Description 0 43 84,3 1 8 15,7 Local and/or indigenous people actively support the protected area
25. Economic benefit: Is the protected area providing economic benefits to local communities, e.g. income, employment, payment for environmental services?
Outcomes Code # of As % of As Description
0 16 31,4 The protected area does not deliver any economic benefits to local communities 1 10 19,6 Potential economic benefits are recognised and plans to realise these are being developed 2 19 37,3 There is some flow of economic benefits to local communities
3 6 11,8 There is a major flow of economic benefits to local communities from activities associated with the protected area
26. Monitoring and evaluation: Are management activities monitored against performance? Planning/Process
Code # of As % of As Description 0 10 19,6 There is no monitoring and evaluation in the protected area 1 36 70,6 There is some ad hoc monitoring and evaluation, but no overall strategy and/or no regular collection of results
2 3 5,9 There is an agreed and implemented monitoring and evaluation system but results do not feed back into management
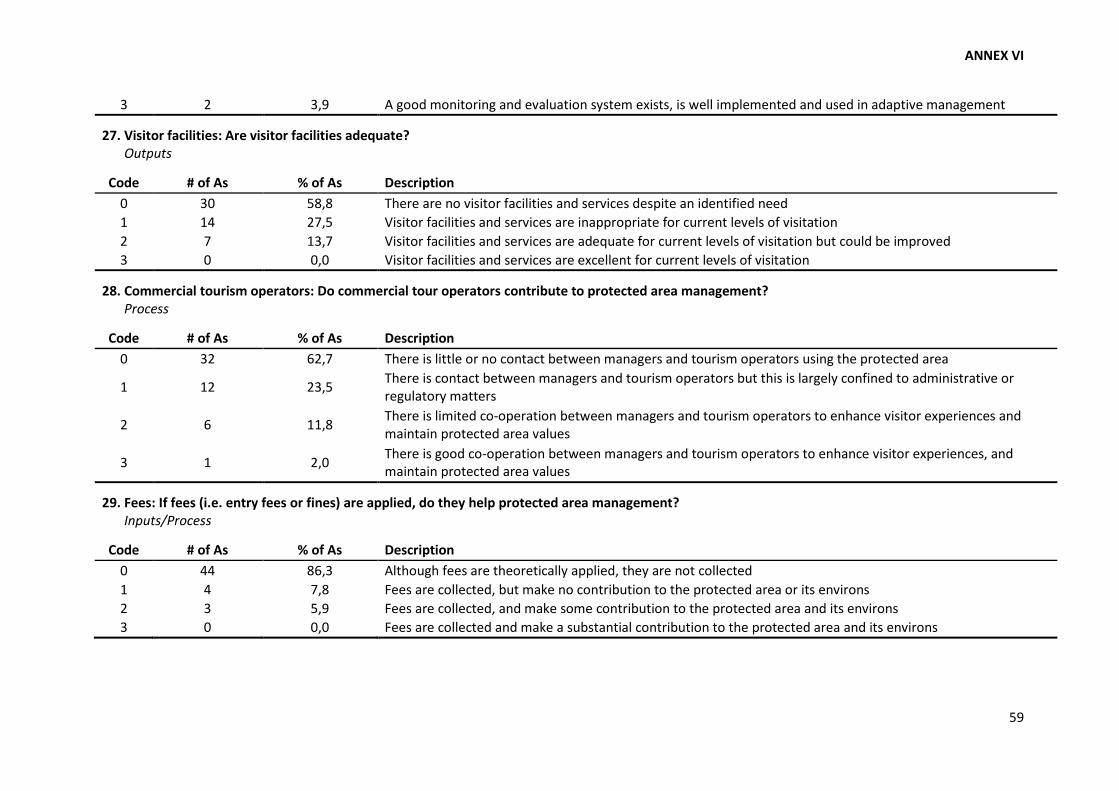
ANNEX VI
59
3 2 3,9 A good monitoring and evaluation system exists, is well implemented and used in adaptive management
27. Visitor facilities: Are visitor facilities adequate? Outputs
Code # of As % of As Description 0 30 58,8 There are no visitor facilities and services despite an identified need 1 14 27,5 Visitor facilities and services are inappropriate for current levels of visitation 2 7 13,7 Visitor facilities and services are adequate for current levels of visitation but could be improved 3 0 0,0 Visitor facilities and services are excellent for current levels of visitation
28. Commercial tourism operators: Do commercial tour operators contribute to protected area management? Process
Code # of As % of As Description 0 32 62,7 There is little or no contact between managers and tourism operators using the protected area
1 12 23,5 There is contact between managers and tourism operators but this is largely confined to administrative or regulatory matters
2 6 11,8 There is limited co-operation between managers and tourism operators to enhance visitor experiences and maintain protected area values
3 1 2,0 There is good co-operation between managers and tourism operators to enhance visitor experiences, and maintain protected area values
29. Fees: If fees (i.e. entry fees or fines) are applied, do they help protected area management? Inputs/Process
Code # of As % of As Description 0 44 86,3 Although fees are theoretically applied, they are not collected 1 4 7,8 Fees are collected, but make no contribution to the protected area or its environs 2 3 5,9 Fees are collected, and make some contribution to the protected area and its environs 3 0 0,0 Fees are collected and make a substantial contribution to the protected area and its environs
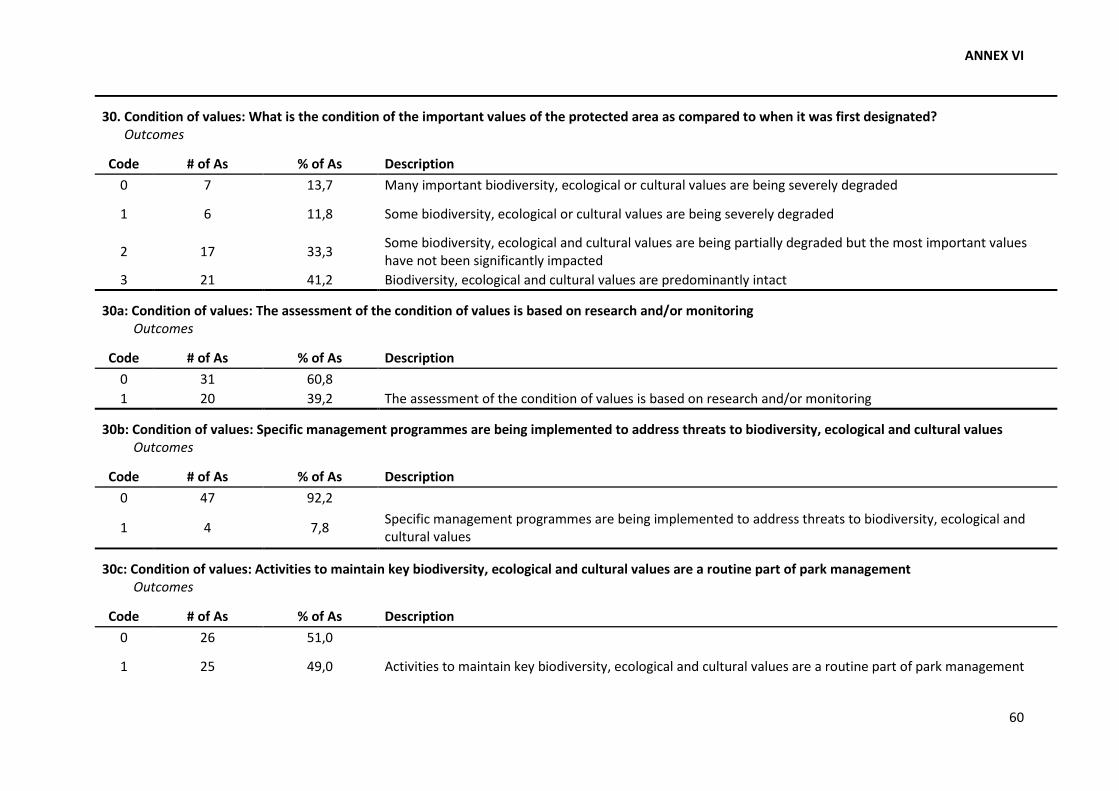
ANNEX VI
60
30. Condition of values: What is the condition of the important values of the protected area as compared to when it was first designated? Outcomes
Code # of As % of As Description 0 7 13,7 Many important biodiversity, ecological or cultural values are being severely degraded
1 6 11,8 Some biodiversity, ecological or cultural values are being severely degraded
2 17 33,3 Some biodiversity, ecological and cultural values are being partially degraded but the most important values have not been significantly impacted
3 21 41,2 Biodiversity, ecological and cultural values are predominantly intact
30a: Condition of values: The assessment of the condition of values is based on research and/or monitoring Outcomes
Code # of As % of As Description 0 31 60,8 1 20 39,2 The assessment of the condition of values is based on research and/or monitoring
30b: Condition of values: Specific management programmes are being implemented to address threats to biodiversity, ecological and cultural values Outcomes
Code # of As % of As Description 0 47 92,2 1 4 7,8 Specific management programmes are being implemented to address threats to biodiversity, ecological and
cultural values
30c: Condition of values: Activities to maintain key biodiversity, ecological and cultural values are a routine part of park management Outcomes
Code # of As % of As Description 0 26 51,0 1 25 49,0 Activities to maintain key biodiversity, ecological and cultural values are a routine part of park management

61
Published by:
NaturAL Torre Drin, 5 Floor
Tirana, Albania Tel: +35542240880/1/2/3
Email: [email protected]
www.natura.al