initial aggregate formation and soil carbon storage from ... · 744 aims environmental science...
TRANSCRIPT
AIMS Environmental Science Volume 4, Issue 6, 743-762.
AIMS Environmental Science, 4(6): 743-762.
DOI: 10.3934/environsci.2017.6.743
Received 21 July 2017,
Accepted 22 November 2017,
Published 05 December 2017
http://www.aimspress.com/journal/environmental
Research article
Initial aggregate formation and soil carbon storage from lipid-
extracted algae amendment
Katie Lewis1,*, Jamie Foster
2, Frank Hons
3 and Thomas Boutton
4
1 Texas A&M AgriLife Research, Texas A&M University, Lubbock, TX, USA
2 Texas A&M AgriLife Research, Texas A&M University, Beeville, TX, USA
3 Soil and Crop Sciences Department, Texas A&M University, College Station, TX, USA
4 Ecosystem Science Management Department, Texas A&M University, College Station, TX, USA
* Correspondence: Email: [email protected]; Tel: +806-746-6101; Fax: +806-746-6528.
Abstract: Soil organic C (SOC) storage results when organic matter inputs to soil exceed losses
through decomposition, and is strongly influenced by organic matter effects on soil aggregation. We
evaluated the initial effects of lipid-extracted algae (LEA), a byproduct of biofuel production, on soil
aggregate formation and SOC storage. In situ field incubations were conducted by amending soil
with (1) 1.5% LEA, (2) 3.0% LEA, (3) 1.5% LEA + 1.5% wheat straw (WS) and (4) soil plus
inorganic N (140 kg ha−1
NH4NO3) and P [112 kg ha−1
Ca(H2PO4)2·H2O] as the control. Soil samples
were collected 0, 3, 6, 9, and 12 months after treatment application at 0–5, 5–15, and 15–30 cm. Soil
was separated into macroaggregate (>250 µm), microaggregate (250–53 µm), and silt and clay (<53 µm)
fractions by dry-sieving, and mean weight diameter was calculated. Soils and soil fractions were
analyzed to determine C concentrations and associated δ13
C values. Mean weight diameter 12 months
after 3.0% LEA application was greater than the 1.5% LEA + 1.5% WS addition at the 5–15 cm depth.
Soil amended with 1.5% LEA, 3.0% LEA or 1.5% LEA + 1.5% WS resulted in greater SOC after 12
months for all soil size fractions and depths. δ13
C indicated that most LEA-C was initially associated
with the silt and clay fraction, but later became more strongly associated with the macro- and
microaggregate fractions after 12 months. Soil application of LEA enhanced initial aggregate
formation and SOC storage by increasing aggregate MWD and macro- and microaggregate
associated SOC over time. As the world population grows and resources become more limited, use
of alternative energy sources, soil conservation, and environmental protection must be top research
priorities. Our research emphasized all three and demonstrated that LEA can enhance soil structure
and C storage.

744
AIMS Environmental Science Volume 4, Issue 6, 743-762.
Keywords: soil organic carbon; carbon storage; aggregate stability; soil amendment; algal residue;
bioenergy feedstock; wheat straw residue; organic matter; soil structure; stable carbon isotopic
composition
1. Introduction
The largest C pool within the terrestrial C cycle is soil organic C (SOC) and its storage is the net
outcome of organic matter (OM) inputs to soil and losses through decomposition [1,2]. Soil organic
C strongly influences other soil properties and processes, such as water holding and cation exchange
capacities, retention of nutrients in the root zone, buffering against pH change, ability to chelate and
form complex ions, and the maintenance of soil physical structure via aggregate formation [3]. In
agroecosystems, the maintenance of these soil characteristics reduces the potential for soil
degradation, erosion and compaction, increases nutrient availability to plants and microorganisms,
and favors the capacity for C storage [4].
Long-term SOC stabilization and short-term nutrient cycling are also influenced by dynamics of
aggregate formation and breakdown over time [5,6]. Organic amendments can enhance soil
aggregate formation by providing active organic materials, such as particulate OM, which act as
nucleation sites and binding agents to facilitate aggregate formation [7,8]. Six et al. [9] suggested
that adding crop residues promotes OM stabilization through the binding of primary soil particles
and old microaggregates into new macroaggregates. Depending on the quality or biochemical
characteristics, such as C:N ratio and lignin content of organic materials, it may be possible to
maintain or improve soil physical and chemical properties as a result of increased SOM, and
consequently, enhanced microbial activity and aggregate formation.
Jastrow et al. [10] observed an increase of macroaggregates resistant to slaking under long-term
pasture grasses compared to corn (Zea mays L.). A monoculture study by Wright and Hons [11]
reported aggregation to be generally greater for wheat (Triticum aestivum L.) than sorghum
[Sorghum bicolor (L.) Moench] and soybean [Glycine max (L.) Merr.]. Crop residues having low N
contents and greater C:N ratios, such as wheat straw (WS), will usually decompose at slower rates
than residues with greater N and narrower C:N ratios [12,13]. Slower decomposition often leads to
increased SOM, aggregate formation, and SOC stability.
In a long-term incubation study (392 d), greater organic C accumulation and stabilization and N
availability were determined when soil was amended with lipid-extracted algae (LEA) compared to
soil amended with WS [14]. Algal residue or LEA following lipid extraction of algae cultivated as a
bioenergy feedstock is one of the many possible coproducts that might be used as a soil amendment
for agricultural production. Compared to lignin in wheat straw, LEA originating from the algal
species Nannochloropsis salina contained a larger stable C fraction, which likely originated from
aliphatic macromolecules known as algaenans which are more resistant to decay than other
macromolecular compounds derived from proteins, polysaccharides, and even lignin [15,16]. The
high concentration of basic cations (Ca2+
, Mg2+
, and Na+) in LEA also contributed to increased soil
salinity, with electrical conductivity (EC) being nearly five times greater in LEA-treated soil
compared to untreated soil 14 d following LEA application. High concentrations of Na+ in LEA may
potentially impair soil structure, and reduce aggregate formation and subsequent C storage.

745
AIMS Environmental Science Volume 4, Issue 6, 743-762.
Aggregates can contain OM of various origins, composition and degree of microbial
degradation, and thus, add to the difficulty of studying the role of organic amendments in aggregate
formation and the ensuing effect of aggregate turnover on soil C stabilization. However, natural
differences in the stable C isotopic composition (13
C/12
C) of agricultural soils and organic
amendments can provide a useful approach for tracing and identifying the sources of C sequestered
in aggregates and SOM fractions [17,18]. Carbon in nature is comprised of 98.89% 12
C and 1.11% 13
C [19]. As a result of C isotope fractionation during physical, chemical, and metabolic processes,
considerable C isotope variation exists between different components of the environment [20,21],
and this variation can be utilized to trace pathways of C flow through the environment. For example,
the 13
C/12
C ratio (or δ13
C value) of SOC relates closely to the 13
C content of the plant or microbial
material it originated from [22].
Cool- (C3) and warm-season (C4) plant species discriminate against 13
CO2 during
photosynthesis to different degrees. C3 species discriminate against 13
CO2 to a greater extent [23],
making it possible to determine the relative contribution of C3 and C4 plant vegetation to SOM [24].
Growing C4 plants on soil that has previously been under C3 vegetation, or vice versa, can be used as
an in situ labeling of the incorporated SOM [25]. Carbon isotope tracers allow for the quantification
of the rate of C losses from the original vegetation and the simultaneous accumulation of new C from
the current vegetation or recent organic material addition.
Physical size-fractionation of soil aggregates in conjunction with isotopic analyses (δ13
C) of
those fractions have been used to: (1) determine where OC derived from isotopically distinct sources
is stored relative to aggregate structure; (2) identify sources of SOC; (3) quantify turnover rates of
SOC in specific soil fractions, and, (4) evaluate OM quality [26]. Jastrow et al. [10] showed that
recent OM inputs are found mostly in larger soil aggregates, making it more susceptible to
decomposition because macroaggregates are more likely to be destroyed by agricultural practices
compared to microaggregates [7], but in perennial pasture systems this may not be the case.
The objective of our research was to determine the initial effects of LEA, a byproduct of
biofuel production and a potential organic amendment, on soil aggregate formation and SOC
storage by: (1) determining the mean weight diameter of soil aggregates with time after LEA
incorporation; (2) determining SOC storage within aggregates; and, (3) delineating the C sources and
distribution in aggregate fractions by utilizing the natural abundance of 13
C of Parrita soil and LEA and
WS materials.
2. Materials and Methods
2.1. Site Description and Experimental Design
The study was conducted at the Texas A&M Agrilife Research Station near Beeville, TX
(28º27’30”, 97º42’21.78”, 75.9 m). According to the National Centers for Environmental
Information, the mean annual temperature and mean annual precipitation (1981 to 2010) for this
semi-arid environment are 21 ºC and 81 cm, respectively. Soil at this location is characterized as a
Parrita series (loamy, mixed, superactive, hyperthermic, shallow Petrocalcic Paleustoll), and is a
sandy clay loam with a pH of 6.9.
The study was designed as a split-plot and arranged in a randomized complete block design
with sampling time as the main plot and soil amendment as the split plot. In situ field incubations
746
AIMS Environmental Science Volume 4, Issue 6, 743-762.
were conducted in polyvinyl chloride (PVC) columns measuring 10 cm (i.d.) × 33 cm. The bottoms
of columns were capped, but drainage holes were drilled in caps to allow water to drain from soil
columns. Weights of empty columns and soil-filled columns were measured.
Soil columns were removed at different times (0, 3, 6, 9, and 12 months) after treatment application
and destructively sampled. Samples collected 24 hours after treatment application are referred to as 0
months. Treatments included: (1) 1.5% LEA, (2) 3.0% LEA, (3) 1.5% LEA + 1.5% WS, and (4) a
control of soil plus inorganic N (140 kg ha−1
NH4NO3) and P [112 kg ha−1
Ca(H2PO4)2·H2O]. The
combination of four replications per sampling time (5) x soil amendment treatment (4), totaled 80
columns. Treatments were prepared by mixing the designated rate of inorganic fertilizer, LEA or WS
with sieved (<2 mm) Parrita soil on a dry weight basis (g g−1
). The lowest 10 cm of each column was
filled with unamended soil and the top 20 cm with amended soil and gently packed so that soil bulk
density was approximately 0.8 g cm−3
. Columns were then placed and securely packed within
excavated holes measuring 11 cm wide and 30 cm deep at a field site near the soil collection location
at the Beeville Research Station.
2.2. Soil, lipid-extracted Algae, and Wheat Straw Characterization
Once columns were removed, soil was sampled from three depth increments (0–5, 5–15, and
15–30 cm) for measuring soil aggregate-size fractions, isotopic and elemental concentrations of SOC,
pH and electrical conductivity (EC) and sampled from 0–15 and 15–30 cm for SOC and total N. Soil,
LEA, and WS were analyzed for OC and total N by a combustion procedure [27-29]. Lipid-extracted
algae and WS mineral concentrations (Ca, Cu, Fe, K, Mg, Mn, Na, P, S, and Zn) were determined by
ICP analysis of nitric acid digests [30,31]. Concentrations of neutral detergent fiber (NDF) and
acid detergent fiber (ADF) of LEA and WS were measured sequentially using an ANKOM 200
Fiber Analyzer (Ankom Technologies, Macedon, NY) based on the method of Van Soest et al. [32]
and AOAC [33] (method 973.18) and lignin was sequentially measured after ADF using the
Ankom [14,34] method. Initial extractable P, K, Ca, Mg, S, and Na of Parrita soil were measured
using the Mehlich III procedure [35,36] with analysis by ICP; micronutrients (Cu, Fe, Mn, and
Zn) were assessed by extraction with DTPA-TEA, followed by ICP analysis [37].
After removing columns from the field, wet and dry weights were determined prior to and after
oven drying (65 ºC) to constant weight. Soil samples for aggregate-size fractionation were gently crushed
and sieved (<4 mm) prior to separating random 50-g aliquots into three size fractions [>250 μm
(macroaggregates), 250–53 μm (microaggregates), and <53 µm (silt and clay)] using a rotary sieve-
based dry sieving method [38,39]. Mean weight diameter (MWD) was calculated as a weighted
average of the soil size fraction percentages. Separated size fractions were weighed and ground using
a ring and puck mill (<150 µm) prior to elemental and isotopic analyses.
Sub-samples of soil collected at 0, 3, 6, and 12 months were ground with a flail grinder
(<2 mm). The pH and EC of soil, LEA, and WS were determined in a 1:2 soil or residue to
water extract using deionized water with EC determinations made using a conductivity probe [40].
Sub-samples for soil total C and N were further ground (<150 µm) using a ring and puck mill prior to
weighing and combustion analysis described previously.
Soil aliquots of 24 or 30 mg, depending on C concentration, of the three size fractions from the
0–5, 5–15, and 15–30 cm depths were weighed for elemental and isotopic analysis of SOC and δ13
C,
which were performed in the Stable Isotopes for Biosphere Science (SIBS) Laboratory, Texas A&M
747
AIMS Environmental Science Volume 4, Issue 6, 743-762.
University, College Station, TX. LEA and WS were also measured for elemental C and δ13
C. A
Costech Elemental Combustion System interfaced with a Thermo Scientific Delta V Advantage mass
spectrometer operating in continuous flow mode was used to determine isotope ratios relative to the
Vienna Pee Dee Belemnite (V-PDB) standard [41]. Carbon isotope ratios were expressed as per mil
(‰) using the standard delta notation (δ):
(1)
where RSAMPLE is the 13
C/12
C of the sample and RSTD is the 13
C/12
C ratio of the V-PDB standard. Quality
control was performed using calibration curves, which were derived using USGS standards of glutamic
acid-40 (δ13
C = −26.39‰, δ15
N = −4.52‰) and USGS glutamic acid-41 (δ13
C = 37.63‰). Plant
material of corn (δ13
C = −12.78‰) and a lab plant standard (δ13
C = −39.88‰) were analyzed as
internal standards to determine the accuracy and precision of isotopic analysis.
The relative proportions of SOC derived from the LEA (FC) vs. the native soil C were estimated
by mass balance:
, (2)
where δSOIL was the δ13
C value of native soil C at the start of the experiment, δSAMPLE was the δ13
C
value within a soil size fraction at given sampling time, and δAMENDMENT was the original δ13
C value
of LEA or the weighted average of LEA and WS used for the 1.5% LEA + 1.5% WS treatment. The
percentage of SOC derived from LEA and LEA plus WS (amendment-C, %) within soil size
fractions was calculated as:
amendment , (3)
2.4. Statistical Analysis
The effects of soil amendment on measured parameters were analyzed using a linear mixed
analysis of variance (ANOVA) procedure at a significance level of P < 0.05 using SAS version
9.3 [42]. Treatment was considered a fixed effect while replication was a random effect. Means
of significant effects were separated using Fisher’s protected LSD at P < 0.05.
3. Results
3.1. Soil, Lipid-extracted Algae, and Wheat Straw Characterization
The soil collected from the Texas A&M Agrilife Research Station in Beeville, TX, and used for this
in situ field experiment is classified as Parrita sandy clay loam with a pH of 6.9 and EC of 0.2 dS m−1
(Table 1). Soil OC and TN of Parrita soil were 9.6 g kg−1
and 1.4 g kg−1
, respectively. This soil was high
in extractable P (62 mg kg−1
), Ca (2667 mg kg−1
), and Mg (278 mg kg−1
), very high in K (314 mg kg−1
),
moderate in S (12 mg kg−1
), and very low in Na (59 mg kg−1
) based on ratings of the Texas A&M
AgriLife Extension Soil, Water and Forage Testing Laboratory. Extractable Fe (6 mg kg−1
), Cu
(0.5 mg kg−1
), and Mn (16 mg kg−1
) were rated as high, while Zn (0.5 mg kg−1
) was moderate to high.
748
AIMS Environmental Science Volume 4, Issue 6, 743-762.
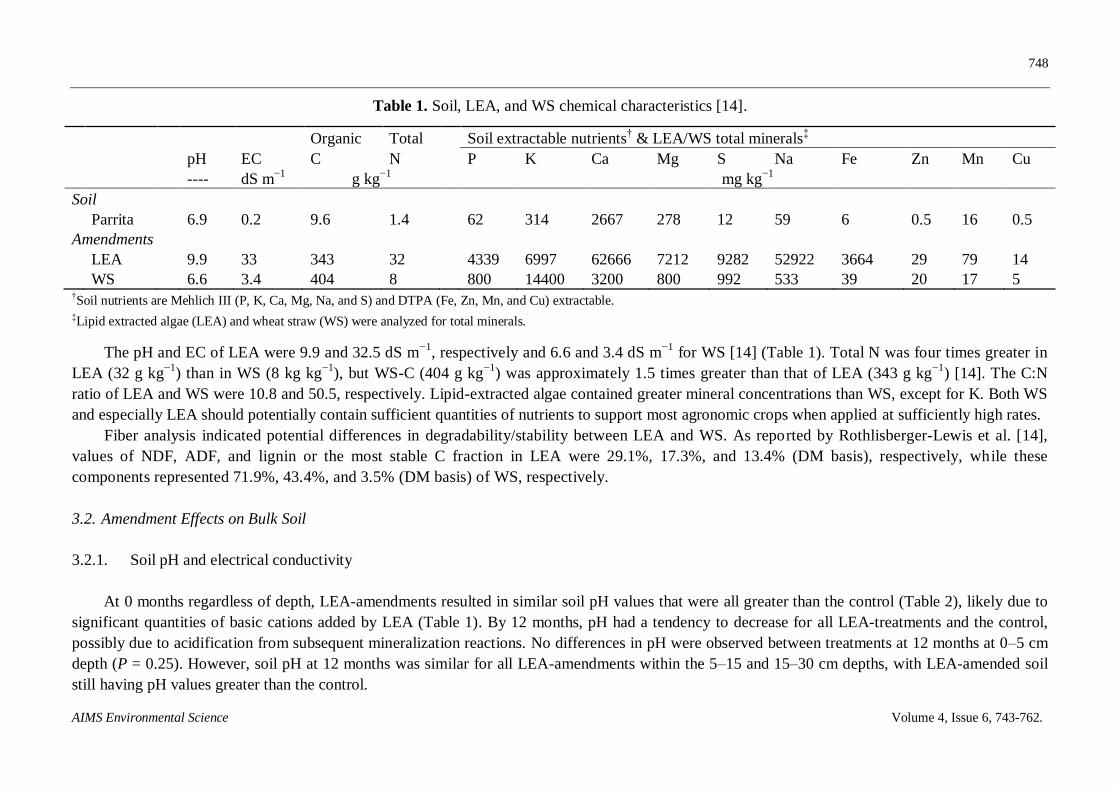
Table 1. Soil, LEA, and WS chemical characteristics [14].
Organic Total Soil extractable nutrients† & LEA/WS total minerals
‡
pH EC C N P K Ca Mg S Na Fe Zn Mn Cu
---- dS m−1
g kg−1
mg kg−1
Soil
Parrita 6.9 0.2 9.6 1.4 62 314 2667 278 12 59 6 0.5 16 0.5
Amendments
LEA 9.9 33 343 32 4339 6997 62666 7212 9282 52922 3664 29 79 14
WS 6.6 3.4 404 8 800 14400 3200 800 992 533 39 20 17 5 †Soil nutrients are Mehlich III (P, K, Ca, Mg, Na, and S) and DTPA (Fe, Zn, Mn, and Cu) extractable. ‡Lipid extracted algae (LEA) and wheat straw (WS) were analyzed for total minerals.
The pH and EC of LEA were 9.9 and 32.5 dS m−1
, respectively and 6.6 and 3.4 dS m−1
for WS [14] (Table 1). Total N was four times greater in
LEA (32 g kg−1
) than in WS (8 kg kg−1
), but WS-C (404 g kg−1
) was approximately 1.5 times greater than that of LEA (343 g kg−1
) [14]. The C:N
ratio of LEA and WS were 10.8 and 50.5, respectively. Lipid-extracted algae contained greater mineral concentrations than WS, except for K. Both WS
and especially LEA should potentially contain sufficient quantities of nutrients to support most agronomic crops when applied at sufficiently high rates.
Fiber analysis indicated potential differences in degradability/stability between LEA and WS. As reported by Rothlisberger-Lewis et al. [14],
values of NDF, ADF, and lignin or the most stable C fraction in LEA were 29.1%, 17.3%, and 13.4% (DM basis), respectively, while these
components represented 71.9%, 43.4%, and 3.5% (DM basis) of WS, respectively.
3.2. Amendment Effects on Bulk Soil
3.2.1. Soil pH and electrical conductivity
At 0 months regardless of depth, LEA-amendments resulted in similar soil pH values that were all greater than the control (Table 2), likely due to
significant quantities of basic cations added by LEA (Table 1). By 12 months, pH had a tendency to decrease for all LEA-treatments and the control,
possibly due to acidification from subsequent mineralization reactions. No differences in pH were observed between treatments at 12 months at 0–5 cm
depth (P = 0.25). However, soil pH at 12 months was similar for all LEA-amendments within the 5–15 and 15–30 cm depths, with LEA-amended soil
still having pH values greater than the control.

749
AIMS Environmental Science Volume 4, Issue 6, 743-762.
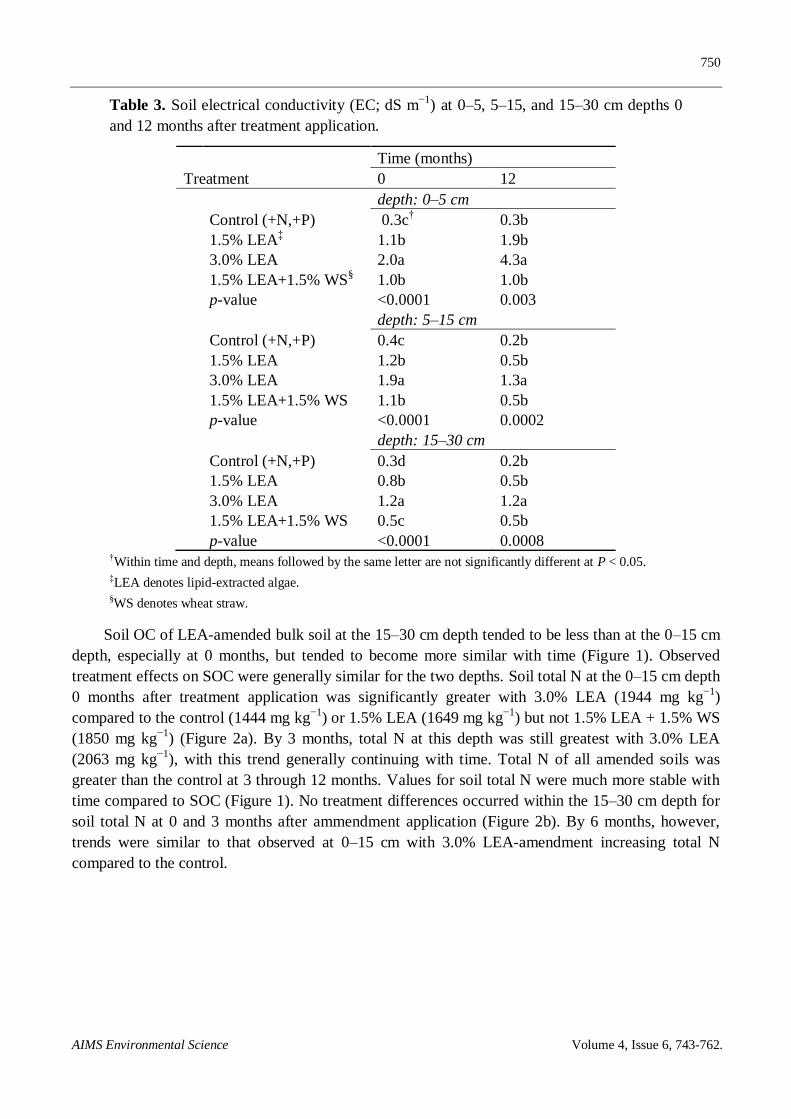
Soil EC was greatest with 3.0% LEA at 0 and 12 months for all depths, while at 0 months, all LEA
treatments also resulted in significantly greater EC than the control (Table 3). As depth and time
increased, the magnitude of the difference in EC between all treatments decreased. The 3.0% LEA
treatment had the greatest measured EC of 4.3 dS m−1
in the 0–5 cm depth at 12 months. Regardless of
depth at 12 months, soil EC was similar for the control and all treatments except 3.0% LEA.
3.2.2. Soil C Dynamics
Organic C of bulk soil 0 months after treatment application within the 0–15 cm depth was
greatest with 1.5% LEA + 1.5% WS (16.6 g kg−1
), followed by 3.0% LEA (13.7 g kg−1
), and then 1.5%
LEA (11.2 g kg−1
) and the control (+N,+P) (9.6 g kg−1
) (Figure 1a). Soil OC with 1.5% LEA + 1.5%
WS was greatest likely because of the greater C concentration of WS (Table 1). Similar trends
generally were exhibited throughout the remainder of the study; however, significant differences in
SOC between 1.5% LEA + 1.5% WS and 3.0% LEA at 3, 6, and 12 months were not observed, but
these treatments still resulted in greater SOC at these times than 1.5% LEA or the control. Soil OC
for the 1.5% LEA + 1.5% WS and 3.0% LEA treatments decreased by 5.5 g kg−1
and 1.7 g kg−1
from
0 to 12 months, but were still 20% and 30% greater, respectively, than the control at this time. The
majority of OC mineralization from amendments tended to occur by 3 months after application.
Table 2. Soil pH measured at 0–5, 5–15, and 15–30 cm depths 0 and 12 months after
treatment application.
Time (months)
Treatment 0 12
depth: 0–5 cm
Control (+N,+P) 7.3b† 6.7
1.5% LEA
‡ 8.2a 6.8
3.0% LEA 8.3a 6.6
1.5% LEA+1.5% WS
§ 8.1a 6.9
p-value
<0.0001 0.25
depth: 5–15 cm
Control (+N,+P) 7.0b 6.6b
1.5% LEA 8.1a 6.9a
3.0% LEA 8.3a 6.9a
1.5% LEA+1.5% WS 8.2a 7.0a
p-value <0.0001 0.013
depth: 15–30 cm
Control (+N,+P)
7.2b 6.5b
1.5% LEA
8.2a 6.8a
3.0% LEA
8.4a 7.0a
1.5% LEA+1.5% WS
8.0a 7.0a
p-value
0.0004 0.004
†Within time and depth, means followed by the same letter are not significantly different at P < 0.05. ‡LEA denotes lipid-extracted algae. §WS denotes wheat straw.
750
AIMS Environmental Science Volume 4, Issue 6, 743-762.
Table 3. Soil electrical conductivity (EC; dS m−1
) at 0–5, 5–15, and 15–30 cm depths 0
and 12 months after treatment application.
Time (months)
Treatment 0 12
depth: 0–5 cm
Control (+N,+P) 0.3c† 0.3b
1.5% LEA
‡ 1.1b 1.9b
3.0% LEA 2.0a 4.3a
1.5% LEA+1.5% WS
§ 1.0b 1.0b
p-value
<0.0001 0.003
depth: 5–15 cm
Control (+N,+P) 0.4c 0.2b
1.5% LEA 1.2b 0.5b
3.0% LEA 1.9a 1.3a
1.5% LEA+1.5% WS 1.1b 0.5b
p-value <0.0001 0.0002
depth: 15–30 cm
Control (+N,+P)
0.3d 0.2b
1.5% LEA
0.8b 0.5b
3.0% LEA
1.2a 1.2a
1.5% LEA+1.5% WS
0.5c 0.5b
p-value
<0.0001 0.0008
†Within time and depth, means followed by the same letter are not significantly different at P < 0.05. ‡LEA denotes lipid-extracted algae. §WS denotes wheat straw.
Soil OC of LEA-amended bulk soil at the 15–30 cm depth tended to be less than at the 0–15 cm
depth, especially at 0 months, but tended to become more similar with time (Figure 1). Observed
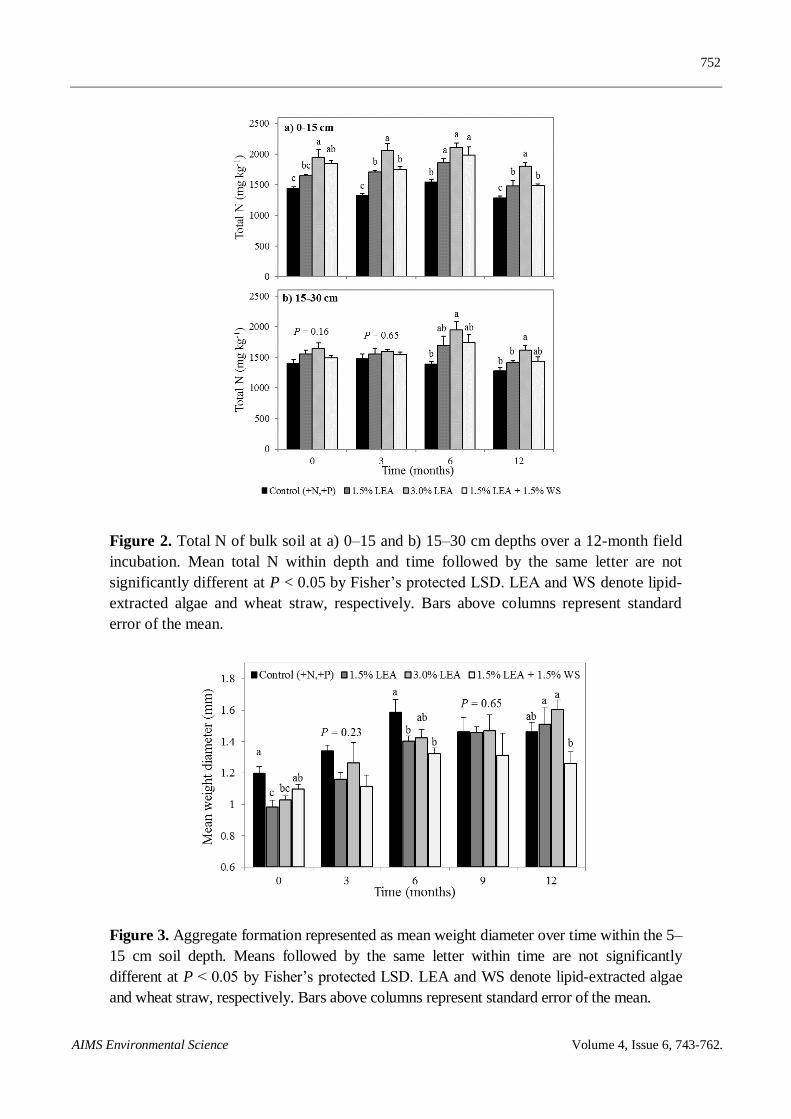
treatment effects on SOC were generally similar for the two depths. Soil total N at the 0–15 cm depth
0 months after treatment application was significantly greater with 3.0% LEA (1944 mg kg−1
)
compared to the control (1444 mg kg−1
) or 1.5% LEA (1649 mg kg−1
) but not 1.5% LEA + 1.5% WS
(1850 mg kg−1
) (Figure 2a). By 3 months, total N at this depth was still greatest with 3.0% LEA
(2063 mg kg−1
), with this trend generally continuing with time. Total N of all amended soils was
greater than the control at 3 through 12 months. Values for soil total N were much more stable with
time compared to SOC (Figure 1). No treatment differences occurred within the 15–30 cm depth for
soil total N at 0 and 3 months after ammendment application (Figure 2b). By 6 months, however,
trends were similar to that observed at 0–15 cm with 3.0% LEA-amendment increasing total N
compared to the control.

751
AIMS Environmental Science Volume 4, Issue 6, 743-762.
Figure 1. Soil organic C of bulk soil at a) 0–15 cm and b) 15–30 cm depths during the
12-month field incubation. Means within depth and time followed by the same letter are
not significantly different at P < 0.05 by Fisher’s protected LSD. LEA and WS denote
lipid-extracted algae and wheat straw, respectively. Bars above columns represent
standard error of the mean.
3.3. Amendment Effects on Soil Aggregation and Carbon Dynamics within Aggregate Fractions
3.3.1. Aggregate formation
No treatment differences for aggregate MWD were noted within 0–5 and 15–30 cm depths at any
sampling time (P = 0.08), except for 0–5 cm at 0 month (P = 0.03); however, differences (P ≤ 0.05)
were observed at 0, 6, and 12 months at the 5–15 cm depth.
The control resulted in greater MWD at 5–15 cm depth compared to 1.5 and 3.0% LEA-treated
soil 0 months following treatment application (Figure 3). Six months after treatment application,
MWD of the control was similar to that of soil amended with 3.0% LEA, but greater than the other
two LEA treatments. Twelve months after treatment application, the 1.5 and 3.0% LEA treatments
resulted in greater MWD than 1.5% LEA + 1.5% WS but not the control. Although an overall
increase of MWD was observed over the 12-month study for the control as well as all organic
amendments, 1.5 and 3.0% LEA-amended soil resulted in the greatest percentage increase in MWD
(54% and 56%, respectively) compared to the control and 1.5% LEA + 1.5% WS treatment, which
increased by 22% and 15%, respectively. Sodium contained in LEA (Table 1) may initially have
decreased aggregate MWD following amendment application.
752
AIMS Environmental Science Volume 4, Issue 6, 743-762.
Figure 2. Total N of bulk soil at a) 0–15 and b) 15–30 cm depths over a 12-month field
incubation. Mean total N within depth and time followed by the same letter are not
significantly different at P < 0.05 by Fisher’s protected LSD. LEA and WS denote lipid-
extracted algae and wheat straw, respectively. Bars above columns represent standard
error of the mean.
Figure 3. Aggregate formation represented as mean weight diameter over time within the 5–
15 cm soil depth. Means followed by the same letter within time are not significantly
different at P < 0.05 by Fisher’s protected LSD. LEA and WS denote lipid-extracted algae
and wheat straw, respectively. Bars above columns represent standard error of the mean.
753
AIMS Environmental Science Volume 4, Issue 6, 743-762.
3.3.2. Soil C and δ13
C dynamics
The natural abundances of the stable isotope δ13
C of Parrita soil was −16.3‰, while those for
LEA and WS were −27.6‰ and −28.9‰, respectively. Since SOC relates closely to the plant
material it originated from [22], the δ13
C value of Parrita soil is likely due to cultivation of C4 grasses
at this location. The natural difference between δ13
C values of soil and amendments allowed the
determination of the relative contributions of C3 LEA to SOC [24].
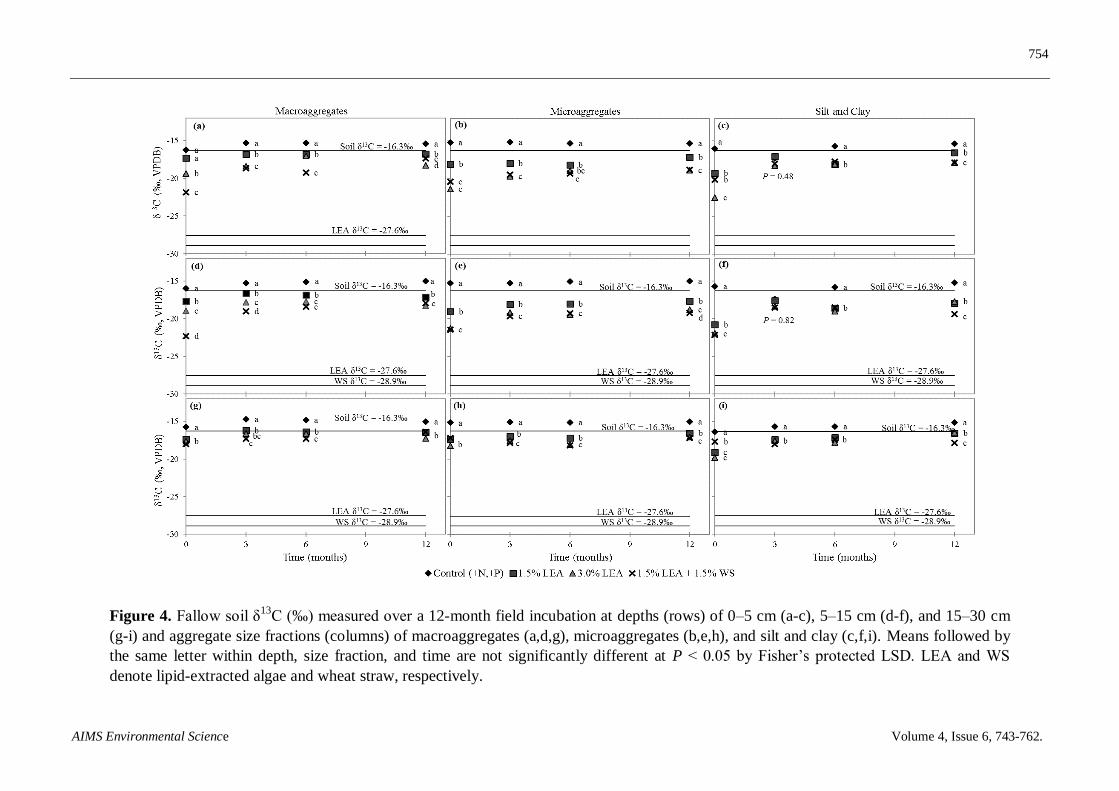
At 0–5 cm depth, significant differences in δ13
C were observed between the control and other
treatments for all three fractions at each measurement time, except for the silt and clay fraction at
3 months (Figures 4a–c). At 0 months at this depth, macroaggregates from soil amended with 1.5% LEA
+ 1.5% WS or 3.0% LEA were more depleted in 13
C compared to the control (Figure 4a). At 3, 6, and 12
months, macroaggregates from all LEA treatments at 0–5 cm depth were more depleted in 13
C than the
control and by 12 months, the 3.0% LEA treatment was most depleted in 13
C (−18.3‰).
Although microaggregate δ13
C trends over time at 0–5 cm were similar to those of
macroaggregates, microaggregate signatures of all LEA amended soils were more 13
C depleted than
control soil at each measurement time (Figure 4b). Also, different from macroaggregates, δ13
C
signatures of microaggregates at 12 months for 3.0% LEA and 1.5% LEA + 1.5% WS were similar,
but more negative and more like LEA’s original signature (δ13
C = −27.6‰) than the control or 1.5%
LEA treatment. At 0, 6, and 12 months at 0–5 cm depth, the silt and clay fraction of LEA-amended
treatments also exhibited more negative δ13
C signatures than the control (Figure 4c). All aggregate
fractions from soil amended with LEA exhibited more positive δ13
C values over time. The silt and
clay fraction in soil from 0–5 cm tended to have the most negative signatures for LEA treatments at 0
months and the least negative at 12 months compared with macro- and microaggregates.
Differences in δ13
C signatures were also observed at 5–15 cm for macroaggregates, microaggregates,
and the silt and clay fraction at all sampling times, except again for the silt and clay fraction at 3 months
(Figures 4d,e,f). Macroaggregates from LEA-amended soils at 5–15 cm were more depleted in 13
C at
each measurement time compared to the control (Figure 4d). Values for soils receiving of 3.0% LEA and
1.5% LEA + 1.5% WS were also more depleted than 1.5% LEA. Microaggregate δ13
C of soil amended
with 3.0% LEA and 1.5% LEA + 1.5% WS were most negative and similar at 0, 3, and 6 months. By 12
months, 1.5% LEA + 1.5% WS was most depleted (Figure 4e). Microaggregates from all LEA
treatments were more depleted in 13
C compared to the control at all sampling times. For the 3.0% LEA
treatments at 5–15 cm depth, δ13
C values of microaggregates tended to be slightly more depleted
(−18.8‰) compared to macroaggregates (−18.3‰) (Figures 4d,e). Silt and clay δ13
C signatures over time
at 5–15 cm generally followed trends similar to those at 0–5 cm (Figures 4c,f).
While differences in δ13
C were noted between the control and LEA-amended soil at 15–30 cm
for all size fractions and measurement times, signatures tended to be less depleted in 13
C at this depth
compared to 0–5 and 5–15 cm regardless of LEA-treatment (Figures 4g,h,i), likely because the
bottom 10 cm of all columns contained only unamended Parrita soil. δ13
C values of macroaggregates
and free silt and clay fractions for 1.5% LEA and 3.0% LEA treated soils were similar 12 months
after treatment imposition at 15–30 cm depth; however, free microaggregate signatures for 3.0%
LEA and 1.5% LEA + 1.5% WS treatments were most depleted in 13
C at this time (Figure 4h).
Unlike signatures at 0–5 and 5–15 cm for 3.0% LEA-amended soil, δ13
C at 15–30 cm tended to be
slightly more depleted for macroaggregates (−17.3‰) than for free microaggregates (−17.1‰) or silt
and clay (−16.4‰) (Figure 4).
754
AIMS Environmental Science Volume 4, Issue 6, 743-762.
Figure 4. Fallow soil δ13
C (‰) measured over a 12-month field incubation at depths (rows) of 0–5 cm (a-c), 5–15 cm (d-f), and 15–30 cm
(g-i) and aggregate size fractions (columns) of macroaggregates (a,d,g), microaggregates (b,e,h), and silt and clay (c,f,i). Means followed by
the same letter within depth, size fraction, and time are not significantly different at P < 0.05 by Fisher’s protected LSD. LEA and WS
denote lipid-extracted algae and wheat straw, respectively.
755
AIMS Environmental Science Volume 4, Issue 6, 743-762.
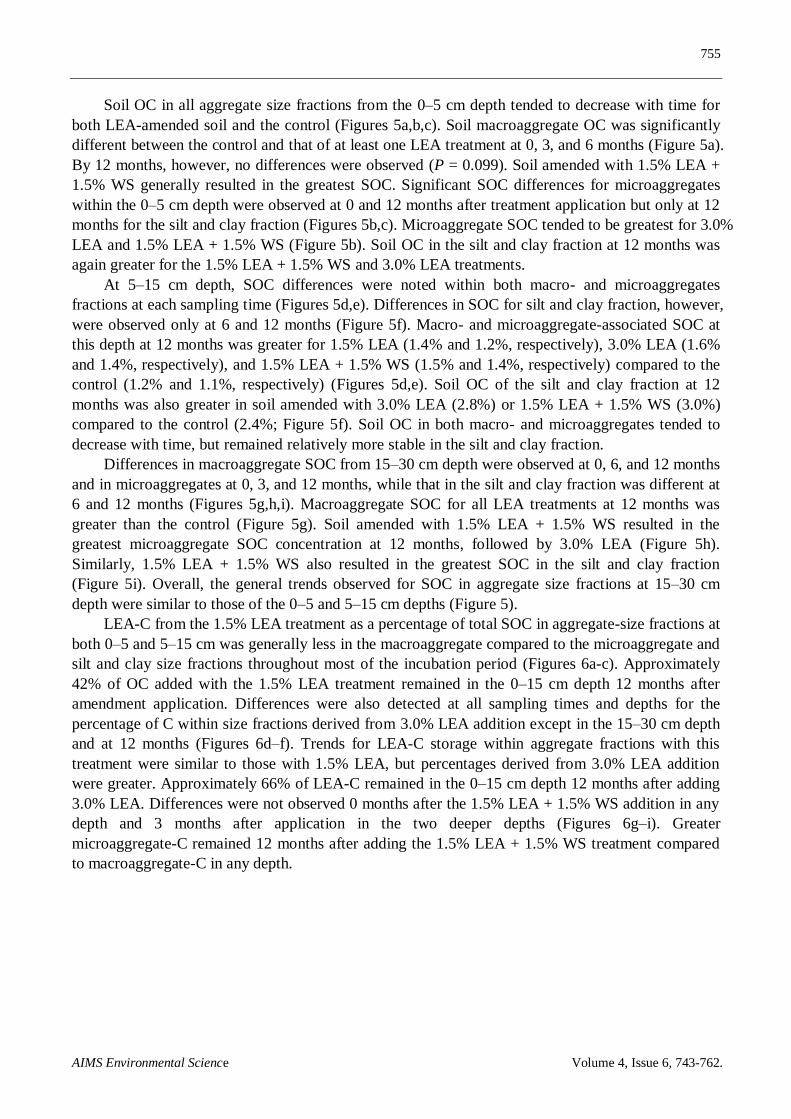
Soil OC in all aggregate size fractions from the 0–5 cm depth tended to decrease with time for
both LEA-amended soil and the control (Figures 5a,b,c). Soil macroaggregate OC was significantly
different between the control and that of at least one LEA treatment at 0, 3, and 6 months (Figure 5a).
By 12 months, however, no differences were observed (P = 0.099). Soil amended with 1.5% LEA +
1.5% WS generally resulted in the greatest SOC. Significant SOC differences for microaggregates
within the 0–5 cm depth were observed at 0 and 12 months after treatment application but only at 12
months for the silt and clay fraction (Figures 5b,c). Microaggregate SOC tended to be greatest for 3.0%
LEA and 1.5% LEA + 1.5% WS (Figure 5b). Soil OC in the silt and clay fraction at 12 months was
again greater for the 1.5% LEA + 1.5% WS and 3.0% LEA treatments.
At 5–15 cm depth, SOC differences were noted within both macro- and microaggregates
fractions at each sampling time (Figures 5d,e). Differences in SOC for silt and clay fraction, however,
were observed only at 6 and 12 months (Figure 5f). Macro- and microaggregate-associated SOC at
this depth at 12 months was greater for 1.5% LEA (1.4% and 1.2%, respectively), 3.0% LEA (1.6%
and 1.4%, respectively), and 1.5% LEA + 1.5% WS (1.5% and 1.4%, respectively) compared to the
control (1.2% and 1.1%, respectively) (Figures 5d,e). Soil OC of the silt and clay fraction at 12
months was also greater in soil amended with 3.0% LEA (2.8%) or 1.5% LEA + 1.5% WS (3.0%)
compared to the control (2.4%; Figure 5f). Soil OC in both macro- and microaggregates tended to
decrease with time, but remained relatively more stable in the silt and clay fraction.
Differences in macroaggregate SOC from 15–30 cm depth were observed at 0, 6, and 12 months
and in microaggregates at 0, 3, and 12 months, while that in the silt and clay fraction was different at
6 and 12 months (Figures 5g,h,i). Macroaggregate SOC for all LEA treatments at 12 months was
greater than the control (Figure 5g). Soil amended with 1.5% LEA + 1.5% WS resulted in the
greatest microaggregate SOC concentration at 12 months, followed by 3.0% LEA (Figure 5h).
Similarly, 1.5% LEA + 1.5% WS also resulted in the greatest SOC in the silt and clay fraction
(Figure 5i). Overall, the general trends observed for SOC in aggregate size fractions at 15–30 cm
depth were similar to those of the 0–5 and 5–15 cm depths (Figure 5).
LEA-C from the 1.5% LEA treatment as a percentage of total SOC in aggregate-size fractions at
both 0–5 and 5–15 cm was generally less in the macroaggregate compared to the microaggregate and
silt and clay size fractions throughout most of the incubation period (Figures 6a-c). Approximately
42% of OC added with the 1.5% LEA treatment remained in the 0–15 cm depth 12 months after
amendment application. Differences were also detected at all sampling times and depths for the
percentage of C within size fractions derived from 3.0% LEA addition except in the 15–30 cm depth
and at 12 months (Figures 6d–f). Trends for LEA-C storage within aggregate fractions with this
treatment were similar to those with 1.5% LEA, but percentages derived from 3.0% LEA addition
were greater. Approximately 66% of LEA-C remained in the 0–15 cm depth 12 months after adding
3.0% LEA. Differences were not observed 0 months after the 1.5% LEA + 1.5% WS addition in any
depth and 3 months after application in the two deeper depths (Figures 6g–i). Greater
microaggregate-C remained 12 months after adding the 1.5% LEA + 1.5% WS treatment compared
to macroaggregate-C in any depth.

756
AIMS Environmental Science Volume 4, Issue 6, 743-762.
Figure 5. Soil organic C measured over a 12-month field incubation at depths (rows) of 0–5 cm (a-c), 5–15 cm (d-f), and 15–30 cm (g-i) and
size fractions (columns) of macroaggregates (a,d,g), microaggregates (b,e,h), and silt and clay (c,f,i). Means followed by the same letter
within depth, size fraction, and time are not significantly different at P < 0.05 by Fisher’s protected LSD. LEA and WS denote lipid-
extracted algae and wheat straw, respectively.
757
AIMS Environmental Science Volume 4, Issue 6, 743-762.
Figure 6. Percentage of organic C at depths (columns) of 0–5 (a, d and g), 5–15 cm (b, e and h), 15–30 cm (c, f and i) and macroaggregate,
microaggregate, and silt and clay (>250, 53–250, and <53 µm, respectively) size fractions derived from treatments (rows) of 1.5% LEA (a-c),
3.0% LEA (d-f), and 1.5% LEA + 1.5% WS (g-i). Means within depth, treatment, and time followed by the same letter are not significantly
different at P < 0.05 by Fisher’s protected LSD. LEA denotes lipid-extracted algae and WS denots wheat straw. Bars represent standard
error of the mean.

758
AIMS Environmental Science Volume 4, Issue 6, 743-762.
4. Discussion
Greater aggregate MWD for the control compared to LEA treatments was observed from 0 to 6
months after treatment application, possibly resulting from aggregate disruption when soil was
collected, homogenized, and mixed with treatments [43], or elevated levels of Na+ in LEA and K
+ in
WS may also have negated the positive effects of organic amendments on aggregation. Whalen and
Chang [44] attributed the decrease of macroaggregates after manure application to the dispersion of
soil colloids caused by monovalent cations of Na+ and K
+ in the manure. However, MWD 12 months
after 3.0% LEA application tended to be greater compared to the control or other treatments,
followed by 1.5% LEA addition. Greater MWD in soil amended with 3.0% LEA indicated a greater
proportion of macro- and microaggregates, and potentially greater SOC storage over time [5,6].
Chivenge et al. [43] also observed increased MWD over time, which was determined to be the result
of a greater proportion of macro- and microaggregates.
Soil treated with 1.5 or 3.0% LEA enhanced aggregate formation compared to 1.5% LEA + 1.5%
WS. The addition of organic amendments and plant residues, such as animal manure and WS,
respectively, have been demonstrated to improve soil stability by enhancing aggregate formation [9,44];
however, our study indicated that LEA applied with WS had less effect on aggregate formation
compared to LEA alone, possibly because of the initial more rapid mineralization, but ultimately
greater proportion of recalcitrant compounds in LEA compared to WS [14]. Quickly decomposing
organic materials with a narrow C:N ratio may produce a rapid but likely only temporary increase in
aggregate production, whereas slowly decomposing or more stable organic materials may produce a
lesser but more permanent improvement in aggregation [45,46]. Thus, the combination of both
quickly mineralizable and recalcitrant portions (algaenans) in LEA, may have enhanced both
aggregate formation and stability. After 6 months, the concentration of soil total N was nearly as
great at 15–30 cm as at 0–15 cm, implying significant movement of LEA associated inorganic N and
dissolved organic N (DON). Lynch et al. [47] recovered greater than 80% of composted manure-N in
coarser soil fractions one year after application.
Macroaggregate δ13
C from soil amended with 3.0% LEA was the most 13
C depleted treatment
12 months after application, indicating greater macroaggregate associated LEA-C for this treatment
at 0–5 and 5–15 cm soil depths (Figures 4a,d). Microaggregates from soils receiving any LEA
treatment stored more C compared to the control to 15 cm depth as evidenced by more depleted δ13
C
values for these treatments (Figures 4b,e). δ13
C signatures to 15 cm depth at 12 months also indicated
greater LEA-C in micro- compared to macroaggregates. However, at 15–30 cm depth, there was a
tendency for greater LEA-C in macro- rather than microaggregates. These results indicated
transformation of LEA during aggregate formation since δ13
C values increased from 0 to 12 months.
Based on δ13
C results, greater LEA-C was initially associated with the silt and clay fraction
when LEA was applied alone, but over time, greater LEA-C storage was observed in the macro- and
microaggregate fractions, implying that aggregate formation was enhanced with LEA application.
Compared to the LEA plus WS treatment, LEA applied alone generally was found more quickly in
the microaggregate and silt and clay fractions. These results agree with Zhang et al. [48], who
reported increased glucose-derived 13
C in silt and clay fractions and which was greater than in
macroaggregates and microaggregates on day 30 of incubation in all test treatments. Microaggregate
associated C may be more physically protected and biochemically more recalcitrant than that of

759
AIMS Environmental Science Volume 4, Issue 6, 743-762.
macroaggregates [9,10], and therefore, it may be possible to sequester more SOC with LEA-
amendment.
The change of δ13
C isotope composition from 0 to 12 months may be the result of both: (1)
preferential utilization or decomposition of substances with 12
C versus 13
C, and (2) stabilization of
organic materials after passing one or more microbial utilization cycles, which releases 13
C-depleted
CO2 compared to OM in C4 soils typical of arid and semi-arid environments [49]. With the above
two scenarios occurring together and organic material likely being more protected in macro- and
microaggregate fractions, the difference of δ13
C from 0 to 12 months for 1.5 and 3.0% LEA was
greater in the silt and clay fraction compared to macro- and microaggregates. Likely, LEA-C in all
fractions was being utilized by microorganisms, therefore increasing δ13
C, but it was only in macro-
and microaggregates that the more recalcitrant C, which is more depleted in 13
C, was being stored [43].
Soil OC tended to be greater in the silt and clay fraction compared to macro- or microaggregates,
possibly resulting from aggregate destruction during soil collection and treatment preparation,
consequently exposing protected OM to decomposers and accelerated SOM decomposition [50].
Parrita soil was homogenized by mixing prior to treatment preparation for the control and all other
treatments in order to reduce experimental error, but consequently may have somewhat altered soil
structure [43]. Comparing the 0–5 and 5–15 cm depths 12 months after treatment application,
macroaggregate SOC tended to be greater at 0–5 cm, while microaggregate SOC was greater at 5–15 cm.
Soil amended with 1.5% LEA, 3.0% LEA or 1.5% LEA + 1.5% WS resulted in greater SOC after 12
months for all soil size fractions and depths. Thus, LEA addition increased SOC at least in the short-
term. Chivenge et al. [43] observed greater macro- and microaggregate SOC and N than in the silt
and clay fraction. Bhattacharyya et al. [51] reported that the distribution of newly added manure C in
aggregates increased with aggregate size. Udom et al. [52] reported SOC to be more enriched in
larger aggregates than smaller aggregates in soil amended with poultry manure and spent mushroom
waste.
Lipid-extracted algae residue is mineralizable, but LEA tends to be more resistant to decay than
WS [14], and therefore, potentially may store greater SOC. Yousaf et al. [53] reported increased
SOC and reduced C-mineralization in biochar-amended soil compared to conventional biowaste
amendments possibly due to the presence of recalcitrant biochar-C. Recalcitrance of LEA is likely
associated with nonhydrolyzable macromolecules located in microalgae cell walls that comprised
13.4% (DM basis) of lipid-extracted Nannochloropsis salina algae residue.
5. Conclusions
This research demonstrated the potential beneficial use of LEA as a soil amendment to improve
soil structure through aggregate development and enhanced SOC storage. Soil application of LEA
enhanced initial aggregate formation and SOC storage by increasing aggregate MWD and macro-
and microaggregate associated SOC over time. Lipid-extracted algae was initially more recalcitrant
than WS and might contribute to longer-term SOC storage. However, caution should be taken to
reduce possible salinity-associated effects of over-applying LEA, such as hindering plant growth and
soil degradation from excess Na+. Lipid-extracted algae, when applied in proper amounts, may not
only supply plant essential nutrients and improve soil quality, but should also enhance the economic
and environmental viability of algae-produced biofuel.
760
AIMS Environmental Science Volume 4, Issue 6, 743-762.
Acknowledgements
Funding for this research was provided by the U.S. Department of Energy through contract DE-
EE003046 to the National Alliance for Advanced Biofuels and Bioproducts (NAABB).
Conflict of interest
All authors declare no conflicts of interest in this paper.
References
1. Schlesinger WH (1997) Biogeochemistry. Geotimes 42: 44.
2. Amundson R (2001) The carbon budget in soils. Annu Rev Earth Planet Sci 29: 535-562.
3. Degens BP, Schipper LA, Sparling GP, et al. (2000) Decreases in organic C reserves in soils can
reduce the catabolic diversity of soil microbial communities. Soil Biol Biochem 32: 189-196.
4. Karami A, Homaee M, Afzalinia S, et al. (2012) Organic resource management: impacts on soil
aggregate stability and other soil physico-chemical properties. Agric Ecosyst Environ 148: 22-28.
5. Plante AF, McGill WB (2002) Soil aggregate dynamics and the retention of organic matter in
laboratory-incubated soil with differing simulated tillage frequencies. Soil Till Res 66: 79-92.
6. Six J, Conant RT, Paul EA, et al. (2002) Stabilization mechanisms of soil organic matter:
implication for C-saturation of soils. Plant Soil 241: 155-176.
7. Tisdall JM, Oades JM (1982) Organic matter and water-stable aggregates in soils. J Soil Sci 33:
141-163.
8. Chivenge P, Vanlauwe B, Gentile R, et al. (2011) Comparison of organic versus mineral
resource effects on short-term aggregate carbon and nitrogen dynamics in a sandy soil versus a
fine textured soil. Agric Ecosyst Environ 140: 361-371.
9. Six J, Elliott ET, Paustian K (1999) Aggregate and soil organic matter dynamics under
conventional and no-tillage systems. Soil Sci Soc Am J 63: 1350-1358.
10. Jastrow JD, Boutton TW, Miller RM (1996) Carbon dynamics of aggregate-associated organic
matter estimated by carbon-13 natural abundance. Soil Sci Soc Am J 60: 801-807.
11. Wright AL, Hons FM (2005) Soil carbon and nitrogen storage in aggregates from different
tillage and crop regimes. Soil Sci Soc Am J 69: 141-147.
12. Ghidey F, Alberts EE (1993) Residue type and placement effects on decomposition: field study
and model evaluation. Trans ASAE 36: 1611-1617.
13. Franzluebbers AJ, Zuberer DA, Hons FM (1995) Comparison of microbiological methods for
evaluating quality and fertility of soil. Biol Fert Soils 19: 135-140.
14. Rothlisberger-Lewis KL, Foster JL, Hons FM (2015) Soil carbon and nitrogen dynamics as
affected by lipid-extracted algae application. Geoderma 262: 140-146.
15. Gelin F, Volkman J, Largeau C, et al. (1999) Distribution of aliphatic, nonhydrolyzable
biopolymers in marine microalgae. Org Geochem 30: 147-159.
16. Poirier N, Derenne S, Rouzaud J, et al. (2000) Chemical structure and sources of the
macromolecular, resistant, organic fraction isolated from a forest soil (Lacadee, south-west
France). Org Geochem 31: 813-827.
761
AIMS Environmental Science Volume 4, Issue 6, 743-762.
17. Balesdent J, Mariotti A (1987) Natural 13
C abundance as a tracer for studies of soil organic
matter dynamics. Soil Biol Biochem 19: 25-30.
18. Tieszen TJ, Boutton TW (1989) Stable carbon isotopes in terrestrial ecosystem research, In:
Rundel PW et al. Stable isotopes in ecological research, Ecological studies 68, New York:
Springer-Verlag, 167-195.
19. Boutton TW (1996) Stable carbon isotope ratios of soil organic matter and their use as indicators
of vegetation and climate change, In: Boutton TW, Yamakaki S, Mass spectrometry of soils,
New York: Marcel Dekker, 47-82.
20. Farquhar GD, Ehleringer JR, Hubick KT (1989) Carbon isotope discrimination and
photosynthesis. Annu Rev Plant Physiol Plant Molec Biol 40: 503-537.
21. Wada E, Ando T, Kumazawa K (1995) Biodiversity of stable isotope ratios, In: Wada E et al.,
Stable isotope in the biosphere, Japan: Kyoto University Press, 7-14.
22. Gerzabek MH, Pichlmayer F, Kirchmann H, et al. (1997) The response of soil organic matter to
manure amendments in a long-term experiment in Ultuna, Sweden. Euro J Soil Sci 48: 273-282.
23. O’Leary MH (1981) Carbon isotope fractionation in plants. Phytochem 20: 553-567.
24. Solomon D, Fritzche F, Lehmann J, et al. (2002) Soil organic matter dynamics in the subhumid
agroecosystems of the Ethiopian highlands: evidence from natural 13
C abundance and particle-
size fractionation. Soil Sci Soc Am J 66: 969-978.
25. Balesdent J, Mariotti A (1987) Natural 13
C abundance as a tracer for studies of soil organic
matter dynamics. Soil Biol Biochem 19: 25-30.
26. Liao JD, Boutton TW, Jastrow JD (2006) Organic matter turnover in soil physical fractions
following woody plant invasion of grassland: evidence from natural 13
C and 15
N. Soil Biol
Biochem 38: 3197-3210.
27. Storer DA (1984) A simple high volume ashing procedure for determining soil organic matter.
Comm Soil Sci Plant Anal 15: 759-772.
28. McGeehan SL, Naylor DV (1998) Automated instrumental analysis of carbon and nitrogen in
plant and soil samples. Comm Soil Sci Plant Anal 19: 493.
29. Schulte EE, Hopkins BG (1996) Estimation of soil organic matter by weight by weight loss-on-
ignition, In: Magdoff FR, Tabatabai MA, Hanlon EA, Jr, Soil organic matter: analysis and
interpretation, Wisconsin: Soil Sci Soc Am, 21-32.
30. Isaac RA, Johnson WC (1975) Collaborative study of wet and dry ashing techniques for the
elemental analysis of plant tissue by atomic absorption spectrophotometry. J Assoc Off Anal
Chem 58: 436-440.
31. Havlin JL, Soltanpour PN (1989) A nitric acid and plant digest method for use with inductively
coupled plasma spectrometry. Commun Soil Sci Plant Anal 14: 969-980.
32. Van Soest PJ, Robertson JB, Lewis BA (1991) Methods for dietary fiber, neutral detergent fiber,
and nonstarch polysaccharides in relation to animal nutrition. J Dairy Sci 74: 35-68.
33. AOAC (1990) Official methods of analysis. 15th ed, Virginia: Assoc Off Anal Chem.
34. Ankom, 2013. Method 8—determining acid detergent lignin in beakers. Available from:
http://www.ankom.com/media/documents/Method_8_Lignin_in_beakers_3_13_13.pdf.
35. Mehlich A (1978) New extractant for soil test evaluation of phosphorus, potassium, magnesium,
calcium, sodium, manganese, and zinc. Comm Soil Sci Plant Anal 9: 477-492.
36. Mehlich A (1984) Mehlich-III soil test extractant: a modification of Mehlich-II extractant.
Comm Soil Sci Plant Anal 15: 1409-1416.
762
AIMS Environmental Science Volume 4, Issue 6, 743-762.
37. Lindsay WL, Norvell WA (1978) Development of a DTPA soil test for zinc, iron, manganese,
and copper. Soil Sci Soc Am J 42: 421-428.
38. Chepil WS, Bisal F (1943) A rotary sieve method for determining the size distribution of soil
clods. Soil Sci 56: 95-100.
39. Kemper WD, Chepil WS (1965) Size distribution of aggregates, In: Black CA, et al., Methods of
soil analysis, part I. 9th ed. Wisconsin: Am Soc Agron, 499-510.
40. Rhoades JD (1982) Soluble salts, In: Page AL, et al., Methods of soil analysis: part 2. Agronomy
Monogr 9. 2nd ed. Wisconsin: Am Soc Agron and Soil Sci Soc Am, 167-178.
41. Coplen TB (1996) New guidelines for reporting stable hydrogen, carbon, and oxygen isotope-
ratio data. Geochim Cosmochim Acta 60: 3359-3360.
42. SAS Institute (2012) SAS system for Windows. Release 9.3, SAS Inst Inc, Cary, North Carolina
USA.
43. Chivenge P, Vanlauwe B, Gentile R, et al. (2011). Organic resource quality influences short-
term aggregate dynamics and soil organic carbon and nitrogen accumulation. Soil Biol Biochem
43: 657-666.
44. Whalen JK, Chang C (2002) Macroaggregate characteristics in cultivated soils after 25 annual
manure applications. Soil Sci Soc Am J 66: 1637-1647.
45. Khaleel R, Reddy KR, Overcash MR (1981) Changes in soil physical properties due to organic
waste applications: a review. J Environ Qual 10: 133-141.
46. Sun H, Larney FJ, Bullock MS (1995) Soil amendments and water-stable aggregation of a
desurfaced dark brown chernozem. Can J Soil Sci 75: 319-325.
47. Lynch DH, Voroney RP, Warman PR (2006) Use of 13
C and 15
N natural abundance techniques
to characterize carbon and nitrogen dynamics in composting and in compost-amended soils. Soil
Biol Biochem 38: 103-114.
48. Zhang H, Ding W, Luo J, et al. (2015) The dynamics of glucose-derived 13C incorporation into
aggregates of a sandy loam soil following two-decade compost or inorganic fertilizer
amendments. Soil Till Res 148: 14-19.
49. Werth M, Kuzyakov Y (2010) 13
C fractionation at the root-microorganisms-soil interface: A
review and outlook for partitioning studies. Soil Biol Biochem 42: 1372-1384.
50. Cambardella CA, Elliott ET (1993). Carbon and nitrogen distribution in aggregates from
cultivated and native grassland soils. Soil Sci Soc Am J 57: 1071-1076.
51. Bhattacharyya R, Prakash V, Kundu S, et al. (2010) Long-term effects of fertilization on carbon
and nitrogen sequestration and aggregate associated carbon and nitrogen in the Indian sub-
Himalayas. Nutr Cycl Agroecosyst 86: 1-16.
52. Udom BE, Nuga BO, Adesodun JK (2016) Water-stable aggregates and aggregate-associated
organic carbon and nitrogen after three annual applications of poultry manure and spent
mushroom wastes. Appl Soil Ecol 101: 5-10.
53. Yousaf B, Liu G, Wang R, et al. (2017) Investigating the biochar effects on C-mineralization
and sequestration of carbon in soil compared with conventional amendments using the stable
isotope (delta C-13) approach. Glob Change Biol Bioenergy 9: 1085-1099.
© 2017 the Author(s), licensee AIMS Press. This is an open access
article distributed under the terms of the Creative Commons
Attribution License (http://creativecommons.org/licenses/by/4.0)