ing. vít ondruch
TRANSCRIPT

BRNO UNIVERSITY OF TECHNOLOGY
Faculty of Electrical Engineering and CommunicationDepartment of Microelectronics
Ing. Vít Ondruch
ANALYSIS OF THICK FILM AMPEROMETRICAL SENSORSSIGNAL AND ITS USAGE FOR MEASUREMENT AND
CHARACTERIZATION OF ENZYMES
ANALÝZA SIGNALŮ TLUSTOVRSTVÝCH AMPÉROMETRICKÝCH SENZORŮ A JEJICH POUŽITÍ PRO MĚŘENÍ A CHARAKTERIZACI ENZYMŮ
SHORT VERSION OF PHDTHESIS
in study programme
MICROELECTRONICS AND TECHNOLOGY
Supervisor: Prof. Ing. Radimír Vrba, Csc. Brno 2009

Klíčová slovaBiosenzor, Analýza signálů, Herbicidy, Inhibice, Fotosystém II, Synchronní
detekce
Key wordsBiosensor, Signal analysis, Herbicides, Inhibition, Photosystem II, Synchronous
detection
This work is available at the Department of Microelectronics FEEC, Údolní 53, Brno, 602 00.
©Vít Ondruch, 2009ISBN 80-214-ISSN 1213-4198
2

Contents
1 INTRODUCTION....................................................................................................51.1 Prevailing Methods...............................................................................................................51.2 Biosensors.............................................................................................................................6
2 SENSORS.................................................................................................................72.1 Chemical Sensor...................................................................................................................72.2 Sensor Manufacturing Technologies....................................................................................7
2.2.1 Thick-film..................................................................................................................82.2.2 Thin-film....................................................................................................................8
2.3 Bisosensors...........................................................................................................................92.3.1 History.......................................................................................................................92.3.2 Principle....................................................................................................................9
3 THEORY................................................................................................................103.1 Synchronnous Detection Method Elicitation......................................................................12
4 MATERIAL & METHODS...................................................................................134.1 Biosensor System................................................................................................................134.2 Measuring Procedure..........................................................................................................13
5 RESULTS AND DISCUSSION.............................................................................14
6 CONCLUSION.......................................................................................................18
7 CURRICULUM VITAE.........................................................................................20
8 ABSTRACT............................................................................................................21
3

4

1 INTRODUCTIONThis work was motivated by a preceding research in field of biosensors and
analysis of the behavior of bioactive species bound to their working electrodes. These bioactive materials improved specificity of the sensor, however, evaluation was usually done by graphical methods based just on empirical experiences [3][4].
The key outcome of this work is a synchronous detection (SD) method. It is a novel method of analysis of biosensor output signals. It enables precise evaluation of biosensor's responses and give insight into work of enzyme's active site.
For better understanding of the SD, the necessary precondition is basic knowledge of problematic of enzymes and importance of enzyme in living organism, including last but not least human body. The unique features of enzymes can be utilized in modern measuring systems in form of a thin membrane on active electrode of a biosensor.
SD method was experimentally confirmed by real measurements and obtained results are later discussed in details.
1.1 PREVAILING METHODSIn many fields of human activities, for example medicine, ecology or industry, it
is necessary to obtain chemical information. After its evaluation, results can be applied to control or alter a given process by the retrieved information. That is possible to reach in two ways.
First, results can be obtained by demanding analysis, which requires expensive laboratory equipment, chemicals, qualified personnel and considerable amount of time [4][10].
Alternative to this classical approach is utilization of electronical sensors. They are used in variety of situations in human day life and can also prove their abilities in chemical analysis. Their functionality is based on the principle of oxidation reduction reaction, when there are electrons released during oxidation of matter at the certain potential.
The extent of this sensors allows to produce miniature devices, which are easily portable. That is advantage for their usage in field or by the patient, without necessity of usage expensive services of specialized laboratories. The device can also be equipped with methods and algorithms for evaluation of measured results. This simplifies operation and cuts down demand for qualified personal. All these attributes essentially increase the speed of analysis lowering its price considerably.
When the classical macroelectrode is being prepared, a glass maker seals the platinum wire into the glass. The modern electrochemical sensors are made by methods, which are ordinarily used in integrated circuits production (a thin film technology) or in manufacturing of hybrid integrated circuits (a thick film technology). They allow to produce sensors with exactly defined parameters.
Application of microelectrotechnical technology in field of electrochemical sensor brings brand new qualities to this branch. The most essential are:
5

• High material purity.• Reproducible preparation.
However, the electrochemical sensors also have disadvantages, for example low selectivity. Chemical solutions usually contain more species of chemical substances, which influence sensor's response in an unexpected way. It precludes to determine exact amount of specific matter, which is included in solution.
1.2 BIOSENSORSThe selectivity problems are suppressed by biosensors. They are commonly
defined as analytical tool, which uses biochemically sensitive material to obtain chemical information without need for complicated assay treatment. In connection with suitable transducer the quantitative measurable signal can be provided. Current or potential are the most common examples of such signal. Biosensors differ from regular electrochemical sensors in biochemical material deposited on working electrode, which reacts selectively.
The main advantage of biomaterials summarized J. Krejčí in his doctoral thesis [6]: “In millions of years of nature evolution very effective mechanisms of evaluation and transfer of chemical information have been developed. As an example could be mentioned enzymes, hormones, antibodies, receptors and many others biochemical systems. These systems are very diversified thanks to natural selection and very often highly optimized and specialized for their task.”
Usage of the biosensors is favorable from the user's point of view, but it brings in a lot of new problems, as isolation of bioactive element, description of its properties and the way of interconnection with transducer. The diffusion and run of matter through the membrane are not sufficiently resolved. Issues with a long time stability (the used biological materials are notorious unstable) and nonlinear behavior make the mathematical-physically description very complicated. The problems with analysis rise extremely.
Even though scientists usually evaluate properties of bioactive materials as free elements in solution, they have to work with simplified assumptions. The description of the bioactive material behavior is not always easy nor straightforward, in many cases it is yet incomplete or unfinished.
The situation is getting even more complicated when working with immobilized bioactive matters. Immobilization on active electrode of biosensor can significantly influence parameters of enzymes in comparison with free enzyme in solution. Parameters can change due to:
• Binding to membrane, which can influence steric conformation of enzyme, availability of substrate binding site, etc.
• Change in diffusion of enzyme, substrate and analyzed sample through membrane.
• Change in environment parameters in closest proximity of bound enzyme, e.g. change of pH or ionic strength.
6

Research in this field can bring light into mechanism of functionality of immobilized bioactive species. Improvement in characterization of bioactive matter can help improve production quality, quality control of biosensors, reproducibility and also parameters of biosensor itself, such as selectivity, signal to noise ratio or better detection limits.
This work aims to improve characterization of enzyme properties and ease evaluation of biosensor's responses. It can be achieved by replacing prevailing graphical methods and increasing evaluation precision by modern numerical methods. It should improve understanding of difference between functionality of enzyme in solution and enzyme immobilized on active electrode of biosensor. In future, this knowledge can also be extended to other bioactive materials such as antibodies, algae and even more complex species.
2 SENSORSSensor is a device that measures or detects a real-world condition, such as motion,
heat or light and converts the condition into a signal which can be read by an observer or by an instrument. There are many types of sensors, e.g. an optical sensor detects the intensity or brightness of light, litmus paper tests for acids and alkalis, which gives a qualitative indication by means of color reaction, or a mercury thermometer converts the measured temperature into expansion and contraction of a liquid which can be read on a calibrated glass tube.
Sensors also have impact on what they measure, therefore they need to be designed to have a small effect on what is measured, making the sensor smaller often improves this and may introduce other advantages. Good sensors should be sensitive to the measured property and insensitive to any other properties. Ideal sensor should be linear, in other words the output of sensor is linearly proportional to the value of the measured property.
Every sensor has to be connected to a transducer of some sort, which is responsible for conversion of an observed change into measurable signal.
2.1 CHEMICAL SENSORThis work deals with chemical sensors which measure chemical substances by
chemical or physical responses. R. W. Catterall [1] defined sensor as a device which responds to a particular analyte in a selective way through a chemical reaction and can be used for the qualitative or quantitative determination of the analyte. Such material is usually referred to be a substrate, although the more general term analyte is sometimes used.
2.2 SENSOR MANUFACTURING TECHNOLOGIESThere exist a lot of electrochemical sensor types. In these days mainly two basic
types of sensors prevail: thick-film or thin-film sensors. The active part of a thick-
7

film sensor is in order of micrometres whilst the thin-film sensors active layer is thinner than one micrometer.
2.2.1 Thick-filmThick-film sensors's sensing electrodes, electrical pathways together with contact
facets, are formed by the deposition of layers of special pastes onto an insulating substrate. Ceramic (Al2O3) is the most common one. The pastes are usually referred to as inks, although there is little resemblance to conventional ink. The paste contains powder semiconducting material, organic binder and also other substances in some cases. It is necessary to adhere paste composition during its preparation, because it influences viscosity, wettability and adhesion.
Layers are most commonly applied using screen printing, i.e. using mask plate, which allows to create on substrate patterns of desired geometrical shapes and thickness. As further alternative methods can be used spraying, dipping with etching or stamping. The paste pattern is fired in a manner akin to the production of pottery to produce electrical pathways of a controlled resistance. The tempering cycle (heating rate, maximal temperature and cooling rate) significantly influences porosity of layer and therefore resulting sensitivity of sensor.
2.2.2 Thin-filmThe thick-film technology is mature and widely used method mainly for
manufacturing of discrete electrical parts with lower level of integration. The requirements of lower power consumption for sensors operation, higher level of integration and compatibility with production technology of processing electronic circuits lead to miniaturization and more frequent use of the thin-film technology.
The thin-film technology uses ceramic as well as semiconductor substrates. It is used for preparing metal electrodes for signal sensing and also for active detection layers. The contact pads and active areas can be produced by using lithographic method.
Commonly used methods of thin-film deposition are sputtering, vacuum evaporation and chemical vapor deposition by gas flow (CVD). Thin-film technologies provide high variability and they are fully compatible with integrated circuits. It is also well possible to prepare two dimensional arrays of sensors. The advances in miniaturization allow to shrink the size of a sensors and reduce their energy consumption.
There also exists many other technologies for production of electrochemical sensors. Pulsed laser deposition (PLD) seems to be the most promising alternative to “classical” deposition technologies. This method has several advantages: preservation of chemist of material which should be depositioned on substrate, high flexibility in choice of organic and inorganic materials for deposition and deposition of precise films with exactly defined layer structures. The material is deposited by using high power pulsed laser beam focused inside a vacuum chamber to strike
8

a target of the desired composition. Material is then vaporized from the target and deposited as a thin film on a substrate, such as a silicon wafer facing the target. This process can occur in ultra high vacuum or in the presence of a background gas.
2.3 BISOSENSORSBiosensors are really a sub-set of chemical sensors. As defined by B. R.
Eggins [2], a biosensor is a device incorporating a biological sensing element connected to a transducer. The analyte detected and measured by this sensor may be purely chemical, although biological components may be the target analyte. The key difference is that the recognition element is of biological nature.
2.3.1 HistoryThe history of biosensors began roughly fifty years ago when L. C. Clark
and C. Lyons published their work [4], where they combined oxygen electrode with enzyme in gel layer for the first time. Five years later, an article [13] was published in magazine Nature by S. J. Updike and G. P. Higs, who introduced the "Enzyme electrode" name for the membrane with enzyme in conjunction with a suitable electrode.
In the following years, a lot of effort was made in development of this young interdisciplinary science sector. Until 1990 there were more than 800 specialized publications dealing with this theme published [8]. It was proven, that combination of biocatalytical system with transducer on electrical signal is very productive. The more and more complex biological systems begun to be tested, e.g. cell organelle, bacteria, antibodies and even whole living organisms in conjunction with suitable transducer. Results were published in specialized magazine "Biosensors and Bioelectronics" and on specific conferences dedicated just to the biosensors.
First commercial applications were predetermined by their fundamentals for use in ecology and medicine. These devices became irreplaceable with increasing accent on environment monitoring.
There were more then 2000 scientific articles about biosensor technology published, as was summed-up in work "Biosensors - Present State and Future Trend" [12].
2.3.2 PrincipleWorking electrode of biosensor is usually formed by a graphite-powder-based
ink. The reference electrode is usually silver-silver chloride ink. Appropriate modifying components can be incorporated into the carbon ink, such as gold, mercury, chelating agents, mediators such as glucose oxidase, ascorbic acid oxidase, glutathione oxidase or PSII.
The selective element has to be attached to a transducer. This process is known as immobilization. It could be problematic if the selective element is of biological nature.
9

Since enzymes are expensive to produce, immobilization on sensor makes economical sense. It allows to recover enzyme after it has carried out its intended function, so that it can be reused or recycled. The advantage is also that immobilized enzymes often display increasing stability due to the fact that their support material can provide protection from pH and temperature changes in the surrounding environment.
In further parts of this work, for the measurement and the analysis sensors produced by using thick-film technology are used. This technology allows to prepare biosensors with a bioactive layer of enzymes on their working electrode. This layer highly increases sensitivity and selectivity of a sensor on certain substances of solution and they proved to be the most successful in practice.
3 THEORYLet us suppose we have an enzymatic electrochemical biosensor with a working
electrode of diameter d. On the electrode there is an immobilized layer of bioactive compounds of thickness h. The bioactive layer contains n bioactive centers, that catalyze the reaction of the biosensor with the analyte. The response of each bioactive center is fj, where j goes from interval 1 to n. If phenomena on the working electrode are measured with a time resolution lower than t0 = h2/2/D [9], where D stands for the diffusion coefficient of the analyte in the membrane, then all the bioactive centers can be assumed to be in similar conditions – the concentration of the analyte in the membrane will be nearly at equilibrium. The standard thickness of a bioactive membrane is about 1 to 10 µm. The diffusion coefficient of small molecules, such as those of a mediator or inhibitor, is lower than 1000 Dalton. It means that the diffusion coefficient in polymeric membranes, such as a dialysis membrane, is of the order from 10 × 10-12 to 100 × 10-12 m2s-1 [7]. Under such conditions, t0 is typically 5 to 5000 ms. For the measurements with a time resolution of 100 ms, it can be assumed that all the bioactive centers are under the same conditions, while the thickness of the immobilized membrane is about 1 µm and a high diffusion coefficient of analyte in the immobilized layer is achieved.
Differences between the activity of individual bioactive centers may be caused by differences in their immobilization, ambient conditions, local pH fluctuations and many other influences [5]. By contrast, the external influences are the same defined condition for all bioactive centers.
In the above-mentioned condition, the response of the electrochemical measurement will be
f r=∑j=1
n
f j , (3.1)
where fr is the resulting response of all centers. The average response of one bioactive center is
10

f =1n∑j=1
n
f j (3.2)
and so the measured response can be expressed by average bioactive center responsef r=n f . (3.3)
Once the compound (inhibitor) is added to the system, it can modify the level of activity of individual active centers or the overall number of active centers. The resulting effect that is measured is the change in the sensor's response after the inhibition. Two reaction mechanisms which can be potentially observed are further discussed below:
Model 1: The number of bioactive centers remains unchanged but the properties of individual centers change. This situation is described by the equation
f f i . (3.4)
Model 2: The second situation is when the number of free bioactive centers changes n=n i (3.5)
at unchanged average response f of a single active center. This change is a dynamic process. Active sites are inactivated when the active centers are occupied by an inhibitor, and they can be reactivated when the inhibitor is released again. This model is more frequently accepted. The two simplest sub-models of model 2 are reversible and irreversible inhibition.
(a) Irreversible inhibitionA change in the number of free bioactive centers from an initial state without
an inhibitor, when the system contains n free centers, to a final state where the (n - ni) centers are occupied by an inhibitor and the system contains a changed number of free bioactive centers ni, is described for the irreversible reaction by the equation
n k ' 1 ni , (3.6)
where k'1 is the rate constant of transition from state n to state ni or better irreversible inhibition rate. This rate constant depends on the number of molecules of inhibitor in the close proximity of an active center. The scheme can be expressed by the differential equation
dndt
=−k ' 1 n=−k 1 i n , (3.7)
where i is the number of inhibitor molecules in close proximity of active centers. The initial condition can be written as n(0) = n0, where n0 is the initial amount of active centers. The equation (3.7) has a solution, which can be expressed in concentrations as
Cnt =e−k1 C i t , (3.8)
11

where Cn(t) = n(t) / n0 is the concentration of free active centers at time t and Ci is the molar concentration of the inhibitor in the bioactive membrane.(b) Reversible inhibition
A change in the number of free bioactive centers is described by a reversible reaction. The transition from a state without an inhibitor to a state with some centers occupied can be described by the equation
n k '−1
k ' 1
n i . (3.9)
This scheme can be described by the differential equations dndt =−k ' 1 nk−1 nidni
dt =k ' 1 n−k−1 n i , (3.10)
where k'1 is the rate constant of transition from state n to state ni and k-1 describes the transition of an inactive center to its active state. Again, these equations can be solved. The rate constant k'1 = k1 Ci depends on the number of molecules of inhibitor in the close proximity of an active center. The solution can be expressed in concentrations as
Cnt =1
k 1C ik−1k−1k 1C i e
−k1 C i k−1 t . (3.11)
In both cases (Models 1 and 2), the assumption about the time resolution is crucial. This requirement means that each bioactive center is in equilibrium with a surrounding number of inhibitor molecules and the whole bioactive membrane inhibitor concentration is in equilibrium with the bulk inhibitor concentration.
3.1 SYNCHRONNOUS DETECTION METHOD ELICITATIONThe real measurement consists of the phenomenon which one wishes to measure
plus various interfering phenomena, e.g. long time drift, noise, etc. It can be described by the formula
f r=n f a the response without inhibitor,f ri=ni f a the response with inhibitor,
(3.12)
where a is the sum of all experimental influences which disturb the measurement and ni is the number of free biocative centers when the measurement is influenced by inhibitor.
The unknown average response of signal of active center can be eliminated from equation (3.12)
f ri=n i
nf r−
ni
naa i . (3.13)
The equation (3.13) can be rewritten in the form
12

f ri=n i
nf r−b
n i
n, a , a i (3.14)
and expressed in concentrations as f ri t =C n t f rt −b C nt , a ,ai , (3.15)
where the tilde above the t emphasizes the fact that the time scales for fr and Cn are different. Equation (3.15) is a linear model with respect to fr. The linear correlation fr(t) and fri(t) gives the values of Cn t and b C nt , a , ai .
Cn t in equation (3.15) can be expressed by equations (3.8) or (3.11), where time t is replaced by t . The model is a general one and independent of equations (3.6) and (3.10). This means that more complicated models of reaction kinetics can also be evaluated using equation (3.15).
4 MATERIAL & METHODS4.1 BIOSENSOR SYSTEMThe oxygen evolving PSII-complex preparations were isolated from the
thermophilic cyanobacterium Synechococcus elongatus using a non-ionic detergent, heptylthioglucoside, according to the procedure described previously by M. Koblizek [4] and E. Setlikova [11].
The biosensor toxicity analyser is used for the detection of photosynthetic herbicides. The oxygen-evolving PSII particles were immobilised on the surface of the platinum-working electrode. The principle of detection is based on the measurement of electric current, which corresponds to the reduction of the artificial mediator duroquinone generated by short pulses of red light. After the herbicide addition, the light-driven electron transport through PSII is impaired in a concentration-dependent manner.
The suspension of isolated PSII particles was thoroughly mixed with a solution of bovine serum albumine and glutaraldehyde. A drop of this mixture was placed on the surface of the Pt-working electrode and left for polymerization under the dimmed green light.
4.2 MEASURING PROCEDUREThe sensor with the immobilized PSII complex was inserted into the micro fluidic
system (MFS) which assures the reproducible mass transfer between a bioactive sensor layer and a measured solution. A chamber of MFS was filled with 10 ml of MES buffer containing the artificial electron acceptor duroquinone. Signal acquisition as well as the control of other functions of the PSII biosensor was realized through a Biosensor Toxicity Analyser BA1.1 (BTA) control unit. The working electrode of the sensor was polarized at +620 mV vs. the Ag/AgCl pseudo-reference electrode of the AC1.W2.RS sensor in order to allow the reoxidation of duroquinone.
13

The circulation pump was switched on for a 10 minutes period for stabilization of the system in dark. After stabilization, a sequence of m light/dark cycles was applied to the sensor in the solution without herbicide (control sample), where m was in the range of 4 to 25 cycles. An example of part of the measurement can be seen in Fig.2(a). Details of a typical measuring light/dark cycle can be seen in Fig. 1. This cycle consists of a short pulse of red light (5 s). During this period of time the signal on the electrode increases due to the reduction of duroquinone by electrons being transported through the PSII complex. The light pulse is followed by a 20 s dark period. When the light is switched off, the signal decreases (due to the reoxidation of the duroquinone) and returns close to its initial value. In the presence of photosynthesis inhibitors, the signal response is reduced. The diuron solution (standard) would then be injected to yield the final concentration of Ci and the sequence of m light/dark cycles applied again. All data were processed by the custom-made software, which allowed the application of a synchronous mode of detection.
5 RESULTS AND DISCUSSIONSD divides the measured signal to fast response corresponding to stimulation Fig.
2(d) and slow processes connected with PSII particles inhibition Fig. 2(c). Final dependence of free active centers concentration n(t) / n(0) on time is in Fig. 2(e). The method of SD is demonstrated on example of PSII but decomposition procedure is general. SD can be used in application where two processes are superimposed - the fast response to stimulation and slow response of processes on the background of stimulation.
14
Fig. 1: Responseof the PSII biosensor to a light pulse.

The analysis of the slow process enables to obtain information about the kinetics of inhibition. Analysis of the fast process after light stimulation enables a deeper insight into phenomena connected with the average behavior of an PSII active center; these involve diffusion of the mediator, transfer of electrons in the active center, influence of membrane swelling.
The response to stimulation in case of PSII immobilized in thin membrane (1 – 5 µm) is 1st order process. The increasing part and decreasing part of response are described by exponential functions. The decline from 1st order process is less than 1 %. The linear dependance between pattern and measured signal confirms that process of inhibition is based on a change of number of active centres of PSII.
15
Fig. 2: An example of measured signal with evaluation. Inhibition of PSII causes the signal decrease.
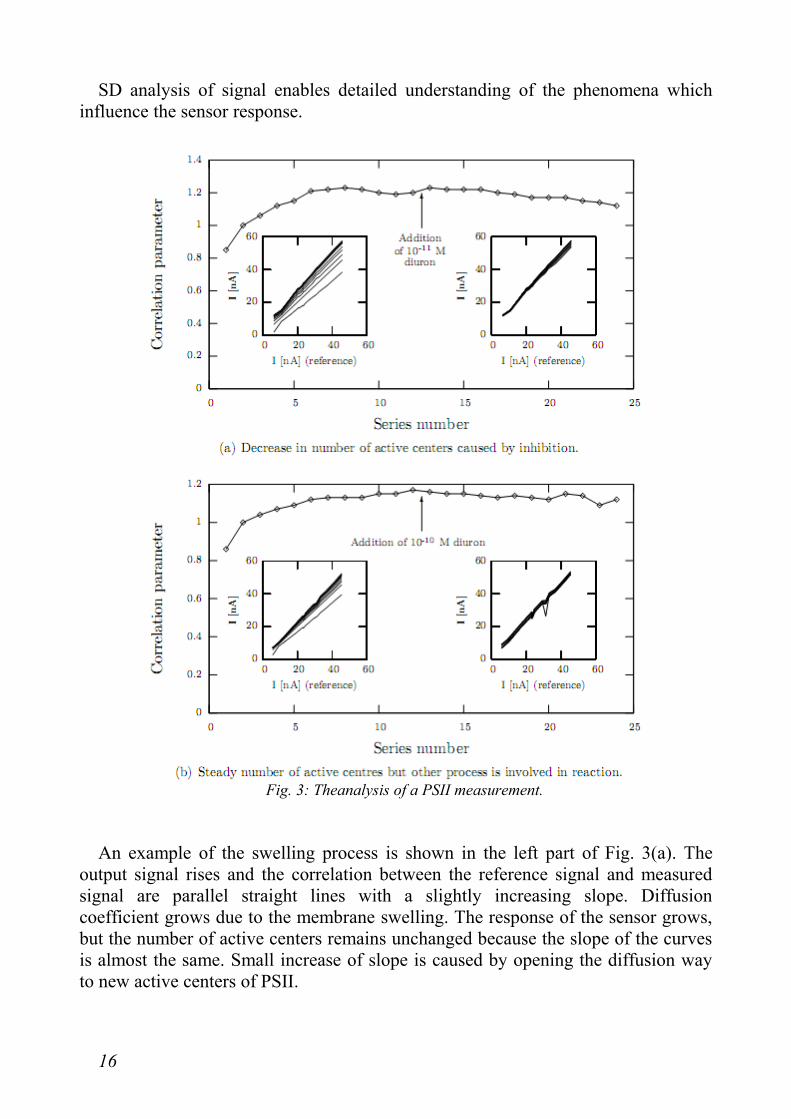
SD analysis of signal enables detailed understanding of the phenomena which influence the sensor response.
An example of the swelling process is shown in the left part of Fig. 3(a). The output signal rises and the correlation between the reference signal and measured signal are parallel straight lines with a slightly increasing slope. Diffusion coefficient grows due to the membrane swelling. The response of the sensor grows, but the number of active centers remains unchanged because the slope of the curves is almost the same. Small increase of slope is caused by opening the diffusion way to new active centers of PSII.
16
Fig. 3: Theanalysis of a PSII measurement.

Sensitivity to inhibitor is demonstrated in Fig. 3(b) left inserted panel. After addition of 10-10 M diuron the signal decreased. However it decreases as whole at unchanged number of active centers of PSII. The change of signal at low concentration of inhibitor can be caused by other reasons (washing out active centers, their spontaneous inhibition or inhibition by light as can be seen in Fig. 3(a) right inserted panel addition of 10-11 M diuron).
The dependence of kinetic constants of PSII biosensor on concentration is in Fig.4. If the model (3.9) describes the function of PSII biosensor, then k1, k-1 and Ke are constants. It was observed that only k1 is constant in range from 10-6 to 10-4 mM of diuron. This is in agreement with reaction step E I
k1 EI where E denotes the PSII concentration. The kinetic constant k-1 however depends on the inhibitor concentration. It is in contradiction with simple complex EI decomposition according to EI
k−1 E I . The simplest explanation consists of the hypothesis that there is possibility of binding molecules of inhibitor in the active center and the decomposition of EI2 complex is faster then EI complex. Then the kinetic scheme of complex of PSII interaction with inhibitor can be expressed as follows:
E I k1 EI ,
EI k−1 EI ,
EI I k2 EI 2
k3 E2 I , (5.1)
where k1, k-1, k2 and k3 are rate constants. The fact that the kinetic constant k1 is independent on inhibitor concentration in
range from 10-6 to 10-4 mM enables to propose regions where the inhibitor can be used for concentration measurement. The constant k1 can be evaluated by means of inhibitor concentration. This constant is used for concentration calculation of unknown sample.
17
Fig. 4: Dependency of kinetic constants on concentration.

6 CONCLUSIONThe synchronous detection method (SD) was demonstrated on the inhibition
process which inactivates the active center of Photosystem II (PSII) enzyme. SD enables decomposing of the signal to fast and slow processes. The fast process is connected with an electrode transfer, a mediator diffusion and a substrate reaction whereas the slow process describes the inhibition itself.
SD allows to identify a signal, whose analysis enables to study the kinetics of the inhibition reaction and the mechanism of the active center response. It is an invaluable tool for exploring the properties of the immobilized active center of enzymes, which are possible to stimulate. An example of enzyme which can be stimulated is PSII. This enzyme is sensitive to light. However there also exist plenty of other enzymes which can be stimulated for example by pressure, heat, etc. Nevertheless, there are more technical challenges which need to be solved prior, e.g. achieving the fast changes of temperature is not as easy as switching the light on and off and so on. Once this kind of issues is solved, another large field for application of SD method will be opened.
In all the analyzed measurements, a good conformity between the signals of each stimulation response was found as Fig. 2 shows. Compared to the evaluation using the heights of the response peaks [3], it was possible to obtain more precise results with an error below one percent.
The method of synchronous detection allows the kinetics of the inhibition reaction and the mechanism of the active center response to be separated. It is a valuable and powerful tool for exploring the properties of the PSII active center, as well as other systems. It is possible to study and distinguish between various inhibition mechanisms and to obtain the concentration of the inhibitor Ci to a high precision.
In case of PSII biosensor the dependence of kinetic constant of concentration was found which enables using the inhibition processes for reliable measurement of inhibitor concentration only in range from 10-6 to 10-4 mM for diuron.
Most importantly, SD offers the possibility of detailed study of immobilization technique influence to reaction kinetics, the temperature influence on reaction kinetics and the deep analysis of inhibitor influence on reaction kinetics. The SD does not depend on the kinetic mechanism. Complicated kinetics of inhibition can be studied by the same signal analysis method. The SD method enables also to study the variance of processes, which can be used for parameters estimation using maximum likelihood method.
18
References[1] Catterall, R. W., Chemical Sensors, 1997[2] Eggins, B. R., Chemical Sensors and Biosensors, 2005[3] Koblizek, M., Maly, J., Masojidek, J., Komenda, J., Kucera, T., Giardi, M.T., Mattoo, A.K., Pilloton, R., A biosensor for the detection of triazine and phenylurea herbicides designed using Photosystem II coupled to a screen-printed electrode, 2002[4] Koblizek, M., Masojidek, J., Komenda, J., Kucera, T, Pilloton, R., Matyko, A.K., Giardi, M.T., A sensitive Photosystem II-based biosensor for detection of a class of herbicides, 1998[5] Kotyk, A., Horák, J., Enzymová kinetika, 1977[6] Krejčí, J., Biosensors - Methods of the Output Signal Analysis, 2005[7] Lakshminarayanaiah, N., Transport phenomena in membranes, 1970[8] Macholán, L., Biocatalytic Membrane Electrodes, 1991[9] Nikolaev, N. I., Diffusion in membranes, 1980[10] Onuska, F. I., Pesticide-Residue Analysis by Open Tubular Column Gas-chromatography - Trials, Tribulations, and Trends, 1984[11] Setlikova, E., Sofrova, D., Prasil, O., Budac, P., Koblizek, M., Setlik, I., Integrity and activity of photosysteme 2 complexes isolated from the thermophilic cyanobacterium Synechococcus elogantus using various detergents, 1999[12] Skládal, P., Macholán, L., Biosenzory – současný stav a perspektivy, 1997[13] Updike, S. J. and Hicks, G. P., The Enzyme Electrode, 1967
19

7 CURRICULUM VITAE
Name: Vít OndruchBorn: June 1st 1980 in Nový Jičín, Czech RepublicContact: [email protected]
Education2003 – 2009 Brno University of Technology,
Faculty of Electrical Engineering and Communication,Department of MicroelectronicsPh.D. study of Microelectronics and TechnologyState exam passed in June 2005
1998 – 2003 Brno University of Technology,Faculty of Electrical Engineering and Communication,Department of MicroelectronicsPre-graduate study of Electrical Manufacturing and ManagementState exam passed in June 2003Diploma thesis: Analysis of enzyme kinetics
Experiencesince 2001 Amberg Engineering Brno a.s.
Research & DevelopmentSoftware Developer
LanguagesCzech, English
20

8 ABSTRACTThe principle of synchronous detection (SD) has been applied to biosensor
measurement. SD principle achieves significant increases in the signal-to-noise ratio, limit of detection and overall measurement robustness. Application of SD in biosensor measurements improves the analysis of the response and avoids the influence of interference/noise produced by stirring, electromagnetic effects and influence of parasitic currents. SD also enables to decompose the signal to stimulation response and phenomena with long time of response and last but not least, to identify second-order phenomena in the signal.
The linear statistical model was used to develop a software for the identification of the stimulation signal in the output current. SD method was verified on sample of biosensor with applied Photosystem II complex (PSII) and his response to the light stimulation.
PSII response to light stimulation follows the first order kinetics. The inhibition kinetics of PSII has been studied. Kinetic constants of herbicide binding to PSII depend linearly on herbicide concentration. It enables their measurement also at low concentrations.
21