infrastructure projects are increasingly aiming to improve
TRANSCRIPT

econstorMake Your Publications Visible.
A Service of
zbwLeibniz-InformationszentrumWirtschaftLeibniz Information Centrefor Economics
Tijm, Joep; Michielsen, Thomas; van Maarseveen, Raoul; Zwaneveld, Peter
Working Paper
How Large are Road Traffic Externalities in theCity? The Highway Tunneling in Maastricht, theNetherlands
CESifo Working Paper, No. 7089
Provided in Cooperation with:Ifo Institute – Leibniz Institute for Economic Research at the University of Munich
Suggested Citation: Tijm, Joep; Michielsen, Thomas; van Maarseveen, Raoul; Zwaneveld,Peter (2018) : How Large are Road Traffic Externalities in the City? The Highway Tunneling inMaastricht, the Netherlands, CESifo Working Paper, No. 7089, Center for Economic Studiesand ifo Institute (CESifo), Munich
This Version is available at:http://hdl.handle.net/10419/180351
Standard-Nutzungsbedingungen:
Die Dokumente auf EconStor dürfen zu eigenen wissenschaftlichenZwecken und zum Privatgebrauch gespeichert und kopiert werden.
Sie dürfen die Dokumente nicht für öffentliche oder kommerzielleZwecke vervielfältigen, öffentlich ausstellen, öffentlich zugänglichmachen, vertreiben oder anderweitig nutzen.
Sofern die Verfasser die Dokumente unter Open-Content-Lizenzen(insbesondere CC-Lizenzen) zur Verfügung gestellt haben sollten,gelten abweichend von diesen Nutzungsbedingungen die in der dortgenannten Lizenz gewährten Nutzungsrechte.
Terms of use:
Documents in EconStor may be saved and copied for yourpersonal and scholarly purposes.
You are not to copy documents for public or commercialpurposes, to exhibit the documents publicly, to make thempublicly available on the internet, or to distribute or otherwiseuse the documents in public.
If the documents have been made available under an OpenContent Licence (especially Creative Commons Licences), youmay exercise further usage rights as specified in the indicatedlicence.
www.econstor.eu

7089 2018
May 2018
How Large are Road Traffic Externalities in the City? The Highway Tunneling in Maastricht, the
Netherlands Joep Tijm, Thomas Michielsen, Raoul van Maarseveen, Peter Zwaneveld

Impressum:
CESifo Working Papers ISSN 2364‐1428 (electronic version) Publisher and distributor: Munich Society for the Promotion of Economic Research ‐ CESifo GmbH The international platform of Ludwigs‐Maximilians University’s Center for Economic Studies and the ifo Institute Poschingerstr. 5, 81679 Munich, Germany Telephone +49 (0)89 2180‐2740, Telefax +49 (0)89 2180‐17845, email [email protected] Editors: Clemens Fuest, Oliver Falck, Jasmin Gröschl www.cesifo‐group.org/wp An electronic version of the paper may be downloaded ∙ from the SSRN website: www.SSRN.com ∙ from the RePEc website: www.RePEc.org ∙ from the CESifo website: www.CESifo‐group.org/wp

CESifo Working Paper No. 7089 Category 9: Resource and Environment Economics
How Large are Road Traffic Externalities in the City?
The Highway Tunneling in Maastricht, the Netherlands
Abstract Infrastructure projects are increasingly aiming to improve liveability, in particular in urban areas. We analyse a specific case in which an existing highway in an urban area was moved underground in order to improve intercity traffic flows and to reduce traffic externalities. As travel times within the city hardly changed, this allows for a clean identification of the value of traffic externalities. We find that the liveability benefits of such integrated infrastructure are substantial relative to the construction costs. Each halving of distance to the tunneled segment is associated with 3.5% more appreciation in house prices since the start of the project.
JEL-Codes: H400, R200, R400.
Joep Tijm CPB Netherlands Bureau for Economic
Policy Analysis, P.O. Box 80510 The Netherlands - 2508 GM Den Haag
Thomas Michielsen CPB Netherlands Bureau for Economic
Policy Analysis, P.O. Box 80510 The Netherlands - 2508 GM Den Haag
Raoul van Maarseveen Uppsala University
Box 513 Sweden - 751 20 Uppsala
Peter Zwaneveld CPB Netherlands Bureau for Economic
Policy Analysis, P.O. Box 80510 The Netherlands - 2508 GM Den Haag
25th May 2018

1 Introduction
Traditionally, the most important aim of infrastructure has been the reduction of traveltime. However, liveability and efficient use of space are becoming increasingly importantattributes of new infrastructure, especially in urban areas (see for example Badland et al.(2014)). The purpose of this study is to analyse the value that housing consumers attachto improvements in liveability as a result of such infrastructure investments. We analyseone such case, namely the moving of the A2 highway in Maastricht, a medium sized townin the Netherlands, from above the surface into a tunnel underneath the city. Similarhighway relocations have recently taken place or are being planned in other cities suchas Amsterdam, Antwerp, Dallas, Denver, Hamburg, Madrid, San Francisco and Seattle.
Our main contribution is twofold. First, our case study allows a clean identification ofliveability improvements because travel time only decreases for ongoing traffic, so that thetravel reduction benefits do not vary much within the project city, whereas the liveabilitybenefits are concentrated near the new tunnel. Separating accessibility and liveabilityeffect has often been challenging in existing literature. Second, we add to a nascentliterature on the effects of infrastructure relocation projects in urban areas (Chang et al.2014; Seo et al. 2014; Ahlfeldt et al. 2016), which are becoming increasingly important.
To measure the improvements in liveability, we perform a hedonic pricing analysis onhouse prices in the project municipality. We compare the trend in house prices near therelocated highway segment to the price trend in other parts of the municipality, controllingfor house characteristics. In doing so, we find that each halving of the distance to thenow tunneled highway segment is associated with a price increase of 3.5%, as a result ofthe decrease in traffic externalities.
2 Related literature
The effects of noise and air pollution resulting on house prices have been extensivelystudied using the hedonic method (Smith and Huang 1995; Chay and Greenstone 2005;Boes and Nesch 2011), which can be traced back to Court (1939) and Rosen (1974). Aclean identification of the liveability effects of road and rail infrastructure is difficult how-ever. Some papers look at the house price effects of new construction (see e.g. Levkovichet al. (2016) and the meta-analysis in Debrezion et al. (2007)), but cannot disentangleaccessibility and externality effects. Other studies use direct road noise or pollutiondata (Day et al. 2007; Andersson et al. 2010; Brandt and Maennig 2011), but withoutquasi-experimental variation in the level of externalities, the results may be influencedby unobserved correlations with other neighbourhood characteristics.
Little research so far has analysed the case in which infrastructure relocation coincideswith the development of the public space or in which investments in infrastructure leavethe accessibility largely unchanged, but reduce the externality. Such studies can mitigatethe concerns in the previous paragraph. Most prominently, Ossokina and Verweij (2015)analyse the effect of traffic externalities on housing prices in an urban area of The Hague.Their identification is based on the construction of a new ring-road, which significantlyreduces traffic volume along former commuting routes, but crucially leaves the localaccessibility largely unaffected. By comparing houses along the former commuting routeswith houses in the same neighbourhood but without commuting routes close by, they
2

identify the effect of car traffic on house prices. By using a fixed effects model at thepostal code (6-digit) level, they find a negative relation between traffic externalities andhouse prices. For areas where traffic density was already high, reductions in externalitiesare valued stronger compared to areas with lower initial traffic density.
Another paper that separates accessibility and nuisance is Ahlfeldt et al. (2016). Theyevaluate the effects of metro line A in Berlin, both in the period when it was built, around1900, and contemporarily. The line is part elevated and part underground. The elevatedand underground stations provide the same accessibility benefits, but noise is higher onthe elevated stretches. The authors use noise data by source from 2007 to capture localvariation in rail noise. A 10 db increase in noise decreases house prices by 1%. Ahlfeldtet al. (2016) find that the accessibility and nuisance effects are underestimated by 40%and 80% respectively if they are not conditioned on each other.
Because the tunnel that we study has only recently opened, our analysis capturesthe anticipation effect in the housing market. Several papers find evidence that a largepart of the benefits of infrastructure projects capitalizes into housing prices shortly afterthe opening. A study by Hoogendoorn et al. (2017) based on the same data as ourstudy reports that half of the accessibility benefits of a new tunnel in the south-west ofthe Netherlands are capitalized more than a year before the opening of the tunnel, andall benefits were absorbed in the year of opening. Ahlfeldt et al. 2016 find significantanticipation effects for rail noise in the year after the concession of the metro line wasgranted; 6 years before the opening. Levkovich et al. 2016 also find that anticipationeffects accounted for more than half of the total effect for two recent highway extensionsin the Netherlands.
3 Methods
3.1 Case description
Since 1960 the A2 highway has run right through the city of Maastricht in a North-South direction. As a result of the dense traffic on the A2, 37,000 and 69,000 housesexceeded the norms for NO2 and PM10 exposure respectively in 1997 (Oranjewoud 2006).1
In the 1990’s, ideas to build a tunnel started circulating among (local) politicians andinhabitants of the city. In 2002, the Dutch parliament agreed with the idea of constructinga tunnel to lead traffic under a large part of the city. Eight years later, the minister ofInfrastructure and the Environment officially signed the proposed plans. Preparatoryworks started in 2010, the actual tunneling started in 2012 and the first parts of thetunnel opened in December 2016.2 The tunnel has two tubes: an upper one for localtraffic, and a lower one for ongoing traffic. In 2017 and 2018, a rectangular-shaped parkwill be placed on top of the tunnel.3 As part of a broader redevelopment of the area,residential and commercial real estate will be developed until 2026.
1These transgressions were forecasted to disappear after the underground relocation.2A resident along the tunneled segment used to be unable to use her balcony or sleep
with the window open, and was experiencing significant noise from 6am in the morning.The morning when the tunnel opened, ”only two cars came by”. https://nos.nl/artikel/
2148593-a2-tunnel-onder-maastricht-open-nog-even-wennen.html3http://www.a2maastricht.nl/
3

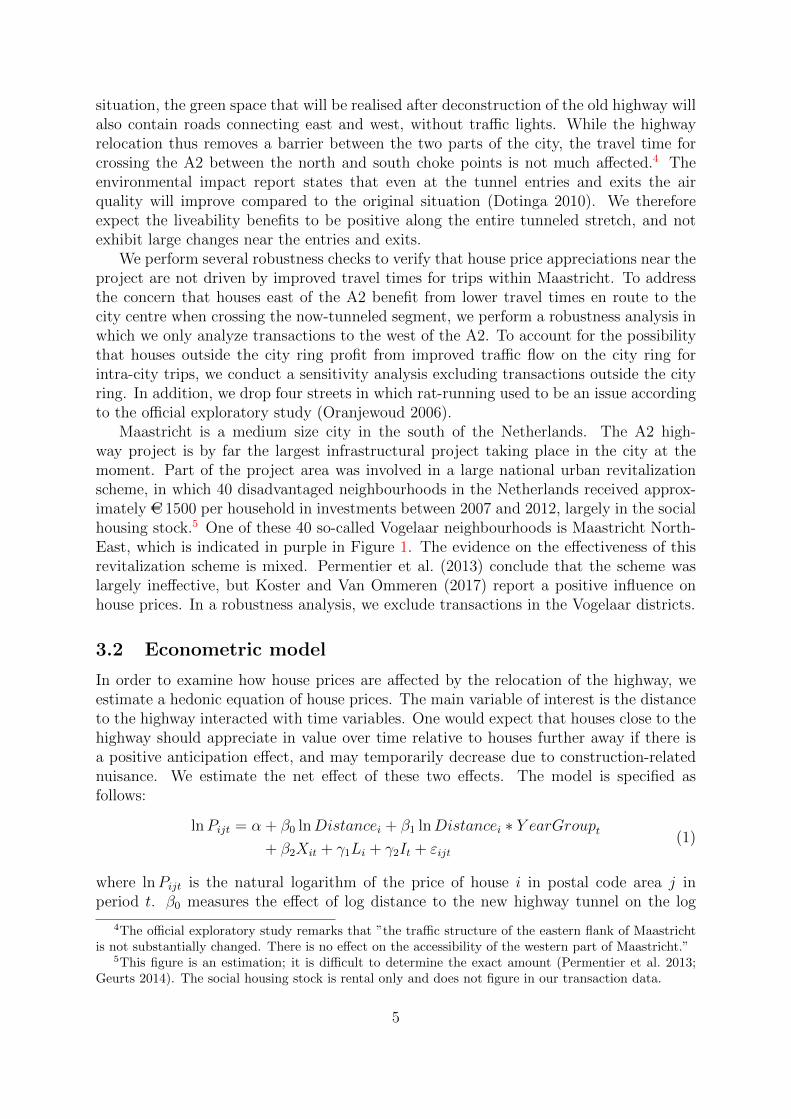
Figure 1 shows the project area in Maastricht. From the South-East, the A2 highwayenters the city and proceeds in a northerly direction. The roughly 2 kilometer long tunnelsegment is drawn in red. The former A2 highway was located right on top of the newtunnel. The highway leaves the city in the North-East. The (historical) centre of the cityis located on the western side of the Meuse river where the name Maastricht is writtenon the map.
Figure 1: Map of Maastricht showing the locations of all observed transactions
The main improvements in terms of traffic time are for ongoing traffic, according tothe official exploratory study (Oranjewoud 2006). The old situation was characterized bytraffic lights at the north and south entrance of the A2 highway to the city, which wereimportant choke points. Moreover, ongoing traffic was limited to 50km/h in the area thatis now tunneled, as opposed to 100km/h after the relocation.
Inhabitants of Maastricht benefit from the improved traffic flow at the north andsouth entrance to the city when they use the A2 to travel north or south to areas outsideMaastricht, or when they travel to a local destination using the city ring road, whichintersects the A2 at these former choke points. The former benefit accrues to inhabitantsin all areas of Maastricht more or less equally, and should therefore not affect relativechanges in house prices within Maastricht. The latter benefit might be more importantfor inhabitants living east of the A2 - since the city centre is in the west, they are morelikely to use the ring road for intra-city trips.
In the old situation people were able to cross the highway from east to west and viceversa at various traffic light intersections along the now-tunneled segment. In the new
4
situation, the green space that will be realised after deconstruction of the old highway willalso contain roads connecting east and west, without traffic lights. While the highwayrelocation thus removes a barrier between the two parts of the city, the travel time forcrossing the A2 between the north and south choke points is not much affected.4 Theenvironmental impact report states that even at the tunnel entries and exits the airquality will improve compared to the original situation (Dotinga 2010). We thereforeexpect the liveability benefits to be positive along the entire tunneled stretch, and notexhibit large changes near the entries and exits.
We perform several robustness checks to verify that house price appreciations near theproject are not driven by improved travel times for trips within Maastricht. To addressthe concern that houses east of the A2 benefit from lower travel times en route to thecity centre when crossing the now-tunneled segment, we perform a robustness analysis inwhich we only analyze transactions to the west of the A2. To account for the possibilitythat houses outside the city ring profit from improved traffic flow on the city ring forintra-city trips, we conduct a sensitivity analysis excluding transactions outside the cityring. In addition, we drop four streets in which rat-running used to be an issue accordingto the official exploratory study (Oranjewoud 2006).
Maastricht is a medium size city in the south of the Netherlands. The A2 high-way project is by far the largest infrastructural project taking place in the city at themoment. Part of the project area was involved in a large national urban revitalizationscheme, in which 40 disadvantaged neighbourhoods in the Netherlands received approx-imately AC 1500 per household in investments between 2007 and 2012, largely in the socialhousing stock.5 One of these 40 so-called Vogelaar neighbourhoods is Maastricht North-East, which is indicated in purple in Figure 1. The evidence on the effectiveness of thisrevitalization scheme is mixed. Permentier et al. (2013) conclude that the scheme waslargely ineffective, but Koster and Van Ommeren (2017) report a positive influence onhouse prices. In a robustness analysis, we exclude transactions in the Vogelaar districts.
3.2 Econometric model
In order to examine how house prices are affected by the relocation of the highway, weestimate a hedonic equation of house prices. The main variable of interest is the distanceto the highway interacted with time variables. One would expect that houses close to thehighway should appreciate in value over time relative to houses further away if there isa positive anticipation effect, and may temporarily decrease due to construction-relatednuisance. We estimate the net effect of these two effects. The model is specified asfollows:
lnPijt = α + β0 lnDistancei + β1 lnDistancei ∗ Y earGroupt+ β2Xit + γ1Li + γ2It + εijt
(1)
where lnPijt is the natural logarithm of the price of house i in postal code area j inperiod t. β0 measures the effect of log distance to the new highway tunnel on the log
4The official exploratory study remarks that ”the traffic structure of the eastern flank of Maastrichtis not substantially changed. There is no effect on the accessibility of the western part of Maastricht.”
5This figure is an estimation; it is difficult to determine the exact amount (Permentier et al. 2013;Geurts 2014). The social housing stock is rental only and does not figure in our transaction data.
5

of house price in the baseline period. We have chosen a log-log specification as air andnoise pollution effects decrease with distance more than linearly. We refer to this as thelogarithmic specification in the table captions.
β1 is the coefficient vector of interest and measures the interaction effect between thelog distance to the tunnel and two-year group dummies so we can see how the relocation’seffect varies over time. β2 measures the effect of house characteristics. γ1 are the locationeffects, including the postal code fixed effects, and γ2 captures yearly effects such aschanges in the business cycle.6 Variations in the sale price due to unobserved houseattributes or idiosyncrasies end up in the error term εit.
The postcode fixed effects Lj control for unobserved neighbourhood characteristics.We estimate (1) for two spatial units. In our preferred specification, we use postal code4 level (PC4) fixed effects, which are district or neighbourhood sized and contain about4000 persons each. As a sensitivity analysis, we also estimate (1) with PC6 code fixedeffects - one side of a street or one block of houses. These finer fixed effects can deal withsmaller-scale time-invariant differences in neighbourhood attractiveness, but restrict theinformation we can use for estimating the effect of proximity to the highway to within-block differences in distance. As a benchmark, we also run an OLS regression withoutgeographic fixed effects.
We expect a positive relationship β0 between distance to the tunnel and house pricesin the original situation since houses closer to the highway faced more externalities thanhouses at larger distances. The start of the tunnel construction in 2012 was announcedin November 2010, which is why we hypothesize 2010 to be the first year in which anti-cipation effects may show up.7 According to our hypothesis, the interaction terms shouldbecome negative for later year groups, indicating that houses at lower distances to thetunnel become more attractive over time.
We also run the model with distance band dummies instead of the continuous variableto verify whether the effect in (1) is driven by the log-log functional form. We will interactthe distance dummies with same the year group dummies that we used in (1). This waywe measure the average increase of house prices within the specified distance per period,compared to houses further than 2km away from the highway. This model is similar inall other ways and is specified as:
lnPijt = α + β0DistanceDummiesi + β1DistanceDummiesi ∗ Y earGroupt+ β2Xit + γ1Li + γ3It + εijt
(2)
3.3 Data
We use housing transaction data from the Dutch Association of Real Estate Brokersand Experts (NVM). Our dataset contains all transactions brokered by NVM mem-bers between 1985 and September 2017. The NVM members’ national market sharein Limburg, the province that includes Maastricht, rose from 24,6% in 1995 to 53,8% in2016. We consider our data representative for the local housing market.8
6We also include month-of-sale fixed effects to capture seasonality in the housing market.7We also looked at earlier years but did not find any anticipation effects in the period 2000-2009 and
decided to not interact them in our final regressions. Instead they are now part of the baseline period.8The national market share rose from 57,1% in 1995 to 82,6% in 2016.
6

Our dataset includes 9243 transactions in Maastricht, 581 of which took place in 2016,the last full year that we include. The city of Maastricht consists of 18 PC4 areas forwhich we have on average 31.9 transactions in 2016 with a minimum of 3 and a maximumof 67. The 1677 PC6 areas contain on average 0.3 transactions in 2016 with a minimumof 0 and a maximum of 6.
Other than transaction prices, the dataset contains a number of characteristics foreach sold house that are relevant for prices. Table 3.3 presents summary statistics. Theaverage sale price in Maastricht was AC240 thousand with a standard deviation of AC128thousand. All prices in our dataset are in euros of 2015. The distance variable is theEuclidean distance measured in meters for each house using GIS software. Descriptionsof all variables are included in appendix Table A.1.
Table 1: Descriptive statistics
Mean Median Max Min SD
Dependent variable andmain independent variable:Transaction price (2015 AC) 241030.4 207483.8 1747870 36881.51 128591Distance tunnel (m) 2013.44 1762.17 4907.36 13.48 1300.23
Structural attributes:Building period 5.32 5 9 1 2.14Floor space (m2) 127.59 120 490 26 50.87Apartment 0.33 0 1 0 0.47Terraced 0.33 0 1 0 0.47Corner house 0.09 0 1 0 0.29Semi detached 0.18 0 1 0 0.39N Floors 2.54 3 6 1 1.04N Rooms 4.68 5 25 0 2.41Balcony 0.22 0 1 0 0.42Monument 0.00 0 1 0 0.07Parking 0.44 0 1 0 0.50Maintenance inside 6.77 7 9 1 1.28Maintenance outside 6.89 7 9 1 1.08
Locational attributes:Distance non-tunneled highway (m) 2055.40 1605.24 5297.69 98.22 1429.71Within 300m of rail station 0.10 0 1 0 0.30Distance centre (m) 1903.33 1871.85 5277.36 1.08 964.34Distance centre (m) ∗ linear time trend
Time:Year 2005.87 2006 2017 1985 7.22
Table showing descriptive statistics for all included variables. We have constructed Distancetunnel, Distance non-tunneled highway, Rail and Distance centre ourselves using GIS, allother variables were available in the NVM dataset. All variables are in level values. N =9243.
Figure 2 shows the relations between transaction prices and distance to the highway
7

Figure 2: Upper left: being Transaction price and Distance to the tunnel in meters forobservations ≤1km before 2010, Upper right: Transaction price and distance to the non-tunneled highway parts in meters for observations ≤1km before 2010, Bottom: Averagetransaction prices over time.
before 2010. From panel A one can see an increase in prices for transactions further awayfrom the tunnel in the first kilometer. This indicates that before 2010, houses closer tothe tunnel segment were less attractive. The same goes for panel B where the transactionprices have been plotted against distance to parts of the highway that are not tunneled.We also find an increase in house prices at higher distances for observations that lie withinthe first kilometer from the highway. The last panel, C shows that there is considerablevariation in transaction prices over the years. House prices increased sharply during thenineties, and came down during the post-2008 crisis on the Dutch housing market.
In Figure A.1 in the Appendix, we show that the positive correlation between distanceto the tunnel and house prices is also apparent when we look at quality-adjusted prices.
4 Results
We begin by estimating the basic model (1), of which the results are shown in Table 2.In our preferred specification using PC4 fixed effects (the second column in Table 2),each halving of the distance to the tunnel increases house prices by 3.5% in the two
8

Table 2: Logarithmic specification
OLS PC4 FE PC6 FE
Ln Distance Tunnel 0.009** 0.010 -0.011(0.004) (0.008) (0.046)
Ln Distance Tunnel ∗ 2010-11 0.003 0.004 -0.001(0.009) (0.009) (0.008)
Ln Distance Tunnel ∗ 2012-13 -0.019* -0.007 -0.009(0.011) (0.010) (0.009)
Ln Distance Tunnel ∗ 2014-15 -0.016** -0.013* -0.010(0.008) (0.007) (0.007)
Ln Distance Tunnel ∗ 2016-17 -0.038*** -0.034*** -0.037***(0.008) (0.008) (0.007)
Housing attributes Yes Yes YesLocation attributes Yes Yes NoYear dummies Yes Yes YesN 9243 9243 9243Adjusted R2 0.805 0.843 0.906
Note: Dependent variable is the natural logarithm of trans-action prices. (1) is a baseline OLS regression, (2) is a PC4code fixed effects model and (3) is a PC6 code fixed effectsmodel. Heteroskedasticity robust standard errors in paren-theses. * p < 0.10, ** p < 0.5, *** p < 0.01
years around the opening (2016-2017), compared to the pre-2010 period. For example, ahouse at 300m from the tunnel appreciated in value by 3.5% between 2010 and 2016-2017compared to a similar house at 600m. We find no significant effects for years before 2016,although the point estimates in 2014-2015 move in the same direction. The estimates areof similar magnitude when we use fixed effects for smaller areas (column 3). Contrary toexpectations, the distance to the tunnel has no significant effect in the baseline period:before the relocation works started, houses close to the highway were not significantlycheaper than houses further away. We do find a negative effect of the surface highway onhouse prices when we estimate the effect on between-postcode as well as within-postcodedifferences in distance (first column), but those estimates do not control for unobservedneighbourhood characteristics.
When we use a distance-band specification for the influence of distance, we againfind that the relocation increases house prices. Table 3 shows that with PC4 fixed effects,houses within 500m of the tunnel appreciated 7.1% more in value between 2010 and 2016-2017 than similar houses more than 2km from the tunnel. We find weaker results between500m and 1km, but - surprisingly - larger effects for houses between 1 and 2km (10.0%more appreciation). These results are consistent with those in the OLS and PC6 FEmodels (see Table E.4 in the appendix). We also find in this specification with distancebands, that before 2010, houses within a given PC4 that are closer to the tunnel, weresubstantially cheaper than comparable houses further than 2km from the tunnel (7.1%
9

Table 3: PC4 FE Difference-in-differencemodel
0-0.5km 0.5-1km 1-2km
Base -0.149*** -0.098*** -0.071***(0.019) (0.015) (0.011)
2010-2011 0.030 -0.069*** 0.012(0.026) (0.021) (0.020)
2012-2013 0.030 0.030 0.083***(0.026) (0.022) (0.020)
2014-2015 0.051** 0.007 0.049***(0.021) (0.020) (0.016)
2016-2017 0.071*** 0.042** 0.100***(0.026) (0.019) (0.015)
N 9243 9243 9243Adjusted R2 0.845
Note: Dependent variable is the naturallogarithm of transaction prices. Thecoefficients are the effect of being within acertain distance from the tunnel within aspecified time period compared to housesat more than 2km away from the tun-nel. Heteroskedasticity robust standarderrors in parentheses. Housing attrib-utes, Location attributes and Year dum-mies have been included in the regression.* p < 0.10, ** p < 0.5, *** p < 0.01
to 14.9%), suggesting that these houses suffered more from highway externalities.Because of the curious results in the last column of Table 3, we perform a robustness
analysis in which we move houses between 1 and 2km to the control group in the appendix(Table E.2, left half). All coefficients in the inner two distance bands then attenuateto zero with some 5%-points. These results suggest that houses in the 1-2km bandexperienced an increase in value between 2010 and 2016-2017, conditional on factors wecontrol for, that drives both the large effects in the last column of Table 3 and the smallerestimates for the inner two bands in the appendix, through their effect on the averageappreciation in the control group. We verify this hypothesis with an additional regressionin which we drop all houses between 1-2km of the tunnel (right half of Table E.2). Thecoefficients for the inner two distance bands are then similar to Table 3. This resultsaccords with an eyeball plot that shows a relatively large increase in observed transactionprices between 1-2km in 2016-2017 (Figure E.1).
To further pinpoint what drives these changes in coefficients, we run two more regres-sions: one in which we drop houses situated between 1 and 2km west of the tunnel, andone in which we remove observations between 1 and 2km east of the tunnel (Table E.3).
10

We find no clear indication that the large effect of the tunnel in the 1-2km band is drivenby asymmetric developments on the western and eastern side of the tunnel.
If we multiply the percentage effects on house prices with the number of houses in thedistance bands within 1 km, the total increase in house values within 1km between 2010and 2016-2017 amounts to AC220 mln.9
We see two explanations for our main finding that the tunnel has a positive effect in2016-2017 but not earlier. First, as the works progress, more of the construction nuisancebecomes sunk and thus no longer relevant for house prices. Second, the waiting periodbefore home owners can experience the decrease in noise and air pollution gets shorterover time.
4.1 Sensitivity analyses
The appendix contains a set of robustness analysis with respect to equation (1). Firstly,the effects of the tunnel in 2016-2017 are robust in three additional analyses in which weexclude houses in areas that we identified in section 3.1 as potentially benefiting fromlarger-than-average reductions in travel times: houses east of the A2, houses outsidethe city ring and housing along streets that were popular rat-running routes. The basecoefficient of distance to the tunneled segment varies only slightly in these analyses butalways remains significant at the 99% level. Secondly, the effect of the tunnel also doesnot change when we exclude the ’Vogelaar’ districts that received urban revitalizationinvestments. Thirdly, we verify that the results hold up in the subsample of housescloser to the tunnel than to the non-tunneled segment, to address the concern that themain estimates are distorted by houses which are close to the tunnel, but still experiencenuisance after the project because they are even closer to a non-tunneled part of the A2.
Fourthly, we decompose the effects for individual years (Table E.1), and perform arobustness analysis in which we only include houses within 1km, 2km or 3km from thetunnel (Table E.5), because distance to the tunnel might not matter as much for housesfurther away. The results are robust for the subsample within 1km, but we find nosignificant effect in the intermediate subsamples. We suspect that the houses between 1and 2 km from the tunnel drive the non-result in this last sensitivity analysis, as in thespecification with distance bands.
5 Conclusion
We analysed how a reduction in traffic externalities influences house prices, by studyingthe underground relocation of a highway in Maastricht that left local travel times largelyunaffected. We find evidence that house prices start to increase even before the projectis completed and the externalities disappeared, indicating that home buyers anticipatefuture benefits when they purchase their house.
Our preferred specification estimates that for two otherwise identical houses in theperiod 2016 to 2017, the house half the distance to the tunnel appreciated 3.5% more
9In 2017, there were 7526 houses within 500 meter of the tunnel and 10647 houses between 500 and 100meter. The average transaction prices within these bands between 2010 and 2017 were AC198 thousandand AC257 thousand, respectively.
11

compared to before 2010. The effects are largest within 1 kilometer. Our results aremostly robust to changes in specification.
We find positive effects in the year before the tunnel opened, indicating that people doindeed value the outlook of improved liveability in the near future. Our findings suggestthat highway tunneling projects may be worthwhile in other cities as well. Thoughsuch projects are not worthwhile purely on the grounds of reducing externalities, theliveability gains are sizeable both compared to the total construction costs (AC 890 mln)and the anticipated travel time and reliability gains (AC 930 mln).10
This study was limited in the sense that we only looked at housing transactions. Theprices of commercial property may also have experienced increases as a result of thereduction in externalities. Another limitation is that we cannot be certain that we havemeasured the full ex-post valuation of the increase in liveability, since the project was onlyrecently completed. Future research may also use additional data. When the next waveof the noise monitor of the National Institute for Public Health and the Environment isreleased, it will be possible to condition the estimates on changes in noise pollution. Inthe longer term, one could look at the health effects of the relocation on nearby residents.
References
Ahlfeldt, G. M., Nitsch, V. and Wendland, N. (2016). Ease vs. noise: On the conflictingeffects of transportation infrastructure. CESifo Working Paper Series No. 6058.
Andersson, H., Jonsson, L. and Ogren, M. (2010). ‘Property Prices and Exposure toMultiple Noise Sources: Hedonic Regression with Road and Railway Noise’. In: En-vironmental and Resource Economics 45.1, pp. 73–89. issn: 1573-1502.
Badland, H., Whitzman, C., Lowe, M., Davern, M., Aye, L., Butterworth, I., Hes, D.and Giles-Corti, B. (2014). ‘Urban liveability: emerging lessons from Australia forexploring the potential for indicators to measure the social determinants of health’.In: Social science & medicine 111, pp. 64–73.
Boes, S. and Nesch, S. (2011). ‘Quasi-experimental evidence on the effect of aircraftnoise on apartment rents’. In: Journal of Urban Economics 69.2, pp. 196 –204. issn:0094-1190.
Brandt, S. and Maennig, W. (2011). ‘Road noise exposure and residential property prices:Evidence from Hamburg’. In: Transportation Research Part D: Transport and Envir-onment 16.1, pp. 23 –30. issn: 1361-9209.
Chang, J. S., Han, S., Jung, D. and Kim, D. (2014). ‘Benefits of rerouting railways totunnels in urban areas: a case study of the Yongsan line in Seoul’. In: InternationalJournal of Urban Sciences 18.3, pp. 404–415. eprint: https://doi.org/10.1080/12265934.2014.934270.
Chay, K. and Greenstone, M. (2005). ‘Does Air Quality Matter? Evidence from the Hous-ing Market’. In: Journal of Political Economy 113.2, pp. 376–424. issn: 00223808,1537534X.
Court, A. T. (1939). Hedonic price indexes with automotive examples. The Dynamics ofAutomobile Demand. New York: General Motors.
10This number is from the ex-ante social cost benefit analysis ECORYS (2006), corrected for inflationbetween 2005 and 2015.
12
Day, B., Bateman, I. and Lake, I. (2007). ‘Beyond implicit prices: recovering theoreticallyconsistent and transferable values for noise avoidance from a hedonic property pricemodel’. In: Environmental and Resource Economics 37.1, pp. 211–232.
Debrezion, G., Pels, E. and Rietveld, P. (2007). ‘The Impact of Railway Stations onResidential and Commercial Property Value: A Meta-analysis’. In: The Journal ofReal Estate Finance and Economics 35.2, pp. 161–180. issn: 1573-045X.
Dotinga, F. (2010). A2 Passage Maastricht. MilieuEffectRapport [Environmental impactreport]. Projectbureau A2 Maastricht and Avenue2.
ECORYS (2006). Kengetallen Kosten-Batenanalyse project A2-Maastricht.Geurts, B. (2014). ‘Evaluatie van ruimtelijk beleid is een vak apart’. In: Soort zoekt soort;
Clustering en sociaal-economische scheidslijnen in Nederland. Ed. by J. Bakens, H. L.de Groot, P. Mulder and C.-J. Pen. Platform31, pp. 145–32.
Hoogendoorn, S., Gemeren, J. van, Verstraten, P. and Folmer, K. (2017). ‘House pricesand accessibility: Evidence from a natural experiment in transport infrastructure’. In:Journal of Economic Geography.
Koster, H. R. and Van Ommeren, J. (2017). Place-based policies and the housing market.Tech. rep. Tinbergen Institute.
Levkovich, O., Rouwendal, J. and Marwijk, R. (2016). ‘The effects of highway develop-ment on housing prices’. In: Transportation 43.2, pp. 379–405.
Oranjewoud (2006). Een plan voor stad en snelweg, Onderzoek alternatieven en variantenA2-passage Maastricht. Tech. rep.
Ossokina, I. V. and Verweij, G. (2015). ‘Urban traffic externalities: Quasi-experimentalevidence from housing prices’. In: Regional Science and Urban Economics 55, pp. 1–13.
Permentier, M., Kullberg, J. and Van Noije, L. (2013). Werk aan de wijk; Een quasi-experimentele evaluatie van het krachtwijkenbeleid. Tech. rep. Sociaal en CultureelPlanbureau.
Rosen, S. (1974). ‘Hedonic prices and implicit markets: product differentiation in purecompetition’. In: Journal of Political Economy 82.1, pp. 34–55.
Seo, K., Golub, A. and Kuby, M. (2014). ‘Combined impacts of highways and light railtransit on residential property values: a spatial hedonic price model for Phoenix,Arizona’. In: Journal of Transport Geography 41, pp. 53 –62. issn: 0966-6923.
Smith, V. K. and Huang, J.-C. (1995). ‘Can Markets Value Air Quality? A Meta-Analysisof Hedonic Property Value Models’. In: Journal of Political Economy 103.1, pp. 209–227. issn: 00223808, 1537534X.
6 Appendix
6.1 Variable description
Table A.1 provides a description of the variables we use in the econometric analyses.
6.2 Quality-adjusted prices and distance to tunnel
The descriptive relation between house prices and distance to the tunnel in Figure 2 maybe partly driven by differences in house quality between neighbourhoods close to the
13

Table A.1: Variables with descriptions included in the case study
Variable Description
Dependent variable andmain independent variable:Ln Transaction price (AC) Ln of the transaction price in 2015 EuroLn Distance tunnel (m) Ln of the distance to the tunnel segment of the
highway in meters
Structural attributes:Building period Building period, 1500–≥2001 divided in 9
unequally sized periodsLn Floor space (m2) Ln of the number of square meters of floor spaceN Floors Number of floorsN Rooms Number of roomsApartment Apartment dummyTerraced Terraced dummyCorner house Corner house dummySemi detached Semi detached dummyBalcony Balcony dummyMonument Monument dummyParking Parking space dummyMaintenance inside Score for maintenance ranging from 1 to 9Maintenance outside Score for maintenance ranging from 1 to 9
Locational attributes:Ln Distance non-tunneled highway (m) Ln of the distance to non-tunneled highway segments in
the urban area measured in metersRail Dummy for being within 300m of a railwayLn Distance centre (m) Ln of the distance to the centre measured in meters
Macro effects:Year Year dummy
tunnel and further away. We already noted in section 3.1 that the immediate vicinity ofthe tunnel contains some disadvantaged areas. We therefore also present the relation fromFigure 2 for quality-adjusted prices. We use the coefficient estimates from equation (1)to calculate the price of each house Pijt as if it had average house characteristics X =1N
∑i,tXit:
Pijt = exp (α + β0 lnDistancei + β1 lnDistancei ∗ Y earGroupt (3)
+β2X + γ1Li + γ2It + εijt)
Figure A.1 shows that the relation between house prices and distance to the tunnel isstill increasing when we correct for housing characteristics, although the pattern is morevolatile. The quality adjustment is relatively large for houses very close to the tunnel.
14

Figure A.1: Upper left: being Quality-adjusted prices and Distance to the tunnel inmeters for observations ≤1km before 2010, Upper right: Quality-adjusted prices anddistance to the non-tunneled highway parts in meters for observations ≤1km before 2010,Bottom: Average quality-adjusted prices over time.
6.3 Sensitivity to travel times within Maastricht
This section contains the sensitivity analyses in which we exclude houses that potentiallybenefit from improved travel times for trips within Maastricht. If these sensitivity checksyield different outcomes than the main results in section 4, our estimates might not reflectonly the liveability benefits of the A2 tunnel, but also include a travel time effect.
In Tables B.1, B.2 and B.3, we re-estimate equation (1). When we restrict the analysisto houses west of the A2 (Table B.1), the main coefficient of interest (Ln Distance Tunnel16-17) is 1 percentage point smaller in absolute value than in the main specification, butstill negative and significant. When we restrict the analysis to houses inside the city ring(Table B.2), the effect of distance to the tunnel in 2016-2017 is about 1 percentage pointlarger than in the main specification. The results when we exclude the rat-running streets(Table B.3) are almost identical to those in Table 2, which might be related to the smallnumber of excluded transactions (153) along these streets.
The baseline coefficient on distance to the tunnel is smaller and even significantlynegative in Tables B.1 and B.2 than in Table 2. Since most of the houses close to thetunnel in these subsamples are also close to the river and the railway station, the baseline
15

Table B.1: Logarithmic specification, only houses west of theA2
OLS PC4 FE PC6 FE
Ln Distance Tunnel -0.032*** -0.024* 0.021(0.007) (0.013) (0.079)
Ln Distance Tunnel ∗ 2010-11 0.001 0.011 -0.004(0.011) (0.011) (0.011)
Ln Distance Tunnel ∗ 2012-13 -0.036*** -0.012 -0.009(0.013) (0.011) (0.010)
Ln Distance Tunnel ∗ 2014-15 -0.020* -0.003 -0.007(0.011) (0.009) (0.009)
Ln Distance Tunnel ∗ 2016-17 -0.042*** -0.027*** -0.043***(0.011) (0.010) (0.009)
Housing attributes Yes Yes YesLocation attributes Yes Yes NoYear dummies Yes Yes YesN 6531 6531 6531Adjusted R2 0.800 0.843 0.904
Note: Transacted houses east of the A2 are excluded. De-pendent variable is the natural logarithm of transactionprices. (1) is a baseline OLS regression, (2) is a PC4 codefixed effects model and (3) is a PC6 code fixed effects model.Heteroskedasticity robust standard errors in parentheses. *p < 0.10, ** p < 0.5, *** p < 0.01
coefficient might now pick up some of the amenity benefits of these areas. This shouldnot influence the validity of the coefficients of interest however.
6.4 Sensitivity to urban revitalization investments
Table C.1 shows the results of equation (1) on the subsample that excludes the Vogelaardistricts that received urban revitalization investments. The coefficients on the effect ofthe tunnel in 2016 and 2017 are similar to the main results.
6.5 Sensitivity to nuisance from non-tunneled segment
We control for distance to the non-tunneled highway segment in all our analyses, butone might be concerned that the benefit of the tunnel might be sizeably lower for housesthat are closer to the non-tunneled part of the highway than to the tunnel, because themost relevant (closest) part of the highway for these houses is still above ground aftercompletion of the project. To see whether these houses influence our estimates, we runa regression in which we exclude them. Table D.1 shows the results, which are of similarmagnitude to the main text.
16

Table B.2: Logarithmic specification, only houses inside the cityring
OLS PC4 FE PC6 FE
Ln Distance Tunnel -0.045*** -0.046** -0.051(0.011) (0.019) (0.108)
Ln Distance Tunnel ∗ 2010-11 -0.017 0.002 -0.005(0.015) (0.014) (0.016)
Ln Distance Tunnel ∗ 2012-13 -0.020 -0.010 0.007(0.017) (0.015) (0.015)
Ln Distance Tunnel ∗ 2014-15 -0.044*** -0.025* -0.001(0.014) (0.013) (0.011)
Ln Distance Tunnel ∗ 2016-17 -0.058*** -0.047*** -0.042***(0.014) (0.013) (0.012)
Housing attributes Yes Yes YesLocation attributes Yes Yes NoYear dummies Yes Yes YesN 2525 2525 2525Adjusted R2 0.827 0.839 0.893
Note: Transacted houses outside the city ring are excluded.Dependent variable is the natural logarithm of transactionprices. (1) is a baseline OLS regression, (2) is a PC4 codefixed effects model and (3) is a PC6 code fixed effects model.Heteroskedasticity robust standard errors in parentheses. *p < 0.10, ** p < 0.5, *** p < 0.01
17

Table B.3: Logarithmic specification, rat-running streets ex-cluded
OLS PC4 FE PC6 FE
Ln Distance Tunnel 0.010*** 0.010*** -0.024(0.004) (0.004) (0.047)
Ln Distance Tunnel ∗ 2010-11 0.005 0.005 -0.002(0.009) (0.009) (0.008)
Ln Distance Tunnel ∗ 2012-13 -0.020* -0.020* -0.010(0.011) (0.011) (0.009)
Ln Distance Tunnel ∗ 2014-15 -0.014* -0.014* -0.010(0.008) (0.008) (0.007)
Ln Distance Tunnel ∗ 2016-17 -0.037*** -0.037*** -0.036***(0.009) (0.009) (0.007)
Housing attributes Yes Yes YesLocation attributes Yes Yes NoYear dummies Yes Yes YesN 9090 9090 9090Adjusted R2 0.806 0.806 0.907
Note: Transacted houses along the Meerssenerweg, WillemAlexanderweg, Ambyerstraat and Fregatweg are excluded.Dependent variable is the natural logarithm of transactionprices. (1) is a baseline OLS regression, (2) is a PC4 codefixed effects model and (3) is a PC6 code fixed effects model.Heteroskedasticity robust standard errors in parentheses. *p < 0.10, ** p < 0.5, *** p < 0.01
18

Table C.1: Logarithmic specification, Vogelaar districts ex-cluded
OLS PC4 FE PC6 FE
Ln Distance Tunnel -0.017*** 0.035*** 0.036(0.005) (0.010) (0.065)
Ln Distance Tunnel ∗ 2010-11 0.014 0.021* -0.008(0.012) (0.011) (0.010)
Ln Distance Tunnel ∗ 2012-13 -0.047*** -0.029*** -0.039***(0.012) (0.011) (0.011)
Ln Distance Tunnel ∗ 2014-15 -0.016* -0.016* -0.021***(0.010) (0.008) (0.008)
Ln Distance Tunnel ∗ 2016-17 -0.040*** -0.036*** -0.049***(0.010) (0.009) (0.009)
Housing attributes Yes Yes YesLocation attributes Yes Yes NoYear dummies Yes Yes YesN 8339 8339 8339Adjusted R2 0.805 0.844 0.906
Note: Transacted houses in Vogelaar districts are excluded.Dependent variable is the natural logarithm of transactionprices. (1) is a baseline OLS regression, (2) is a PC4 codefixed effects model and (3) is a PC6 code fixed effects model.Heteroskedasticity robust standard errors in parentheses. *p < 0.10, ** p < 0.5, *** p < 0.01
19

Table D.1: Logarithmic specification, exclude houses closer tonon-tunneled segment than to tunnel
OLS PC4 FE PC6 FE
Ln Distance Tunnel 0.006 -0.043*** -0.071(0.006) (0.011) (0.052)
Ln Distance Tunnel ∗ 2010-11 -0.010 -0.002 -0.009(0.009) (0.009) (0.009)
Ln Distance Tunnel ∗ 2012-13 -0.017 -0.009 -0.009(0.011) (0.010) (0.009)
Ln Distance Tunnel ∗ 2014-15 -0.018** -0.013* -0.011(0.008) (0.007) (0.007)
Ln Distance Tunnel ∗ 2016-17 -0.036*** -0.033*** -0.039***(0.009) (0.008) (0.007)
Housing attributes Yes Yes YesLocation attributes Yes Yes NoYear dummies Yes Yes YesN 7023 7023 7023Adjusted R2 0.804 0.844 0.904
Note: Transacted houses that are closer to the non-tunneledsegment than to the tunnel are excluded. Dependent vari-able is the natural logarithm of transaction prices. (1) isa baseline OLS regression, (2) is a PC4 code fixed effectsmodel and (3) is a PC6 code fixed effects model. Hetero-skedasticity robust standard errors in parentheses. * p <0.10, ** p < 0.5, *** p < 0.01
20

6.6 Sensitivity to alternative subsamples and fixed effects
When we estimate equation (1) with interaction terms for each individual year, the overallpattern of the effect of the tunnel on house prices is similar to Table 2. Interestingly, thecoefficient on the interaction term for 2016 is larger than 2017.
Tables E.2 and E.3 show how the results of equation (2) change when we exclude thedistance band between 1 and 2 km. Houses in this distance band received a larger benefitfrom the tunnel than houses closer by according to the baseline results of (2), whereas onewould expect the benefits of the tunnel to decline monotonically with distance. When weno longer include a separate distance band for houses between 1 and 2 km, these housesmove to the control group (Table E.2, left half). The coefficients on the shorter distancebands now reflect the additional appreciation within these bands vis a vis houses furtherthan 1 km from the tunnel. In the main text, these coefficients indicated the appreciationcompared to house more than 2km from the tunnel.
In the left half of Table E.2, the effects of the tunnel are no longer significant. Whenwe exclude houses between 1 and 2km rather than moving them to the control group(right half), we find that the tunnel has a comparable effect to Table 3 in the main text.We interpret these findings that both the anomalously large effect of the tunnel in the1-2km band in the main text, as well as the non-result in the left half of Table E.2 aredriven by an increase in the value of houses within this distance band - conditional onthe other variables we control for.
An eyeball plot of transaction prices per distance band indeed shows a relativelystrong increase in prices in the 1-2km distance band in 2016-2017 (Figure E.1).
We explore whether the large coefficient estimate for the 1-2km band is driven primar-ily by houses within 1-2km on the west side of the tunnel, or by properties within 1-2kmon the east side. We do this by sequentially excluding only those houses which are within1 and 2 km on the eastern side of the tunnel (Table E.3, left half), and excluding onlythe houses within 1 and 2 km on the western side (right half). The coefficients on theinteraction terms are a bit smaller in the right half of the Table than in the left half, butthe differences are not large. We thus find no evidence that the large effect of the tunnelin the 1-2km band is driven by asymmetric developments on the western and eastern sideof the tunnel.
Table E.4 shows the results of equation (2) without postal code fixed effects (lefthalf), and with postal code effects for smaller areas (right half). Without fixed effects,the base coefficients on the distance bands are larger in the OLS specification than inTable 3. The OLS results also display an earlier effect of the tunnel than our preferredspecification with PC4 fixed effects. The results with PC6 fixed effects are similar to thepreferred specification, with the exception of the positive and significant coefficients forthe 0.5-1km and 1-2km distance bands in 2012-2013.
Lastly, Table E.5 shows how the results of the log-log specification (1) change whenwe use smaller subsamples of houses closer to the tunnel. Postulating a logarithmic effectof distance to the tunnel has the advantage of a single, easy-to-interpret coefficient, butthe results are potentially sensitive to a distance cutoff for the estimation sample. If thisdistance cutoff is too generous, this could attenuate the estimated effect of the tunnel.In the main analysis, the cutoff is given by the municipality borders of Maastricht. TheTable shows that the results are stronger than in the main analysis we use a 1 km cutoff,
21

Table E.1: Logarithmic specification with interactionterms for individual years
OLS PC4 FE PC6 FE
Ln Distance Tunnel 0.009** 0.010 -0.011(0.004) (0.008) (0.046)
Ln Distance Tunnel 2010 0.002 -0.000 0.001(0.011) (0.011) (0.011)
Ln Distance Tunnel 2011 0.005 0.009 -0.005(0.014) (0.013) (0.012)
Ln Distance Tunnel 2012 -0.017 -0.009 -0.007(0.014) (0.012) (0.011)
Ln Distance Tunnel 2013 -0.023 -0.005 -0.012(0.016) (0.014) (0.013)
Ln Distance Tunnel 2014 -0.015 -0.013 -0.014(0.010) (0.010) (0.008)
Ln Distance Tunnel 2015 -0.016 -0.012 -0.006(0.011) (0.010) (0.009)
Ln Distance Tunnel 2016 -0.048*** -0.043*** -0.042***(0.011) (0.010) (0.009)
Ln Distance Tunnel 2017 -0.025** -0.023** -0.031***(0.012) (0.011) (0.009)
Housing attributes Yes Yes YesLocation attributes Yes Yes NoYear dummies Yes Yes YesN 9243 9243 9243Adjusted R2 0.805 0.843 0.906
Note: Dependent variable is the natural logarithm oftransaction prices. (1) is a baseline OLS regression, (2)is a PC4 code fixed effects model and (3) is a PC6 codefixed effects model. Heteroskedasticity robust stand-ard errors in parentheses. * p < 0.10, ** p < 0.5, ***p < 0.01
22

Table E.2: PC4 FE Difference-in-difference model, fewer distance bands
Full sample Exclude houses between 1-2 km0-0.5km 0.5-1km 0-0.5km 0.5-1km
Base -0.084*** -0.035*** -0.154*** -0.102***(0.015) (0.010) (0.030) (0.027)
2010-2011 0.026 -0.071*** 0.026 -0.079***(0.025) (0.019) (0.026) (0.022)
2012-2013 -0.006 -0.005 0.037 0.028(0.025) (0.021) (0.026) (0.022)
2014-2015 0.029 -0.015 0.050** 0.002(0.020) (0.019) (0.020) (0.020)
2016-2017 0.031 0.003 0.072*** 0.037*(0.025) (0.019) (0.025) (0.020)
N 9243 9243 6508 6508Adjusted R2 0.843 0.843 0.843 0.843
Note: Dependent variable is the natural logarithm of transactionprices. The coefficients are the effect of being within a certain dis-tance from the tunnel within a specified time period compared tohouses at more than 1km away from the tunnel. Heteroskedasticityrobust standard errors in parentheses. Housing attributes, Locationattributes and Year dummies have been included in the regression.* p < 0.10, ** p < 0.5, *** p < 0.01
23

Figure E.1: Observed mean log transaction prices per distance band
weaker with a 3km cutoff and zero with a 2km cutoff. The results with the 2km cutoffare likely to have the same cause as the large coefficient estimate for the 1-2km band inthe distance band specification (2).
24

Table E.3: PC4 FE Difference-in-difference model, fewer distance bands, subsamples
No houses 1-2km east of tunnel No houses 1-2km west of tunnel0-0.5km 0.5-1km 0-0.5km 0.5-1km
Base -0.122*** -0.071*** -0.101*** -0.051***(0.029) (0.026) (0.016) (0.010)
2010-2011 0.023 -0.068*** 0.034 -0.076***(0.025) (0.020) (0.025) (0.020)
2012-2013 0.017 0.016 0.011 0.006(0.026) (0.022) (0.026) (0.021)
2014-2015 0.044** -0.001 0.038* -0.009(0.020) (0.020) (0.020) (0.019)
2016-2017 0.056** 0.026 0.045* 0.013(0.025) (0.019) (0.025) (0.019)
N 7471 7471 8280 8280Adjusted R2 0.842 0.842 0.845 0.845
Note: Dependent variable is the natural logarithm of transaction prices. The coef-ficients are the effect of being within a certain distance from the tunnel within aspecified time period compared to houses at more than 1km away from the tun-nel. Heteroskedasticity robust standard errors in parentheses. Housing attributes,Location attributes and Year dummies have been included in the regression. * p< 0.10, ** p < 0.5, *** p < 0.01
25

Table E.4: OLS & PC6 FE Difference-in-difference model
OLS Distance bands PC6 FE Distance bands0-0.5km 0.5-1km 1-2km 0-0.5km 0.5-1km 1-2km
Base -0.040*** 0.039*** 0.046*** -0.139*** -0.120*** -0.067**(0.012) (0.010) (0.009) (0.049) (0.040) (0.028)
2010-2011 0.018 -0.039* 0.021 0.015 -0.027 0.032*(0.027) (0.023) (0.023) (0.024) (0.021) (0.018)
2012-2013 0.054* 0.069*** 0.097*** 0.009 0.047** 0.049**(0.027) (0.024) (0.023) (0.025) (0.020) (0.019)
2014-2015 0.051** 0.019 0.048*** 0.030 0.004 0.041***(0.022) (0.022) (0.018) (0.020) (0.018) (0.014)
2016-2017 0.059** 0.046** 0.102*** 0.069*** 0.047** 0.083***(0.026) (0.021) (0.017) (0.020) (0.019) (0.014)
N 9243 9243 9243 9243 9243 9243Adjusted R2 0.809 0.906 0.906 0.906
Note: Dependent variable is the natural logarithm of transaction prices.The coefficients are the additional price growth of a house in the spe-cified distance band compared to a house more than 2km away fromthe tunnel, relative to the pre-2010 period. Heteroskedasticity robuststandard errors in parentheses. Housing attributes, Location attributesand Year dummies have been included in the OLS regression, Housingattributes and Year dummies have been included in the PC6 FE regres-sion. * p < 0.10, ** p < 0.5, *** p < 0.01
26

Table E.5: Logarithmic specification, subsamples within 1km, 2km and 3km
1km 2km 3kmOLS PC4 FE PC6 FE OLS PC4 FE PC6 FE OLS PC4 FE PC6 FE
Ln Distance Tunnel 0.036*** 0.010 -0.082 0.030*** 0.013 -0.047 0.012*** 0.016* -0.017(0.007) (0.011) (0.051) (0.005) (0.009) (0.047) (0.004) (0.008) (0.046)
Ln Distance Tunnel ∗ 2010-11 -0.034* -0.042** -0.019 0.011 0.005 0.018 0.010 0.009 0.015(0.019) (0.020) (0.021) (0.013) (0.013) (0.013) (0.012) (0.011) (0.011)
Ln Distance Tunnel ∗ 2012-13 0.029 0.025 0.055*** 0.042*** 0.041*** 0.029** 0.015 0.015 0.014(0.023) (0.024) (0.019) (0.015) (0.015) (0.014) (0.014) (0.013) (0.012)
Ln Distance Tunnel ∗ 2014-15 -0.003 -0.007 0.000 0.015 0.012 0.017* 0.001 0.001 0.010(0.019) (0.019) (0.016) (0.012) (0.012) (0.010) (0.010) (0.009) (0.008)
Ln Distance Tunnel ∗ 2016-17 -0.041** -0.044** -0.030* -0.000 -0.000 0.001 -0.021* -0.019* -0.008(0.019) (0.019) (0.017) (0.013) (0.013) (0.010) (0.011) (0.010) (0.009)
Housing attributes Yes Yes Yes Yes Yes Yes Yes Yes YesLocation attributes Yes Yes No Yes Yes No Yes Yes NoYear dummies Yes Yes Yes Yes Yes Yes Yes Yes YesN 2551 2551 2551 5286 5286 5286 6822 6822 6822Adjusted R2 0.827 0.829 0.896 0.817 0.836 0.903 0.802 0.836 0.901
Note: Dependent variable is the natural logarithm of transaction prices. We drop observations further than 1, 2 or 3kmof the tunnel segment of the highway, respectively. We run a baseline OLS regression, a PC4 code fixed effects modeland a PC6 code fixed effects model. Heteroskedasticity robust standard errors in parentheses. * p < 0.10, ** p < 0.5,*** p < 0.01
27