infrastructure for high speed lines in japan rail presentations... · contents introduction track...
TRANSCRIPT

Infrastructure for high speed lines in Japan
Atsushi YOKOYAMADirector of Japan Railways Group Paris Office
Paris, FRANCE

Contents
Introduction
Track (Slab track) and its maintenance
Measures for natural hazard
Signaling system
Power supply system
Morioka
Sendai
Shinjo
Niigata
Fukushima
Tokyo
Shin-OsakaHakata
Akita
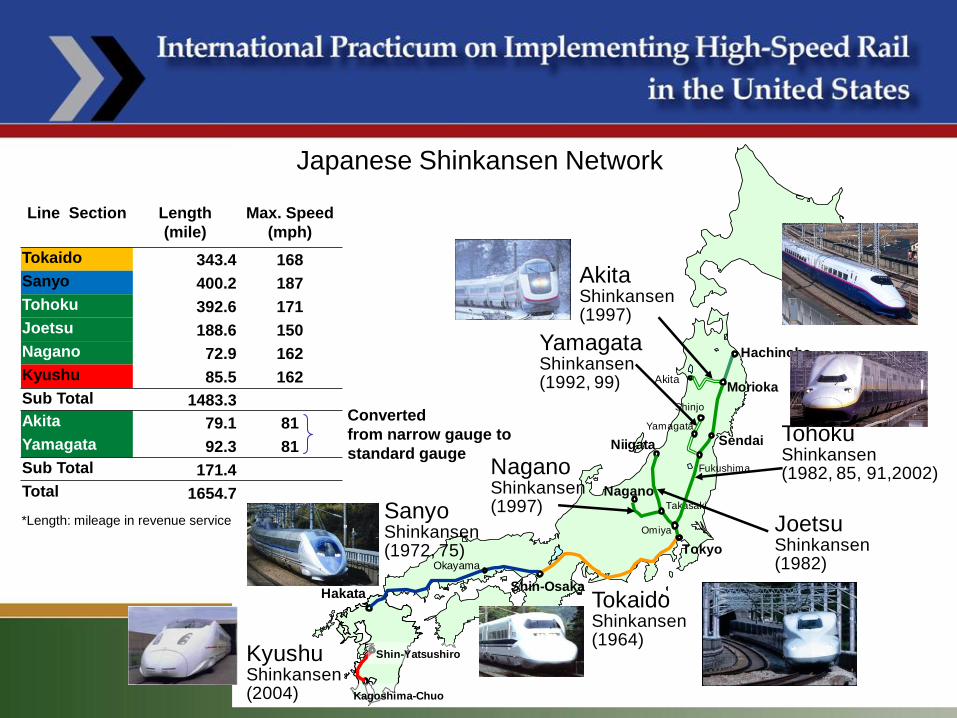
Nagano Shinkansen(1997)
Joetsu Shinkansen(1982)
Tohoku Shinkansen(1982, 85, 91,2002)
Sanyo Shinkansen(1972, 75)
Tokaido Shinkansen(1964)
Takasaki
Kagoshima-Chuo
Hachinohe
Kyushu Shinkansen(2004)
Akita Shinkansen(1997)
Yamagata Shinkansen (1992, 99)
Nagano
Yamagata
Okayama
Shin-Yatsushiro
Omiya
Converted
from narrow gauge to
standard gauge
Japanese Shinkansen Network
Line Section Length
(mile)
Max. Speed
(mph)
Tokaido 343.4 168
Sanyo 400.2 187
Tohoku 392.6 171
Joetsu 188.6 150
Nagano 72.9 162
Kyushu 85.5 162
Sub Total 1483.3
Akita 79.1 81
Yamagata 92.3 81
Sub Total 171.4
Total 1654.7
*Length: mileage in revenue service

Shinkansen has strong points:
Safe No fatal accidents in 45 years
Faster 300km/h (Sanyo Shinkansen)
Punctual, Reliable Average delay time per train:
0.6min (Tokaido, 2008, 323 trains/day)
Frequent 15 trains/hour at maximum
Environmental friendly Less energy consumption, Low noise,…
Data between 1999-20060
0.2
0.4
0.6
0.8
1
1.2
1999 2000 2001 2002 2003 2004 2005 2006
Av
era
ge
de
lay
tim
e /
tra
in
(min
ute
s)
Fiscal Year
Tokaido
Tohoku, Joetsu, Nagano
Facts
“Average delay time”: total “delay
time” of all trains/ total train number,
and the “delay time” is counted if it is
more than 1 minute.

Infrastructure
Line name Tokaido Sanyo Tohoku Hokuriku
Section of line Tokyo - Shin-Osaka Okayama - Hakata Omiya - Morioka Takasaki - Nagano
Year opened 1964 1975 1982 1997
Maximum speed (mph) initial/present 130/168 130/186 130/171 162/162
Track gauge (mm) 1435 1435 1435 1435
Permissible axle weight (t) 16 16 17 16
Dominant Track type Ballast Slab Slab Slab
Distance between centers of main tracks
(m)4.2 4.3 4.3 4.3
Minimum curve radius (m) 2500 4000 4000 4000
Maximum designed cant (mm) 200 200 180 200
Cross section area of tunnel (m2) 60.5 63.4 63.4 63.4
Maximum gradient (if needed) 1.5% (2%) 1.5% (2%) 1.2% (1.5%) 1.5% (3.5%)
Electrical power supply AC25KV 60Hz AC25KV 60Hz AC25KV 50Hz AC25KV 50/60Hz
Signal type Digital ATC ATC Digital ATC ATC

Infrastructure
0% 20% 40% 60% 80% 100%
Tokaido
Sanyo
Tohoku
Joetsu
Hokuriku
Cut and Embankment Viaduct and Bridge Tunnel
Length percentage
Data: Excerpted from “Shinkansen”, Sankaido, 2003
Proportion of structures
-Level crossing is avoided.
-Concrete structure is dominant after Sanyo Shinkansen
-Proportion of tunnel is large

Track structure of Shinkansen
(Total: 773mile)
(0mile)
(5mile)
(170mile)
(311mile)
(151mile)
(65mile)
(71mile)
Tokaido
Sanyo (eastern part)
Sanyo (western part)
Tohoku
Joetsu
Hokuriku
Kyushu

Structures on Shinkansen
Tunnel Bridge
Viaduct Earth Structure
( Hokuriku Shinkansen ) ( Tohoku Shinkansen )
( Tohoku Shinkansen ) ( Kyushu Shinkansen )

Viaduct
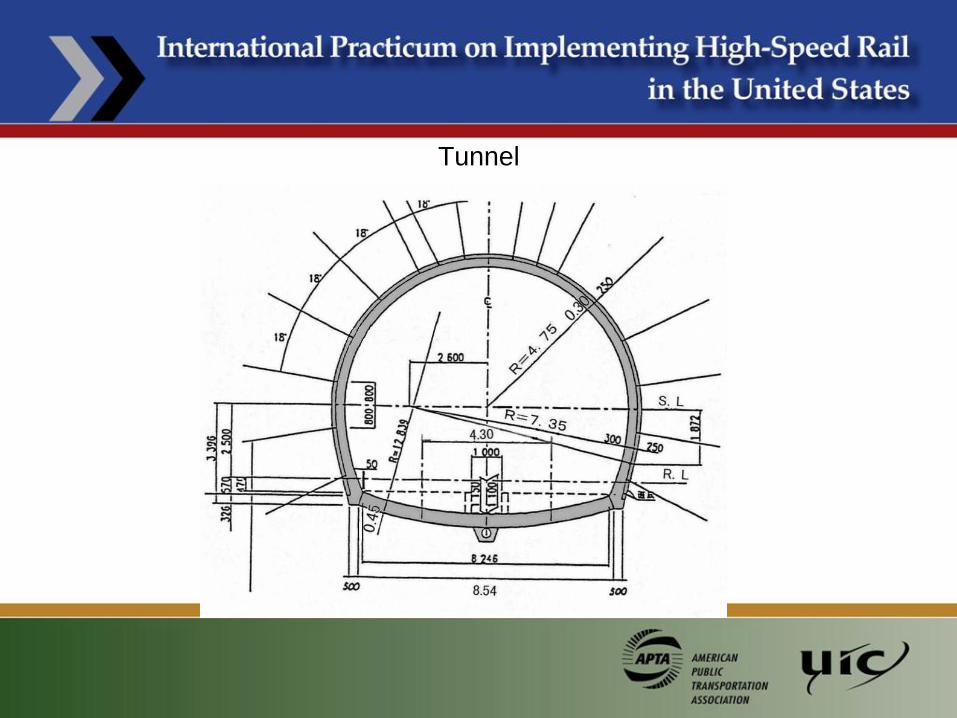
Tunnel
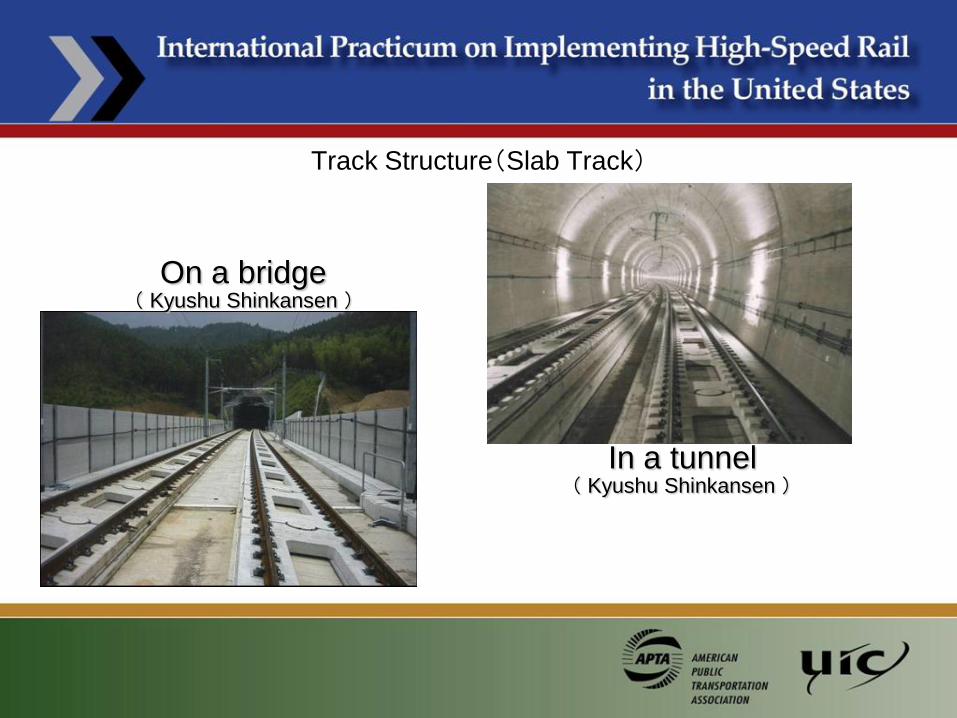
Track Structure(Slab Track)
In a tunnel( Kyushu Shinkansen )
On a bridge( Kyushu Shinkansen )

Design concepts of slab track
In 1965, the former Japanese National Railways (JNR) started to develop “New Track Structures”.
The design concepts were:
[1] The construction cost shall be less than twice as much as that of ballasted track.
[2] Elasticity and lateral/vertical strength shall be greater than those of ballasted track.
[3] A construction rate shall be at least 200 m/day.
[4] Track irregularities due to substructure deterioration shall be within the allowable range.
(+/-50 mm vertically, +/-10 mm laterally)

Structure of slab track

Rail fastening device type-8
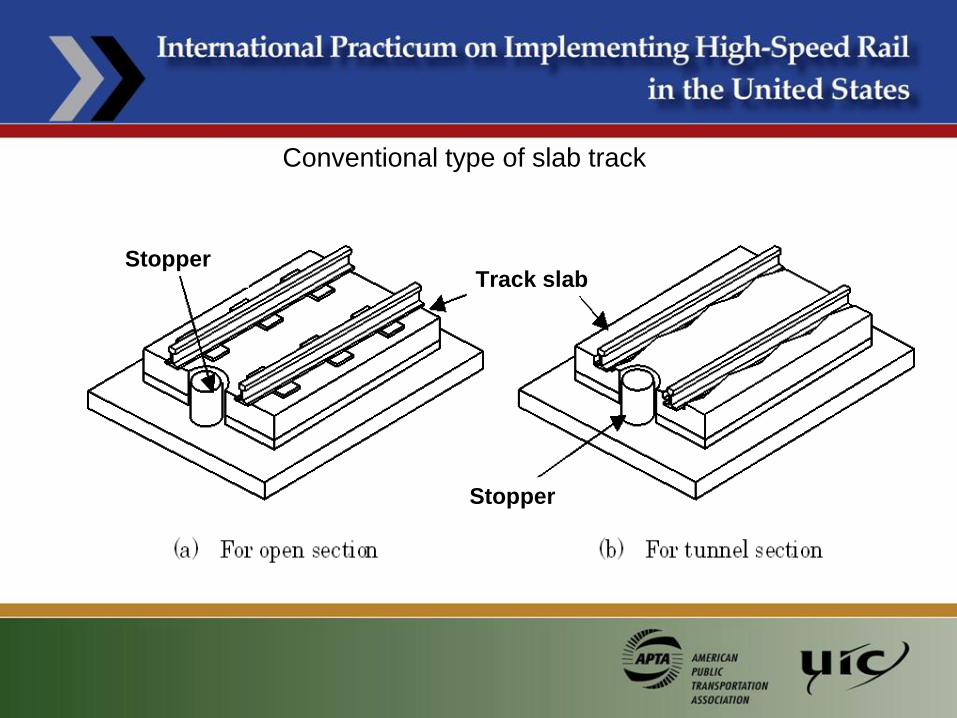
Conventional type of slab track
Stopper
Stopper Track slab
Stopper
Stopper Track slab

Frame-shaped Slab Track

Comparison of maintenance work cost
0.5
1.0
2.0
1.5
2.5
3.0
2003 2004 2005 2006 AVE 2003 2004 2005 2006 AVE
Slab track
Main
ten
an
nce
cost(
mil
lion
-yen/
year/
km)
Ballated track Fastening
Leveling
Lining
Overall leveling
CA-mortar Costs 1/3
Average Average
Ballasted track
17
34
511000 USD/Year/mile
1USD=94JPY

Comparison of total cost ballasted track vs slab track

Track structure of JR East
Slab track Resiliently supported track
Line name Line length
Segment
Slab Ballast Resiliently
supported trackOthers
Tohoku Shinkansen 377.4 315.5 30.8 29.0 2.1
Joetsu Shinkansen 167.5 151.2 9.0 7.3 0.1
Hokuriku Shinkansen 71.8 62.4 9.1 0.2 0.1
Total 616.6 529.1 48.9 36.4 2.2
Ratio 85.8% 7.9% 5.9% 0.4%
Unit: Mile

Riding Quality Management: Overview
Central server ・ Inspection data
・ Facilities data
・ Work records
・ Work estimates
・ Planning support
◇Electric and track inspection car (Train oscillation
and track irregularity inspections)
◇ Operational trains (Train oscillation inspections)
【Inspections】
◇ Track maintenance technology center
TRAMSTRAMS
◇ Track management
company・ Inspection data
・ Facilities data
・ Work records
・ Work estimates
・ Planning support
Maintenance work volume calculation
& work planning Decision making of
repair plans etc.
Work
notification
・ Inspection data
・ Facilities data
・ Work records
【Planning】
【Maintenance work】
Central server ・ Inspection data
・ Facilities data
・ Work records
・ Work estimates
・ Planning support
◇Electric and track inspection car (Train oscillation
and track irregularity inspections)
◇ Operational trains (Train oscillation inspections)
【Inspections】◇Electric and track inspection car (Train oscillation
and track irregularity inspections)
◇ Operational trains (Train oscillation inspections)
【Inspections】
◇ Track maintenance technology center
TRAMSTRAMSTRAMSTRAMS
◇ Track management
company・ Inspection data
・ Facilities data
・ Work records
・ Work estimates
・ Planning support
Maintenance work volume calculation
& work planning Decision making of
repair plans etc.
Work
notification
・ Inspection data
・ Facilities data
・ Work records
【Planning】
【Maintenance work】

Riding quality management: Management criteria
Management of long wavelength track irregularities
10m-chord track irregularity management
⇒ 40m-chord track irregularity management
Short wavelength maintenance
Long wavelength maintenance
Planned lineBefore
maintenance
After
maintenance
Before
maintenance
After
maintenance
0
50
100
150
200
250
300
1999
2000
2001
2002
2003
2004
2005
2006
2007
No. of
locat
ions
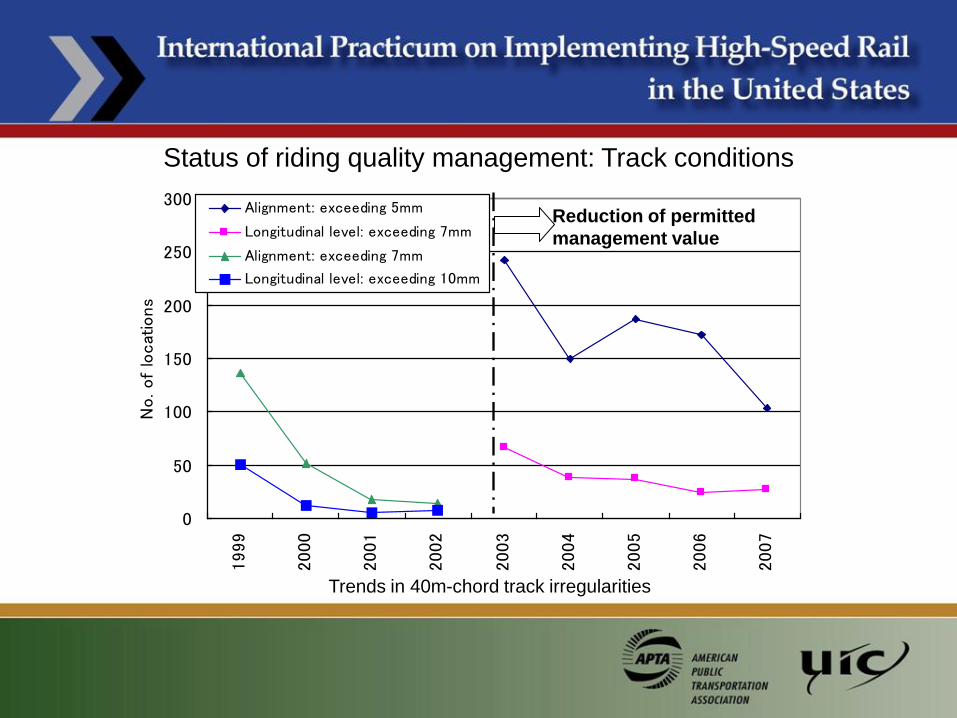
Alignment: exceeding 5mm
Longitudinal level: exceeding 7mm
Alignment: exceeding 7mm
Longitudinal level: exceeding 10mm
Status of riding quality management: Track conditions
Trends in 40m-chord track irregularities
Reduction of permitted
management value

Riding quality management: Car body oscillation acceleration
0
0.5
1
1.5
2
2.5
3
3.5
4
1984
1986
1988
1990
1992
1994
1996
1998
2000
2002
2004
2006No. of
exc
eedi
ng
targ
et
valu
e o
f C
BO
A
Horizontal oscillations
Vertical oscillations
Reinforcement of 40m-chord
Introduction of 40m-chord
10m-chord
Trends in car body oscillation acceleration
(Tohoku Shinkansen, per 10km[6.2mile] on one trip)
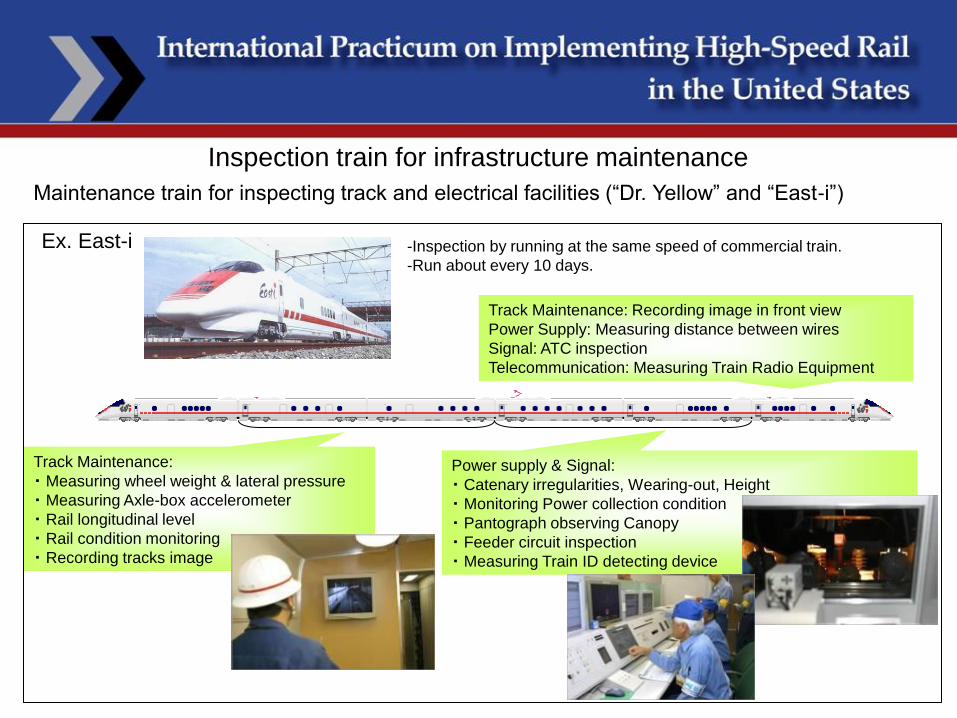
Maintenance train for inspecting track and electrical facilities (“Dr. Yellow” and “East-i”)
-Inspection by running at the same speed of commercial train.
-Run about every 10 days.
Inspection train for infrastructure maintenance
Track Maintenance: Recording image in front view
Power Supply: Measuring distance between wires
Signal: ATC inspection
Telecommunication: Measuring Train Radio Equipment
Track Maintenance:
・ Measuring wheel weight & lateral pressure
・ Measuring Axle-box accelerometer
・ Rail longitudinal level
・ Rail condition monitoring
・ Recording tracks image
Power supply & Signal:
・ Catenary irregularities, Wearing-out, Height
・ Monitoring Power collection condition
・ Pantograph observing Canopy
・ Feeder circuit inspection
・ Measuring Train ID detecting device
Ex. East-i
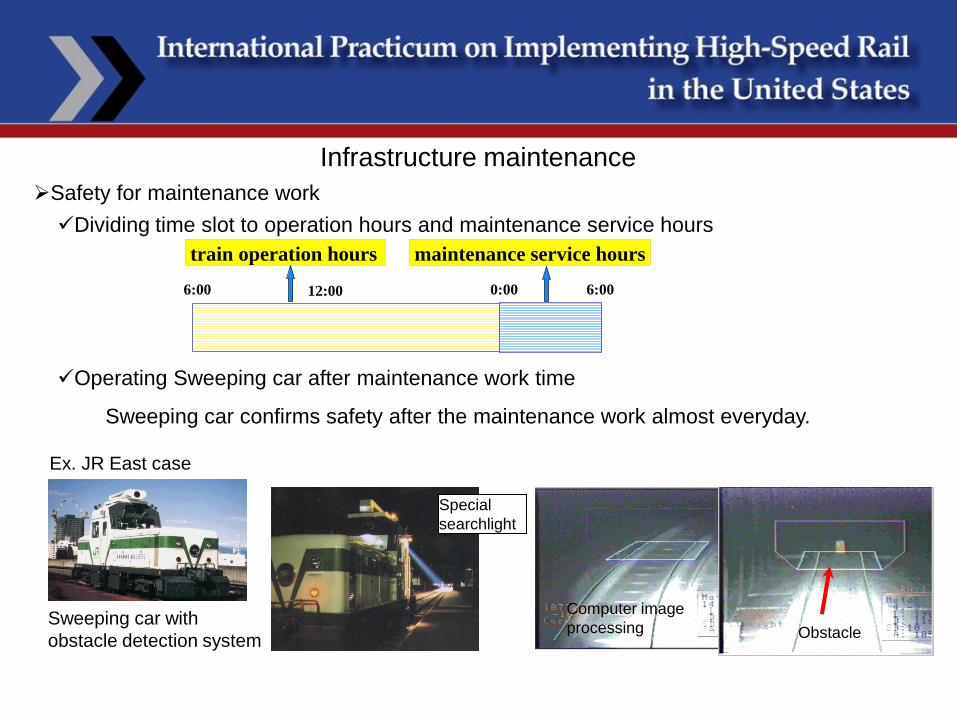
Safety for maintenance work
Infrastructure maintenance
Dividing time slot to operation hours and maintenance service hours
Operating Sweeping car after maintenance work time
Sweeping car confirms safety after the maintenance work almost everyday.
Ex. JR East case
Sweeping car with
obstacle detection system
maintenance service hourstrain operation hours
6:00 0:00 6:0012:00
Computer image
processing Obstacle
Special
searchlight

Wind, rain and height of river surface
Substation control
East-i
Rolling stop depot shunting control
Automatic train route control
Display of operational conditions
Hand-held terminal
Station system
33 stations5 depots
Maintenance work
Passenger information display and
broadcasting
Display of forecast diagram
Train operation display
Central systemCentral system
High-speed digital bus
Information terminals
Crew offices (10
offices)
Maintenance of way
offices (69 offices)
6 branches
Information terminals
Crew offices (10
offices)
Maintenance of way
offices (69 offices)
6 branches
Dispatch Center of the ShinkansenOperation Headquarters
Operation control system
Systematization of train and crew planning, train operation control and maintenance and management of
rolling stock, track, electricity, signal and communication
Ex. New Comprehensive Shinkansen System (COSMOS) for JR East

Earthquake damage for Shinkansen
1,008 gal
Niigata
Nagaoka
Epicenter
Derailment
921gal
943 gal
-First case of derailment of high speed train by earthquake
-Speed was approx. 125mph
-8 cars were derailed in 10 cars
-154 passengers, no casualties
Niigata Chuetsu Earthquake
October 23, 2004
Magnitude 6.8
Depth of epicenter : 13 km

in 1995 South Hyogo Earthquake (max.891 gal) gave
damage to bridge columns at Sanyo Shinkansen
Measures: Pillars were strengthened by
Steel jacket method
Rib-bar(RB)method etc.
Design criterion was improved
Deformation of tunnel
and collapse of
concrete surface
Application of Backfill
grouting method and Rock
bolt method for tunnels
destroyed by the earthquake
Measures for earthquake: Strengthening infrastructures
Rock bolt method
Steel jacket methodSouth Hyogo
Earthquake
These measures were verified as effective
at Niigata Chuetsu Earthquake!
Niigata Chuetsu Earthquake
New measure
Viaduct Tunnel

Earthquake observation system and early earthquake detection network
Seismometers along coastline
N
Signals to stop electric power
supply after earthquake detection
SubstationsSeismometers along tracks
Substations
(Seismometers)
Sections to cut electric power supply
Power supply
line
Section
Substations
(Seismometers)
Sections to cut electric power supply
Power supply
line
Section
Seismometer
Ex. JR East case
Power outage activates emergency brake of the train within 2.58sec.

Protection from snow damage of infrastructure and train
Snow fall detection equipment
Snow depth meter
Sprinkler
Snow shelter
Ballast screen installation
to avoid ballast scattering by snow fallen from trains
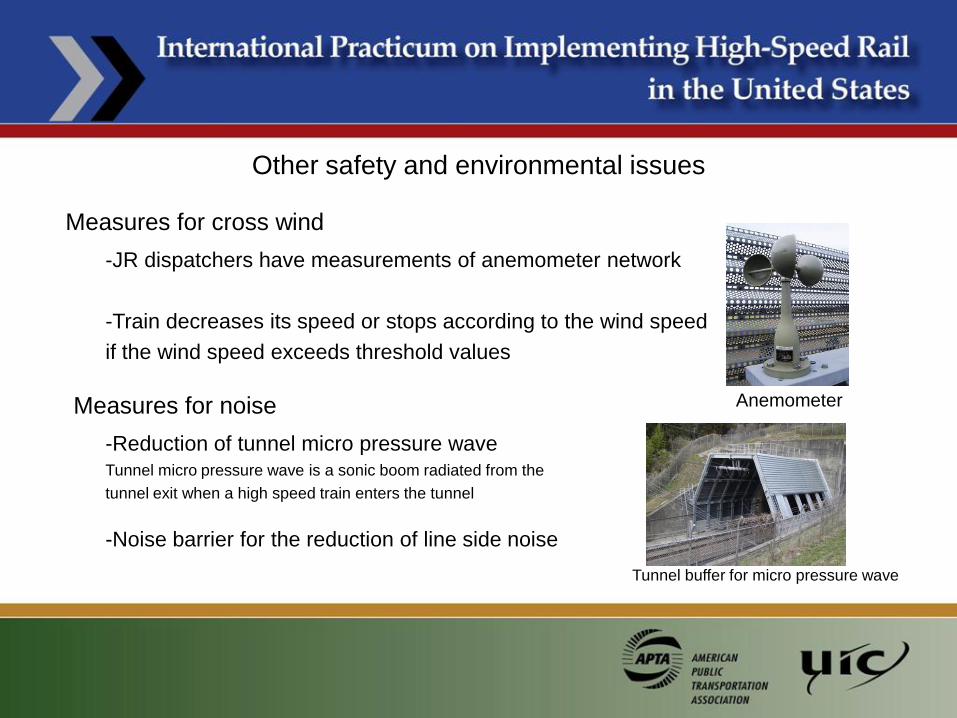
Measures for cross wind
-JR dispatchers have measurements of anemometer network
-Train decreases its speed or stops according to the wind speed
if the wind speed exceeds threshold values
Measures for noise
-Reduction of tunnel micro pressure wave
Tunnel micro pressure wave is a sonic boom radiated from the
tunnel exit when a high speed train enters the tunnel
-Noise barrier for the reduction of line side noise
Tunnel buffer for micro pressure wave
Anemometer
Other safety and environmental issues
JR E2-MATSUKI JR E2-MATSUKI
ATC ground system
D1TD2TD3TD4TD5TD6T
D2T
Detecting preceding train
Transmit the track circuit number
where the train has to stop
D2TD2TD2TD2T
Track circuit number
Braking curve generated on board
Speed
Train speed
controlled by
DS-ATCTrain speed controlled by
conventional ATC
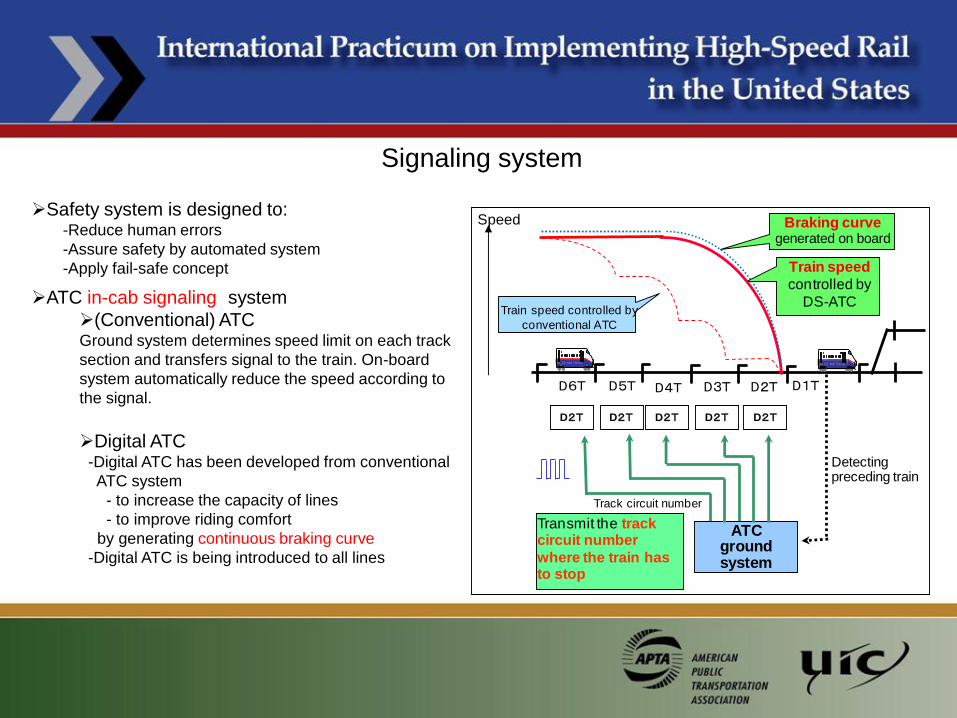
Signaling system
ATC in-cab signaling system
(Conventional) ATCGround system determines speed limit on each track
section and transfers signal to the train. On-board
system automatically reduce the speed according to
the signal.
Digital ATC-Digital ATC has been developed from conventional
ATC system
- to increase the capacity of lines
- to improve riding comfort
by generating continuous braking curve
-Digital ATC is being introduced to all lines
Safety system is designed to:-Reduce human errors
-Assure safety by automated system
-Apply fail-safe concept

Power supply system
Sub StationSub Station Sub Sectioning PostSub Sectioning Post Sectioning PostSectioning Post
Auto transferAuto transfer
Rail or AT protective wire
Contact wire
AT Feeding
Change over sectionChange over section
電力会社 3φ275kVPower
Company
AC25kV50Hz (eastern Japan area)
AC25kV60Hz (western Japan area) Trains can run with the least power cut
Regenerative brake can be used
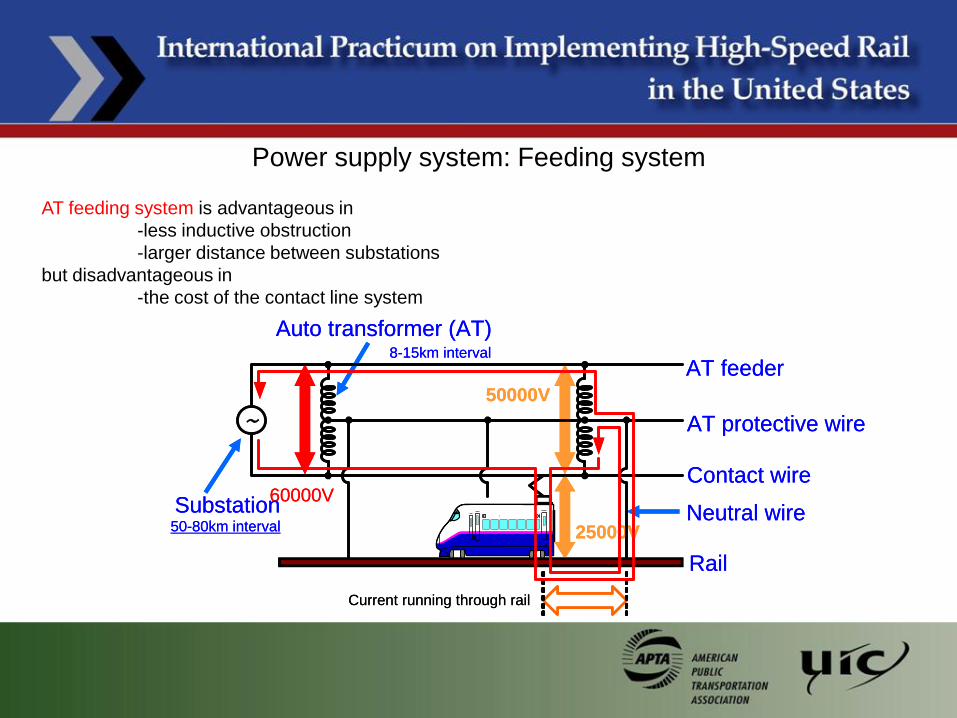
AT feeding system is advantageous in
-less inductive obstruction
-larger distance between substations
but disadvantageous in
-the cost of the contact line system
AT feeder
Contact wire
Rail
50-80km interval
Auto transformer (AT)
AT protective wire
Current running through rail
Neutral wire
50000V
8-15km interval
60000V
25000V
Substation
~
AT feeder
Contact wire
Rail
50-80km interval
Auto transformer (AT)
AT protective wire
Current running through rail
Neutral wire
50000V
8-15km interval
60000V
25000V
Substation
~
Power supply system: Feeding system
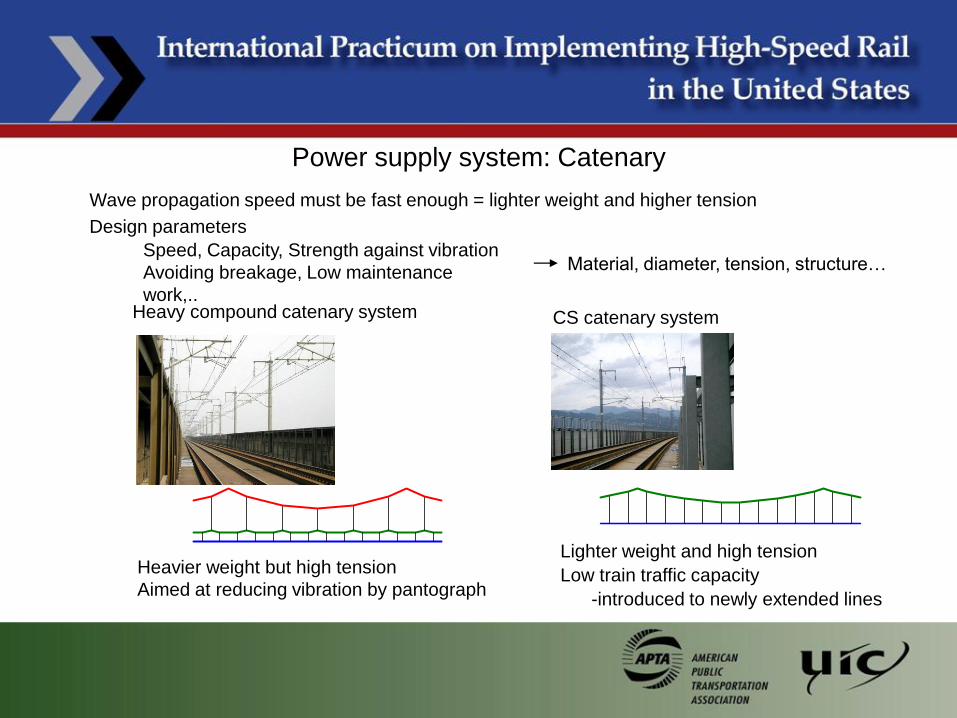
Heavy compound catenary system
Power supply system: Catenary
Wave propagation speed must be fast enough = lighter weight and higher tension
CS catenary system
Heavier weight but high tension
Aimed at reducing vibration by pantograph
Speed, Capacity, Strength against vibration
Avoiding breakage, Low maintenance
work,..
Lighter weight and high tension
Low train traffic capacity
-introduced to newly extended lines
Material, diameter, tension, structure…
Design parameters
Thank you very muchfor your attention