infrastructure financing the art of long term …
TRANSCRIPT

THE ART OFLONG TERMVISION
INFRASTRUCTURE FINANCING
2015 ANNUAL REPORT
& ACCOUNTS

The Africa Finance Corporation (AFC) is aninternationally-recognised award-winningfinance institution committed to building uponAfrica's foundation through investments in itsnatural resources and industrial minerals such asgypsum and iron ore. The AFC offers athree-pronged advance with global-standardfinancing, industry specific advisory services andcultural insights to all project solutions, ensuringa tailored approach to the development of thedynamic African market.
THE ART OFLONG TERMVISION
INFRASTRUCTURE FINANCING
2015 ANNUAL REPORT & ACCOUNTS

CONTENTS
04
Financial Highlights 05
Statement from the Chair 10
Director’s Report 15
Leadership & Governance 22
2015 Business Review 28Infrastructure Financing - The Art of Long Term Vision
Financial Statements 43
Corporate Information 116
AFC / 2015 ANNUAL REPORT & ACCOUNTS
INFRA
STRU
CTU
RE F
INA
NC
ING
| T
HE A
RT O
F L
ON
G T
ERM
VIS
ION

GROWTH IN BALANCE SHEET
NET INTEREST INCOME
0
27500
55000
82500
110000
2014 2015
0
800000
1600000
2400000
3200000
TOTAL ASSETS TOTAL LIABILITIES TOTAL EQUITY
2014 2015
25%
39%GROWTH IN NET
INTEREST INCOME
05
INFRA
STRU
CTU
RE F
INA
NC
ING
| TH
E A
RT O
F LO
NG
TERM
VIS
ION
FINANCIAL HIGHLIGHTS
US$ ‘000
US$ ‘000
104,883
75,650
3,0
39
,71
3
2,4
39
,10
6
1,6
73
,99
9
1,0
86,7
11
1,3
52
,39
5
1,3
65
,71
4
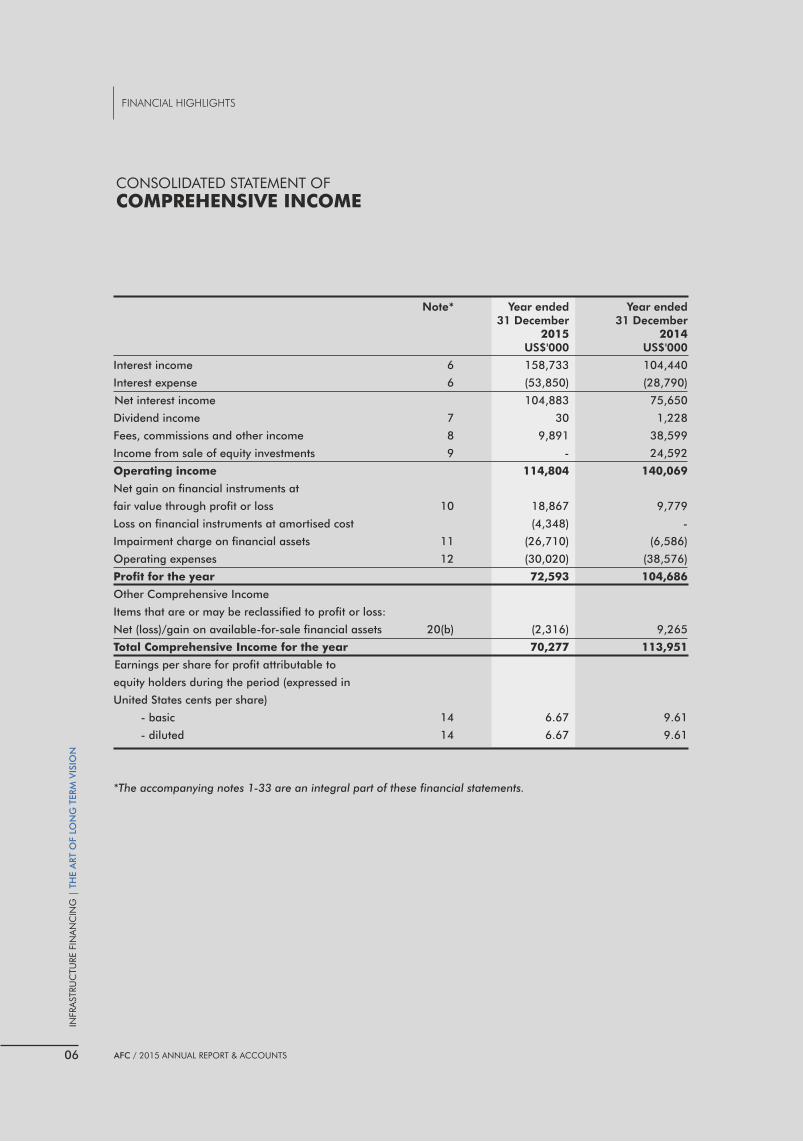
Note* Year ended Year ended 31 December 31 December 2015 2014 US$'000 US$'000
Interest income 6 158,733 104,440
Interest expense 6 (53,850) (28,790)
Net interest income 104,883 75,650
Dividend income 7 30 1,228
Fees, commissions and other income 8 9,891 38,599
Income from sale of equity investments 9 - 24,592
Operating income 114,804 140,069
Net gain on financial instruments at
fair value through profit or loss 10 18,867 9,779
Loss on financial instruments at amortised cost (4,348) -
Impairment charge on financial assets 11 (26,710) (6,586)
Operating expenses 12 (30,020) (38,576)
Profit for the year 72,593 104,686
Other Comprehensive Income
Items that are or may be reclassified to profit or loss:
Net (loss)/gain on available-for-sale financial assets 20(b) (2,316) 9,265
Total Comprehensive Income for the year 70,277 113,951
Earnings per share for profit attributable to
equity holders during the period (expressed in
United States cents per share)
- basic 14 6.67 9.61
- diluted 14 6.67 9.61
*The accompanying notes are an integral part of these financial statements.1-33
CONSOLIDATED STATEMENT OF
COMPREHENSIVE INCOME
06
INFRA
STRU
CTU
RE F
INA
NC
ING
| T
HE A
RT O
F L
ON
G T
ERM
VIS
ION
FINANCIAL HIGHLIGHTS
AFC / 2015 ANNUAL REPORT & ACCOUNTS

Note* Year ended Year ended 31 December 31 December 2015 2014 US$'000 US$'000
ASSETS
Cash and balances with commercial banks 15 40,414 86,551
Loans and advances to banks 16 976,130 370,476
Derivative financial instruments 17 3,534 639
Financial assets at fair value through profit or loss 18 226,228 189,148
Loans and advances to other customers 19 1,177,864 1,087,390
Investment securities:
- Financial assets at amortised cost 20(a) 497,805 535,086
- Financial assets at fair value through OCI 20(b) 98,491 100,373
Other assets 21 16,760 66,204
Property and equipment 22 1,845 2,001
Intangible assets 23 642 1,238
Total assets 3,039,713 2,439,106
LIABILITIES
Accrued expenses and other liabilities 24 24,345 25,104
Derivative financial instruments 17 2,718 14
Borrowings 25 1,646,936 1,061,593
Total liabilities 1,673,999 1,086,711
EQUITY
Capital and reserves attributable to the Corporation's
equity holders:
Share capital 27 1,089,067 1,089,067
Retained earnings 28 255,335 239,700
Fair value reserves 29 21,312 23,628
Total equity 1,365,714 1,352,395
Total liabilities and equity 3,039,713 2,439,106
*The accompanying notes are an integral part of these financial statements.1-33
CONSOLIDATED STATEMENT OF
FINANCIAL POSITION
07
INFRA
STRU
CTU
RE F
INA
NC
ING
| TH
E A
RT O
F LO
NG
TERM
VIS
ION
FINANCIAL HIGHLIGHTS
AFC / 2015 ANNUAL REPORT & ACCOUNTS

Share Retained Fair Value Capital Earnings Reserves Total US$'000 US$'000 US$'000 US$'000
As at 1 January 2014 1,089,067 178,577 14,363 1,282,007
Dividends paid during the year - (43,563) - (43,563)
Total comprehensive income - 104,686 9,265 113,951
As at 31 December 2014 1,089,067 239,700 23,628 1,352,395
As at 1 January 2015 1,089,067 239,700 23,628 1,352,395
Profit for the year - 72,593 - 72,593
Dividends paid during the year - (56,958) - (56,958)
Other comprehensive income
Fair value change in financial assets - - (2,316) (2,316)
As at 31 December 2015 1,089,067 255,335 21,312 1,365,714
CONSOLIDATED STATEMENT OF
CHANGES IN EQUITY
08
INFRA
STRU
CTU
RE F
INA
NC
ING
| T
HE A
RT O
F L
ON
G T
ERM
VIS
ION
FINANCIAL HIGHLIGHTS
AFC / 2015 ANNUAL REPORT & ACCOUNTS
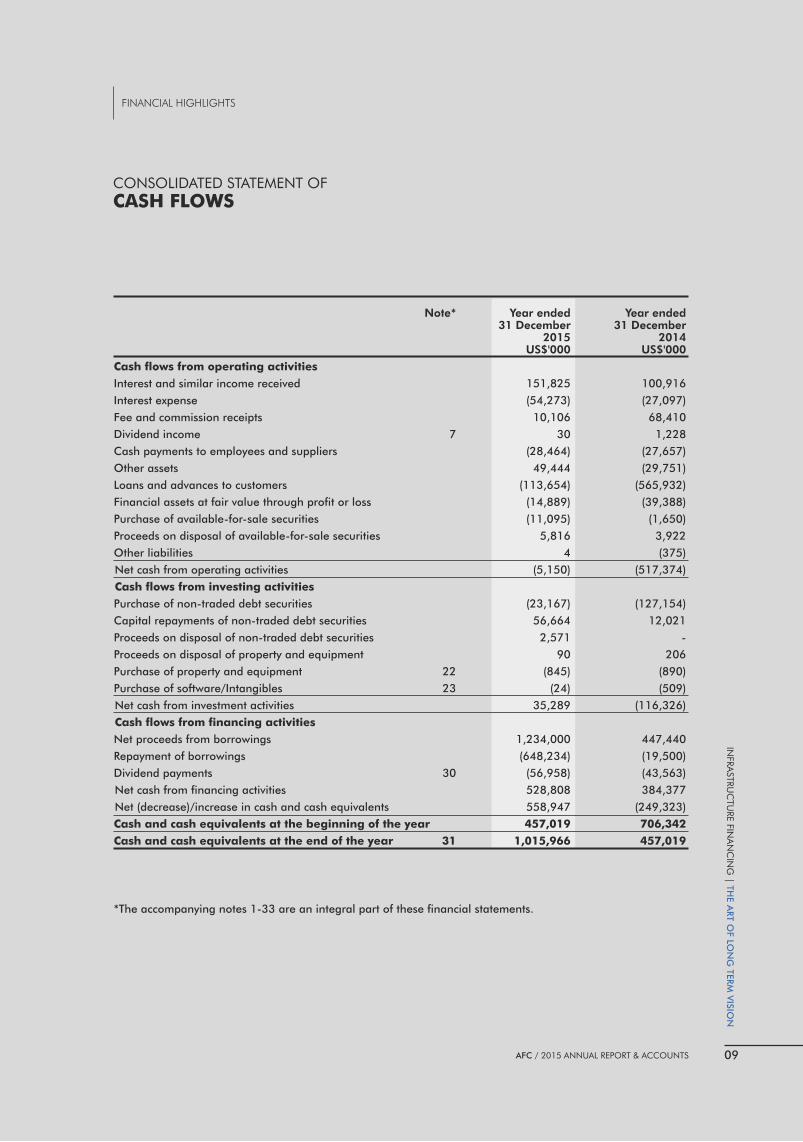
CONSOLIDATED STATEMENT OF
CASH FLOWS
Note* Year ended Year ended 31 December 31 December 2015 2014 US$'000 US$'000
Cash flows from operating activities
Interest and similar income received 151,825 100,916
Interest expense (54,273) (27,097)
Fee and commission receipts 10,106 68,410
Dividend income 7 30 1,228
Cash payments to employees and suppliers (28,464) (27,657)
Other assets 49,444 (29,751)
Loans and advances to customers (113,654) (565,932)
Financial assets at fair value through profit or loss (14,889) (39,388)
Purchase of available-for-sale securities (11,095) (1,650)
Proceeds on disposal of available-for-sale securities 5,816 3,922
Other liabilities 4 (375)
Net cash from operating activities (5,150) (517,374)
Cash flows from investing activities
Purchase of non-traded debt securities (23,167) (127,154)
Capital repayments of non-traded debt securities 56,664 12,021
Proceeds on disposal of non-traded debt securities 2,571 -
Proceeds on disposal of property and equipment 90 206
Purchase of property and equipment 22 (845) (890)
Purchase of software/Intangibles 23 (24) (509)
Net cash from investment activities 35,289 (116,326)
Cash flows from financing activities
Net proceeds from borrowings 1,234,000 447,440
Repayment of borrowings (648,234) (19,500)
Dividend payments 30 (56,958) (43,563)
Net cash from financing activities 528,808 384,377
Net (decrease)/increase in cash and cash equivalents 558,947 (249,323)
Cash and cash equivalents at the beginning of the year 457,019 706,342
Cash and cash equivalents at the end of the year 31 1,015,966 457,019
*The accompanying notes 1-33 are an integral part of these financial statements.
09
INFRA
STRU
CTU
RE F
INA
NC
ING
| TH
E A
RT O
F LO
NG
TERM
VIS
ION
FINANCIAL HIGHLIGHTS
AFC / 2015 ANNUAL REPORT & ACCOUNTS

Africa's share of global private infrastructure investment has remained small at less than 5%,
while Africa's demand for robust infrastructure assets remains persistently high. Africa Finance Corporation (“AFC” or “The Corporation”) was created to address this infrastructure investment gap.
AFC's long term vision is to be the leading African Institution in infrastructure financing on the continent, and to foster eco-nomic growth and the industrial development of African coun-tries. During 2015 we have continued to grow, expanding our geographical presence and membership base and proactively developing long term infrastructure projects from inception to completion.
Investments in the project development asset class,
one of our core differentiating value propositions,
had a marked positive impact on the value and
performance of our total investments in 2014, when
one of our flagship projects, Cenpower Kpone IPP in
Ghana, reached financial close. In 2015, however,
challenging market conditions have impacted our
business in various ways, by reducing the value and
performance of some of the investments that we
manage.
2015 was a challenging year, both for the Continent
and for AFC. The year was characterised by a
decline in commodity prices, in particular oil, miner-
als, and soft commodities. Oil prices were pressured
by a supply glut; a situation which saw prices plum-
met by approximately 50% during the year. The
slowdown in Chinese and broader emerging market
demand, tepid economic expansion in Europe and a
strengthening of the US dollar consequent on an
increase in interest rates by the Federal Reserve has
negatively impacted African economies and their
foreign exchange reserves. This has resulted in
currency devaluation in many African countries,
tighter credit markets, and a slowdown in interna-
tional investment on the continent.
STATEMENT FROM THE CHAIR
10
INFRA
STRU
CTU
RE F
INA
NC
ING
| T
HE A
RT O
F L
ON
G T
ERM
VIS
ION
AFC / 2015 ANNUAL REPORT & ACCOUNTSAFC / 2015 ANNUAL REPORT & ACCOUNTS

Global Environment
Strong Economic Headwinds
There was a slowdown in growth of the global
economy in 2015. This was largely due to the
gradual tightening of monetary policy in the United
States and the economic slowdown in China, as
China's demand for raw material imports declined,
and the Chinese economy rebalanced away from
manufacturing to services. This has contributed to
falling commodity prices and increased market
volatility. The net result of these factors is that sub-
Saharan Africa's growth rate for 2015 is estimated to
have been against earlier forecasts of up to 4.2%.
Overall, business activity appeared to remain
resilient in the US, reinforced by the strengthening
housing and labour markets. The strengthening US
dollar however, has begun to weigh on manufactur-
ing activity. Lower oil and commodity prices are
curtailing investment in the mining and the oil and
gas sectors. The divergence in monetary policy
between the US and the Eurozone reflects the differ-
ing economic performance of the regions.
Throughout 2015, most sub-Saharan African
economies saw higher budget deficits, which are
likely to result in increased borrowing and generally
higher risk profiles. Some economies, such as Cote
d'Ivoire, Kenya and Mozambique, gained momen-
tum due to their lower exposure to the commodity
slowdown, and are expected to maintain increasing
growth rates. This projected gradual increase in
growth and related opportunities is reassuring, and
we remain committed and optimistic for an increase
in deal flow in our core sectors: power, natural
resources, heavy industry, telecom-munications and
transportation.
Mitigating the challenges
The mixed performance of the global economy and
the continuous negative market sentiment is generat-
ing considerable concern across AFC's core sectors.
Credit growth slowed significantly during the year, as
did investment inflows, reflecting both the difficult
environment conditions and increased risk percep-
tion. In many African oil-exporting economies, 2015
was especially challenging in light of the falling oil
price.
While falling commodity prices and the challenging
economic environment placed pressure on the
potential performance of AFC's assets, the
Corporation ended the year with no non-performing
loans. This is due to the pro-active monitoring and
management of those assets that were showing signs
of stress. Nevertheless, as a measure of prudence
and in accordance with applicable accounting
standards, the Corporation took a general portfolio
provision to recognize the increased risks associated
with some of its portfolio assets.
As part of our proactive approach to portfolio
management, a Risk Assurance Unit has been
created to continue to effectively manage stressed
assets in the Corporation's portfolio.
Financial Performance
Despite the challenging operating environment, the
Africa Finance Corporation delivered strong underly-
ing operating results. At year-end 2015, the
Corporation achieved a significant 25% growth in its
balance sheet with respect to 2014, with total assets
in excess of US$3 billion. It generated gross revenues
of US$168.63 million, driven by strong accrual
income and impressive annuity revenues on the
existing debt portfolio, and increased income from
short term treasury placements, with net interest
margins growing to 4.4%.
Net interest income increased by 39% to US$104.8
million, a 7% improvement over 2014, driven by
lower borrowing costs. Fees, commissions and other
income however declined by 85% mainly due to
one-off revenues of US$46 million recorded in
2014.
Given the difficult economic environment, there was
the need to maintain a tight rein on costs. The
prudent management of operating costs resulted in
year-on-year decline to US$30 million (from US$38
STATEMENT FROM THE CHAIR
11
INFRA
STRU
CTU
RE F
INA
NC
ING
| TH
E A
RT O
F LO
NG
TERM
VIS
ION
AFC / 2015 ANNUAL REPORT & ACCOUNTS
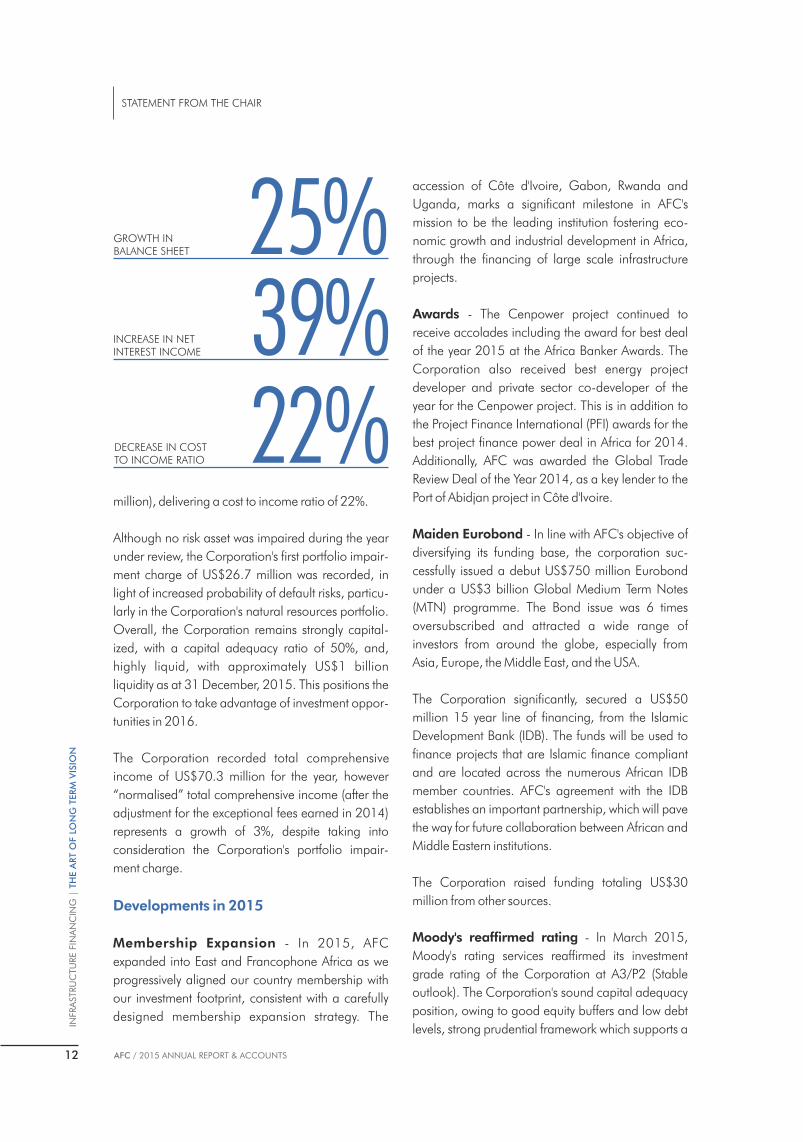
million), delivering a cost to income ratio of 22%.
Although no risk asset was impaired during the year
under review, the Corporation's first portfolio impair-
ment charge of US$26.7 million was recorded, in
light of increased probability of default risks, particu-
larly in the Corporation's natural resources portfolio.
Overall, the Corporation remains strongly capital-
ized, with a capital adequacy ratio of 50%, and,
highly liquid, with approximately US$1 billion
liquidity as at 31 December, 2015. This positions the
Corporation to take advantage of investment oppor-
tunities in 2016.
The Corporation recorded total comprehensive
income of US$70.3 million for the year, however
“normalised” total comprehensive income (after the
adjustment for the exceptional fees earned in 2014)
represents a growth of 3%, despite taking into
consideration the Corporation's portfolio impair-
ment charge.
Developments in 2015
Membership Expansion - In 2015, AFC
expanded into East and Francophone Africa as we
progressively aligned our country membership with
our investment footprint, consistent with a carefully
designed membership expansion strategy. The
accession of Côte d'Ivoire, Gabon, Rwanda and
Uganda, marks a significant milestone in AFC's
mission to be the leading institution fostering eco-
nomic growth and industrial development in Africa,
through the financing of large scale infrastructure
projects.
Awards - The Cenpower project continued to
receive accolades including the award for best deal
of the year 2015 at the Africa Banker Awards. The
Corporation also received best energy project
developer and private sector co-developer of the
year for the Cenpower project. This is in addition to
the Project Finance International (PFI) awards for the
best project finance power deal in Africa for 2014.
Additionally, AFC was awarded the Global Trade
Review Deal of the Year 2014, as a key lender to the
Port of Abidjan project in Côte d'Ivoire.
Maiden Eurobond - In line with AFC's objective of
diversifying its funding base, the corporation suc-
cessfully issued a debut US$750 million Eurobond
under a US$3 billion Global Medium Term Notes
(MTN) programme. The Bond issue was 6 times
oversubscribed and attracted a wide range of
investors from around the globe, especially from
Asia, Europe, the Middle East, and the USA.
The Corporation significantly, secured a US$50
million 15 year line of financing, from the Islamic
Development Bank (IDB). The funds will be used to
finance projects that are Islamic finance compliant
and are located across the numerous African IDB
member countries. AFC's agreement with the IDB
establishes an important partnership, which will pave
the way for future collaboration between African and
Middle Eastern institutions.
The Corporation raised funding totaling US$30
million from other sources.
Moody's reaffirmed rating - In March 2015,
Moody's rating services reaffirmed its investment
grade rating of the Corporation at A3/P2 (Stable
outlook). The Corporation's sound capital adequacy
position, owing to good equity buffers and low debt
levels, strong prudential framework which supports a
25% 39%
GROWTH INBALANCE SHEET
INCREASE IN NETINTEREST INCOME
22% DECREASE IN COST TO INCOME RATIO
12
STATEMENT FROM THE CHAIR
INFRA
STRU
CTU
RE F
INA
NC
ING
| T
HE A
RT O
F L
ON
G T
ERM
VIS
ION
AFC / 2015 ANNUAL REPORT & ACCOUNTS
high degree of liquidity, and, a liquid treasury portfo-
lio with no exposure to structured finance instruments
or derivatives, were cited as the rationale for the
reaffirmation.
Green Climate Fund Accreditation - During the
course of the year, the Corporation was accredited
as a partnering Institution to the Green Climate Fund
(GCF), making AFC the GCF's first African
Development finance institution partner.
The GCF is a unique global initiative in response to
climate change by investing in low-emission and
climate-resilient development on the planet. GCF
was established by 194 governments to limit or
reduce greenhouse gas emissions in developing
countries, and to help adapt vulnerable societies to
the potential impacts of climate change. Given the
urgency and seriousness of the challenge, the Fund
is mandated to make an ambitious contribution to
the united global response to climate change. The
Fund aims to mobilize unprecedented levels of
funding to invest in low-emission and climate-
resilient project across the world.
AFC's full accreditation was announced by GCF in
July, 2015 after an extensive due diligence and
approval by the GCF Board. Accreditation by the
GCF enables AFC to access its committed capital of
US$9.3 billion; a pool of funds for climate change
projects to be utilized by partners for on-lending,
grants, lines of credit, guarantees and other similar
purposes.
People & Organisation
The restructured organisation which was imple-
mented during 2015, introduced a new operating
structure, embedding the development of business
units with 'end-to-end' responsibility, with a view to
positioning the Corporation for a sustained step
change in growth, revenue and profitability.
The management and staff of AFC must be com-
mended for the sustained progress achieved in
managing the corporation's business, effectively and
efficiently since inception. Our competitive advan-
tage continues to be our expertise in innovative
structuring and arranging, financial and technical
advisory and project development. In addition to
this, the competence, commitment and professional-
ism of our employees continues to be critical to the
successful delivery of our business objectives.
Against a backdrop of the lowest attrition rate in the
last 3 years, our workforce size increased to 80 with
sustained diversity and continental representation.
Starting the year with 20% of the approved workforce
positions vacant following the restructuring, the
Corporation recruited top talent in a fiercely compet-
itive talent market, including a selection of C-suite
positions.
Talent and competence reviews were completed,
providing management with deep insights into the
overall quality of its talent pipeline and helping to
focus its people development efforts aimed at
continuously strengthening the Corporation's talent
pipeline and leadership bench-strength.
Corporate Governance
Board and Management Changes:
New Appointments and Retirements - As chair, I
am pleased to report that the Corporation further
enhanced its corporate governance structure and
continued to be governed and managed with
openness and transparency. The Corporation
appointed its first independent director, Mr. Grant
Harris- a US national, on January 1st, 2016, to
further enhance and strengthen the composition of
the Board.
On 31 December, 2015, Messrs Bisi Onasanya and
Jibril Aku retired as Chief Executive Officer of First
Bank of Nigeria and Ecobank Nigeria Limited,
respectively. Mr. Onasanya resigned from the Board,
effective January 1st, 2016 and Mr. Aku, resigned
with effect from February 15, 2016. Mr Lewis Tung,
Group CEO & Managing Director, WEMPCO, also
resigned from the Board on February 22nd, 2016. I
would like to thank all of them for their immense
13
STATEMENT FROM THE CHAIR
INFRA
STRU
CTU
RE F
INA
NC
ING
| TH
E A
RT O
F LO
NG
TERM
VIS
ION
AFC / 2015 ANNUAL REPORT & ACCOUNTS

contributions to the Board and to the Corporation.
To replace the retired Non-Executive Directors, the
Board appointed Dr. Adesola Adeduntan, the Chief
Executive Officer of First Bank of Nigeria, Mr.
Charles Kie, the Managing Director of Ecobank
Nigeria Limited, and Mr. Lawrence Tung, Group
Executive Director, WEMPCO, as representatives for
First Bank Nigeria, Ecobank Nigeria Limited and
WEMPCO, respectively. Their appointments will be
presented for the approval of shareholders at the
General Meeting.
At the management level, Mr. Sanjeev Gupta, joined
the team as the Executive Director Financial services
and Roger Ellender retired from the Corporation as
Chief Risk Officer, following his attainment of the
mandatory retirement age. He was succeeded by
David Johnson as the new Chief Risk Officer. I thank
Roger for his contribution to the Corporation and for
successfully maintaining a track record of no non-
performing loans on the books of the Corporation
since inception. He also laid the foundation for the
establishment and embedding of the AFC's risk
management framework.
I must at this point applaud the management and
staff of AFC for the continuous progress the
Corporation is making by managing the business
efficiently and effectively in a difficult and challeng-
ing year.
Our core differentiating factors are our expertise in
innovative deal structuring and arranging, financial
and technical advisory, and project development.
Allied to this, is the commitment, resilience and
professionalism of our employees which has been
crucial to the successful delivery of our business
objectives.
We remain cautious about the current environment.
AFC will be highly selective and prudent in pursuing
opportunities that align with our value proposition.
We will focus on our sectoral expertise and capabili-
ties to enhance our existing investment portfolio as
well as exploring other niche markets.
Outlook in 2016
The lacklustre outlook for global economic activity
could have a significant bearing on AFC's business in
2016. AFC exists to bridge the deficit in infrastructure
financing across Africa, a downturn in the commod-
ity markets into 2016, adds fresh impetus to create
more diversified economies, which will give rise to
greater demand for investments in Power, Transport
and Heavy industry. We look forward to working with
our member countries and other partners to realise
such investment opportunities.
In holding true to our long term vision and time
horizons for infrastructure development, we will
adhere to our plan to grow our asset base, acceler-
ate our funding, whilst maintaining a prudent liquid-
ity buffer. With the changes at operational level
(management and corporate restructuring) fully
embedded, and, with the continued support from
our stakeholders and development partners, we
remain optimistic that we can accomplish the goals
that have been set for 2016 and the years to come.
Dr. Sarah Alade, OON
Chair, Africa Finance Corporation
AFC will be highly selective and prudent in pursuing opportunities that align with our value proposition. We will focus on our sectoral expertise and capabilities to enhance our existing investment portfolio as well as exploring other niche markets.
14
STATEMENT FROM THE CHAIR
INFRA
STRU
CTU
RE F
INA
NC
ING
| T
HE A
RT O
F L
ON
G T
ERM
VIS
ION
AFC / 2015 ANNUAL REPORT & ACCOUNTS

Principal Activity
Africa Finance Corporation, is a multilateral
development financial institution established by an
agreement amongst Sovereign States. Its principal
activity is the provision of infrastructure finance
through equity participation, debt finance, and
technical, management and financial advisory
services as may be required to obtain funding for
and to develop infrastructure and industrial capacity
across Africa.
Membership
I am pleased to report that 2015 was a successful
year in our membership drive. Four African countries
joined the membership of AFC; Cote d'Ivoire,
Gabon, Rwanda and Uganda. This represents a
40% increase in the number of member countries
and brings the total number of countries who have
either signed or acceded to the AFC Establishment
Agreement to thirteen. There are discussions with
Kenya, Tanzania, Mozambique, Mauritius and
Zambia with the possibility of these countries
acceding to AFC's membership in 2016.
Ghana has made a substantial deposit for its shares
and discussions are also ongoing with Gabon in
respect of their subscription for AFC's shares. Follow
up discussions are being held with some multilateral
development finance institutions in relation to their
interest to subscribe for shares in AFC, namely:
African Development Bank (AfDB), ECOWAS Bank
of Investment and Development (EBID) and East
African Development Bank (EADB). The Corporation
will continue to pursue its membership drive in 2016.
Financial Position
The Corporation's financial statements have been
prepared in accordance with International Financial
Reporting Standards (IFRS) as issued by the
International Accounting Standards Board (IASB).
The financial statements have been prepared under
historical cost convention, except for derivative
financial instruments, available-for-sale financial
assets, and financial liabilities held at fair value
through profit or loss, which have been measured at
fair value. The financial statements are presented in
United States dollars (US$).
The Corporation's consolidated total comprehensive
income for 2015 financial year was US$70.27
million. The details of the results for the year are set
out in the financial statements. The board approved
the financial statements of the Corporation for the
year ended 31 December, 2015 at a meeting of the
board held on 22 February, 2016.
Shareholder Returns
The issued share capital of the Corporation as at
December 31, 2015 remains unchanged
(US$1,089,067,000). The board has recommended
a dividend payout of US3.23 cents per share
(US$35,176,865 in aggregate), as payment to all
shareholders, subject to approval at 2015 Annual
General Meeting.
DIRECTORS' REPORT
The Directors present their report together with the audited consolidated financial statements for the year ended 31 December 2015. The comparative period is for the year ended 31 December 2014.
15
INFRA
STRU
CTU
RE F
INA
NC
ING
| TH
E A
RT O
F LO
NG
TERM
VIS
ION
AFC / 2015 ANNUAL REPORT & ACCOUNTS

Long term Loans
The AFC Board approves the Corporation's total
financing plans for every year. The Board Risk and
Investment Committee approves each individual
borrowing under the Corporation's total financing
plans. During the year, as part of the Corporation's
Board approved Borrowing Programme, the
Corporation's US$3 Billion Global Medium Term
Notes Programme (the “GMTN Programme”) was
established, under which the Corporation's Maiden
US$750 Million Eurobond was successfully
launched and concluded a US$30 million Term Loan
Facility with Oesterreichische Entwicklungsbank AG
(OeEB).
The inaugural 5 year Eurobond yielded 4.595%. The
bond, which was both Regulation S and Rule 144A
compliant, (Reg S and 144A, Regulation S provides
an exclusion from the Section 5 registration require-
ments of the United States Securities Act, 1933, for
offerings made outside the United States by both U.S.
and foreign issuers) attracted investors worldwide,
with Europe, Asia and the US showing the highest
levels of demand. The bond was 6 times oversub-
scribed with orders totaling US$4.6billion from 315
investors, enabling a diversified distribution among
international institutions. The GMTN Programme
and the Eurobond were both assigned an investment
grade A3 (Long-Term) and/P2(Short-term) by
Moody's. The ratings mirrored the international
credit rating of the Corporation.
The successful issuance of AFC's debut Eurobond
put AFC's credit on the radar of global fixed income
investors in 2015. It is not surprising therefore that
since the bond was issued, we received a number of
enquiries from investors seeking exposure to AFC
through privately placed MTNs. Following the
maiden Eurobond issue, AFC successfully issued
four pr ivate placement notes under the
Corporation's GMTN Programme with a total value
of US$104 million. The notes were issued to
investors in Thailand, Qatar, Dubai, and Sweden.
As at 31 December, 2015 borrowings stood at
US$1,646,936,000, a 55% increase of
US$585,343,000 compared to borrowings of
US$1, 061, 593,000 as at 31 December, 2014.
Corporate Governance and Compliance
Corporate governance at AFC is a core and vital
discipline that complements our desire to continually
improve upon the success of the young organization
on behalf of our shareholders. Our approach to
governance is set by the Board. We believe that
effective governance is achieved through leadership
and collaboration, resulting in consistently focused
and sensible business decisions. Management
ensures that corporate governance is effectively
implemented across the whole business, and that all
our employees are aware of and abide by the
Corporation's culture, vision and values, and uphold
the highest standards of service.
In my capacity as Corporate Secretary, I am pleased
to report that the Corporation has continued to
embed and adopt leading corporate governance
principles in our corporate policies, which are
updated annually to reflect changing corporate
requirements and best practice. AFC complies with
international best practices in corporate governance
through engagement with counterparties on the
basis of strong principles of governance and
compliance that provide the framework which
guides its operations.
We have continued to engage with our stakeholders
and to seek independent reviews of our performance
so as to help us identify further opportunities to
improve our business. Our approach for 2016 is to
further engage with stakeholders on a regular basis
in order to build solid relationships that will stand the
test of time.
The Board believes regular and appropriate Board
and Committee evaluation is key to achieving and
improving Board effectiveness. In our bid to continue
to make our business more efficient, the
Corporation's Corporate Governance processes
and systems were assessed. To this end the Board
chose to conduct an externally facilitated evaluation
of its performance. KPMG Professionals was
engaged by the Board on the recommendation of
the Board Nominations and Corporate Governance
Committee. KPMG's report has been considered by
the Board and its recommendations will be key issues
of focus for corporate governance in 2016.
DIRECTOR’S REPORT
16
INFRA
STRU
CTU
RE F
INA
NC
ING
| T
HE A
RT O
F L
ON
G T
ERM
VIS
ION
AFC / 2015 ANNUAL REPORT & ACCOUNTS

Management continues to strive to treat all employ-
ees fairly. To this end, Management supports
employees through organisational changes and
ensuring that appropriate jobs are aligned to
employee skills. Furthermore, we conduct an annual
analysis of learning needs to identify priorities and
ensure that learning plans support our business
strategy. Every employee also has a formal review
twice a year with their manager to review their
performance and at the end of each year, set clear
goals and development plans for the year ahead.
Our team brings together specialist skills and diverse
experience used on investment decisions and to
manage our portfolio on an asset-by-asset basis, to
ensure the achievement of our strategic priorities.
Our corporate culture is grounded in mutual respect
and non-discrimination irrespective of age, disability,
gender, race, nationality, sexual orientation or
educational background. Our aim is to foster a
culture of respect and fairness where individual
success depends solely on ability, behaviour, work
performance, demonstrated potential and perhaps
the most key of all, the ability to work as part of a
team. Whilst our policy remains that selection should
be based on the best person for the role, we
recognise the benefits of gender and nationality
diversity.
In our bid to further strengthen unity amongst staff
and instill the culture of mutual respect and
non–discrimination and align individual objectives
with the Corporation's strategy, town hall meetings
are held regularly with all staff, Knowledge sharing
sessions facilitated by the different divisions, Monthly
Birthday dinners are held to help ensure that
employees have an avenue to raise concerns directly
with Senior management and periodically
Newsletters are issued to all staff to keep them
abreast of the Corporation's activities.
In accordance with international best practices, the
Corporation continues to subscribe to the KPMG
Ethics Line to provide a forum to report incidents of
misconduct, in a confidential and anonymous
manner.
We have identified our significant role in ensuring
that we help protect our continent, Africa, from
environmental practices that continually adversely
impacts our continent. To this end, in 2015, AFC
achieved Green Climate Fund (GCF) accreditation,
as the first international financial institution on the
Continent to be so accredited. This means that funds
can now be channelled to Africa through AFC as an
implementing agency. We believe that with our
partnership, AFC together with GCF will unlock and
facilitate critical financing for an array of climate
change projects, especially for mass transit solutions
including urban rail, water transport and roads –
projects historically deemed too difficult, too
expensive or not bankable.
In the Corporation's drive to entrench good corpo-
rate governance and strengthen the Corporation's
risk management framework, the Corporation
implemented a Governance and Risk Compliance IT
solution (“SAP GRC”) platform, during the year. The
GRC platform helps the Board and Management
efficiently put policies and controls in place to
address all its compliance obligations while at the
same time gathering information that helps
proactively run the business of the Corporation.
During 2015, the Corporation's Internal Audit
Charter was reviewed to ensure compliance with
Standard 1000 of the International Standards for the
Professional Practice of Internal Auditing.
Furthermore, the Board through the Audit and
Compliance Committee engaged the services of
Akintola Williams Deloitte to independently assess
our internal audit and compliance systems.
Board of Directors
The AFC Charter defines the roles of the Board of
Directors, Management, and Shareholders includ-
ing the protection of minority interests. There are
standard written rules for the internal operation of the
Boards of Directors and the Board Sub-Committees,
a code of conduct on business ethics for staff, all of
which are aimed at ensuring transparency and
accountability.
The Board is accountable for managing the
Corporation on behalf of its shareholders and each
Director acts in a way which promotes the long term
success of the organisation for the benefit of the
17
DIRECTOR’S REPORT
INFRA
STRU
CTU
RE F
INA
NC
ING
| TH
E A
RT O
F LO
NG
TERM
VIS
ION
AFC / 2015 ANNUAL REPORT & ACCOUNTS

Corporation's shareholders as a whole. The Board
ensures that an appropriate balance between
promoting long term growth and delivering short
term objectives is achieved.
The Corporation's Board meets at least once every
quarter or as the business of the Corporation may
require. Some of the Board Committees meet on a
more regular basis depending upon the exigencies
of the business. The Board provides entrepreneurial
leadership of the organisation within a framework of
prudent and effective controls for risk assessment
and management. The Board is primarily responsi-
ble for: determining strategic direction and demon-
strating leadership; focusing on matters that
consistently add value for shareholders; the gover-
nance and stewardship of the AFC to provide
protection and security for the shareholders' assets;
the management of the Corporation's employees;
and ensuring that its obligations to shareholders and
other stakeholders are understood and met; and
determining the nature and extent of the significant
risks the Corporation is willing to take to achieve its
strategic objectives.
The Board has a schedule of matters reserved for
their approval and all other items are delegated to
Board Committees and Executive Management
under the leadership of the Chief Executive Officer.
The Chairperson of each Board Committee and the
Chief Executive Officer presents a report of their
activities at each Board meeting for approval of
decisions, as appropriate, reached at the Committee
and Management levels.
Board Composition
The AFC Board of Directors consist of institutional
investors represented by individuals with, amongst
other criteria, have a proven expertise in business
management and economic development, with a
successful track record in the AFC investment
sectors; a strong reputation in the business commu-
nity; experience in investment banking, infrastructure
finance, accounting, and or law; possess a high level
of integrity, professional and personal ethics and
values consistent with the AFC corporate culture.
As part of AFC's Board succession process, two
Board members: Mr. Bisi Onasanya and Mr. Jibril
Aku retired from the Board of Directors. Following
their retirement, the Board on the recommendation
of the Board Nominations and Corporate
Governance Committee (“BNGC”) elected Dr.
Adesola Adeduntan and Mr. Charles Kie as Non-
Executive Directors of the Corporation. Dr. Adesola
Adeduntan, who was the former CFO of AFC, is the
Group Managing Director of First Bank Nigeria
Limited and Mr. Charles Kie is the Managing
Director and Chief Executive Officer of Ecobank
Nigeria Limited. The Board, upon the recommenda-
tion of the BNGC also approved the following
renewals and appointments: the terms of Mr. Emeka
Emuwa as Non-Executive Director and Dr. Adesegun
Akin-Olugbade as Executive Director were renewed.
Mr. Sanjeev Gupta was appointed as a new
Executive Director of the Corporation.
In accordance with the provisions of the AFC
Charter, I am pleased to report that the AFC Board
on the recommendation of the BNGC has
appointed its first independent Director, Mr. Grant
Harris with effect from January 1, 2016. In making
their recommendation to appoint the first independ-
ent director, the BNGC reviewed a list of persons with
requisite experience, business acumen and knowl-
edge of Africa.
The BNGC has continued to assess appointment of
candidates in accordance with the Board's
Corporate Guidelines framework on succession
planning for Directors and Executives.
Board Induction
Upon appointment, non-executive directors
undertake a tailored induction programme. The
induction is designed to meet each individual non-
executive director's skills and needs and to introduce
them to, and familiarise them with, the principal
activities of the Corporation. This includes one to
one meetings with the Chief Executive Officer and
Executive Director and General Counsel of the
Corporation. The induction covers the legal structure
of AFC, the terms of reference of board committees
and specifically the committees on which the director
sits.
I am pleased to report that in line with leading
corporate governance best practices, we have in
place for 2016, a more robust Board induction
18
DIRECTOR’S REPORT
INFRA
STRU
CTU
RE F
INA
NC
ING
| T
HE A
RT O
F L
ON
G T
ERM
VIS
ION
AFC / 2015 ANNUAL REPORT & ACCOUNTS

programme facilitated by Division Heads and
Management.
Update on the Activities of the Board Audit &
Compliance Committee (BACC)
The BACC continued to monitor the integrity of the
financial statements of the Corporation including
management reports and compliance with account-
ing standards. During the year, the Committee
reviewed and approved: the Corporation's Three
Year Rolling Plan, 2016 Operating Budget, the
Model Financial Statements to ensure compliance
with the 2015 Disclosure Checklist in conjunction
with the External Auditors, reviewed policies on the
Corporation's financial performance, and monitored
the utilization of the 2015 budget. The Committee
monitored the Corporation and Business Units'
financial performance. The Audit and Compliance
Committee met with the External Auditors and
Management in joint sessions to review the Audited
Financial Statements. The BACC engaged the
services of an External Consultant, Akintola Williams
Deloitte to conduct an independent Quality
Assessment of the Internal Audit function. BACC also
reviewed, approved and monitored the implementa-
tion of the approved annual audit plan as proposed
by the Head of Internal Audit. The Audit Committee
reviewed and approved the Corporation's Expense
Management Policy and Procurement Guidelines.
The BACC conducted a review of the effectiveness of
the system of internal controls and risk management
during the year and monitored the Corporation's
compliance with systems through the Chief
Compliance Officer's Compliance Dashboard and
Report. The Committee reviewed and updated the
Internal Audit Charter in compliance with the
requirement of “The International Standards for the
Professional Practice of Internal Auditing”, issued by
the Institute of Internal Auditors. A specific area of
underlying oversight for the BACC throughout 2015
has been to provide the Board, Shareholders and
stakeholders with Annual Financial Statements that
presents an accurate position of the performance of
the Corporation. The Committee was made up of six
members and met four times in the year.
Update on the Activities of the Board Risk &
Investment Committee (BRIC)
The slowdown in most African economies and
heightened risk profile in the region created a
number of complexities for the Corporation. Under
the guidance of the BRIC, the focus for most part of
the year was to ensure limited deterioration in asset
quality of the existing portfolio while seeking to grow
new assets on a more selective basis. While
Management and BRIC were successful in ensuring
that no specific asset was non-performing in 2015
(albeit with required portfolio provisions), the pace of
asset growth with respect to new projects slowed
down.
In 2015, the BRIC reviewed and approved AFC's
borrowing decisions within the 2015 Financing Plan
approved by the Board of Directors. The BRIC also
reviewed and approved the Corporation's invest-
ment decisions of circa US$700 million and
approved the revisions to the Corporation's Policies
on: Credit Risk Management, Market Risk
Management, Operational Risk Management,
Environmental and Social Risk Management, Asset
and Liability Management, and Anti-Money
Laundering, Combating Financing of Terrorism and
Anti Bribery and Anti-Corruption, Country Limits,
Liquidity Management Framework, the 2015
Liquidity Plan and the Environmental & Social Risk
Management Policy. In addition, the BRIC held
special sessions to assess, monitor and approve the
restructuring, as appropriate, of the Corporation's
Oil and Gas Portfolio. The BRIC monitored the
Corporation's financial performance through
periodic reports from the Chief Executive Officer and
the Chief Financial Officer. The Committee assessed
and through a rigorous interview session selected a
new Chief Risk Officer. The Committee was made up
of seven members and met six times all through the
year 2015.
Update on the Activities of the Board
Nomination & Corporate Governance
Committee (BNGC)
The BNGC in 2015 reviewed and approved several
policies on: People Management issues / matters,
succession planning, appointments for executive,
independent and non – executive directors, new
Headquarters Building project, Annual Board
19
DIRECTOR’S REPORT
INFRA
STRU
CTU
RE F
INA
NC
ING
| TH
E A
RT O
F LO
NG
TERM
VIS
ION
AFC / 2015 ANNUAL REPORT & ACCOUNTS

Evaluation, and the Delegation of Approval
Authority Limits for Debt and Equity Investments.
During the year, the BNGC met four times.
Board Balance of skills
The Board through its nomination and governance
committee evaluated the balance of skills, knowl-
edge, experience and diversity on the Board.
Collectively, the Board has an appropriate balance
of skills, experience, independence, knowledge and
diversity to enable it discharge its duties and
responsibilities effectively. It is expected that with the
recent appointments to the Board, the AFC Board
will be infused with an increased level of skills and
experience, knowledge and diversity. All Directors
have access to the advice and services of the
General Counsel, the Chief Risk Officer and Head of
Internal Auditor and the external auditors, who are
currently PricewaterhouseCoopers. There is an
agreed process by which Directors may seek
independent profess ional advice at the
Corporation's expense in the furtherance of their
duties.
Responsibilities of Directors
The Board of Directors is responsible for the
preparation of the financial statements, which give a
true and fair view of the state of affairs of the
Corporation at the end of the financial period and of
the results for that period. These responsibilities
include: - the institution of adequate internal control
procedures to safeguard assets, prevent and detect
fraud or other irregularities; maintenance of proper
accounting records; adherence to applicable
accounting standards; relevant accounting policies
used and consistently applied; and the financial
statements are prepared on a going concern basis.
The Directors consider that the Annual Report and
accounts, taken as a whole, is fair, balanced and
understandable and provides the information
necessary for shareholders to assess the
Corporation's financial performance, business model
and strategy.
Independence
The Board considers all of its Non-Executive
Directors to be independent in character and
judgment and free from any business or other
relationship which could materially interfere with the
exercise of their judgment.
Independent External Auditors
PricewaterhouseCoopers, Lagos Nigeria, has
indicated its willingness to continue in office as the
Corporation's external auditors. A resolution will be
presented at the 2016 AGM to approve their re-
appointment and authorise the Directors to deter-
mine their remuneration.
Annual General Meeting
Pursuant to the provisions of the AFC Charter, an
Annual General Meeting will be held in April 2016.
A copy of the Notice is available on our website.
Dr. Adesegun Akin-Olugbade,
Executive Director and Corporate Secretary
20
DIRECTOR’S REPORT
INFRA
STRU
CTU
RE F
INA
NC
ING
| T
HE A
RT O
F L
ON
G T
ERM
VIS
ION
AFC / 2015 ANNUAL REPORT & ACCOUNTS
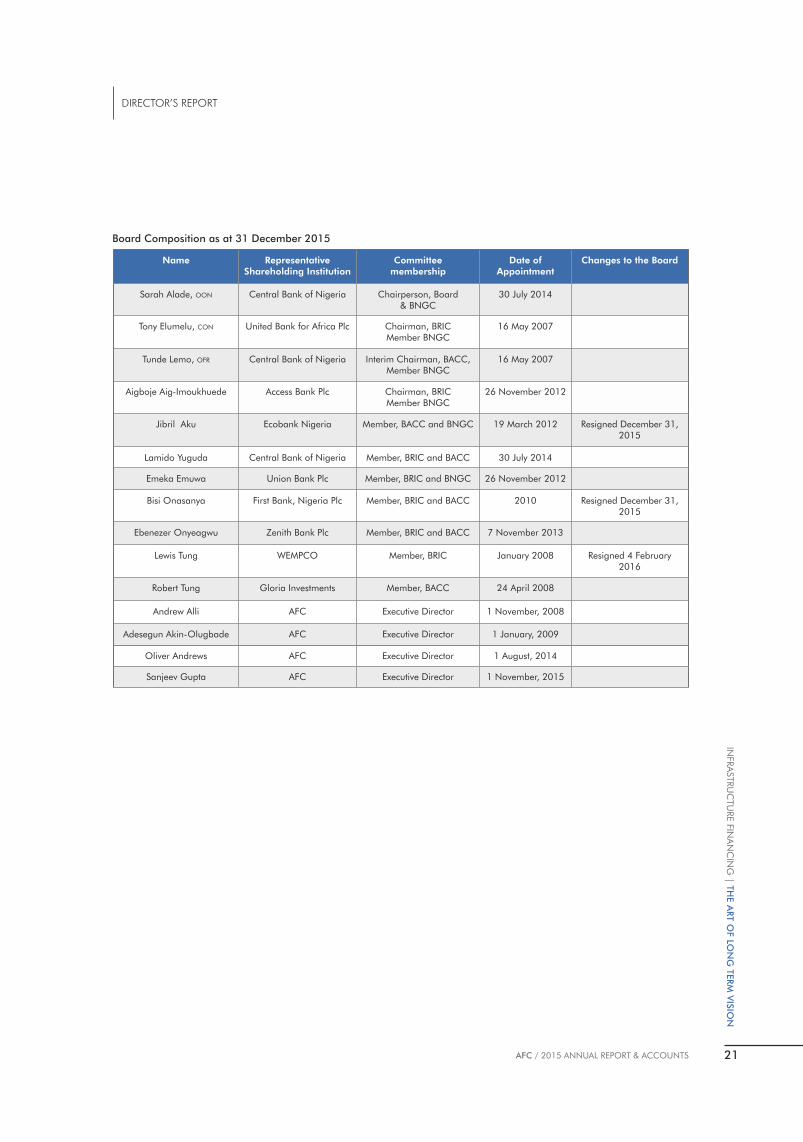
Name Representative Shareholding Institution
Committeemembership
Date ofAppointment
Changes to the Board
Sarah Alade, OON Central Bank of Nigeria Chairperson, Board& BNGC
30 July 2014
Tony Elumelu, CON United Bank for Africa Plc Chairman, BRICMember BNGC
16 May 2007
Tunde Lemo, OFR Central Bank of Nigeria Interim Chairman, BACC,Member BNGC
16 May 2007
Aigboje Aig-Imoukhuede Access Bank Plc Chairman, BRICMember BNGC
26 November 2012
Jibril Aku Ecobank Nigeria Member, BACC and BNGC 19 March 2012 Resigned December 31, 2015
Lamido Yuguda Central Bank of Nigeria Member, BRIC and BACC 30 July 2014
Emeka Emuwa Union Bank Plc Member, BRIC and BNGC 26 November 2012
Bisi Onasanya First Bank, Nigeria Plc Member, BRIC and BACC 2010 Resigned December 31, 2015
Ebenezer Onyeagwu Zenith Bank Plc Member, BRIC and BACC 7 November 2013
Lewis Tung WEMPCO Member, BRIC January 2008 Resigned 4 February 2016
Robert Tung Gloria Investments Member, BACC 24 April 2008
Andrew Alli AFC Executive Director 1 November, 2008
Adesegun Akin-Olugbade AFC Executive Director 1 January, 2009
Oliver Andrews AFC Executive Director 1 August, 2014
Sanjeev Gupta AFC Executive Director 1 November, 2015
21
DIRECTOR’S REPORT
Board Composition as at 31 December 2015
INFRA
STRU
CTU
RE F
INA
NC
ING
| TH
E A
RT O
F LO
NG
TERM
VIS
ION
AFC / 2015 ANNUAL REPORT & ACCOUNTS

Board of Directors
The Board is committed to developing and applying the highest
standards of corporate governance both in the management of
its business and in its accountability to shareholders.
LEADERSHIP AND GOVERNANCE
Mr. Emeka Emuwa,Group Managing Director,Union Bank of Nigeria PlcRepresenting Union Bank of Nigeria Plc
Mr. Sanjeev GuptaExecutive Director Financial Services
Dr. Sola Adedutan,Group Managing Director,First Bank of Nigeria LimitedRepresenting First Bank of Nigeria Limited
Mr. Lamido Yuguda,Director, Reserve Management DepartmentCentral Bank of NigeriaRepresenting Central Bank of Nigeria
Dr. Adesegun A. Akin-Olugbade, OONExecutive Director & General Counsel
Mr. Aigboje Aig-Imoukhuede, CONChairman, WAPIC Insurance PlcRepresenting Access Bank Plc
Mr. Ebenezer Onyeagwu,Executive Director Zenith Bank PlcRepresenting Zenith Bank Plc
Mr. Lewis Tung,Managing Director & CEO WEMPCO GroupRepresenting WEMPCO Group
Mr. Grant HarrisManaging Director, Harris Africa,Independent Non-Executive Director
Seated (L-R):
Mr. Tunde Lemo, OFRChairman, Lambeth Trust and Investment Company LimitedRepresenting Central Bank of Nigeria
Mr. Andrew Alli,President & Chief Executive Officer
Dr. Sarah Alade, OONDeputy Governor, Central Bank of NigeriaChair, AFC Board
Mr. Tony Elumelu, CONChairman, Heirs HoldingsRepresenting United Bank for Africa Plc
Missing from Photograph:
Mr. Charles Kie,Managing Director,Ecobank Nigeria LimitedRepresenting Ecobank Nigeria Limited
Mr. Robert Tung, Director Gloria Investments LimitedRepresenting Gloria Investments Ltd
Mr. Oliver AndrewsExecutive Director & Chief Investment Officer
Standing (L-R):
22
INFRA
STRU
CTU
RE F
INA
NC
ING
| T
HE A
RT O
F L
ON
G T
ERM
VIS
ION
AFC / 2015 ANNUAL REPORT & ACCOUNTS
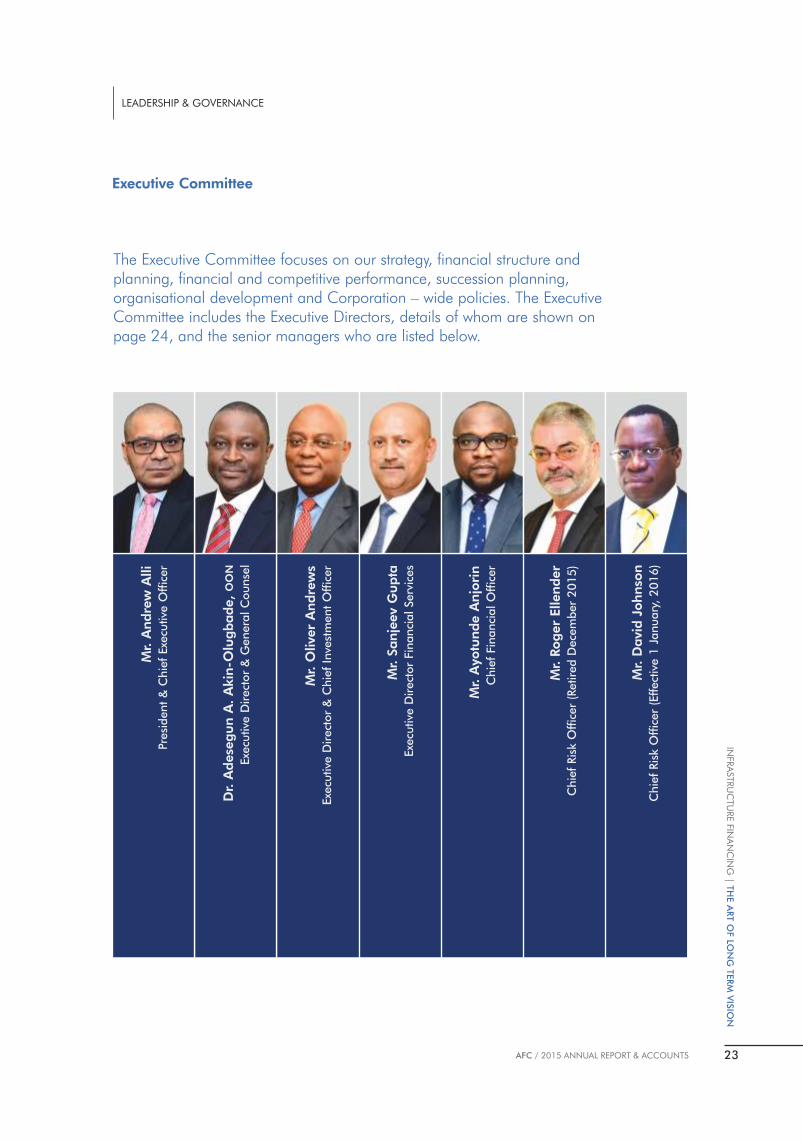
Executive Committee
The Executive Committee focuses on our strategy, financial structure and planning, financial and competitive performance, succession planning, organisational development and Corporation – wide policies. The Executive Committee includes the Executive Directors, details of whom are shown on page 24, and the senior managers who are listed below.
LEADERSHIP & GOVERNANCE
Mr. A
ndre
w A
lli
Presi
dent
& C
hie
f Exe
cutive
Of
cer
Dr. A
dese
gun
A.
Akin
-Olu
gbade,
OO
N
Exe
cutive
Direct
or
& G
enera
l C
ounse
l
Mr. O
live
r A
ndre
ws
Exe
cutive
Direct
or
& C
hie
f In
vest
ment
Of
cer
Mr. S
anje
ev G
upta
Exe
cutive
Direct
or
Fin
anci
al Serv
ices
Mr. A
yotu
nde A
njo
rin
Chie
f Fin
anci
al O
fce
r
Mr. R
oger
Ellender
Chie
f Ris
k O
fce
r (R
etire
d D
ece
mber
2015)
Mr. D
avi
d J
ohnso
nC
hie
f Ris
k O
fce
r (E
ffect
ive 1
January
, 2016)
23
INFRA
STRU
CTU
RE F
INA
NC
ING
| TH
E A
RT O
F LO
NG
TERM
VIS
ION
AFC / 2015 ANNUAL REPORT & ACCOUNTS
The following is a summary of the business experience and principal outside business interests of the Board of Directors and Executive Management.
Sarah Alade is the non-Executive Chair of Africa
Finance Corporation and a Deputy Governor of the
Central Bank of Nigeria (CBN) on Economic Policy.
Prior to her current position, she served as the Acting
CBN Governor between February and June, 2014. She
joined the CBN in 1993 as an Assistant Director in the
Research Department where she served as Head, State
Government Finance Office, and thereafter Head,
Federal Government Finance Office and Head, Fiscal
Analysis Division. She was appointed Director Banking
Operations Department in May 2004.
Prior to becoming a regulator, Dr Alade was a Lecturer
at the University of Ilorin in the Department of
Accounting and Finance. She is a Fellow of the Nigerian
Institute of Operational Research. She holds a Bachelor
of Science in Economics from the University of Ife,
Nigeria, a Masters in Communication from the
University of Melbourne, Australia and a Ph. D in
Management Sciences (Operations Research) from
University of Ife, Nigeria.
Tunde Lemo is the Chairman of the Board Audit and
Compliance Committee and a non-executive director
of the Corporation. He is a fellow of the Institute of
Chartered Accountants of Nigeria and the Chartered
Institute of Bankers with significant leadership and top
management experience in both the public and private
sector spanning over 27 years. He holds a Bachelor of
Science in Accountancy (first class division) from the
University of Nigeria, Nsukka.
Mr Lemo retired in 2014 as Deputy Governor in charge
of Operations, at the Central Bank of Nigeria, in which
he formulated the industry – wide shared services
initiative towards achieving efficient banking services
for the Nigerian banking industry and greater dissemi-
nation of banking services. Prior to his appointment as
Deputy Governor, he was a Managing Director and
Chief Executive Officer of Wema Bank Plc.
Tony Elumelu is the Chairman of the Board Risk and
Investment Committee and a non-executive director of
the Corporation. He is the Chairman of United Bank for
Africa and Heirs Holdings Limited, an African propri-
etary investment company investing in in strategic
sectors of Africa's economy. He is the founder of the
Tony Elumelu Foundation, an Africa-based and African-
funded, philanthropic organisation dedicated to the
promotion of excellence in business leadership and
entrepreneurship, to enhance the competitiveness of
the private sector across Africa.
He was formerly the Chief Executive Officer of United
Bank for Africa Plc and was responsible for transform-
ing the bank from a single currency bank to a Pan –
African institution serving over 7 million customers in 20
African counties and operating in three continents.
He earned a Bachelor of Science degree in Economics
from Bendel State University, Nigeria and Master of
Science in Economics from the University of Lagos,
Nigeria.
Aigboje Aig-Imoukhuede is the President of the
Nigerian Stock Exchange and non – executive director
of the Corporation. Aigboje is the Chairman of WAPIC
Insurance Plc, a Nigeria-based company engaged in
offering insurance covers for over half a century,
offering a comprehensive range of insurance coverage.
The Company has built a strong franchise in the largest
economies in Sub-Saharan Africa.
Aigboje was formerly the Group Managing Director
and Chief Executive Officer of Access Bank Plc. His
visionary leadership inspired Access Bank's rapid and
unprecedented growth which has seen the Bank ranked
amongst the top four African banks. He holds a
Bachelor of Laws from the University of Benin, Nigeria
and a Barrister-at-law diploma from the Nigeria Law
School. He is also a Fellow of the Chartered Institute of
Bankers.
Jibril Aku was the Managing Director of Ecobank
Nigeria Limited and a non – executive director of the
Corporation. Jibril is a former President of the Money
Market Association of Nigeria (MMAN) and serves as
Chairman of the NIBOR Committee of the Association.
Leadership Profile
24
LEADERSHIP & GOVERNANCE
INFRA
STRU
CTU
RE F
INA
NC
ING
| T
HE A
RT O
F L
ON
G T
ERM
VIS
ION
AFC / 2015 ANNUAL REPORT & ACCOUNTS

Prior to joining Ecobank in 2006, he worked for Nigeria
International Bank Limited (Citibank) and later with
Afribank Nigeria Plc as Executive Director in charge of
Operations & Information Technology.
Jibril has over 30 years banking experience with 20
years spent in senior management. He has served two
terms as Director of Nigeria Inter-bank Settlement
Systems (NIBSS) and various subsidiaries of Afribank
Group. Jibril was Executive Director responsible for
Ecobank's Treasury & Financial Institutions Group
amongst others from April 2006 to March 2010. He
holds both Bachelors and Masters Degrees in Business
Administration.
Emeka Emuwa is the Group Managing Director and
Chief Executive Officer of Union Bank Nigeria Plc and a
non – executive director of the Corporation. Emeka
joined Union Bank Nigeria Plc, after 25 years with
Citigroup having served as Chief Executive Officer and
Managing Director of Citibank Nigeria Limited from
2005 - 2012. He began his banking career in 1986 as
Management Associate with Citibank Nigeria Limited.
Emeka served as Country Officer / Country Head in
Cameroon, where he was responsible for the regional
banks Central African businesses in Gabon and
Congo.
He is a graduate of Finance from the University of
Lagos, Nigeria and holds a Master of Science in
Management from Purdue University's Krannert School
of Management, Indiana, United States.
Bisi Onasanya, was the Managing Director and Chief
Executive Officer of First Bank Nigeria Limited and a
non – executive director of the Corporation. Prior to
joining the Board of First Bank Nigeria Limited, He was
the Managing Director / Chief Executive Officer of First
Pension Custodian Nigeria Limited, a wholly owned
subsidiary of FBN Holdings. Bisi started his banking
career at Wema Bank Plc in 1985.
Bisi holds an HND Upper Credit in Accountancy from
Lagos State College of Science and Technology. He is
also a Fellow of the Institute of Chartered Accountants
of Nigeria and an Associate Member of the Nigeria
Institute of Taxation. He is a director of FBN Bank (UK)
Limited and FBN Insurance Brokers Limited.
Ebenezer Onyeagwu is currently a Fellow of the
Institute of Chartered Accountants of Nigeria and an
Alumnus of the University of Pennsylvania, United States
(Wharton Executive Education), Columbia Business
School, Columbia and Harvard Business School.
Mr Onyeagwu has over twenty-two years banking
industry experience. He worked as Credit Analyst in the
defunct Financial Merchant Bank Limited and later
joined Citizens International Bank Limited where he
held several management positions. He joined Zenith
Bank PIc in 2002 as a Senior Manager in the Internal
Control and Audit Group of the bank and has served in
various capacities as Assistant General Manager, in
charge of coordination of strategies for Business
Development and Relationship Management. He is
currently an Executive Director at Zenith Bank Group.
Lewis Tung is the Managing Director and Chief
Executive Officer of WEMPCO Group and a non –
executive director of AFC. Lewis studied Business
Administration at the University of Hawaii, USA and has
over 30 years work experience in Nigeria.
WEMPCO Group is one of the largest manufacturing
groups operating in Nigeria. Products manufactured by
the Group include roofing sheets, galvanised pipes,
wire nails, plywood, ceramic tiles and sanitary ware.
The Group is additionally actively involved in activities
in the agriculture and hospitality sectors.
Robert Tung is a Director at Gloria Investments
Limited and a Senior Executive of WEMPCO Group. He
has a degree in Business Administration from Hong
Kong, and has worked with the Group for over 41
years. He is a Non-Executive Director of AFC.
Lamido Yuguda was appointed as a non-executive
director of the Corporation in July 2014. He is currently
the Director, Reserve Management Department of the
Central Bank of Nigeria (CBN), where he provides
leadership and strategic direction for the external
reserve management functions in addition to managing
the relationship between CBN and its international
correspondent banks and investment managers.
Lamido started his banking career as Senior Supervisor,
Foreign Operations Department in 1984 and has held
several positions at the CBN. Lamido was the Secretary
of the Bank's Investment Committee. He had also
served as an Economist in the African Department of
the International Monetary Fund (IMF), Washington,
DC, USA, between November 1997 and November
2001.
25
LEADERSHIP & GOVERNANCE
INFRA
STRU
CTU
RE F
INA
NC
ING
| TH
E A
RT O
F LO
NG
TERM
VIS
ION
AFC / 2015 ANNUAL REPORT & ACCOUNTS
He holds a Bachelor of Science in Accounting from
Ahmadu Bello University, Zaria and a Master of Science
in Money, Banking and Finance from the University of
Birmingham, United Kingdom. He also holds a
certificate in Financial Asset Management and
Engineering from the Swiss Finance Institute, Geneva
Switzerland. Lamido is a Fellow of the Institute of
Chartered Accountants of Nigeria, and a Chartered
Financial Analyst.
Andrew Alli, President & Chief Executive Ofcer
Andrew joined AFC in 2008 and is the President and
Chief Executive Officer of the Corporation. Until his
appointment, he was a partner at Travant Capital
having previously served in the International Finance
Corporation (“IFC”) as Country Head for Southern
Africa. He joined IFC in 1996 and held various
positions in Washington D.C. before being appointed
Country Manager for Nigeria in 2002. Mr. Alli holds a
Bsc in Electrical Engineering from Kings College,
University of London, an MBA from INSEAD, France
and qualified as a Chartered Accountant with Coopers
& Lybrand (PricewaterhouseCoopers) in the U.K.
Adesegun Akin-Olugbade (OON),
Executive Director & Chief Operating Ofcer
Adesegun is an Executive Director and the Chief
Operating Officer. He is also the General Counsel and
Corporate Secretary of AFC. His oversight functions
include Corporate Governance, Legal, Information
Technology, Administration, Corporate Commu-
nications and Country Membership. A former General
Counsel and Director at the African Development Bank
and a graduate of Harvard Law School, Dr. Akin-
Olugbade has 30 years of experience in legal/financial
sectors having worked at both technical and manage-
ment levels, in the public and private sector, leading
corporate and commercial law firms and international
financial institutions. Dr. Akin-Olugbade was the
pioneer Chief Legal Officer and Head of the Legal
Services Department of the African Export-Import Bank
(Afreximbank). He was appointed to the Board of
Directors of Ecobank Transnational Inc. (ETI) as a Non-
Executive Director in June 2014. He is an alumnus of
the IMD Executive Management Programme.
Oliver Andrews,
Executive Director & Chief Investment Ofcer
Oliver is an Executive Director and the Chief Investment
Officer. His oversight functions include end to end
origination and execution of transactions for AFC. An
entrepreneurial engineer and transport economist with
extensive background in engineering, transport and
project finance, Oliver has over 30 years experience in
the infrastructure sector as an infrastructure project
developer, financier and strategic adviser. He has
successfully directed numerous infrastructure deals in
Africa leading project development teams providing
strategic, policy, program and commercial advice
on infrastructure development issues to development
financial institutions, international blue chip corpora-
tions, and Governments both in Africa and Europe.
Oliver is a former CEO of TCI Infrastructure Limited
(TCII) and the Gambia Ports Authority. He holds an
MBA from the University of Wales, and is an Electrical
and Electronic Engineer, a Chartered Marketer and
also a fellow of the Chartered Institute of Transport and
Logistics.
Sanjeev Gupta,
Executive Director, Financial Services
Sanjeev was recently appointed Executive Director,
Financial Services. He is responsible for Treasury,
Syndication and Advisory lines of business for AFC.
Sanjeev has over 25 years' experience in Investment
Management, Private Equity and Corporate Advisory
Services and his forte has been to blend together
divergent corporates, investors and governments to
develop sustainable business and development
models. Prior to joining AFC, he was the Managing
Partner in charge of Emerging Markets M&A at Ernst
Young Transaction Advisory Services. Sanjeev was also
the Chief Executive Officer of Sanlam Investment
Management, responsible for Emerging Markets as
well as Founder and Managing Partner of Emerging
Opportunity Consulting. He has a bachelor's degree
from the University of Calcutta, India and is also an
alumnus of the Said Business School, University of
Oxford, England. He is a fellow of the institute of
chartered accountants of India (FCA), and a member of
the Institute of Investment Analysts of South Africa.
Ayotunde Anjorin,
Director & Chief Financial Ofcer
Ayotunde is a Director and the Chief Financial Officer.
Prior to this, he was AFC's Senior Vice President and
Head of Finance & Operations with strategic leadership
responsibilities for all finance related activities compris-
ing banking operations, financial reporting and control,
product control, and settlement. Ayotunde had joined
the Corporation as the Vice President and Financial
Controller in 2011. Before joining AFC, Ayotunde
26
LEADERSHIP & GOVERNANCE
INFRA
STRU
CTU
RE F
INA
NC
ING
| T
HE A
RT O
F L
ON
G T
ERM
VIS
ION
AFC / 2015 ANNUAL REPORT & ACCOUNTS

worked at Standard Chartered Bank Nigeria, where he
held a number of positions within the Finance group
and Internal Audit at national and regional levels. He
was the regional Head of Wholesale Banking Finance
at Standard Chartered Bank responsible for managing
wholesale banking finance activities across West Africa.
He has also worked as a consultant for KPMG.
Ayotunde is a chartered accountant with more than 15
years post qualification experience encompassing
financial accounting, reporting and control, manage-
ment accounting, financial risk management, process
re-engineering and reviews. He holds a Bachelor of
Science degree in Accounting from Obafemi Awolowo
University, Ile-Ife.
David Johnson,
Senior Vice President and Chief Risk Ofcer
David Johnson is the Senior Vice President and Chief
Risk Officer. Before assuming this role, he was Vice
President responsible for Market Risk Management
overseeing capital preservation, liquidity management,
good corporate governance and ensuring risk limits
are consistent with Board specified risk appetite and the
Corporation's risk capacity. Prior to AFC, David spent
fifteen years working as a Risk Manager, Trader and
Structurer at various international banks in London. His
career in the City of London included, most recently,
Rabobank and WestLB AG. At Rabobank (the only bank
in the world without government shareholding that
achieved a AAA credit rating from the three interna-
tional rating agencies) he was a Fund Derivatives Trader
within a team of three traders managing a EUR 3bn
portfolio. At WestLB, he was a Structured Credit and
Fund Derivatives Trader managing a portfolio of EUR
1bn. David's academic background spans Mechanical
Engineering, Computing, Mathematical Trading and
Finance.
27
LEADERSHIP & GOVERNANCE
INFRA
STRU
CTU
RE F
INA
NC
ING
| TH
E A
RT O
F LO
NG
TERM
VIS
ION
AFC / 2015 ANNUAL REPORT & ACCOUNTS
NATURAL RESOURCES
2015 was characterised by a decline in oil prices
from an average of US$96.3 per barrel in 2014 to
US$51.2 per barrel in 2015. Similarly, the mining
sector continued to experience a downturn with
general pricing indicators declining for the fifth year
in succession. Oil prices remained under pressure
owing to a supply glut; a situation which saw prices
plummet by approximately 50% during the year, as
China's demand for raw material imports decreased
and the Chinese economy rebalanced away from
manufacturing to services. The decline in Chinese
and broader emerging market demand, tepid
economic expansion in Europe and recovery in the
USA, has negatively impacted commodity dependent
economies in Africa.
With Africa accounting for approximately 11% of
global oil production and 18% of the continent
generating more than 10% of its GDP from mining
activities, the downturn in the natural resources sector
has had a mixed impact across the continent,
particularly as it relates to importer dependent versus
export-dependent economies. Nevertheless, while
THE ART OFLONG TERMVISION2015 BUSINESS REVIEW
FC has a mandate to accelerate Africa's economic growth and
Aindustrial development through the financing and development of infrastructure on the continent. Our portfolio therefore is directly aligned to the sectors we believe are most critical to
Africa's long term growth: power, natural resources, transportation, heavy industry and telecommunications.
28
INFRA
STRU
CTU
RE F
INA
NC
ING
| T
HE A
RT O
F L
ON
G T
ERM
VIS
ION
AFC / 2015 ANNUAL REPORT & ACCOUNTS

recognising the cyclical nature of the sector, AFC
continues to be optimistic and takes a long-term
investment view. The current downturn whilst
challenging, also presents significant opportunities. A
commodity downturn usually adds fresh impetus to
create a more diversified economy, and development
of higher value domestic industries which will result in
increased investments in power, transport and heavy
industry. It also allows import dependent African
economies to earnestly focus and implement
economic diversification strategies.
AFC believes there are 3 key themes that will guide
the sector through the downturn:
1. Operational Strategy Realignment
Survival in the downturn will be determined by the
ability to realign costs to current realities, driving
efficiencies and maintaining financial resilience for
long term growth. Nimble, cash rich and cost efficient
stakeholders will fare better than others; there will be
continuous reviews of financing strategies, cost
reduction programs, capital structure and balance
sheet optimization strategies, with a focus on
improved access to capital.
2. Mergers and Acquisitions
Lower valuations have created an opportunity for
consolidation and acquisition of high quality assets.
We anticipate distressed asset sales, consolidation
plays and restructuring as a result of high gearing
and limited access to the capital markets.
3. Development of the Domestic Industry
Current market realities have highlighted the over
reliance of African economies on oil and mining and
the need for domestic value addition.
Oil and GasThe current challenges in the oil and gas sector have
been largely been driven by an unprecedented
change in global demand and supply dynamics.
Data from The Organization of Petroleum Exporting
Countries (OPEC) inventories of advanced
economies were more than 210 million barrels
above the 5-year average. In addition, an oversupply
from unconventional oil sources through the shale
boom compounded pressures on price and adding
to an already precarious situation. From almost no
production in 2010, shale production has risen to
almost 5 million barrels per day with productivity
growing at a rate of 30% year on year since 2007
As the United States continues to maintain its place as
a major producer of both oil and gas, historical
energy trade patterns are shifting. The country can
now satisfy roughly 90% of its energy needs from
domestic sources, up from 70% in 2005.
Additionally, over the past 4 years, c. 20,000 new
shale wells have been completed in the United States
– boosting oil production to nearly 9 million barrels
per day in 2015.
Furthermore, Iran, a potentially disruptive market re-
entrant, will be contributing, in the first instance, an
additional 500,000 barrels per day once it comes
back on stream in 2016, and up to c.3 million barrels
per day within 12 months.
Outlook
The Emerging Growth of Midstream Value
Chain: The oversupply of crude oil has led to a sharp
rise in demand for storage facilities across the globe.
Countries with refining capacities have also seen
huge gains in comparison to importing refined
products due to the low cost of the feed crude and
surplus supply. Additionally, there has been an
opportunity to invest in required infrastructure such as
intra and international pipelines to transport crude
and refined products to facilities.
Acquisition Opportunities: The decline in oil prices
has presented a unique opportunity for long-term
and cash-rich participants in the sector to acquire
good quality assets. Such assets may require
development financing or may simply be non-core to
their current operators and a means of raising
additional revenues. As a long-term investor in the
sector, AFC will continue to seek opportunities to
participate in accretive high quality acquisition
projects.
Restructuring: In Nigeria where in recent years,
indigenous E&P's have benefited from the acquisition
of assets from the IOC's, some of these transactions
2015 BUSINESS REVIEW
29
INFRA
STRU
CTU
RE F
INA
NC
ING
| TH
E A
RT O
F LO
NG
TERM
VIS
ION
AFC / 2015 ANNUAL REPORT & ACCOUNTS
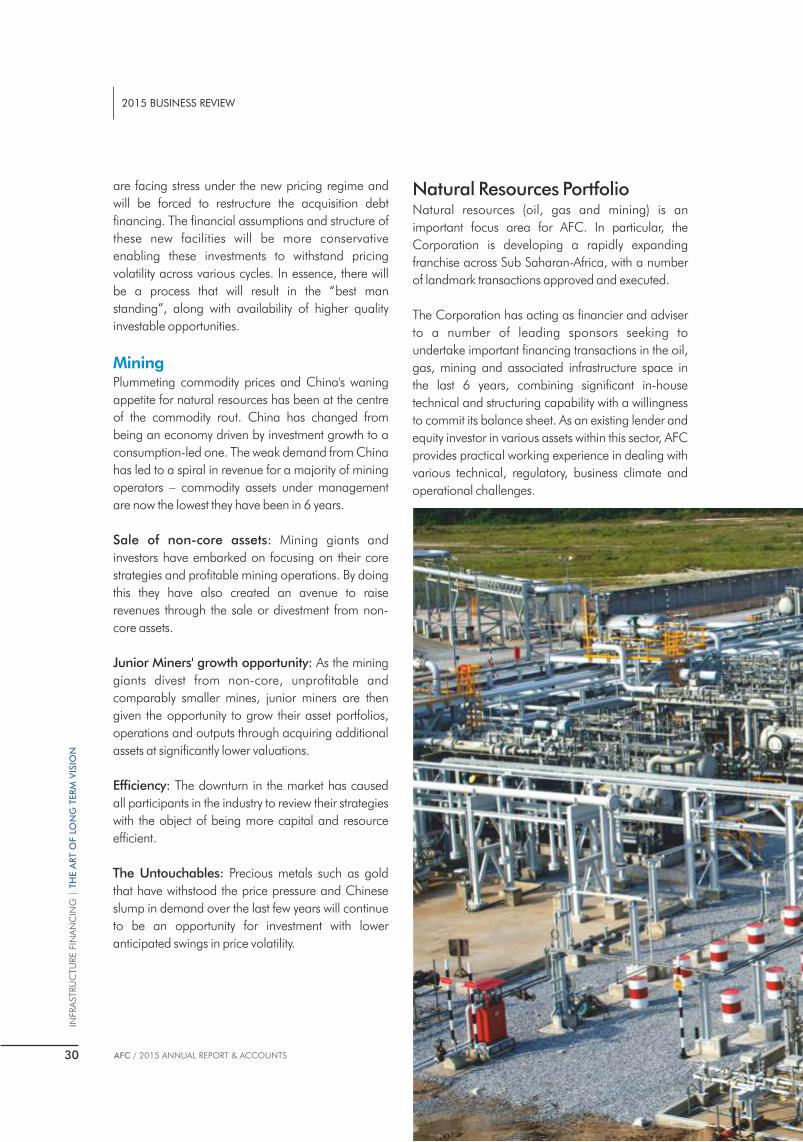
are facing stress under the new pricing regime and
will be forced to restructure the acquisition debt
financing. The financial assumptions and structure of
these new facilities will be more conservative
enabling these investments to withstand pricing
volatility across various cycles. In essence, there will
be a process that will result in the “best man
standing”, along with availability of higher quality
investable opportunities.
MiningPlummeting commodity prices and China's waning
appetite for natural resources has been at the centre
of the commodity rout. China has changed from
being an economy driven by investment growth to a
consumption-led one. The weak demand from China
has led to a spiral in revenue for a majority of mining
operators – commodity assets under management
are now the lowest they have been in 6 years.
Sale of non-core assets: Mining giants and
investors have embarked on focusing on their core
strategies and profitable mining operations. By doing
this they have also created an avenue to raise
revenues through the sale or divestment from non-
core assets.
Junior Miners' growth opportunity: As the mining
giants divest from non-core, unprofitable and
comparably smaller mines, junior miners are then
given the opportunity to grow their asset portfolios,
operations and outputs through acquiring additional
assets at significantly lower valuations.
Efciency: The downturn in the market has caused
all participants in the industry to review their strategies
with the object of being more capital and resource
efficient.
The Untouchables: Precious metals such as gold
that have withstood the price pressure and Chinese
slump in demand over the last few years will continue
to be an opportunity for investment with lower
anticipated swings in price volatility.
Natural Resources PortfolioNatural resources (oil, gas and mining) is an
important focus area for AFC. In particular, the
Corporation is developing a rapidly expanding
franchise across Sub Saharan-Africa, with a number
of landmark transactions approved and executed.
The Corporation has acting as financier and adviser
to a number of leading sponsors seeking to
undertake important financing transactions in the oil,
gas, mining and associated infrastructure space in
the last 6 years, combining significant in-house
technical and structuring capability with a willingness
to commit its balance sheet. As an existing lender and
equity investor in various assets within this sector, AFC
provides practical working experience in dealing with
various technical, regulatory, business climate and
operational challenges.
30
2015 BUSINESS REVIEW
INFRA
STRU
CTU
RE F
INA
NC
ING
| T
HE A
RT O
F L
ON
G T
ERM
VIS
ION
AFC / 2015 ANNUAL REPORT & ACCOUNTS
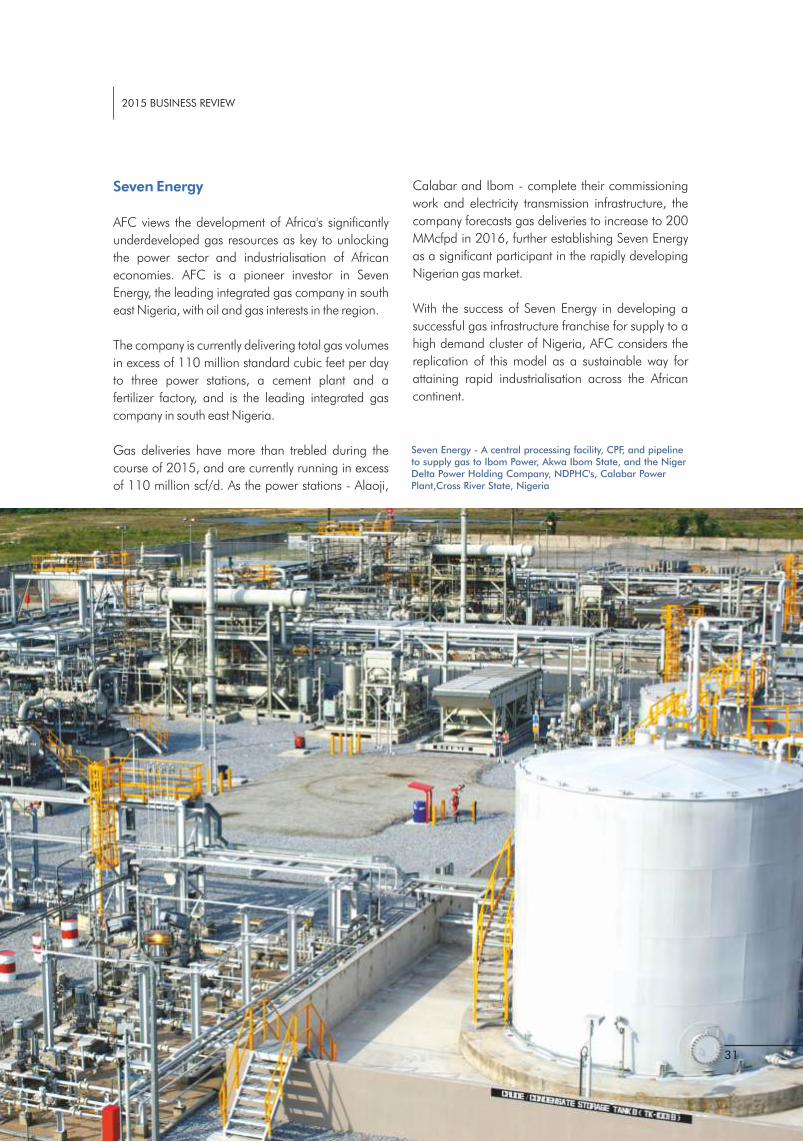
Seven Energy
AFC views the development of Africa's significantly
underdeveloped gas resources as key to unlocking
the power sector and industrialisation of African
economies. AFC is a pioneer investor in Seven
Energy, the leading integrated gas company in south
east Nigeria, with oil and gas interests in the region.
The company is currently delivering total gas volumes
in excess of 110 million standard cubic feet per day
to three power stations, a cement plant and a
fertilizer factory, and is the leading integrated gas
company in south east Nigeria.
Gas deliveries have more than trebled during the
course of 2015, and are currently running in excess
of 110 million scf/d. As the power stations - Alaoji,
Calabar and Ibom - complete their commissioning
work and electricity transmission infrastructure, the
company forecasts gas deliveries to increase to 200
MMcfpd in 2016, further establishing Seven Energy
as a significant participant in the rapidly developing
Nigerian gas market.
With the success of Seven Energy in developing a
successful gas infrastructure franchise for supply to a
high demand cluster of Nigeria, AFC considers the
replication of this model as a sustainable way for
attaining rapid industrialisation across the African
continent.
Seven Energy - A central processing facility, CPF, and pipeline to supply gas to Ibom Power, Akwa Ibom State, and the Niger Delta Power Holding Company, NDPHC's, Calabar Power Plant,Cross River State, Nigeria
31
2015 BUSINESS REVIEW
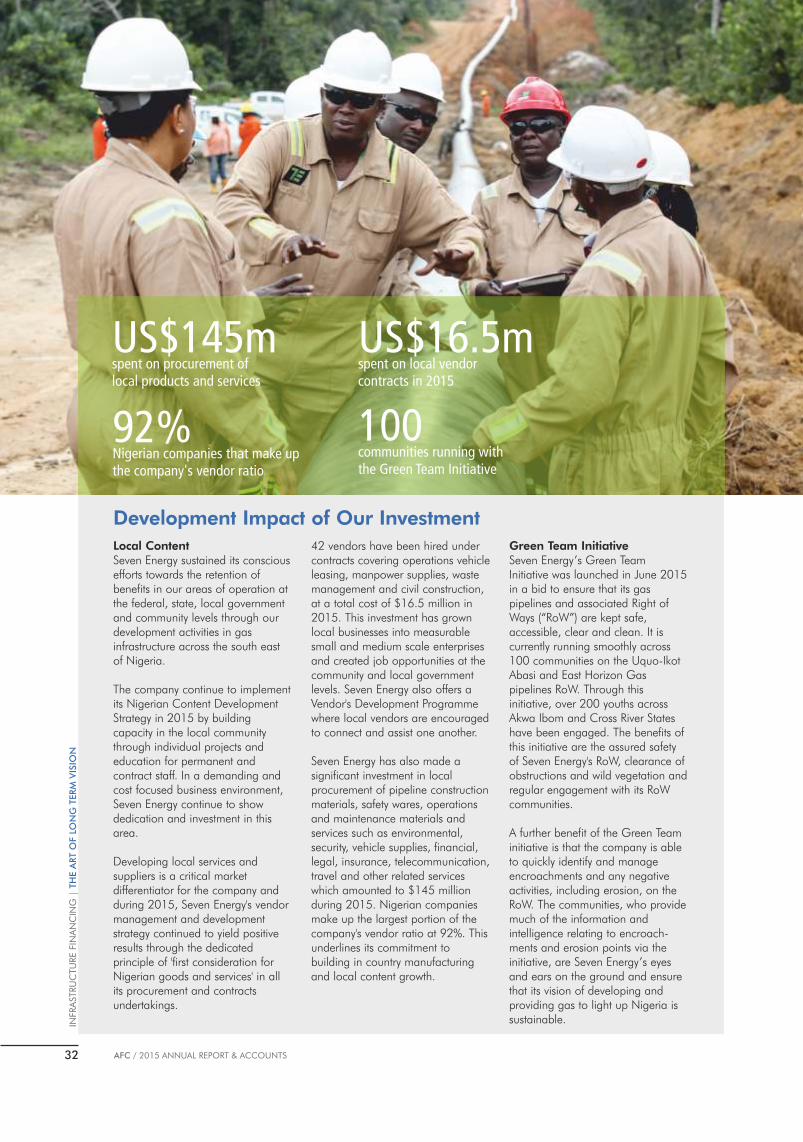
Local ContentSeven Energy sustained its conscious efforts towards the retention of benefits in our areas of operation at the federal, state, local government and community levels through our development activities in gas infrastructure across the south east of Nigeria.
The company continue to implement its Nigerian Content Development Strategy in 2015 by building capacity in the local community through individual projects and education for permanent and contract staff. In a demanding and cost focused business environment, Seven Energy continue to show dedication and investment in this area.
Developing local services and suppliers is a critical market differentiator for the company and during 2015, Seven Energy's vendor management and development strategy continued to yield positive results through the dedicated principle of 'first consideration for Nigerian goods and services' in all its procurement and contracts undertakings.
42 vendors have been hired under contracts covering operations vehicle leasing, manpower supplies, waste management and civil construction, at a total cost of $16.5 million in 2015. This investment has grown local businesses into measurable small and medium scale enterprises and created job opportunities at the community and local government levels. Seven Energy also offers a Vendor's Development Programme where local vendors are encouraged to connect and assist one another.
Seven Energy has also made a significant investment in local procurement of pipeline construction materials, safety wares, operations and maintenance materials and services such as environmental, security, vehicle supplies, financial, legal, insurance, telecommunication, travel and other related services which amounted to $145 million during 2015. Nigerian companies make up the largest portion of the company's vendor ratio at 92%. This underlines its commitment to building in country manufacturing and local content growth.
Green Team InitiativeSeven Energy’s Green Team Initiative was launched in June 2015 in a bid to ensure that its gas pipelines and associated Right of Ways (“RoW”) are kept safe, accessible, clear and clean. It is currently running smoothly across 100 communities on the Uquo-Ikot Abasi and East Horizon Gas pipelines RoW. Through this initiative, over 200 youths across Akwa Ibom and Cross River States have been engaged. The benefits of this initiative are the assured safety of Seven Energy's RoW, clearance of obstructions and wild vegetation and regular engagement with its RoW communities.
A further benefit of the Green Team initiative is that the company is able to quickly identify and manage encroachments and any negative activities, including erosion, on the RoW. The communities, who provide much of the information and intelligence relating to encroach-ments and erosion points via the initiative, are Seven Energy’s eyes and ears on the ground and ensure that its vision of developing and providing gas to light up Nigeria is sustainable.
Development Impact of Our Investment
32
INFRA
STRU
CTU
RE F
INA
NC
ING
| T
HE A
RT O
F L
ON
G T
ERM
VIS
ION
AFC / 2015 ANNUAL REPORT & ACCOUNTS
US$145mspent on procurement oflocal products and services
US$16.5mspent on local vendorcontracts in 2015
92%Nigerian companies that make upthe company's vendor ratio
100communities running withthe Green Team Initiative
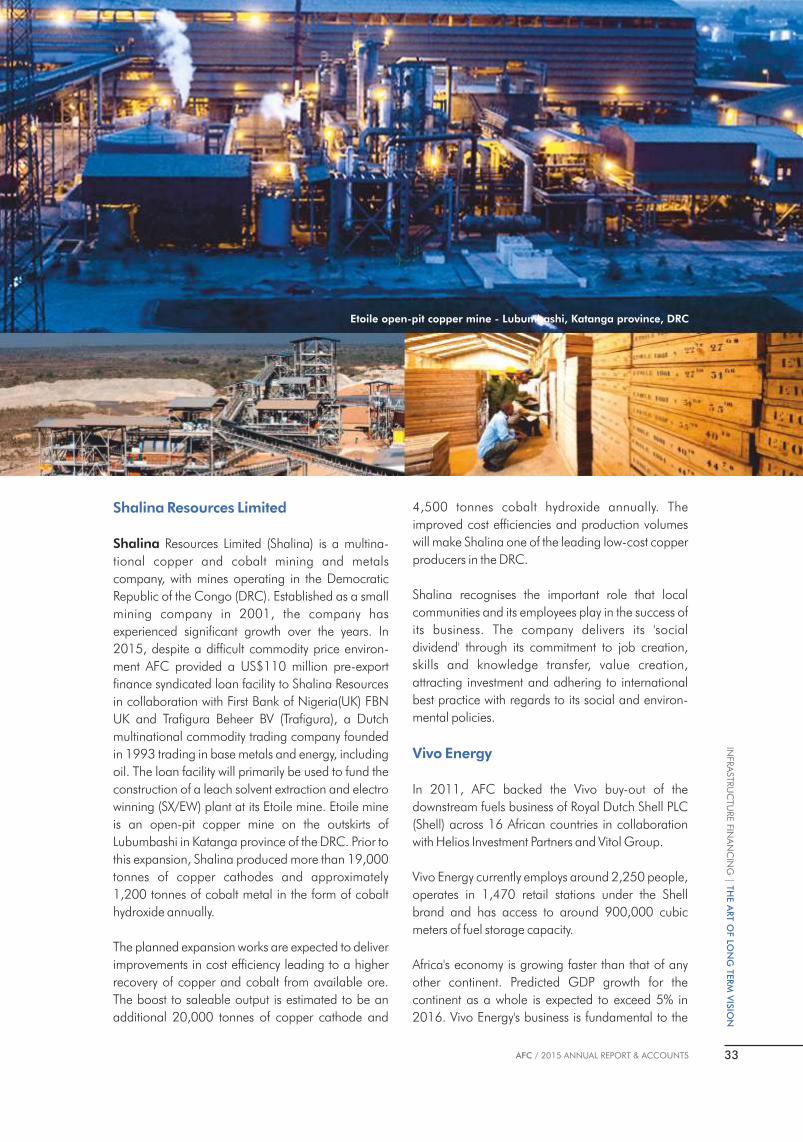
Shalina Resources Limited
Shalina Resources Limited (Shalina) is a multina-
tional copper and cobalt mining and metals
company, with mines operating in the Democratic
Republic of the Congo (DRC). Established as a small
mining company in 2001, the company has
experienced significant growth over the years. In
2015, despite a difficult commodity price environ-
ment AFC provided a US$110 million pre-export
finance syndicated loan facility to Shalina Resources
in collaboration with First Bank of Nigeria(UK) FBN
UK and Trafigura Beheer BV (Trafigura), a Dutch
multinational commodity trading company founded
in 1993 trading in base metals and energy, including
oil. The loan facility will primarily be used to fund the
construction of a leach solvent extraction and electro
winning (SX/EW) plant at its Etoile mine. Etoile mine
is an open-pit copper mine on the outskirts of
Lubumbashi in Katanga province of the DRC. Prior to
this expansion, Shalina produced more than 19,000
tonnes of copper cathodes and approximately
1,200 tonnes of cobalt metal in the form of cobalt
hydroxide annually.
The planned expansion works are expected to deliver
improvements in cost efficiency leading to a higher
recovery of copper and cobalt from available ore.
The boost to saleable output is estimated to be an
additional 20,000 tonnes of copper cathode and
4,500 tonnes cobalt hydroxide annually. The
improved cost efficiencies and production volumes
will make Shalina one of the leading low-cost copper
producers in the DRC.
Shalina recognises the important role that local
communities and its employees play in the success of
its business. The company delivers its 'social
dividend' through its commitment to job creation,
skills and knowledge transfer, value creation,
attracting investment and adhering to international
best practice with regards to its social and environ-
mental policies.
Vivo Energy
In 2011, AFC backed the Vivo buy-out of the
downstream fuels business of Royal Dutch Shell PLC
(Shell) across 16 African countries in collaboration
with Helios Investment Partners and Vitol Group.
Vivo Energy currently employs around 2,250 people,
operates in 1,470 retail stations under the Shell
brand and has access to around 900,000 cubic
meters of fuel storage capacity.
Africa's economy is growing faster than that of any
other continent. Predicted GDP growth for the
continent as a whole is expected to exceed 5% in
2016. Vivo Energy's business is fundamental to the
Etoile open-pit copper mine - Lubumbashi, Katanga province, DRC
33
INFRA
STRU
CTU
RE F
INA
NC
ING
T
HE A
RT O
F LO
NG
TERM
VIS
ION
|
AFC / 2015 ANNUAL REPORT & ACCOUNTS

existence of economies, and linked to economic
growth in core sectors in Africa such as transport,
mining and power, fitting with the developmental
impact sought by AFC.
AFC supports the company's vision 'to create Africa's
most respected energy business'. Vivo's share-
holders are committed to zero tolerance for corrup-
tion, unsafe practices, environmental neglect or
unfair competition. The company demonstrates this
by putting safety first; investing in the communities in
which it operates; empowering, recognising and
rewarding employees; and caring for the environ-
ment of the countries in which it operates.
AFC further supports Vivo's reinvestment in the
business to extend and improve existing services,
expand access by adding locations and bringing
innovations that improve the experience customer
experience. For example, Vivo is expanding
convenience retailing and is currently developing
new formats, including the addition of quick service
restaurants in partnership with major food brands.
They are bringing superior fuels like Shell FuelSave to
more sites in more countries and, with Shell Card
offers, lube and car-wash bays and the provision of a
market-leading retail experience, they are setting
new standards for quality, convenience and service
wherever they operate in Africa.
Looking to the Future
The lacklustre outlook for global economic activity
could have a significant bearing on AFC's business in
2016. However, as we look forward to the year
ahead, we believe that now is the time for African
countries, particularly those suffering from low
commodities prices, to take the steps they need to
broaden their economies and to create the right
investment environments to attract private capital to
African infrastructure. Despite the challenges that
exist in the global economy, investors still stand to
benefit from well-structured African infrastructure
deals. AFC exists to bridge the deficit in infrastructure
financing across continental Africa. A downturn in
the natural resource markets in 2015 into 2016,
adds fresh impetus to create more diversified
economies, which will give rise to greater demand
for investments, particularly in the mining sectors in
our host country Nigeria and some of our new
member states: - Côte d'Ivoire, Gabon, Rwanda,
Uganda.
AFC has developed a phased strategy which
immediately exploits depressed market conditions in
West Africa, especially for indigenous players in the
sector. Further, in the medium to long-term this
strategy would promote value addition opportunities
in high capital requirement projects in the mid and
downstream sectors. This sector is an area of interest
for AFC especially given the opportunity for value
addition and the positive developmental impact.
AFC has obtained final board approval for over
$200M transaction value, which are all expected to
be close and be disbursed in 2016. These transac-
tions are expected to geographically diversify the
portfolio, with these projects in Guinea Conakry,
Tunisia, Liberia and a Pan-African asset portfolio
across various mining production, oil & gas
production assets, and oil & gas midstream infra-
structure sub-sectors. As a long-term investor in the
sector, AFC believes that the investment of high
impact private capital in well-structured transactions
despite the current market challenges, reinforces
AFC's commitment to the development of African
economies and its overall objective of positive
developmental impact.
Despite the challenges that exist in the global economy, investors still stand to benefit from well-structured African infrastructure deals. AFC exists to bridge the deficit in infrastructure financing across continental Africa.
34
2015 BUSINESS REVIEW
INFRA
STRU
CTU
RE F
INA
NC
ING
| T
HE A
RT O
F L
ON
G T
ERM
VIS
ION
AFC / 2015 ANNUAL REPORT & ACCOUNTS
POWER
In 2015, the business climate in many African
Countries presented challenging circumstances in
line with the general global economic and financial
headwinds. The economic challenges in Africa were
exacerbated by the decline in commodity prices
deteriorating terms of trade and declining gross
domestic product growth forecasts; all a conse-
quence of African countries' continuing dependence
on one or two commodity exports. In spite of these
hiccups, in 2015, AFC continued to build on its
significant experience and track record in the power
sector. This was accomplished through continuing
work on power project development initiatives in
Ivory Coast, Rwanda, Mozambique, Ghana and
Nigeria, while initiating new development and
investment opportunities in Zambia.
AFC's work in the sector will ultimately provide
African countries and sponsors with bankable
projects and financing to overcome the huge
infrastructure deficits in the power value chain, and
thus scale-up and help diversify these economies;
through import substitution, local manufacturing
and exports.
In the short term, power sector investments in the
operations phase, 2015 was particularly challeng-
ing in Nigeria. The year saw the introduction of
currency controls which restricted access to foreign
currencies, and increased the difficulty of industry
players in fulfilling their foreign currency denomi-
nated obligations, including servicing AFC loans.
AFC continued to provide support for its investee
companies and borrowers that acquired assets
under the Nigerian power privatization process and
also played an active role in engaging the Central
Bank of Nigeria with a view to assisting qualified
entities access foreign currency. A number of other
countries also experienced currency devaluations
and in some cases increased currency controls, such
as Ghana, but this did not noticeably affect the
capacity of client companies to meet their obliga-
tions to AFC.
Climatic conditions such as low levels of rainfall and
drought in some parts of Africa resulted in severe
electricity generation deficits in a number of hydro-
dependent countries including Zambia and Ghana.
AFC is increasingly becoming part of these countries'
solution to diversifying their energy mix. For example,
in a bid to address the serious power deficit in
Zambia, AFC has secured requisite approval to
provide up to US$55mm, as part of an $515 million
senior loan facility to finance a 300MW coal-fired
project currently under construction in Zambia.
Disbursement is planned for early 2016. AFC is also
in discussions to act as Mandated Lead Arranger
(“MLA”) for an emergency power project in Ghana.
Other notable highlights of AFC's participation in the
African power sector in 2015 are as follows:
Green Climate Fund Accreditation
for Renewable Energy Projects
In July 2015, Africa Finance Corporation became
the first African Development Finance Institution to
be accredited by the Green Climate Fund. The
Green Climate Fund (GCF) was adopted as a
financial mechanism of the United Nations
Framework Convention on Climate Change
(UNFCCC) at the end of 2011. It aims to make an
ambitious contribution to attaining the mitigation
and adaptation goals of the international commu-
nity. Its mission is to promote low-emission and
climate-resilient development pathways by providing
support to developing countries and to help them
limit or reduce their greenhouse gas emissions. By
becoming an accredited entity, AFC now has access
to GCF's committed capital of US$9.3 billion to fund
environmentally-friendly and renewable energy
projects.
In line with its recent accreditation and award
winning wind IPP in Cape Verde, AFC is committed
to expanding its pipeline of environmentally-friendly
and renewable energy projects in Africa with
advanced discussions on several projects in West
and East Africa through the use of the GCF Facility.
35
2015 BUSINESS REVIEW
INFRA
STRU
CTU
RE F
INA
NC
ING
| TH
E A
RT O
F LO
NG
TERM
VIS
ION
AFC / 2015 ANNUAL REPORT & ACCOUNTS

Singrobo Hydro Independent
Power Project, Côte d'Ivoire
The Singrobo Project is a concession awarded to
Ivory Hydro Energy SA on a Build, Operate and
Transfer (BOT) basis. The 44 MW plant is located
3km down-stream from an existing hydroelectric
plant, and will have a 35-year take-or-pay Power
purchase agreenemen (PPA) with CI-Energies, Côte
d'Ivoire's public utility.
In 2015, AFC executed a Joint Development
Agreement (JDA) to act as co-developer and to
invest up to US$4.5 million to drive project develop-
ment activities to financial close. The project
development expenses will be jointly funded by AFC
and the Dutch development bank FMO, through the
joint AFC-FMO Project Development Facility.
Financial close is targeted in 2016.
It is of note that the project won the top prize of $1
million in the West African Forum for Clean Energy
Financing Award, 2015.
Cabeolica
AFC executed a Share purchase agreement with
InfraCo Africa in 2015, increasing its stake to 57% in
the Cabeólica wind farm in Cape Verde, with equity
close attained in early 2016. Cabeólica is the first
privately-financed sustainable wind farm on a
commercial scale in sub-Saharan Africa.
36
INFRA
STRU
CTU
RE F
INA
NC
ING
| T
HE A
RT O
F L
ON
G T
ERM
VIS
ION
AFC / 2015 ANNUAL REPORT & ACCOUNTS
Cabeólica's Sal wind farm in operation

Cenpower- Kpone IPP
In January 2015, the ground-breaking ceremony
was held for AFC's landmark 350MW Cenpower
Combined Cycle IPP Project in Ghana. Construction
is underway, with operations expected to commence
in the second half of 2017.
West African Power Pool (“WAPP”)
Regional Generation Facilities
AFC secured a Lead developer mandate for the
development of a 450MW Regional power genera-
tion facility in the Republic of Bénin and the 450MW
Domunli regional power generation facility in
Jomoro District, Western Region, Republic of Ghana,
a Joint development agreement was executed
between AFC and WAPP in 2015.
The Pre-Feasibility Study for the project has since
been concluded and adopted by the participating
WAPP Member Utilities. Other project development
activities are currently on-going and with Financial
Close targeted for 2017.
The West African Power Pool (“WAPP”) is a special-
ised Institution of the Economic Community of
West African States (ECOWAS) established in 2006
to develop a regional power market. WAPP is made
up of Public and Private Generation, Transmission
and Distribution companies involved in the operation
of the electricity in West Africa. It has to date, 26
member countries.
Volta River Authority
AFC continues to cement its financing track record of
key projects in the power sector in Ghana. AFC
provided a US$60 million facility to the Volta River
Authority (VRA), Ghana, to finance the completion of
the 220MW Kpone Thermal Power Plant (KTPP) and
the conversion to gas of the 80MW Mine Reserve
Plant (MRP), in Tema. The project will further improve
power generation in Ghana and support VRA's export
sales of electricity to Communaute' Electrique du
Benin (CEB), an international utility company co-
owned by the Governments of Togo and Benin.
Kpone IPP General plant, Tema, Ghana - Overview North to South
Kpone IPP Collector sub-station site
37
INFRA
STRU
CTU
RE F
INA
NC
ING
| TH
E A
RT O
F LO
NG
TERM
VIS
ION
AFC / 2015 ANNUAL REPORT & ACCOUNTS

Hakan Independent Power Project, Rwanda
In January, 2014, AFC was appointed the mandated
lead arranger on the innovative 80MW peat-to-
power IPP in Rwanda. A consoritum of African DFIs
and a European DFI, form the Lender group and
world-class advisors and technology have been
procured to deliver the project. Financial close is
targeted in 2016. The project will be the largest
project finance transaction in Rwanda's history, and is
expected to drastically reduce the use of expensive
imported diesel / heavy fuel oil.
TRANSPORT
In order to consolidate AFC's contribution to the
transport infrastructure deficit, which continues to
greatly impact productivity, AFC continued to seek
innovative and alternative funding sources to 'fast-
track' development of transportation projects.
Within the Roads sector, there has been an accelera-
tion of Public Private Partnership (PPP) Programs as a
means of fast tracking the development and expan-
sion of road infrastructure in several countries in sub-
Saharan Africa. We have seen the Kenyan
Government work towards the development of
10,000km of roads, the Ugandan government
planned development of the Kampala-Jinja road and
the Zambian Government targeting the development
of 2,000km through road annuity programs. Other
countries have sought to utilize the build and transfer
model through contractor led financing backed by
government term repayments.
In 2015, AFC made its first investment in Guinea, by
providing a EUR30 million to Group EBOMAF for the
rehabilitation of the 194km section of the National
Route 6 (NR 6), connecting Kissidougou and
Kankan. The road is a national priority for Guinea, as
it not only connects the two largest natural areas in
the country, but also forms the junction between the
trans-coastal highway running between Conakry to
Ouagadougou and Dakar. Once complete, the road
will significantly improve travel time between the 34
villages and 11 towns that lie along the route.
AFC has now become one of the largest sharehold-
ers in the Henri Konan Bedié Bridge concession in
Côte d'Ivoire which was opened in December 2014.
The project, which involved the design, construction,
financing and commissioning of a 6.4km highway
and 1.9km bridge, has transformed the landscape of
the historic city of Abidjan. AFC is also working with
a number of governments and consortia in support of
proposals to develop, structure and fund annuity
programs in order to deliver projects more efficiently
and effectively
Despite the historic decline of Rail as a mode of
connectivity, we have seen a re-emergence of
governments committing to the development of rail
infrastructure in urban cities. The road congestion in
a number of urban cities has led governments to
prioritize the development of urban rail transporta-
tion. AFC is working with government agencies and
strategic players to lead the project development of
urban transportation. In addition, a major bottleneck
to the exploitation of natural resources in a number of
West African economies is the transport logistics to
evacuate products for export. Countries with a very
high reliance on oil are now focussed on diversifying
their economies through the provision on multi-user
transport logistics which involves the development of
rail and port terminal infrastructure.
The economic slowdown in most African countries
continued as oil price levels plummet by approxi-
mately 50% during the year; political uncertainties in
a number of countries that held presidential and
parliamentary elections, most notably Nigeria;
declining demand from China as the Chinese
economy rebalanced away from manufacturing to
services and the resulting depreciation of most
African currencies led to a slowdown in Maritime
activity. As a result, the sector which had started to see
the development of much needed infrastructure to
keep up with changing pattern of increased domestic
production and international trade experienced a
slowdown in 2015.
AFC continued to support the development of two
significant port projects in West Africa which are
anticipated to come on stream in 2016 / 2017.
38
2015 BUSINESS REVIEW
INFRA
STRU
CTU
RE F
INA
NC
ING
| T
HE A
RT O
F L
ON
G T
ERM
VIS
ION
AFC / 2015 ANNUAL REPORT & ACCOUNTS

These projects will contribute to ease congestion at
the ports and facilitate mineral and agriculture
exports within the region.
The performance of the Aviation sector continues to
lag behind other economies. The development of the
sector is heavily constrained by limited regional
integration and slow progress in the liberalization of
intra-African air transportation in line with the
Yamoussoukro declaration. In addition, poor
infrastructure, limited connectivity across Africa and
the high cost of operation driven by regulation,
government taxation, handling charges and airport
charges continue to result in high cost of travel and
declining profitability of African airline companies.
In line with AFC's objective to support the develop-
ment of airport infrastructure, aircraft financing and
aviation logistics, AFC provided a US$50 million
loan as part of a US$500 million senior syndicated
loan facility to Ghana Airport Company Limited's
expansion and upgrade of 5 airports, including
Kotoka International Airport (KIA). The project was in
line with the Government of Ghana's goal to develop
aviation infrastructure in step with increased eco-
nomic activity at domestic airports.
A continued focus for 2016 will be to consolidate
efforts to promote domestic and regional transport
connectivity, and improve access to funding through
an active role in project development to get projects
to reality much faster. AFC intends to leverage
strategic partnerships with other investors in the
development of transport projects through the setting
up of transportation platforms. We believe that the
greatest development impact will be through
collaboration via investing in sub-sector specific
platform companies.
HEAVY INDUSTRY
Despite the recent decade of rapid economic growth
driven by high commodity prices, Africa's social
development indicators of unemployment and
poverty remain weak, with minimal gains in industri-
alization and labour driven sectors. With the recent
downturn, many African countries now confront
dwindling foreign exchange revenues, current
account deficits and deteriorating balance of
payments; hence rapid Industrialization as an anchor
to pivot African economies into sustainable manage-
ment of economic cyclicality has become even more
salient.
AFC's mandate to develop Africa's Heavy Industries
Sector is positioned to drive not only economic
diversification but value addition and sustainable
value chain integration in Africa thereby resolving
economic distortions, improving productivity and
creating employment.
Africa's natural resource base is prolific and encom-
passes oil and gas, iron ore, copper, gold, as well as
several commercially relevant agricultural resources.
At least eleven countries in Africa are among the top
ten sources for at least one major mineral in the world
while the continent's global oil output is estimated at
more than 13 percent of the world's total, compared
to 9 percent in 1998. However, value addition to
these commodities and other forms of vertical
integration to expand the productive value chain
have remained elusive. An exception to this is the
cement industry, where during the last decade,
African entrepreneurs have become influential in the
manufacture of cement across the continent.
The development of Africa's industrial and manufac-
turing sector requires a foundation of actual and
institutional infrastructure including: power, roads,
rail, ports as well as education, integrated trade
policies and cluster development. The linkage of
industrial zones to the value chain of economic
A continued focus for 2016 will be to consolidate efforts to promote domestic and regional transport connectivity, and improve access to funding through an active role in project development to get projects to reality much faster.
39
2015 BUSINESS REVIEW
INFRA
STRU
CTU
RE F
INA
NC
ING
| TH
E A
RT O
F LO
NG
TERM
VIS
ION
AFC / 2015 ANNUAL REPORT & ACCOUNTS

activity in the country is also crucial.
Ultimately, the industrial and manufacturing sector
has the potential to provide much needed backdrop
for economic stability on the continent. However, the
development of an adequate industrial base requires
a coordinated network of qualified firms, capital,
underlying infrastructure, value chain development,
policy support and an educated labour force. African
policy makers and investors must integrate as part of
the development plan, building a competitive
productive base via industrialization serving as the
catalyst to diversify the production structure of African
economies; to create job opportunities for an ever-
growing workforce and to build wealth for African
nations.
Heavy Industries is a priority sector for AFC. AFC is
actively developing an investment program to
address four verticals in the industrial sector;
Chemicals, Building Materials, Steel and Industrial
Inputs. These sub sectors address value chain
accretion by investing in projects that include one or
more industrial processing layer(s) on commodities
thereby capturing more value or integrate one or
more levels of backward integration using locally
available raw materials to produce end-user
products to serve local and regional demand.
The corporation has provided investment capital in
equity, debt, and trade financing for several projects
including; fertilizer (ammonia/urea and phosphates),
cement, and refineries. These investments have been
made in Nigeria, Kenya, DRC, South Africa, Cote
d'Ivoire, Zambia, Malawi, and Morocco.
One of the projects that AFC has supported in the
heavy industries sector is ARM cement in Kenya. ARM
is one of the largest cement manufacturers in East
Africa. The cumulative value of AFC's financing of
heavy industry projects currently stands at approxi-
mately US$366 million while the Corporation's
pipeline of projects for 2016 is approximately US$
225 million.
TELECOMMUNICATIONS
The African Telecommunications Sector has experi-
enced significant growth over the last decade with
revolutionary adoption rates of digital communica-
tions and data connectivity. Although in recent years,
subscription growth rates have slowed, the telecoms
sector has continued along an upward trajectory
driven by increasing volumes of mobile services
leveraging on wide reaching networks, improved
macro-economic environment, licensing opportuni-
ties and improving regulatory frameworks. Currently
the telecoms sector is maturing with slower growth
rates with respect to voice but latent demand with
respect to internet penetration. This in line with the
convergence of services and products integrated into
the mobile offerings will convert the telecoms sector
into an integrated technology based product and
service delivery sector that can only achieve its
potential if there is robust underlying telecommunica-
tions / broad band infrastructure to support the
transformation.
In the context of the changing opportunity landscape
for telecoms, underlying infrastructure remains a
critical need albeit with capacity required toward the
end of the delivery spectrum. Africa's international
fibre connectivity deployment which began in 2007 is
now maturing with significant capacity available
offshore driving the need for and increasing develop-
ment of terrestrial fibre infrastructure to take advan-
US$366m
US$225m
CURRENT CUMULATIVE VALUE OF AFC'SFINANCING OF HEAVY INDUSTRY PROJECTS
CORPORATION'S PIPELINE OF PROJECTS FOR 2016
40
2015 BUSINESS REVIEW
tage of this huge latent capacity. Infrastructure
efficiency and sharing models have also been well
established with significant investor interest. The large
number of tower transfers have led to the emergence
of leading tower companies with scale to drive
impact with respect to efficiency and cost savings.
Energy costs continue to present a major pressure
point but hybrid energy solutions to reduce costs are
being deployed with some successful pilots being
converted to scalable initiatives. Despite improved
coverage in urban areas, rural connectivity has been
slower to develop but there are interesting business
models emerging to support this important sub-
segment.
Ultimately, Africa needs a well-developed telecom-
munications infrastructure to drive productivity.
GSMA research states that a 10% increase in mobile
penetration in developing economies is likely to
increase productivity by 4.2%. A strong telecom
infrastructure base will enhance access and promote
the next generation of service offerings and products
to deliver a robust network based economy.
The economic development principle underlying
AFC's approach to investing in telecommunications is
to enhance broad reaching connectivity, internet
access and affordability. AFC's cornerstone invest-
ment in Main One remains a major contribution to
the revolution in undersea cables in Africa as well as
the development of terrestrial fibre, data centers and
value added services leveraging on the Main One
platform. AFC is considering investments to improve
connectivity especially in countries with low internet
penetration as well as investment to support infra-
structure sharing and energy savings. AFC currently
has a telecom pipeline of over US$ 150 million in
assets.
FINANCIAL SERVICES
Financial Advisory
AFC continues to strengthen its financial advisory
services, and was involved in several interesting
engagements during the year. The Corporation
continues to act as Technical Adviser to the Central
Bank of Nigeria on its NGN300 billion (US$2 billion)
Power and Aviation Intervention Fund (PAIF). As at the
end of 2014, the Fund had disbursed NGN107.5
billion to 27 companies generating over 860
megawatts of mainly off-grid electricity, while
NGN11.3 billion was disbursed to 2 gas-to-power
projects, and an additional NGN117.4 billion to 10
aviation companies.
During the year, AFC was appointed as the Financial
Adviser to the development of the Second Niger
Bridge, a project which is being jointly sponsored by
the Nigeria Sovereign Investment Authority (NSIA)
and Julius Berger Investments under a Public Private
Partnership arrangement. AFC is also advising on a
number of private infrastructure projects including a
proposed petroleum products refinery, the indige-
nous manufacturing of high-grade transmission
towers, and a peat-fired power project in East Africa.
Trade Finance
During the 2015 financial year, AFC's trade finance
product continued to play a role in the Corporation's
asset creation and income generation activities and
in the process acting as a useful avenue for liquidity
management given the short-term nature of some of
trade finance assets. Trade finance assets accounted
for approximately 42% of AFC's loan portfolio while
contributing 17% of AFC's total interest income.
The trade finance asset class includes structured trade
finance solutions such as prepayment financing
facilities, pre-export facilities, and asset-backed
financing facilities and also includes more traditional
solutions such as invoice discounting.
AFC's trade finance product is designed to provide
financial solutions across the Corporation's focus
sectors while allowing AFC the flexibility to participate
under risk-participations with select partner banks
and/or financial institutions with regards to other
qualifying transactions such as: Letters of Credit (LC)
confirmation enhancement, agri-commodities.
AFC has executed Master-Risk Participation
Agreements (MRPA) with a host of partner banks
including PTA Bank, FBN UK, Standard Bank,
41
2015 BUSINESS REVIEW
INFRA
STRU
CTU
RE F
INA
NC
ING
| TH
E A
RT O
F LO
NG
TERM
VIS
ION
AFC / 2015 ANNUAL REPORT & ACCOUNTS

Standard Chartered Bank, Zenith Bank UK etc.
Under the various MRPA's, AFC ably deployed its
credit rating to enhance the ability of LC confirming
ability of confirmation banks; thus expanding the
capacity of the confirming banks to do more with the
LC issuing banks (usually a bank that has a credit line
with AFC).
Treasury
Securing finance from international capital markets is
central to our strategy to diversify funding sources
and attract more private investment from around the
world to infrastructure opportunities in Africa. The
AFC's debut Eurobond was only possible because of
the Corporation's international credit rating, received
in March 2014, and, reaffirmed in 2015. The Africa
Finance Corporation is one of the highest investment
grade rated multilateral finance institutions in Africa.
Following the success of AFC's maiden Euro Bond
issue, under our Global Medium term Notes (GMTN)
program, the Corporation issued a US$20 million
one-year note to Krung Thai Asset Management
Public Company Limited (“KTAM”), a Thai govern-
ment owned asset manager with over US$18 billion
under management. The purpose of the facility was
to further strengthen and deepen the institution's
relationship in Asia. This is a welcome development,
which indicates a strong appetite for AFC risk, despite
the negative sentiments towards the continent. In
addition to this, a US$ 20 million floating interest rate
note was issued to a Middle Eastern investor, Doha-
based Qatar Insurance Company (QIC). In
September 2015, Board approval was obtained for a
YEN 3 billion (circa US$25 million) fixed interest rate
note issuance to a Japanese investor.
We are aware that the current negative investor
sentiment towards emerging market risk and
subsequently sell-off may adversely affect the
Corporation's cost of funds, our treasury unit actively
engaged investors and developed niche products
aimed at diversifying our funding sources. Given the
opportunity presented by the current high yields on
African Eurobonds, the Corporation continues to
selectively grow its fixed income portfolio and
generate additional stable accrual income. The
Board also approved AFC's first bond in an African
local currency; The Naira Medium Term Note.
42
2015 BUSINESS REVIEW
INFRA
STRU
CTU
RE F
INA
NC
ING
| T
HE A
RT O
F L
ON
G T
ERM
VIS
ION
AFC / 2015 ANNUAL REPORT & ACCOUNTS

CONSOLIDATEDFINANCIALSTATEMENTS FOR THE YEAR ENDED 31 DECEMBER 2015

The directors are responsible for the preparation of the financial statements for each financial year that
gives a true and fair view of the state of financial affairs of the Corporation at the end of the year and
of its profit or loss. The directors are also responsible for ensuring that the Corporation keeps proper
accounting records that disclose, with reasonable accuracy, the financial position of the Corporation. They
are also responsible for safeguarding the assets of the Corporation.
The directors accept responsibility for the annual financial statements, which have been prepared using
appropriate accounting policies supported by reasonable estimates, in conformity with International
Financial Reporting Standards. The directors further accept responsibility for the maintenance of accounting
records that may be relied upon in the preparation of the financial statements, as well as for designing,
implementing and maintaining internal controls relevant to the preparation and fair presentation of
financial statements that are free from material misstatement.
Nothing has come to the attention of the directors to indicate that the Corporation will not remain a going
concern for at least twelve months from the date of this statement.
Approval of Annual Financial Statements
The annual financial statements, presented on pages 47 to 115, were approved by the board of directors on
22 February, 2016 and were signed on its behalf by:
__________________ __________________
Chairman President & CEO
STATEMENT OF
DIRECTORS' RESPONSIBILITY
44
CONSOLIDATED FINANCIAL STATEMENTS
INFRA
STRU
CTU
RE F
INA
NC
ING
| T
HE A
RT O
F L
ON
G T
ERM
VIS
ION
AFC / 2015 ANNUAL REPORT & ACCOUNTS

In compliance with the provisions of Article 28 of the Charter of the Africa Finance Corporation and pursuant to the terms of the Audit and Compliance Committee (the “Committee”) statute concerning the establishment, membership, functions and powers of the Audit Committee of the Africa Finance
Corporation, the Committee considered the audited financial statements for the year ended 31 December 2015, at its meeting held on 12 February, 2016.
In our opinion, the scope and planning of the audit for the year ended 31 December 2015 were adequate.
The Committee reviewed and was satisfied with the auditor's submissions.
After due consideration, the Committee accepted the report of the auditors to the effect that the financial statements were prepared in accordance with the International Financial Reporting Standards and gave a true and fair view of the state of affairs of the Corporation's financial condition as at 31 December 2015.
The Committee, therefore, recommended that the audited financial statements of the Corporation for the financial year ended 31 December 2015 and the auditor's report thereon be approved by the Board and presented for consideration by shareholders at the general meeting.
The Committee accepted the provision made in the financial statements for the remuneration of the auditors and recommended that the Board accept same. Furthermore, the Committee recommended to the shareholders, the reappointment of PricewaterhouseCoopers as the Corporation's external auditors for the 2016 Financial Year.
________________________
Tunde Lemo, OFR
Chairman, Audit & Compliance Committee
Members of the Committee
Dr. Adesola Adeduntan
Mr. Ebenezer Onyeagwu
Mr. Jibril Aku
Mr. Lamido Yuguda
Mr. Robert Tung
REPORT OF THE
AUDIT AND COMPLIANCE COMMITTEETo the Board of Directors and General Meeting of the Africa Finance Corporation
45
CONSOLIDATED FINANCIAL STATEMENTS
INFRA
STRU
CTU
RE F
INA
NC
ING
| TH
E A
RT O
F LO
NG
TERM
VIS
ION
AFC / 2015 ANNUAL REPORT & ACCOUNTS

Report on the financial statements
We have audited the accompanying financial statements of Africa Finance Corporation (“the Corporation”).
These financial statements comprise the statement of financial position as at 31 December 2015 and the
statement of comprehensive income, statement of changes in equity and statement of cash flows for the year then
ended, and a summary of significant accounting policies and other explanatory notes.
Directors' responsibility for the financial statements
The directors are responsible for the preparation and fair presentation of these financial statements in accordance
with International Financial Reporting Standards and for such internal control, as the directors determine is
necessary to enable the preparation of financial statements that are free from material misstatement, whether due
to fraud or error.
Auditor's responsibility
Our responsibility is to express an opinion on the financial statements based on our audit. We conducted our
audit in accordance with International Standards on Auditing. Those standards require that we comply with
ethical requirements and plan and perform our audit to obtain reasonable assurance that the financial statements
are free from material misstatement.
An audit involves performing procedures to obtain audit evidence about the amounts and disclosures in the
financial statements. The procedures selected depend on the auditor's judgement, including the assessment of
the risks of material misstatement of the financial statements, whether due to fraud or error. In making those risk
assessments, the auditor considers internal control relevant to the entity's preparation and fair presentation of the
financial statements in order to design audit procedures that are appropriate in the circumstances, but not for the
purpose of expressing an opinion on the effectiveness of the entity's internal control. An audit also includes
evaluating the appropriateness of accounting policies used and the reasonableness of accounting estimates
made by the directors, as well as evaluating the overall presentation of the financial statements.
We believe that the audit evidence we have obtained is sufficient and appropriate to provide a basis for our
opinion.
Opinion
In our opinion the accompanying financial statements give a true and fair view of the state of the Corporation's
financial affairs as at 31 December 2015 and of its financial performance and cash flows for the year then ended
in accordance with International Financial Reporting Standards.
PricewaterhouseCoopers
Chartered Accountants
Lagos, Nigeria
Engagement partner: Patrick Obianwa
PricewaterhouseCooper Chartered Accountants, 25E Muri Okunola Street, Victoria Island Lagos, Nigeria.
29 February 2016
REPORT OFTHE INDEPENDENT AUDITORTO THE MEMBERS OF AFRICA FINANCE CORPORATION
46
INFRA
STRU
CTU
RE F
INA
NC
ING
| T
HE A
RT O
F L
ON
G T
ERM
VIS
ION
AFC / 2015 ANNUAL REPORT & ACCOUNTS

Note* Year ended Year ended 31 December 31 December 2015 2014 US$'000 US$'000
Interest income 6 158,733 104,440
Interest expense 6 (53,850) (28,790)
Net interest income 104,883 75,650
Dividend income 7 30 1,228
Fees, commissions and other income 8 9,891 38,599
Income from sale of equity investments 9 - 24,592
Operating income 114,804 140,069
Net gain on financial instruments at
fair value through profit or loss 10 18,867 9,779
Loss on financial instruments at amortised cost (4,348) -
Impairment charge on financial assets 11 (26,710) (6,586)
Operating expenses 12 (30,020) (38,576)
Profit for the year 72,593 104,686
Other Comprehensive Income
Items that are or may be reclassified to profit or loss:
Net (loss)/gain on available-for-sale financial assets 20(b) (2,316) 9,265
Total Comprehensive Income for the year 70,277 113,951
Earnings per share for profit attributable to
equity holders during the period (expressed in
United States cents per share)
- basic 14 6.67 9.61
- diluted 14 6.67 9.61
*The accompanying notes 1-33 are an integral part of these financial statements.
CONSOLIDATED STATEMENT OF
COMPREHENSIVE INCOME
47
STATEMENT OF COMPREHENSIVE INCOME
INFRA
STRU
CTU
RE F
INA
NC
ING
| TH
E A
RT O
F LO
NG
TERM
VIS
ION
AFC / 2015 ANNUAL REPORT & ACCOUNTS

CONSOLIDATED STATEMENT OF
FINANCIAL POSITION
Note* Year ended Year ended 31 December 31 December 2015 2014 US$'000 US$'000
ASSETS
Cash and balances with commercial banks 15 40,414 86,551
Loans and advances to banks 16 976,130 370,476
Derivative financial instruments 17 3,534 639
Financial assets at fair value through profit or loss 18 226,228 189,148
Loans and advances to other customers 19 1,177,864 1,087,390
Investment securities:
- Financial assets at amortised cost 20(a) 497,805 535,086
- Financial assets at fair value through OCI 20(b) 98,491 100,373
Other assets 21 16,760 66,204
Property and equipment 22 1,845 2,001
Intangible assets 23 642 1,238
Total assets 3,039,713 2,439,106
LIABILITIES:
Accrued expenses and other liabilities 24 24,345 25,104
Derivative financial instruments 17 2,718 14
Borrowings 25 1,646,936 1,061,593
Total liabilities 1,673,999 1,086,711
EQUITY
Capital and reserves attributable to the Corporation's
equity holders:
Share capital 27 1,089,067 1,089,067
Retained earnings 28 255,335 239,700
Fair value reserves 29 21,312 23,628
Total equity 1,365,714 1,352,395
Total liabilities and equity 3,039,713 2,439,106
*The accompanying notes 1-33 are an integral part of these financial statements.
48
STATEMENT OF FINANCIAL POSITION
INFRA
STRU
CTU
RE F
INA
NC
ING
| T
HE A
RT O
F L
ON
G T
ERM
VIS
ION
AFC / 2015 ANNUAL REPORT & ACCOUNTS

Share Retained Fair Value Capital Earnings Reserves Total US$'000 US$'000 US$'000 US$'000
As at 1 January 2014 1,089,067 178,577 14,363 1,282,007
Dividends paid during the year - (43,563) - (43,563)
Total comprehensive income - 104,686 9,265 113,951
As at 31 December 2014 1,089,067 239,700 23,628 1,352,395
As at 1 January 2015 1,089,067 239,700 23,628 1,352,395
Profit for the year - 72,593 - 72,593
Dividends paid during the year - (56,958) - (56,958)
Other comprehensive income
Fair value change in financial assets - - (2,316) (2,316)
As at 31 December 2015 1,089,067 255,335 21,312 1,365,714
CONSOLIDATED STATEMENT OF
CHANGES IN EQUITY
49
STATEMENT OF CHANGE IN EQUITY
INFRA
STRU
CTU
RE F
INA
NC
ING
| TH
E A
RT O
F LO
NG
TERM
VIS
ION
AFC / 2015 ANNUAL REPORT & ACCOUNTS

CONSOLIDATED STATEMENT OF
CASH FLOWS
Note* Year ended Year ended 31 December 31 December 2015 2014 US$'000 US$'000
Cash flows from operating activities
Interest and similar income received 151,825 100,916
Interest expense (54,273) (27,097)
Fee and commission receipts 10,106 68,410
Dividend income 7 30 1,228
Cash payments to employees and suppliers (28,464) (27,657)
Other assets 49,444 (29,751)
Loans and advances to customers (113,654) (565,932)
Financial assets at fair value through profit or loss (14,889) (39,388)
Purchase of available-for-sale securities (11,095) (1,650)
Proceeds on disposal of available-for-sale securities 5,816 3,922
Other liabilities 4 (375)
Net cash from operating activities (5,150) (517,374)
Cash flows from investing activities
Purchase of non-traded debt securities (23,167) (127,154)
Capital repayments of non-traded debt securities 56,664 12,021
Proceeds on disposal of non-traded debt securities 2,571 -
Proceeds on disposal of property and equipment 90 206
Purchase of property and equipment 22 (845) (890)
Purchase of software/Intangibles 23 (24) (509)
Net cash from investment activities 35,289 (116,326)
Cash flows from financing activities
Net proceeds from borrowings 1,234,000 447,440
Repayment of borrowings (648,234) (19,500)
Dividend payments 30 (56,958) (43,563)
Net cash from financing activities 528,808 384,377
Net (decrease)/increase in cash and cash equivalents 558,947 (249,323)
Cash and cash equivalents at the beginning of the year 457,019 706,342
Cash and cash equivalents at the end of the year 31 1,015,966 457,019
*The accompanying notes 1-33 are an integral part of these financial statements.
50
STATEMENT OF CASH FLOWS
INFRA
STRU
CTU
RE F
INA
NC
ING
| T
HE A
RT O
F L
ON
G T
ERM
VIS
ION
AFC / 2015 ANNUAL REPORT & ACCOUNTS

1. General information
Africa Finance Corporation (“AFC” or the “Corporation”) is a multilateral development finance institution
established by an international agreement between sovereign states.
AFC was created by two constitutive legal instruments: (i) the Agreement for the Establishment of the Africa
Finance Corporation (the “AFC Agreement”) and (ii) the Charter of the Africa Finance Corporation (the “AFC
Charter”). AFC is headquartered in the Federal Republic of Nigeria, based on the Headquarters Agreement
dated 28 May 2007 between the Federal Republic of Nigeria and the Africa Finance Corporation. AFC's
headquarters is located at 3a Osborne Road, Ikoyi, Lagos, Nigeria. In September 2013, the Corporation
incorporated a special purpose entity (AFC Equity Investments Limited) in Mauritius to hold certain investments.
AFC Equity became operational in the 2014 financial year.
The Corporation's shareholders principally comprise African States and corporate entities, such as major
commercial banks, other financial institutions and other private sector commercial entities. The current member
states are Chad, Cote d'Ivoire, Gabon, Ghana, Guinea Bissau, Guinea Conakry, Liberia, Nigeria, Rwanda,
Sierra Leone, Cape Verde, The Gambia, and Uganda. Other potential member States are going through the
process of acceding to membership of the Corporation in accordance with their respective internal procedures.
Twenty five (25) shareholders have thus far subscribed and paid for shares in AFC in accordance with the terms
of the AFC Charter. As at 31 December 2015, the list of shareholders holding more than 5% of the issued share
capital of the Corporation is as follows:
Name of Shareholder Percentage of shareholding (%)
Central Bank of Nigeria 42.5
United Bank for Africa Plc 10.7
Access Bank Plc 10.2
First Bank of Nigeria Limited 9.2
WEMPCO Limited 4.6*
Gloria Investment Limited 4.6*
* Related companies with combined shareholding of 9.2%
The Corporation's primary objective is to finance infrastructure (power, transportation, telecommunications,
heavy industry and natural resource) projects in Africa and to provide advisory, project development and other
services related thereto. The Corporation also provides trade finance facilities to facilitate African trade.
The Corporation commenced operations on 1 November 2007, after certain conditions prescribed in its
constitutive instruments were fulfilled.
The financial statements for the period ended 31 December, 2015 were authorised and approved for issue by
the Board of Directors on 22 February, 2016.
NOTESTO THE CONSOLIDATED FINANCIAL STATEMENTS
51
INFRA
STRU
CTU
RE F
INA
NC
ING
| TH
E A
RT O
F LO
NG
TERM
VIS
ION
AFC / 2015 ANNUAL REPORT & ACCOUNTS

2. Summary of significant accounting policies
The Principal accounting policies applied in the preparation of these financial statements are set out
below. These policies have been consistently applied, unless otherwise stated.
2.1 Basis of preparation
The Corporation's financial statements have been prepared in accordance with International Financial
Reporting Standards (IFRS) as issued by the International Accounting Standards Board (IASB). The
financial statements are presented in United States dollars (US$) rounded to the nearest thousand. The
financial statements have been prepared under the historical cost convention, except for derivative
financial instruments, available-for-sale financial assets, financial assets and financial liabilities held at fair
value through profit or loss, which have been measured at fair value.
The financial statements comprise the statement of comprehensive income, the statement of financial
position, the statement of changes in equity, the statement of cash flows and explanatory notes.
The statement of cash flows shows the change in cash and cash equivalents during the year from
operating, financing and investing activities. Cash and cash equivalents include highly liquid investments.
Note 31 shows which items of the statement of financial position are included in cash and cash
equivalents.
The cash flow from operating activities is determined using the direct method. The Corporation's
assignment of cash flows to operating, financing and investing categories depends on the Corporation's
business model (management approach).
The preparation of financial statements in conformity with IFRS requires the use of certain critical
accounting estimates. It also requires the directors to exercise judgement in the process of applying the
Corporation's accounting policies. Changes in assumptions may have a significant impact on the
financial statements in the period the assumptions changed. The areas involving a higher degree of
judgement or complexity, or areas where assumptions and estimates are significant to the financial
statements, are disclosed in Note 4.
2.1.1 Changes in accounting policy and disclosures
(a) New and amended standards adopted by the Corporation
It is important to note that no standards or amendments to existing standards took effect during
the reporting period. Hence, there was no impact on the accounting policies, financial position
or performance of the Corporation.
(b) New standards, amendments and interpretations that are not yet effective have not been
adopted early by the Corporation.
No new standard with annual periods beginning after 1 January 2016 is expected to have an
effect on the financial statements of the Corporation, except the following:
52
NOTES TO THE CONSOLIDATED FINANCIAL STATEMENTS
INFRA
STRU
CTU
RE F
INA
NC
ING
| T
HE A
RT O
F L
ON
G T
ERM
VIS
ION
AFC / 2015 ANNUAL REPORT & ACCOUNTS

i. IFRS 9, 'Financial instruments', addresses the classification, measurement and recognition of
financial assets and financial liabilities. Issued in November 2009 and October 2010, it
replaces the parts of IAS 39 that relate to the classification and measurement of financial
instruments. IFRS 9 requires financial assets to be classified into two measurement categories:
those measured at fair value and those measured at amortised cost. The determination is made
at initial recognition. The classification depends on the entity's business model for managing its
financial instruments and the contractual cash flow characteristics of the instrument. For financial
liabilities, the standard retains most of the IAS 39 requirements. The main change is that, in cases
where the fair value option is taken for financial liabilities, the part of a fair value change due to
an entity's own credit risk is recorded in other comprehensive income rather than the statement of
comprehensive income, unless this creates an accounting mismatch. Given the nature of the
Corporation's operations, the standard is expected to have a pervasive impact on the financial
statements. In particular, the calculation of impairment loss using the expected credit loss model
could result in an overall increase in impairment charges.
ii. Amendment to IFRS 11, 'Joint arrangements' on acquisition of an interest in a joint operation. -
This amendment adds new guidance on how to account for the acquisition of an interest in a
joint operation that constitutes a business. The amendments specify the appropriate accounting
treatment for such acquisitions. This amendment will have no significant effect on the
Corporation's financials when effective.
iii. Amendment to IAS 16, 'Property, plant and equipment' and IAS 38,'Intangible assets', on
depreciation and amortisation. - In this amendment the IASB has clarified that the use of revenue
based methods to calculate the depreciation of an asset is not appropriate because revenue
generated by an activity that includes the use of an asset generally reflects factors other than the
consumption of the economic benefits embodied in the asset. The IASB has also clarified that
revenue is generally presumed to be an inappropriate basis for measuring the consumption of
the economic benefits embodied in an intangible asset. This amendment will have no significant
effect on the Corporation's financials when effective.
iv. Amendments to IFRS 10, 'Consolidated financial statements' and IAS 28,'Investments in
associates and joint ventures' on sale or contribution of assets' - The IASB has issued this
amendment to eliminate the inconsistency between IFRS 10 and IAS 28. If the non-monetary
assets sold or contributed to an associate or joint venture constitute a 'business', then the full gain
or loss will be recognised by the investor. A partial gain or loss is recognised when a transaction
involves assets that do not constitute a business, even if these assets are housed in a subsidiary.
This amendment will have no significant effect on the Corporation's financials when effective.
v. Amendments to IFRS 10, 'Consolidated financial statements' and IAS 28,'Investments in
associates and joint ventures' on applying the consolidation exemption' - The amendments clarify
the application of the consolidation exception for investment entities and their subsidiaries. This
amendment will have no significant effect on the Corporation's financials when effective.
vi Amendments to IAS 1,'Presentation of financial statements' disclosure initiative'- In December
2014 the IASB issued amendments to clarify guidance in IAS 1 on materiality and aggregation,
the presentation of subtotals, the structure of financial statements and the disclosure of
53
NOTES TO THE CONSOLIDATED FINANCIAL STATEMENTS
INFRA
STRU
CTU
RE F
INA
NC
ING
| TH
E A
RT O
F LO
NG
TERM
VIS
ION
AFC / 2015 ANNUAL REPORT & ACCOUNTS

accounting policies. This amendment will have no significant effect on the Corporation's
financials when effective.
vii IFRS 15 – Revenue from contracts with customers - The FASB and IASB issued their long awaited
converged standard on revenue recognition on 29 May 2014. It is a single, comprehensive
revenue recognition model for all contracts with customers to achieve greater consistency in the
recognition and presentation of revenue. Revenue is recognised based on the satisfaction of
performance obligations, which occurs when control of good or service transfers to a customer.
This amendment will have no significant effect on the Corporation's financials when effective.
There are no other IFRSs or IFRIC interpretations that are not yet effective that would be expected to have a
material impact on the Corporation.
Annual Improvements 2012 issued December 2013
Improvements to IFRSs (Issued Dec 2013) was issued by the IASB as part of the 'annual improvements
process' resulting in the following amendments to standards issued, but effective for the first time for 31
December 2015 year-ends:
IFRS Effective Date Subject of amendment
Amendment to IFRS 2, 'Share based payment’
1 July 2014 The amendment clarifies the definition of a 'vesting condition' and separately defines 'performance condition' and 'service condition'. This amendment does not affect the Corporation's accounting policies or any of the disclosures.
Amendment to IFRS 3, 'Business combinations’
1 July 2014 The standard is amended to clarify that an obligation to pay contingent consideration which meets the definition of a financial instrument is classified as a financial liability or as equity, on the basis of the definitions in IAS 32, 'Financial instruments: Presentation'.
The standard is further amended to clarify that all non-equity contingent consideration, both financial and non-financial, is measured at fair value at each reporting date, with changes in fair value recognised in profit and loss.
Consequential changes are also made to IFRS 9, IAS 37 and IAS 39. This amendment does not affect the Corporation's accounting policies or any of the disclosures.
Amendment to IFRS 8, 'Operating segments’
1 July 2014 The standard is amended to require disclosure of the judgements made by management in aggregating operating segments. This includes a description of the segments which have been aggregated and the economic indicators which have been assessed in determining that the aggregated segments share similar economic characteristics.
The standard is further amended to require a reconciliation of segment assets to the entity's assets when segment assets are reported. This amendment does not affect the Corporation's accounting policies or any of the disclosures.
54
NOTES TO THE CONSOLIDATED FINANCIAL STATEMENTS
INFRA
STRU
CTU
RE F
INA
NC
ING
| T
HE A
RT O
F L
ON
G T
ERM
VIS
ION
AFC / 2015 ANNUAL REPORT & ACCOUNTS
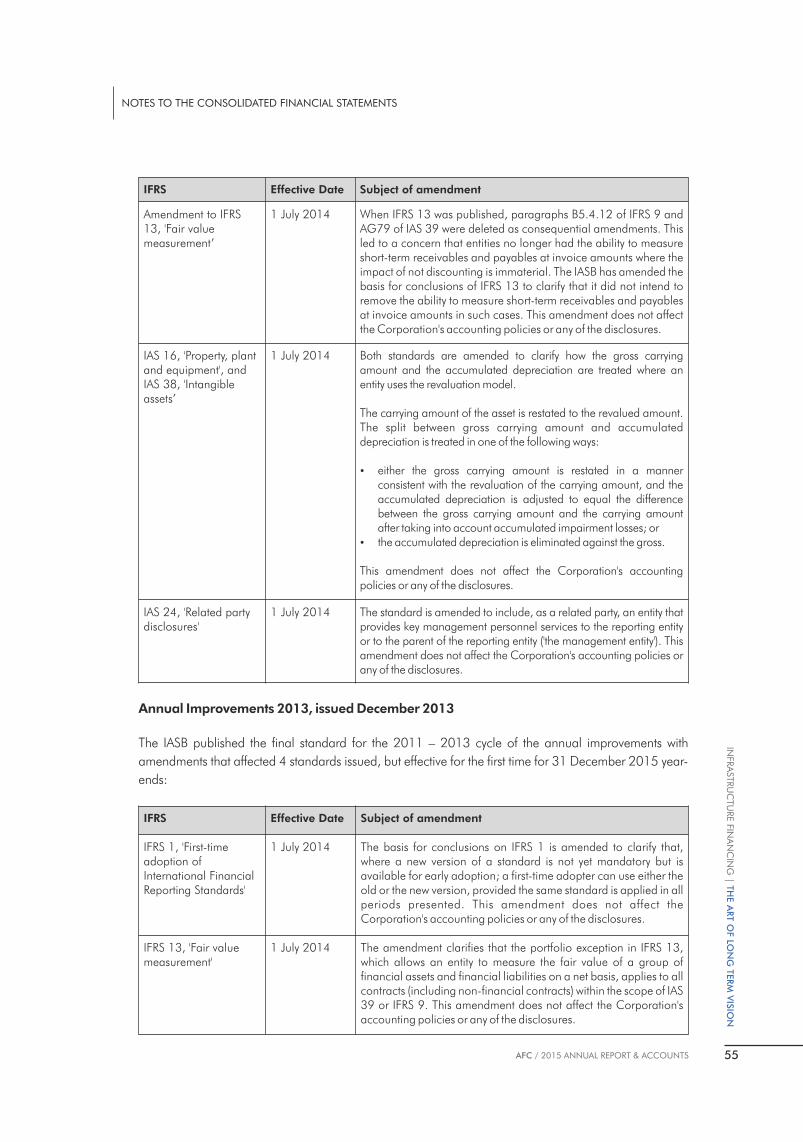
IFRS Effective Date Subject of amendment
Amendment to IFRS 13, 'Fair value measurement’
1 July 2014 When IFRS 13 was published, paragraphs B5.4.12 of IFRS 9 and AG79 of IAS 39 were deleted as consequential amendments. This led to a concern that entities no longer had the ability to measure short-term receivables and payables at invoice amounts where the impact of not discounting is immaterial. The IASB has amended the basis for conclusions of IFRS 13 to clarify that it did not intend to remove the ability to measure short-term receivables and payables at invoice amounts in such cases. This amendment does not affect the Corporation's accounting policies or any of the disclosures.
IAS 16, 'Property, plant and equipment', and IAS 38, 'Intangible assets’
1 July 2014 Both standards are amended to clarify how the gross carrying amount and the accumulated depreciation are treated where an entity uses the revaluation model.
The carrying amount of the asset is restated to the revalued amount. The split between gross carrying amount and accumulated depreciation is treated in one of the following ways:
Ÿ either the gross carrying amount is restated in a manner consistent with the revaluation of the carrying amount, and the accumulated depreciation is adjusted to equal the difference between the gross carrying amount and the carrying amount after taking into account accumulated impairment losses; or
Ÿ the accumulated depreciation is eliminated against the gross.
This amendment does not affect the Corporation's accounting policies or any of the disclosures.
IAS 24, 'Related party disclosures'
1 July 2014 The standard is amended to include, as a related party, an entity that provides key management personnel services to the reporting entity or to the parent of the reporting entity ('the management entity'). This amendment does not affect the Corporation's accounting policies or any of the disclosures.
Annual Improvements 2013, issued December 2013
The IASB published the final standard for the 2011 – 2013 cycle of the annual improvements with
amendments that affected 4 standards issued, but effective for the first time for 31 December 2015 year-
ends:
IFRS Effective Date Subject of amendment
IFRS 1, 'First-time adoption of International Financial Reporting Standards'
1 July 2014 The basis for conclusions on IFRS 1 is amended to clarify that, where a new version of a standard is not yet mandatory but is available for early adoption; a first-time adopter can use either the old or the new version, provided the same standard is applied in all periods presented. This amendment does not affect the Corporation's accounting policies or any of the disclosures.
IFRS 13, 'Fair value measurement'
1 July 2014 The amendment clarifies that the portfolio exception in IFRS 13, which allows an entity to measure the fair value of a group of financial assets and financial liabilities on a net basis, applies to all contracts (including non-financial contracts) within the scope of IAS 39 or IFRS 9. This amendment does not affect the Corporation's accounting policies or any of the disclosures.
55
NOTES TO THE CONSOLIDATED FINANCIAL STATEMENTS
INFRA
STRU
CTU
RE F
INA
NC
ING
| TH
E A
RT O
F LO
NG
TERM
VIS
ION
AFC / 2015 ANNUAL REPORT & ACCOUNTS
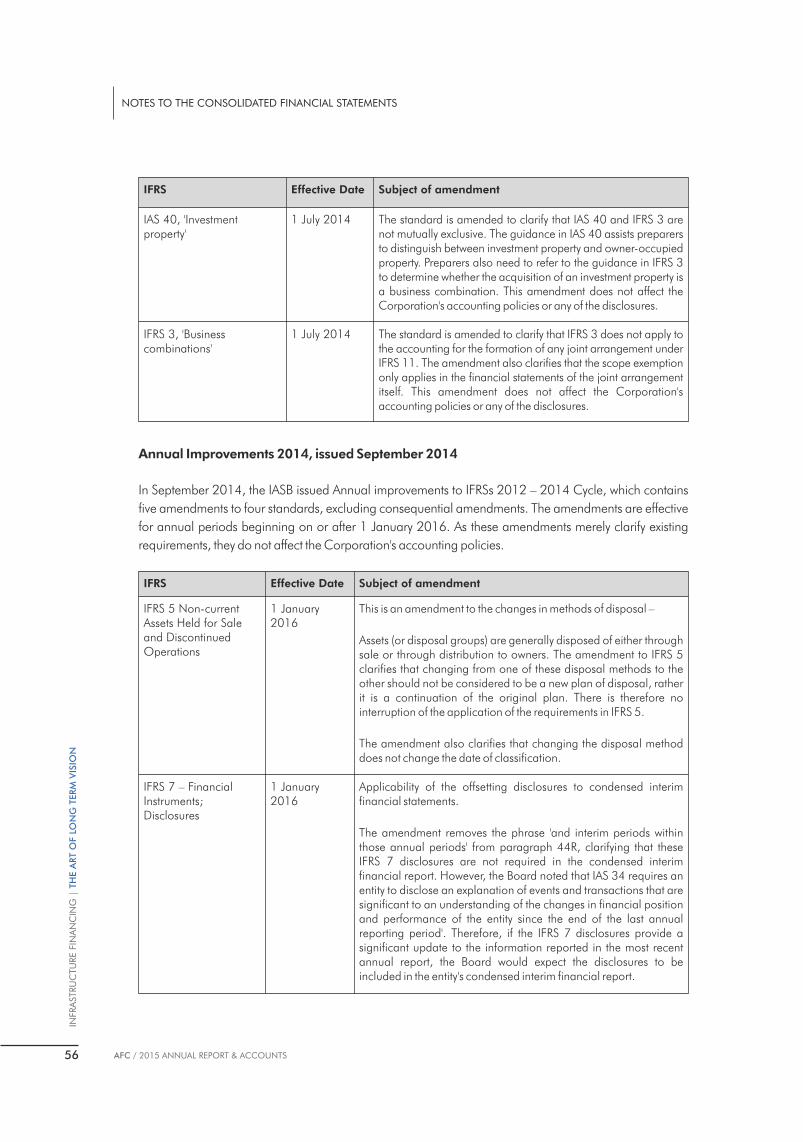
IFRS Effective Date Subject of amendment
IAS 40, 'Investment property'
1 July 2014 The standard is amended to clarify that IAS 40 and IFRS 3 are not mutually exclusive. The guidance in IAS 40 assists preparers to distinguish between investment property and owner-occupied property. Preparers also need to refer to the guidance in IFRS 3 to determine whether the acquisition of an investment property is a business combination. This amendment does not affect the Corporation's accounting policies or any of the disclosures.
IFRS 3, 'Business combinations'
1 July 2014 The standard is amended to clarify that IFRS 3 does not apply to the accounting for the formation of any joint arrangement under IFRS 11. The amendment also clarifies that the scope exemption only applies in the financial statements of the joint arrangement itself. This amendment does not affect the Corporation's accounting policies or any of the disclosures.
Annual Improvements 2014, issued September 2014
In September 2014, the IASB issued Annual improvements to IFRSs 2012 – 2014 Cycle, which contains
five amendments to four standards, excluding consequential amendments. The amendments are effective
for annual periods beginning on or after 1 January 2016. As these amendments merely clarify existing
requirements, they do not affect the Corporation's accounting policies.
IFRS Effective Date Subject of amendment
IFRS 5 Non-current Assets Held for Sale and Discontinued Operations
1 January 2016
This is an amendment to the changes in methods of disposal –
Assets (or disposal groups) are generally disposed of either through sale or through distribution to owners. The amendment to IFRS 5 clarifies that changing from one of these disposal methods to the other should not be considered to be a new plan of disposal, rather it is a continuation of the original plan. There is therefore no interruption of the application of the requirements in IFRS 5.
The amendment also clarifies that changing the disposal method does not change the date of classification.
IFRS 7 – Financial Instruments; Disclosures
1 January 2016
Applicability of the offsetting disclosures to condensed interim financial statements.
The amendment removes the phrase 'and interim periods within those annual periods' from paragraph 44R, clarifying that these IFRS 7 disclosures are not required in the condensed interim financial report. However, the Board noted that IAS 34 requires an entity to disclose an explanation of events and transactions that are significant to an understanding of the changes in financial position and performance of the entity since the end of the last annual reporting period'. Therefore, if the IFRS 7 disclosures provide a significant update to the information reported in the most recent annual report, the Board would expect the disclosures to be included in the entity's condensed interim financial report.
56
NOTES TO THE CONSOLIDATED FINANCIAL STATEMENTS
INFRA
STRU
CTU
RE F
INA
NC
ING
| T
HE A
RT O
F L
ON
G T
ERM
VIS
ION
AFC / 2015 ANNUAL REPORT & ACCOUNTS
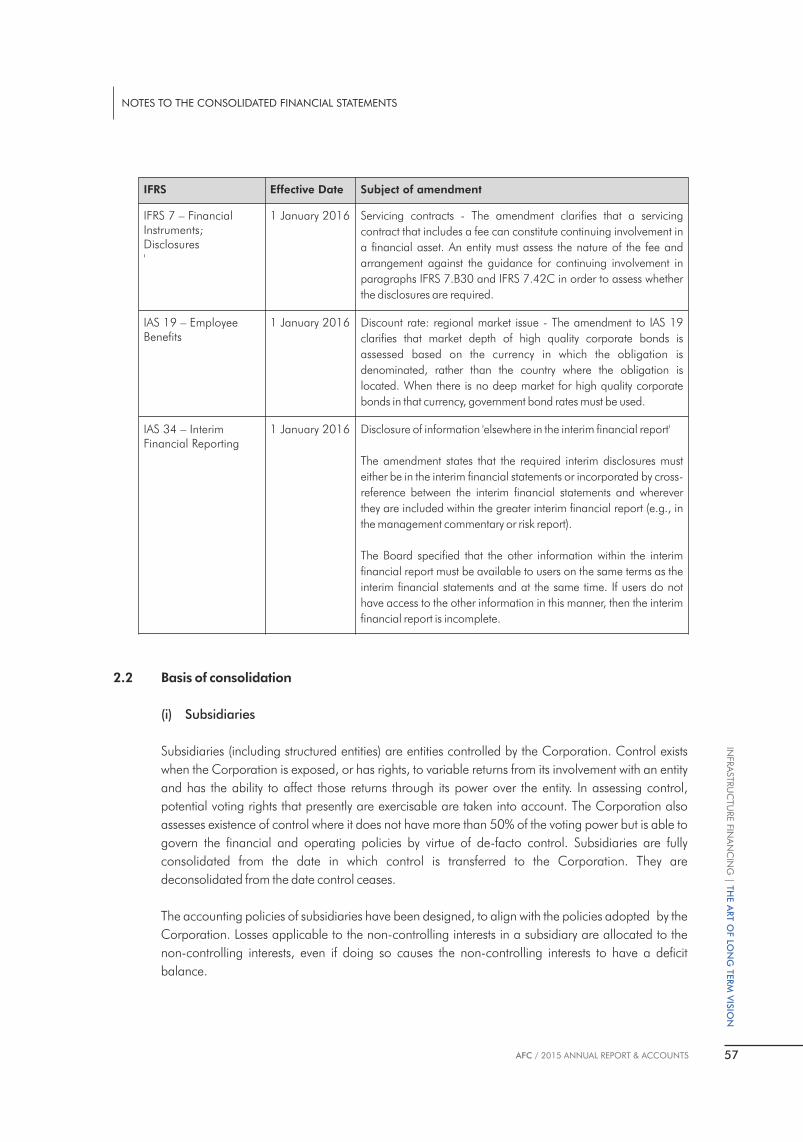
IFRS Effective Date Subject of amendment
IFRS 7 – Financial Instruments; Disclosures'
1 January 2016 Servicing contracts - The amendment clarifies that a servicing
contract that includes a fee can constitute continuing involvement in
a financial asset. An entity must assess the nature of the fee and
arrangement against the guidance for continuing involvement in
paragraphs IFRS 7.B30 and IFRS 7.42C in order to assess whether
the disclosures are required.
IAS 19 – Employee Benefits
1 January 2016 Discount rate: regional market issue - The amendment to IAS 19
clarifies that market depth of high quality corporate bonds is
assessed based on the currency in which the obligation is
denominated, rather than the country where the obligation is
located. When there is no deep market for high quality corporate
bonds in that currency, government bond rates must be used.
IAS 34 – Interim Financial Reporting
1 January 2016 Disclosure of information 'elsewhere in the interim financial report'
The amendment states that the required interim disclosures must
either be in the interim financial statements or incorporated by cross-
reference between the interim financial statements and wherever
they are included within the greater interim financial report (e.g., in
the management commentary or risk report).
The Board specified that the other information within the interim
financial report must be available to users on the same terms as the
interim financial statements and at the same time. If users do not
have access to the other information in this manner, then the interim
financial report is incomplete.
2.2 Basis of consolidation
(i) Subsidiaries
Subsidiaries (including structured entities) are entities controlled by the Corporation. Control exists
when the Corporation is exposed, or has rights, to variable returns from its involvement with an entity
and has the ability to affect those returns through its power over the entity. In assessing control,
potential voting rights that presently are exercisable are taken into account. The Corporation also
assesses existence of control where it does not have more than 50% of the voting power but is able to
govern the financial and operating policies by virtue of de-facto control. Subsidiaries are fully
consolidated from the date in which control is transferred to the Corporation. They are
deconsolidated from the date control ceases.
The accounting policies of subsidiaries have been designed, to align with the policies adopted by the
Corporation. Losses applicable to the non-controlling interests in a subsidiary are allocated to the
non-controlling interests, even if doing so causes the non-controlling interests to have a deficit
balance.
57
NOTES TO THE CONSOLIDATED FINANCIAL STATEMENTS
INFRA
STRU
CTU
RE F
INA
NC
ING
| TH
E A
RT O
F LO
NG
TERM
VIS
ION
AFC / 2015 ANNUAL REPORT & ACCOUNTS
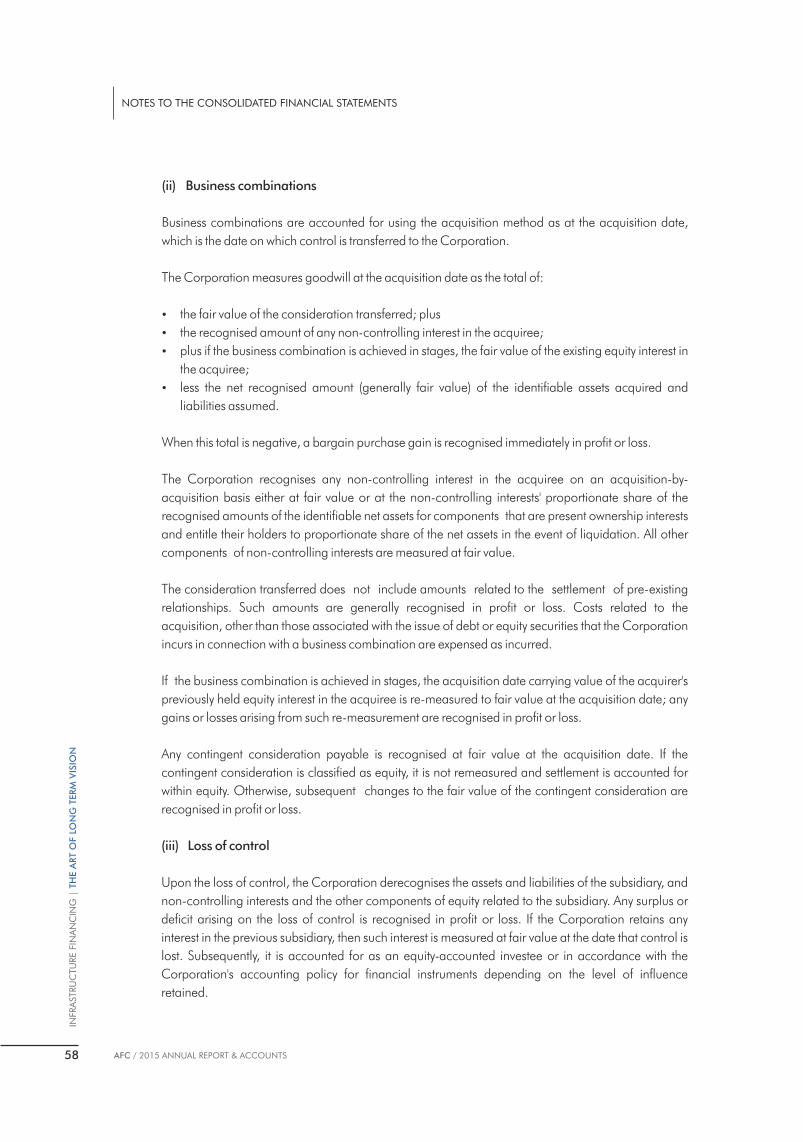
(ii) Business combinations
Business combinations are accounted for using the acquisition method as at the acquisition date,
which is the date on which control is transferred to the Corporation.
The Corporation measures goodwill at the acquisition date as the total of:
Ÿ the fair value of the consideration transferred; plus
Ÿ the recognised amount of any non-controlling interest in the acquiree;
Ÿ plus if the business combination is achieved in stages, the fair value of the existing equity interest in
the acquiree;
Ÿ less the net recognised amount (generally fair value) of the identifiable assets acquired and
liabilities assumed.
When this total is negative, a bargain purchase gain is recognised immediately in profit or loss.
The Corporation recognises any non-controlling interest in the acquiree on an acquisition-by-
acquisition basis either at fair value or at the non-controlling interests' proportionate share of the
recognised amounts of the identifiable net assets for components that are present ownership interests
and entitle their holders to proportionate share of the net assets in the event of liquidation. All other
components of non-controlling interests are measured at fair value.
The consideration transferred does not include amounts related to the settlement of pre-existing
relationships. Such amounts are generally recognised in profit or loss. Costs related to the
acquisition, other than those associated with the issue of debt or equity securities that the Corporation
incurs in connection with a business combination are expensed as incurred.
If the business combination is achieved in stages, the acquisition date carrying value of the acquirer's
previously held equity interest in the acquiree is re-measured to fair value at the acquisition date; any
gains or losses arising from such re-measurement are recognised in profit or loss.
Any contingent consideration payable is recognised at fair value at the acquisition date. If the
contingent consideration is classified as equity, it is not remeasured and settlement is accounted for
within equity. Otherwise, subsequent changes to the fair value of the contingent consideration are
recognised in profit or loss.
(iii) Loss of control
Upon the loss of control, the Corporation derecognises the assets and liabilities of the subsidiary, and
non-controlling interests and the other components of equity related to the subsidiary. Any surplus or
deficit arising on the loss of control is recognised in profit or loss. If the Corporation retains any
interest in the previous subsidiary, then such interest is measured at fair value at the date that control is
lost. Subsequently, it is accounted for as an equity-accounted investee or in accordance with the
Corporation's accounting policy for financial instruments depending on the level of influence
retained.
58
NOTES TO THE CONSOLIDATED FINANCIAL STATEMENTS
INFRA
STRU
CTU
RE F
INA
NC
ING
| T
HE A
RT O
F L
ON
G T
ERM
VIS
ION
AFC / 2015 ANNUAL REPORT & ACCOUNTS

(iv) Acquisitions under common control
Business combinations between entities that are under common control are accounted for at book
values. The assets and liabilities acquired or transferred are recognised or derecognised at the
carrying amounts previously recognised in the Corporation controlling shareholder's consolidated
financial statements. The components of equity of the acquired entities are added to the same
components within the Corporation equity and any gain/loss arising is recognised directly in equity.
(v) Transactions eliminated on consolidation
Intra-Corporation balances and any unrealised gains or losses or incomes and expenses arising from
intra-Corporation transactions, are eliminated in preparing the consolidated financial statements.
Unrealised gains arising from transactions with associates are eliminated to the extent of the
Corporation's interest in the entity. Unrealised losses are eliminated in the same way as unrealised
gains, but only to the extent that there is no evidence of impairment.
2.3 Foreign currency translation
a) Functional and presentation currency
Items presented in the Corporation's financial statements are measured in its functional currency
(United States dollars) and figures are stated in thousands of dollars.
b) Transactions and balances
Foreign currency transactions are translated into the functional currency using the exchange rates
prevailing at the dates of the transactions. Foreign exchange gains and losses resulting from the
settlement of such transactions and from the translation at year-end exchange rates of monetary
assets and liabilities denominated in foreign currencies are recognised in the statement of
comprehensive income.
Monetary items denominated in foreign currency are translated with the closing rate as at the
reporting date. Non-monetary items measured at historical cost denominated in a foreign currency
are translated with the exchange rate as at the date of initial recognition; non-monetary items in a
foreign currency that are measured at fair value are translated using the exchange rates at the date
when the fair value was determined.
Changes in the fair value of monetary securities denominated in foreign currency classified as
available-for-sale are analysed between translation differences resulting from changes in the
amortised cost of the security and other changes in the carrying amount of the security. Translation
differences related to changes in the amortised cost are recognised in profit or loss, and other
changes in the carrying amount are recognised in other comprehensive income.
Translation differences on non-monetary items, such as equities held at fair value through profit or
loss are reported as part of the fair value gain or loss. Translation differences on non-monetary items,
such as equities classified as available-for-sale financial assets, are included in the other
comprehensive income.
59
NOTES TO THE CONSOLIDATED FINANCIAL STATEMENTS
INFRA
STRU
CTU
RE F
INA
NC
ING
| TH
E A
RT O
F LO
NG
TERM
VIS
ION
AFC / 2015 ANNUAL REPORT & ACCOUNTS
2.4 Financial assets and liabilities
All financial assets and liabilities, which include derivative financial instruments, have to be
recognised in the statement of financial position and measured in accordance with their assigned
category.
2.4.1 Financial Assets
The Corporation classifies its financial assets in the following categories: financial assets at fair value
through profit or loss; loans and receivables; held-to-maturity investments; and available-for-sale
financial assets. Management determines the classification at initial recognition. The Corporation
uses trade date accounting for regular way contracts when recording financial asset transactions (see
note 3.6 on financial instruments by category).
(a) Financial assets at fair value through profit or loss
This category has two sub-categories: financial assets held for trading, and those designated at
fair value through profit or loss at inception.
A financial asset is classified as held for trading if it is acquired or incurred principally for the
purpose of selling or repurchasing it in the near term or if it is part of a portfolio of identified
financial instruments that are managed together and for which there is evidence of a recent
actual pattern of short-term profit-taking. Derivatives are also categorised as held for trading
unless they are designated and effective as hedging instruments. All derivatives are carried as
assets when fair value is positive and as liabilities when fair value is negative. Financial assets
held for trading consist of debt instruments, including money-market paper, traded corporate
loans, and equity instruments, as well as financial assets with embedded derivatives. They are
recognised in the statement of financial position as 'Financial assets held for trading'. There were
no such assets in the current year.
The Corporation designates certain financial assets upon initial recognition as at fair value
through profit or loss (fair value option). This designation cannot subsequently be changed and
can only be applied when the following conditions are met:
Ÿ the application of the fair value option reduces or eliminates an accounting mismatch that
would otherwise arise or
Ÿ the financial assets are part of a portfolio of financial instruments which is risk managed and
reported to senior management on a fair value basis or
Ÿ the financial assets consist of debt host and an embedded derivative that must be separated.
Financial instruments included in this category are recognised initially at fair value; transaction
costs are taken directly to profit or loss. Gains and losses arising from changes in fair value are
included directly in profit or loss and are reported as 'Net gains/(losses) on financial instruments
at fair value through profit or loss.' Interest income and expense and dividend income and
expenses on financial assets held for trading are included in 'Net interest income' or 'Dividend
income', respectively.
60
NOTES TO THE CONSOLIDATED FINANCIAL STATEMENTS
INFRA
STRU
CTU
RE F
INA
NC
ING
| T
HE A
RT O
F L
ON
G T
ERM
VIS
ION
AFC / 2015 ANNUAL REPORT & ACCOUNTS
Equity investments that result in the Corporation having control over the financial and operating
policies of the investee companies are carried in the statement of financial position at fair value
through profit or loss rather than accounted for as subsidiary and consolidated. This treatment is
permitted under IFRS 10 on Consolidated financial statement and IFRS 12 on Disclosure of
interest in other entities, which require investments held by Investment Entities to be accounted
for at fair value through profit or loss in accordance with IAS 39 with changes in fair value
recognised in the income statement in the period of the change.
(b) Loans and receivables
Loans and receivables are non-derivative financial assets with fixed or determinable payments
that are not quoted in an active market, other than:
(a) those that the Corporation intends to sell immediately or in the short term, which are
classified as held for trading, and those that the Corporation upon initial recognition
designates at fair value through profit or loss; or
(b) those that the Corporation upon initial recognition designates as available-for-sale; or
(c) those for which the Corporation may not recover substantially all of its initial investment,
other than because of credit deterioration.
Loans and receivables are initially recognised at fair value – which is the cash consideration to
originate or purchase the loan including any transaction costs – and measured subsequently at
amortised cost using the effective interest method.
(c) Held-to-maturity
Held-to-maturity investments are non-derivative financial assets with fixed or determinable
payments and fixed maturities that the Corporation's management has the positive intention and
ability to hold to maturity, other than:
(a) those that the Corporation upon initial recognition designates at fair value through profit or
loss;
(b) those that the Corporation designates as available-for-sale; and
(c) those that meet the definition of loans and receivables.
These are initially recognised at fair value including direct and incremental transaction costs and
measured subsequently at amortised cost, using the effective interest method.
Interest on held-to-maturity investments is included in the statement of comprehensive income
and reported as 'interest income'. In the case of an impairment, the impairment loss is reported as
a deduction from the carrying value of the investment and recognised in the statement of
comprehensive income as 'net gains/(losses) on investments. Held-to-maturity investments are
corporate and sovereign securities.
61
NOTES TO THE CONSOLIDATED FINANCIAL STATEMENTS
INFRA
STRU
CTU
RE F
INA
NC
ING
| TH
E A
RT O
F LO
NG
TERM
VIS
ION
AFC / 2015 ANNUAL REPORT & ACCOUNTS
(d) Available-for-Sale
Available-for-sale investments are those intended to be held for an indefinite period of time,
which may be sold in response to needs for liquidity or changes in interest rates, exchange rates
or equity prices or that are not classified as loans and receivables, held-to-maturity investments
or financial assets at fair value through profit or loss.
Available-for-sale investments are recognized initially at fair value plus transaction costs and are
subsequently carried at fair value. Gains or losses arising from remeasurement are recognized in
other comprehensive income except for exchange gains and losses on the translation of debt
securities, which are recognized in the statement of comprehensive income. When an available-
for-sale investment is sold or impaired, the accumulated gains or losses are moved from other
comprehensive income to the income statement and are included in “other gains and losses
(net)”.
Available-for-sale investments are classified as non-current, unless an investment matures within
twelve months, or management expects to dispose of it within twelve months. Interest on
available-for-sale debt instruments, calculated using the effective interest method, is recognized
in the statement of income as part of interest income. Dividends on available-for-sale equity
instruments are recognized in the statement of comprehensive income as dividend income when
the Corporation's right to receive payment is established.
2.4.2 Financial Liabilities
The Corporation's holding in financial liabilities represents mainly borrowings and other liabilities.
Such financial liabilities are initially recognised at fair value and subsequently measured at amortised
cost.
(a) Financial liabilities at fair value through profit or loss
This category comprises two sub-categories: financial liabilities classified as held for trading and
financial liabilities designated by the Corporation at fair value through profit or loss upon initial
recognition.
A financial liability is classified as held for trading if it is acquired or incurred principally for the
purpose of selling or repurchasing it in the near term or if it is part of a portfolio of identified
financial instruments that are managed together and for which there is evidence of a recent
actual pattern of short-term profit-taking. Derivatives are also categorised as held for trading
unless they are designated and effective as hedging instruments. Financial liabilities held for
trading also include obligations to deliver financial assets borrowed where the Corporation is a
short seller. Those financial instruments are recognised in the statement of financial position as
'Financial liabilites held for trading'.
Gains and losses arising from changes in fair value of financial liabilities classified as held for
trading are included in the statement of comprehensive income and are reported as 'Net
gains/(losses) on financial instruments at fair value through profit or loss'. Interest expenses on
62
NOTES TO THE CONSOLIDATED FINANCIAL STATEMENTS
INFRA
STRU
CTU
RE F
INA
NC
ING
| T
HE A
RT O
F L
ON
G T
ERM
VIS
ION
AFC / 2015 ANNUAL REPORT & ACCOUNTS

financial liabilities held for trading are included in 'Net interest income'.
Where the Corporation designates certain debt securities upon initial recognition as at fair value
through profit or loss (fair value option); this designation cannot be changed subsequently.
There are no financial liabilities classified as held for trading or specifically designated at fair
value through profit or loss as at 31 December 2015.
(b) Other liabilities measured at amortised cost
Financial liabilities that are not classified at fair value through profit or loss fall into this category
and are measured at amortised cost. Financial liabilities measured at amortised cost are
borrowings, debt securities in issue for which the fair value option are not applied, convertible
bonds and subordinated debts.
2.4.3 Determination of fair value
'Fair value' is the price that would be received to sell an asset or paid to transfer a liability in an orderly
transaction between market participants at the measurement date in the principal or, in its absence,
the most advantageous market to which the Corporation has access at that date. The fair value of a
liability reflects its non-performance risk. When available, the Corporation measures the fair value of
an instrument using the quoted price in an active market for that instrument. A market is regarded as
active if transactions for the asset or liability take place with sufficient frequency and volume to provide
pricing information on an ongoing basis. If there is no quoted price in an active market, then the
Corporation uses valuation techniques that maximise the use of relevant observable inputs and
minimise the use of unobservable inputs. The chosen valuation technique incorporates all of the
factors that market participants would take into account in pricing a transaction.
The best evidence of the fair value of a financial instrument at initial recognition is normally the
transaction price – i.e. the fair value of the consideration given or received. If the Corporation
determines that the fair value at initial recognition differs from the transaction price and the fair value
is evidenced neither by a quoted price in an active market for an identical asset or liability nor based
on a valuation technique that uses only data from observable markets, then the financial instrument is
initially measured at fair value, adjusted to defer the difference between the fair value at initial
recognition and the transaction price. Subsequently, that difference is recognised in profit or loss on
an appropriate basis over the life of the instrument but no later than when the valuation is wholly
supported by observable market data or the transaction is closed out.
If an asset or a liability measured at fair value has a bid price and an ask price, then the Corporation
measures assets and long positions at a bid price and liabilities and short positions at an ask price.
Portfolios of financial assets and financial liabilities that are exposed to market risk and credit risk that
are managed by the Corporation on the basis of the net exposure to either market or credit risk are
measured on the basis of a price that would be received to sell a net long position (or paid to transfer
a net short position) for a particular risk exposure. Those portfolio-level adjustments are allocated to
the individual assets and liabilities on the basis of the relative risk adjustment of each of the individual
instruments in the portfolio.
63
NOTES TO THE CONSOLIDATED FINANCIAL STATEMENTS
INFRA
STRU
CTU
RE F
INA
NC
ING
| TH
E A
RT O
F LO
NG
TERM
VIS
ION
AFC / 2015 ANNUAL REPORT & ACCOUNTS
The Corporation, in circumstances whereby this is applicable, uses widely recognised valuation
models for determining fair values of non-standardised financial instruments of lower complexity.
Inputs into models are generally market-observable for these financial instruments.
For more complex instruments, the Corporation uses internally developed models, which are usually
based on valuation methods and techniques generally recognised as standard within the industry.
Valuation models are used primarily to value derivatives transacted in the over-the-counter market,
unlisted debt securities (including those with embedded derivatives), unlisted equity and other debt
instruments for which markets were or have become illiquid. Some of the inputs to these models may
not be market observable and are therefore estimated based on assumptions.
The output of a model is always an estimate or approximation of a value that cannot be determined
with certainty, and valuation techniques employed may not fully reflect all factors relevant to the
positions the Corporation holds. Valuations are therefore adjusted, where appropriate, to allow for
additional factors including model risks, liquidity risk and counterparty credit risk. Based on the
established fair value model governance policies, and related controls and procedures applied,
management believes that these valuation adjustments are necessary and appropriate to fairly state
the values of financial instruments carried at fair value in the statement of financial position. Price data
and parameters used in the measurement procedures applied are generally reviewed carefully and
adjusted, if necessary – particularly in view of current market developments.
In cases where the fair value of unlisted equity instruments cannot be determined reliably, the
instruments are carried at cost less impairment.
The fair value of contingent liabilities and irrevocable loan commitments correspond to their carrying
amounts.
2.4.4 Transfers of financial assets
The Corporation, in the ordinary course of business enters into transactions that result in the transfer
of financial assets, primarily debt securities. The transferred financial assets continue to be recognised
in their entirety or to the extent of the Corporation's continuing involvement, or are derecognised in
their entirety. The Corporation transfers financial assets, that are not derecognised in their entirety or
for which it has continuing involvement primarily through sale and repurchase of securities.
Sale and repurchase agreements' are transactions in which the Corporation sells a security and
simultaneously agrees to repurchase it (or an asset that is substantially the same) at a fixed price on a
future date. The Corporation continues to recognise the securities in their entirety in the statement of
financial position because it retains substantially all of the risks and rewards of ownership. The cash
consideration received is recognised as a financial asset and a financial liability is recognised for the
obligation to pay the repurchase price. Because the Corporation sells the contractual rights to the
cash flows of the securities, it does not have the ability to use the transferred assets during the term of
the arrangement.
64
NOTES TO THE CONSOLIDATED FINANCIAL STATEMENTS
INFRA
STRU
CTU
RE F
INA
NC
ING
| T
HE A
RT O
F L
ON
G T
ERM
VIS
ION
AFC / 2015 ANNUAL REPORT & ACCOUNTS
2.5 Derecognition
Financial assets are derecognised when the contractual rights to receive the cash flows from these
assets have ceased to exist or the assets have been transferred and substantially all the risks and
rewards of ownership of the assets are also transferred (that is, if substantially all the risks and rewards
have not been transferred, the Corporation tests control to ensure that continuing involvement on the
basis of any retained powers of control does not prevent derecognition). Financial liabilities are
derecognised when they have been redeemed or otherwise extinguished.
2.6 Reclassification of financial assets
The Corporation may choose to reclassify a non-derivative financial asset held for trading out of the
held for trading category if the financial asset is no longer held for the purpose of selling it in the near-
term. Financial assets other than loans and receivables are permitted to be reclassified out of the held
for trading category only in rare circumstances arising from a single event that is unusual and highly
unlikely to recur in the near-term. In addition, the Corporation may choose to reclassify financial
assets that would meet the definition of loans and receivables out of the held for trading or available-
for-sale categories if the Corporation has the intention and ability to hold these financial assets for the
foreseeable future or until maturity at the date of reclassification.
Reclassifications are made at fair value as of the reclassification date. Fair value becomes the new
cost or amortised cost as applicable, and no reversals of fair value gains or losses recorded before
reclassification date are subsequently made. Effective interest rates for financial assets reclassified to
loans and receivables and held-to-maturity categories are determined at the reclassification date.
Further increases in estimates of cash flows adjust effective interest rates prospectively. On
reclassification of a financial asset out of the 'at fair value through profit or loss' category, all
embedded derivatives are re-assessed and, if necessary, separately accounted for.
2.7 Offsetting financial instruments
Financial assets and liabilities are offset and the net amount reported in the Statement of financial
position when there is a legally enforceable right to offset the recognised amounts and there is an
intention to settle on a net basis, or realise the asset and settle the liability simultaneously.
2.8 Interest income and expense
Interest income and expense for all interest-bearing financial instruments are recognised within
'interest income' and 'interest expense' in the statement of comprehensive income using the effective
interest method.
The effective interest method is a method of calculating the amortised cost of a financial asset or a
financial liability and of allocating the interest income or interest expense over the relevant period.
The effective interest rate is the rate that exactly discounts estimated future cash payments or receipts
through the expected life of the financial instrument or, when appropriate, a shorter period to the net
carrying amount of the financial asset or financial liability. The calculation includes all fees paid or
received between parties to the contract that are an integral part of the effective interest rate,
transaction costs and all other premiums or discounts.
65
NOTES TO THE CONSOLIDATED FINANCIAL STATEMENTS
INFRA
STRU
CTU
RE F
INA
NC
ING
| TH
E A
RT O
F LO
NG
TERM
VIS
ION
AFC / 2015 ANNUAL REPORT & ACCOUNTS

Once a financial asset or a group of similar financial assets has been written down as a result of an
impairment loss, interest income is recognised using the rate of interest used to discount the future
cash flows for the purpose of measuring the impairment loss.
2.9 Fee and commission income
Fees and commissions are generally recognised on an accrual basis when the service has been
provided except for structuring fees (i.e. fees related to structuring, term sheet negotiation and
coordination) which are recognised at the completion of work. Commitment fees for loans that are
likely to be drawn down are deferred (together with related direct costs) and recognised as an
adjustment to the effective interest rate on the loan. Commission and fees arising from negotiating, or
participating in the negotiation of a transaction for a third party – such as the arrangement of the
acquisition of shares or other securities, or the purchase or sale of businesses – are recognised on
completion of the underlying transaction. Portfolio and other management advisory and service fees
are recognised based on the applicable service contracts, usually on a time-apportioned basis.
Performance-linked fees or fee components are recognised when the performance criteria are
fulfilled.
2.10 Sale and repurchase agreements
Securities sold subject to repurchase agreements 'repos' are reclassified in the financial statements as
pledged assets when the transferee has the right by contract or custom to sell or re-pledge the
collateral. Where this right to sell or re-pledge does not exist, the transferee does not reclassify the
assets but discloses the 'repos' as a note in the financial statements. the counterparty liability is
included in amounts due to other banks, deposits from banks, other deposits or deposits due to
customers, as appropriate. Securities purchased under agreements to resell (reverse repos) are
recorded as loans and advances to other banks or customers, as appropriate. The difference
between the sale and repurchase price is treated as interest and accrued over the life of the
agreements using the effective interest method. Securities lent to counterparties are also retained in
the financial statements.
2.11 Repossessed collateral
Repossessed collateral represents financial and non-financial assets acquired by the Corporation in
settlement of overdue loans. The assets are initially recognised at fair value when acquired and
included in the relevant assets depending on the nature and the Corporation's intention in respect of
recovery of these assets, and are subsequently remeasured and accounted for in accordance with the
accounting policies for these categories of assets.
2.12 Impairment of financial assets
a) Assets carried at amortised cost
The Corporation assesses at each statement of financial position date whether there is objective
evidence that a financial asset or a group of financial assets is impaired. A financial asset or a
group of financial assets is impaired and impairment losses are incurred only if there is objective
66
NOTES TO THE CONSOLIDATED FINANCIAL STATEMENTS
INFRA
STRU
CTU
RE F
INA
NC
ING
| T
HE A
RT O
F L
ON
G T
ERM
VIS
ION
AFC / 2015 ANNUAL REPORT & ACCOUNTS

evidence of impairment as a result of one or more events that occurred after initial recognition of
the asset (a loss event) and that loss event (or events) has an impact on the estimated future cash
flows of the financial asset or group of financial assets that can be reliably estimated. Objective
evidence that a financial asset or a group of assets is impaired includes observable data that
comes to the attention of the Corporation about the following loss events:-
a) significant financial difficulty of the borrower;
b) a breach of contract, such as default or delinquency in interest or principal repayments;
c) the corporation granting to the borrower, for economic or legal reasons relating to the
borrower's financial difficulty, a concession that the Corporation would not otherwise
consider;
d) it has become probable that the borrower will enter bankruptcy or other financial
reorganisation;
e) the disappearance of an active market for that financial asset because of financial
difficulties; or
f) observable data indicating that there is a measurable decrease in the estimated future cash
flows from a group of financial assets since the initial recognition of those assets, although
the decrease cannot yet be identified with the individual financial assets in the Corporation,
including:
- adverse changes in the payment status of borrowers from the Corporation; or
- national or local economic conditions that correlate with defaults on the assets in the
Corporation.
The Corporation first assesses whether objective evidence of impairment exists individually for
financial assets that are individually significant, and individually or collectively for financial assets
that are not individually significant. If the Corporation determines that no objective evidence of
impairment exists for an individually assessed financial asset, whether significant or not, it
includes the asset in a group of financial assets with similar credit risk characteristics and
collectively assesses them for impairment. Assets that are individually assessed for impairment
and for which an impairment loss is or continues to be recognised are not included in a collective
assessment of impairment.
The amount of the loss is measured as the difference between the asset's carrying amount and
the present value of estimated future cash flows (excluding future credit losses that have not been
incurred) discounted at the financial asset's original effective interest rate. The carrying amount of
the asset is reduced through the use of an allowance account and the amount of the loss is
recognised in the statement of comprehensive income. If a loan or held-to-maturity asset has a
variable interest rate, the discount rate for measuring any impairment loss is the current effective
interest rate determined under the contract. As a practical expedient, the Corporation may
measure impairment on the basis of an instrument's fair value using an observable market price.
The calculation of the present value of the estimated cash flows of a collateralised financial asset
reflects the cash flows that may result from foreclosure less costs for obtaining and selling the
collateral, whether or not the foreclosure is probable.
For the purposes of a collective evaluation of impairment, financial assets are grouped on the
67
NOTES TO THE CONSOLIDATED FINANCIAL STATEMENTS
INFRA
STRU
CTU
RE F
INA
NC
ING
| TH
E A
RT O
F LO
NG
TERM
VIS
ION
AFC / 2015 ANNUAL REPORT & ACCOUNTS

basis of similar credit risk characteristics (i.e. on the basis of the Corporation's grading process
that considers asset type, industry, geographical location, collateral type, past-due status and
other relevant factors). Those characteristics are relevant to the estimation of future cash flows for
groups of such assets by being indicative of the debtors' ability to pay all amounts due according
to the contractual terms of the assets being evaluated.
Future cash flows in a group of financial assets that are collectively evaluated for impairment are
estimated on the basis of the contractual cash flows of the assets in the Corporation and
historical loss experience for assets with credit risk characteristics similar to those in the
Corporation. Historical loss experience is adjusted on the basis of current observable data to
reflect the effects of current conditions that did not affect the period on which the historical loss
experience is based and to remove the effects of conditions in the historical period that do not
currently exist.
Estimates of changes in future cash flows for groups of assets should reflect, and be directionally
consistent with, changes in related observable data from period to period (for example, changes
in unemployment rates, property prices, payment status, or other factors indicative of changes in
the probability of losses in the Corporation and their magnitude). The methodology and
assumptions used for estimating future cash flows are reviewed regularly by the Corporation to
reduce any differences between loss estimates and actual loss experience.
When a loan is uncollectible, it is written off against the related provision for loan impairment.
Such loans are written off after all the necessary procedures have been completed and the
amount of the loss has been determined. Subsequent recoveries of amounts previously written
off decrease the amount of provision for loan impairment in the statement of comprehensive
income. If, in a subsequent period, the amount of the impairment loss decreases and the
decrease can be related objectively to an event occurring after the impairment was recognised
(such as an improvement in the debtor's credit rating), the previously recognised impairment loss
is reversed by adjusting the allowance account. The amount of the reversal is recognised in the
statement of comprehensive income when applicable.
(b) Assets classified as available-for-sale
The Corporation assesses at each statement of financial position date whether there is objective
evidence that a financial asset or a group of financial assets is impaired. In the case of equity
investments classified as available-for-sale, a significant or prolonged decline in the fair value of
the security below its cost is considered in determining whether the assets are impaired. If any
such evidence exists for available-for-sale financial assets, the cumulative loss – measured as the
difference between the acquisition cost and the current fair value, less any impairment loss on that
financial asset previously recognised in the statement of comprehensive income – is removed
from equity and recognised in the statement of comprehensive income. If, in a subsequent
period, the fair value of an equity investment classified as available-for-sale increases and the
increase can be objectively related to an event occurring after the impairment loss was
recognised in profit or loss, the impairment loss is reversed through Other Comprehensive
Income. For debt instruments classified as available for sale, the impairment loss is reversed
through profit or loss.
68
NOTES TO THE CONSOLIDATED FINANCIAL STATEMENTS
INFRA
STRU
CTU
RE F
INA
NC
ING
| T
HE A
RT O
F L
ON
G T
ERM
VIS
ION
AFC / 2015 ANNUAL REPORT & ACCOUNTS
2.13 Impairment of non-financial assets
Intangible assets that have an indefinite useful life are not subject to amortisation and are tested
annually for impairment. Assets are reviewed for impairment whenever events or changes in
circumstances indicate that the carrying amount may not be recoverable. An impairment loss is
recognised for the amount by which the asset's carrying amount exceeds its recoverable amount. The
recoverable amount is the higher of an asset's fair value less costs to sell and value in use. For the
purposes of assessing impairment, assets are grouped at the lowest levels for which there are
separately identifiable cash flows (cash-generating units). The impairment test also can be performed
on a single asset when the fair value less cost to sell or the value in use can be determined reliably.
Non-financial assets that suffered impairment are reviewed for possible reversal of the impairment at
each reporting date.
2.14 Cash and cash equivalents
For the purposes of the statement of cash flows, cash and cash equivalents comprise balances with
less than three month's maturity from the date of acquisition, including cash and non-restricted
balances with central banks, treasury bills and other eligible bills, loans and advances to banks,
amounts due from other banks and short term government securities.
2.15 Derivative financial instruments
Derivatives are initially recognised at fair value on the date on which a derivative contract is entered
into and are subsequently re-measured at their fair value. Fair values are obtained from quoted
market prices in active markets (for example, for exchange-traded options), including recent market
transactions, and valuation techniques (for example, for swaps and currency transactions) including
discounted cash flow models and options pricing models, as appropriate. All derivatives are carried
as assets when fair value is positive and as liabilities when fair value is negative.
Certain derivatives embedded in other financial instruments, such as the conversion option in a
purchased convertible bond, are treated as separate derivatives when their economic characteristics
and risks are not closely related to those of the host contract and the host contract is not carried at fair
value through profit or loss. These embedded derivatives are separately accounted for at fair value,
with changes in fair value recognised in the statement of comprehensive income unless the
Corporation chooses to designate the hybrid contracts at fair value through profit or loss.
Changes in the fair value of any derivative instrument that does not qualify for hedge accounting are
recognised immediately in the statement of comprehensive income under 'net gains/ (losses) on
financial instruments classified as held for trading'. However, the gains and losses arising from
changes in the fair value of derivatives that are managed in conjunction with financial assets or
financial liabilities designated at fair value are included in 'net gains on financial instruments
designated at fair value'.
2.16 Hedge accounting
Derivatives are used to hedge interest rate, exchange rate, commodity, and equity exposures and
69
NOTES TO THE CONSOLIDATED FINANCIAL STATEMENTS
INFRA
STRU
CTU
RE F
INA
NC
ING
| TH
E A
RT O
F LO
NG
TERM
VIS
ION
AFC / 2015 ANNUAL REPORT & ACCOUNTS

exposures related to non-trading positions. Where derivatives are held for risk management
purposes, and when transactions meet the required criteria, the Corporation applies fair value hedge
accounting, cash flow hedge accounting, or hedging of a net investment in a foreign operation as
appropriate to the risks being hedged. When a financial instrument is designated as a hedge, the
Corporation formally documents the relationship between the hedging instrument and hedged item
as well as its risk management objectives and its strategy for undertaking the various hedging
transactions. The Corporation also documents its assessment, both at hedge inception and on an
ongoing basis, of whether the derivatives that are used in hedging transactions are highly effective in
offsetting changes in fair values or cash flows of hedged items.
The Corporation discontinues hedge accounting when:
a) it is determined that a derivative is not, or has ceased to be, highly effective as a hedge;
b) the derivative expires, is terminated, or exercised;
c) the hedged item matures or is repaid
a) Fair value hedge accounting
Changes in fair value of derivatives that qualify and are designated as fair value hedges are
recorded in the statement of comprehensive income, together with changes in the fair value of
the hedged asset or liability that are attributable to the hedged risk. If the hedge relationship no
longer meets the criteria for hedge accounting, it is discontinued. For fair value hedges of interest
rate risk, the fair value adjustment to the hedged item is amortised to the statement of
comprehensive income over the period to maturity of the previously designated hedge
relationship using the effective interest method. If the hedged item is sold or repaid, the
unamortised fair value adjustment is recognised immediately in the statement of comprehensive
income.
b) Cash flow hedges
For qualifying cash flow hedges, the fair value gain or loss associated with the effective portion of
the cash flow hedge is recognised initially in shareholders' equity, and recycled to the statement
of comprehensive income in the periods when the hedged item will affect profit or loss. Any
ineffective portion of the gain or loss on the hedging instrument is recognised in the statement of
comprehensive income immediately. When a hedging instrument expires or when a hedge no
longer meets the criteria for hedge accounting, any cumulative gain or loss existing in equity at
that time remains in equity and is recognised when the hedged item is ultimately recognised in
the statement of comprehensive income.
c) Hedges of net investments
Hedges of net investments in foreign operations, including monetary items that are accounted for
as part of the net investment, are accounted for similarly to cash flow hedges; the effective
portion of the gain or loss on the hedging instrument is recognised directly in equity and the
ineffective portion is recognised immediately in the statement of comprehensive income. The
cumulative gain or loss previously recognised in equity is recognised in the statement of
comprehensive income on the disposal or partial disposal of the foreign operation, or other
reductions in the Corporation's investment in the operation.
70
NOTES TO THE CONSOLIDATED FINANCIAL STATEMENTS
INFRA
STRU
CTU
RE F
INA
NC
ING
| T
HE A
RT O
F L
ON
G T
ERM
VIS
ION
AFC / 2015 ANNUAL REPORT & ACCOUNTS
Hedges of net investments may include non-derivative liabilities as well as derivative financial
instruments.
2.17 Property and equipment
All property and equipment are stated at historical cost less depreciation and impairment. Historical
cost includes expenditure that is directly attributable to the acquisition of the items. Subsequent costs
are included in the asset's carrying amount or are recognised as a separate asset, as appropriate,
only when it is probable that future economic benefits associated with the item will flow to the
Corporation and the cost of the item can be measured reliably. The carrying amount of the replaced
part is derecognized. All other repairs and maintenance are charged to the statement of
comprehensive income during the financial period in which they are incurred.
Depreciation is calculated using the straight-line method to allocate cost to residual value over
estimated useful lives, as follows:
Leasehold improvement 25 years or over the period of the lease, if less.
Furniture and equipment 3 - 8 years
Motor vehicles 4 years
The assets residual values and useful lives are reviewed, and adjusted if appropriate, at the end of
each reporting period.
Assets that are subject to amortisation are reviewed for impairment whenever events or changes in
circumstances indicate that the carrying amount may not be recoverable. An asset's carrying amount
is written down immediately to its recoverable amount if the asset's carrying amount is greater than its
estimated recoverable amount. The recoverable amount is the higher of the asset's fair value less
costs to sell and value in use.
Gains and losses on disposal are determined by comparing proceeds with carrying amount. These
are included in the statement of comprehensive income.
2.18 Intangible assets
Intangible assets comprise separately identifiable items arising from computer software licences and
other intangible assets. Intangible assets are recognised at cost. Intangible assets with definite useful
lives are amortised using the straight-line method over the estimated useful economic life. Intangible
assets with an indefinite useful life are not amortised. At each date of the statement of financial
position, intangible assets are reviewed for indications of impairment or changes in estimated future
economic benefits. If such indications exist, the intangibles assets are analysed to assess whether their
carrying amount is fully recoverable. An impairment loss is recognised if the carrying amount exceeds
the recoverable amount. The Corporation chooses to use the cost model for the measurement after
recognition. Intangible assets with indefinite useful lives are annually tested for impairment and
whenever there is an indication that the asset may be impaired.
71
NOTES TO THE CONSOLIDATED FINANCIAL STATEMENTS
INFRA
STRU
CTU
RE F
INA
NC
ING
| TH
E A
RT O
F LO
NG
TERM
VIS
ION
AFC / 2015 ANNUAL REPORT & ACCOUNTS

a) Computer software
Acquired computer software licences are capitalised on the basis of the costs incurred to acquire
and bring to use the specific software. These costs are amortised on the basis of the expected
useful lives.
Costs associated with developing or maintaining computer software programs are recognised as
an expense as incurred. Costs that are directly associated with the production of identifiable and
unique software products controlled by the Corporation, and that will generate economic
benefits exceeding costs beyond one year, are recognised as intangible assets. Direct costs
include the software development employee costs and an appropriate portion of relevant
overheads.
Computer software costs recognised as assets are amortised using the straight-line method over
3 years.
Development costs that are directly attributable to the design and testing of identifiable and
unique software products controlled by the Corporation are recognised as intangible assets
when the following criteria are met:
(i) It is technically feasible to complete the software product so that it will be available for use.
(ii) Management intends to complete the software product and use or sell it.
(iii) There is an ability to use or sell the software product.
(iv) It can be demonstrated how the software product will generate probable future economic
benefits.
(v) Adequate technical, financial and other resources to complete the development and to use
or sell the software product are available; and
(vi) The expenditure attributable to the software product during its development can be reliably
measured.
Other development expenditures that do not meet these criteria are recognised as an expense as
incurred. Development costs previously recognised as an expense are not recognised as an asset in a
subsequent period.
b) Project Development Expenditure
Costs associated with development of projects are capitalised when they meet the following
recognition requirements of IAS 38: (i) the cost can be separated from other costs of the business; (ii)
future economic benefits will flow to the Corporation; (iii) the cost can be measured reliably.
2.19 Employee Benefits
The Corporation established a defined contributory pension scheme in 2012. This is a pension plan
under which the Corporation pays fixed contributions (7.5% of basic salary) and employees
contribute a mimium of 5% of their basic salary into a separate entity.
72
NOTES TO THE CONSOLIDATED FINANCIAL STATEMENTS
INFRA
STRU
CTU
RE F
INA
NC
ING
| T
HE A
RT O
F L
ON
G T
ERM
VIS
ION
AFC / 2015 ANNUAL REPORT & ACCOUNTS
The Corporation has no legal or constructive obligations to pay further contributions if the fund does
not hold sufficient assets to pay all employees the benefits relating to employee service in the current
and prior periods.
The contributions are recognised as employee benefit expense in the statement of comprehensive
income when it falls due.
2.20 Provisions
Provisions for restructuring costs and legal claims are recognised when: the Corporation has a
present legal or constructive obligation as a result of past events; it is probable that an outflow of
resources will be required to settle the obligation; and the amount can be reliably estimated.
Provisions are not recognised for future operating losses.
Where there are a number of similar obligations, the likelihood that an outflow will be required in
settlement is determined by considering the class of obligations as a whole. A provision is recognised
even if the likelihood of an outflow with respect to any one item included in the same class of
obligations is small.
Provisions are measured at the present value of the expenditures expected to be required to settle the
obligation using a pre-tax rate that reflects current market assessments of the time value of money
and the risks specific to the obligation. The increase in the provision due to passage of time is
recognised as interest expense.
2.21 Borrowings
Borrowings are recognised initially at fair value, being their issue proceeds (fair value of consideration
received) net of transaction costs incurred. Borrowings are subsequently stated at amortised cost; any
difference between proceeds net of transaction costs and the redemption value is recognised in the
statement of comprehensive income over the period of the borrowing using the effective interest
method.
2.22 Share capital
a) Share issue costs
Incremental costs directly attributable to the issue of new shares or options or to the acquisition of
a business are shown in equity as a deduction from the proceeds.
b) Dividends on ordinary shares
Dividends on ordinary shares are recognised in equity in the year in which they are approved by
the Corporation's shareholders.
c) Treasury shares
Where the Corporation purchase its equity shares, the consideration paid is deducted from total
shareholders' equity as treasury shares until they are cancelled. Where such shares are
subsequently sold or re-issued, any consideration received is included in shareholders' equity.
73
NOTES TO THE CONSOLIDATED FINANCIAL STATEMENTS
INFRA
STRU
CTU
RE F
INA
NC
ING
| TH
E A
RT O
F LO
NG
TERM
VIS
ION
AFC / 2015 ANNUAL REPORT & ACCOUNTS

2.23 Dividend income and payment
Dividend incomes are recognised in profit or loss when the Corporation's right to receive payment is
established. Dividend payments on ordinary shares are charged to equity in the period in which they
are declared.
2.24 Acceptances and letters of credit
Acceptances and letters of credit are accounted for as off-balance sheet transactions and disclosed
as contingent liabilities.
2.25 Comparatives
Except when a standard or an interpretation permits or requires otherwise, all amounts are reported
or disclosed with comparative information. Where IAS 8 applies, comparative figures will be adjusted
to conform to changes in presentation in the current year.
3. Financial Risk Management
AFC's business philosophy recognises that risks are an inevitable consequence of being in business. The
Corporation's aim, therefore, is not to eliminate all risks, but to design policies, processes and procedures
that will enable it achieve an appropriate balance between risk and return. AFC believes that a strong risk
management function is key to its successful long-term operations.
AFC operates a multi-layered risk management governance structure, with the Board of Directors at its
apex, exercising and assuming ultimate authority and responsibility for the Corporation's risk
management. Other layers in the risk management governance structure are: (i) the Board Risk and
Investment Committee, responsible for oversight and approval of risk policies, and credit approvals above
management's authority levels; (ii) Executive Management Committee (EXCO), responsible for review of
investment proposals, and exercise of management's delegated authority for investment approvals; (iii)
Management Risk Committee, responsible for the risk policy review and implementation; (iv) Asset and
Liability Committee (ALCO), responsible for monitoring and management of the Corporation's liquidity
and interest rate risks; (v) Risk Management Department, responsible for risk policy development,
management and monitoring; and (vi) Business Units, responsible for the creation and management of
risk assets.
AFC manages its financial risks through Policies approved by the Board Risk and Investment Committee,
and these are reviewed annually. The Policies also provide parameters and guidelines as to AFC's risk
appetite, the approval process in respect of transactions, and how transactions are monitored and
managed, in respect of any changes in the risk profile.
In managing those risks, Risk Management's independence and accountability is sustained by the Chief
Risk Officer's direct reporting line to both the President & CEO and to the Chairman of the Board Risk and
Investment Committee and the Policy requires the Chief Risk Officer's affirmative vote before a transaction
can be approved.
74
NOTES TO THE CONSOLIDATED FINANCIAL STATEMENTS
INFRA
STRU
CTU
RE F
INA
NC
ING
| T
HE A
RT O
F L
ON
G T
ERM
VIS
ION
AFC / 2015 ANNUAL REPORT & ACCOUNTS
In order to regularly monitor the risks in AFC's portfolio, Risk Management generates a number of reports,
including a Daily Risk Report for the Executive Management Committee (EXCO) and a Portfolio Risk
Dashboard for each meeting of the Board Risk and Investment Committee. In addition to these reports,
Risk Management also provides independent risk assessment to transaction monitoring reports, which are
prepared by the Business Originators on a quarterly basis.
Although, in the case of treasury investments and corporate lending transactions, AFC can lend
unsecured, almost all of AFC's loans, which are largely project and corporate financing and asset backed
structured trade are secured by collateral. Because many of AFC's project lending transactions are
bespoke, the collateral package is tailored to the individual project. However, some collateral
requirements are generic, including domiciliation of contract proceeds and the proceeds of off-take
agreements and pledges or liens over physical assets. In the case of asset backed trade related
transactions, the collateral is a mix of product, cash and receivables. The efficacy of the collateral
arrangements are monitored and reviewed by Risk Management on a quarterly basis, though a rapid
change in the collateral value profile (e.g. a significant fall in commodity prices) is monitored more
frequently.
In order to manage the risk of portfolio concentration, AFC has Limits approved by the Board Risk and
Investment Committee in respect of Countries, Sectors (e.g. Power, Natural Resources, etc.), Single
Obligor and Sector Single Obligor.
The most important types of risks faced by the Corporation are credit risk, market risk, and liquidity risk.
These individual sources of risk and how the Corporation manages them are described in more detail
below.
3.1 Credit Risk
The Corporation takes on exposures to credit risk, which is the risk of financial loss as a result of a
failure by a client or counterparty to meet its contractual obligation to the Corporation. The
Corporation has two principal sources of credit risk: (i) credit risk on its loans and investments; and (ii)
counterparty credit risk on its portfolio of treasury investments. The Corporation's credit risks are
managed within a framework of credit policies, guidelines and processes, which are described in
more detail below:
3.1.1 Project and Investment Credit Risk
The Corporation has developed a comprehensive Credit Risk Policy (CRP) that details its risk
philosophy and metrics. The CRP defines the level and type of credit exposures that AFC is prepared
to accept in order to achieve its business goals and objectives. It defines the Corporation's risk apetite
along three key metrics; Capital Adequacy Framework, Exposure Limits Framework and Credit Risk
Acceptance criteria.
AFC's Capital Adequacy Framework creates a quantifiable link between the risks assumed and the
amount of risk capital required to support those risks. The capital adequacy framework ensures that
the Corporation holds adequate levels of capital to support its investment operations.
75
NOTES TO THE CONSOLIDATED FINANCIAL STATEMENTS
INFRA
STRU
CTU
RE F
INA
NC
ING
| TH
E A
RT O
F LO
NG
TERM
VIS
ION
AFC / 2015 ANNUAL REPORT & ACCOUNTS
AFC uses the Exposure Limits Framework to manage its exposures to individual and group credit risks.
The objective is to ensure that AFC avoids excessive portfolio concentration either in single projects or
groups of projects, or in particular sectors that could be simultaneously affected by similar exogenous
events. The Exposure Limits Framework defines the limits of risk exposures in relation to a single
borrower or groups of borrowers, to industry sectors and to individual countries. The limits are
recommended by management and approved by the Board Risk and Investment Committee.
The Credit Risk Acceptance Criteria refer to the set of terms and conditions to be met before an
investment is accepted into AFC's portfolio. These include specific industry, financial, managerial
and competitive benchmarks that proposed investments must meet before they are considered for
AFC credit exposures.
3.1.2 Counterparty Credit Risk
AFC invests its liquid assets in different financial instruments to generate income. These financial
instruments involve, to some degree, the risk that the counterparty to the transaction may be unable to
meet its obligation to the Corporation when it falls due. The Corporation manages this counterparty
risk by executing transactions within a prudent framework of approved counterparties, counterparty
credit rating standards and counterparty risk exposures limits. The risk exposure limit for each
counterparty is a function of the counterparty's credit rating and its shareholders funds (unimpaired by
losses). The risk limits are proposed by the Risk Management Division and approved by the Executive
Management Committee.
3.1.3 Credit risk measurement
The estimation of credit exposure is complex and requires the use of models, as the value of a product
varies with changes in market variables, expected cash flows and the passage of time. The
assessment of credit risk of a portfolio of assets entails further estimations as to the likelihood of
defaults occurring, of the associated loss ratios and of default correlations between counterparties.
The Corporation has developed models to support the quantification of credit risk. These rating and
scoring models are in use for all key credit portfolios and form the basis for measuring default risks. In
measuring credit risk of loan and advances at a counterparty level, the Corporation considers three
components: (i) the 'probability of default' (PD) by the client or counterparty on its contractual
obligations; (ii) current exposures to the counterparty and its likely future development, from which the
Corporation derive the 'exposure at default' (EAD); and (iii) the likely recovery ratio on the defaulted
obligations (the 'loss given default') (LGD). The models are reviewed regularly to monitor their
robustness relative to actual performance and amended as necessary to optimise their effectiveness.
3.1.4 Risk limit control and mitigation policies
The Corporation manages, limits and controls concentrations of credit risk wherever they are
identified − in particular, to individual counterparties and corporations, and to industries and
countries. The Corporation structures the levels of credit risk it undertakes by placing limits on the
amount of risk accepted in relation to one borrower, or group of borrowers, and to geographical and
industry segments. Such risks are monitored on a revolving basis and subject to an annual or more
76
NOTES TO THE CONSOLIDATED FINANCIAL STATEMENTS
INFRA
STRU
CTU
RE F
INA
NC
ING
| T
HE A
RT O
F L
ON
G T
ERM
VIS
ION
AFC / 2015 ANNUAL REPORT & ACCOUNTS

frequent review, when considered necessary. Limits on the level of credit risk by product, industry
sector and country are approved by the Board Risk and Investment Committee.
3.1.5 Risk Concentration
Maximum exposure
2015 2014
US$'000 US$'000
Balances with commercial banks 40,402 86,532
Loan and advances to banks:
- Placements with banks 976,130 370,476
Loan and advances to other customers:
- Project finance loans 694,500 572,542
- Trade finance loans 483,364 514,848
Financial assets at fair value through profit or loss:
- Hybrid instruments (convertible debt) 53,625 72,316
- Asset under management 14,469 17,266
Investment Securities:
- Corporate debt securites 433,153 454,098
- Government debt securities 68,326 80,988
Other assets:
- Fee receivable - 32,852
- Account receivable 11,215 29,448
At 31 December 2,775,184 2,231,366
Off-balance sheet commitments
Debt commitments 140,760 56,581
The above table represents a worst case scenario of credit risk exposure faced by Corporation as at
the reporting dates without taking account of any collateral held or other credit enhancements
attached. The exposures are based on net carrying amounts as reported in the statement of financial
position.
Management is confident in its ability to continue to control and effectively manage the credit risk
exposure in the Corporation's loan and advances portfolio.
3.1.6 Credit quality analysis
General Risk Rating Process
Investment risk rating and acceptance criteria represent a vital aspect of the Corporation's risk
appetite definition process. Before credit risk can be managed, it must first be identified and
measured. A 10-point credit risk rating methodology, from “1” (excellent, very low risk) to “10”
(expected loss, very high risk) is applied by the Corporation. The methodology encompasses the
77
NOTES TO THE CONSOLIDATED FINANCIAL STATEMENTS
INFRA
STRU
CTU
RE F
INA
NC
ING
| TH
E A
RT O
F LO
NG
TERM
VIS
ION
AFC / 2015 ANNUAL REPORT & ACCOUNTS
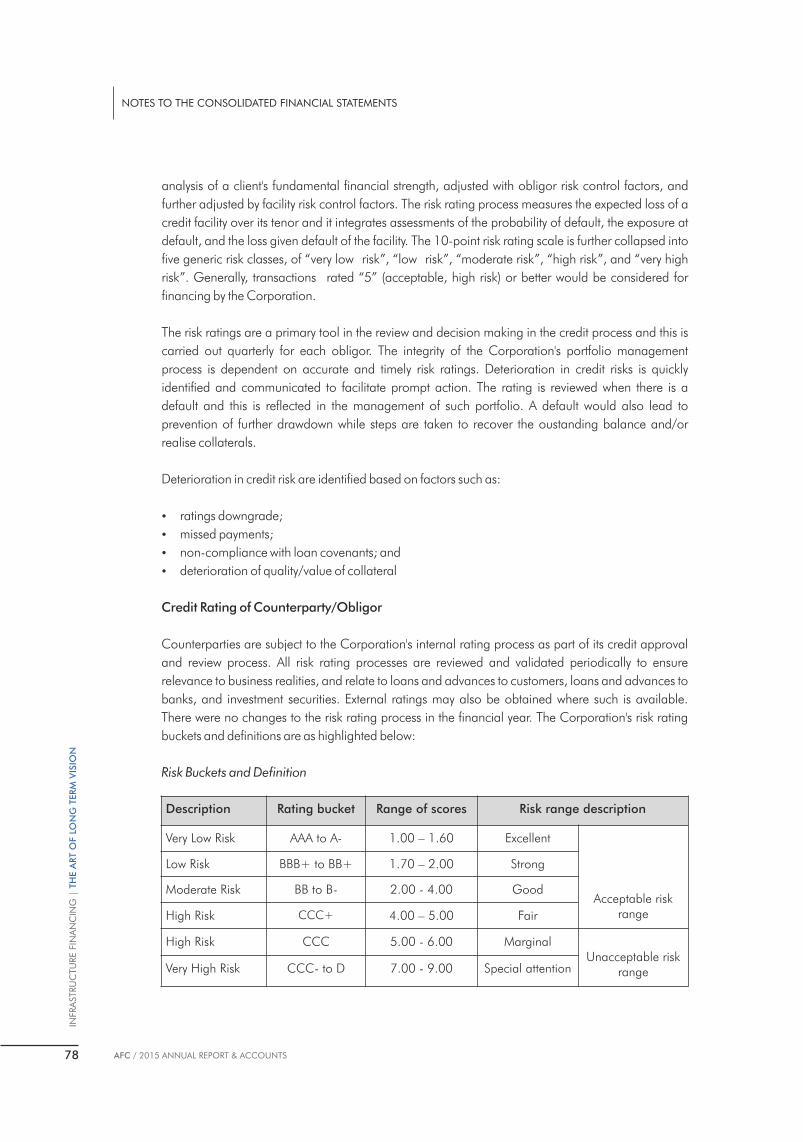
analysis of a client's fundamental financial strength, adjusted with obligor risk control factors, and
further adjusted by facility risk control factors. The risk rating process measures the expected loss of a
credit facility over its tenor and it integrates assessments of the probability of default, the exposure at
default, and the loss given default of the facility. The 10-point risk rating scale is further collapsed into
five generic risk classes, of “very low risk”, “low risk”, “moderate risk”, “high risk”, and “very high
risk”. Generally, transactions rated “5” (acceptable, high risk) or better would be considered for
financing by the Corporation.
The risk ratings are a primary tool in the review and decision making in the credit process and this is
carried out quarterly for each obligor. The integrity of the Corporation's portfolio management
process is dependent on accurate and timely risk ratings. Deterioration in credit risks is quickly
identified and communicated to facilitate prompt action. The rating is reviewed when there is a
default and this is reflected in the management of such portfolio. A default would also lead to
prevention of further drawdown while steps are taken to recover the oustanding balance and/or
realise collaterals.
Deterioration in credit risk are identified based on factors such as:
Ÿ ratings downgrade;
Ÿ missed payments;
Ÿ non-compliance with loan covenants; and
Ÿ deterioration of quality/value of collateral
Credit Rating of Counterparty/Obligor
Counterparties are subject to the Corporation's internal rating process as part of its credit approval
and review process. All risk rating processes are reviewed and validated periodically to ensure
relevance to business realities, and relate to loans and advances to customers, loans and advances to
banks, and investment securities. External ratings may also be obtained where such is available.
There were no changes to the risk rating process in the financial year. The Corporation's risk rating
buckets and definitions are as highlighted below:
Risk Buckets and Definition
Description Rating bucket Range of scores Risk range description
Very Low Risk AAA to A- 1.00 – 1.60 Excellent
Acceptable risk range
Low Risk BBB+ to BB+ 1.70 – 2.00 Strong
Moderate Risk BB to B- 2.00 - 4.00 Good
High Risk CCC+ 4.00 – 5.00 Fair
High Risk CCC 5.00 - 6.00 MarginalUnacceptable risk
rangeVery High Risk CCC- to D 7.00 - 9.00 Special attention
78
NOTES TO THE CONSOLIDATED FINANCIAL STATEMENTS
INFRA
STRU
CTU
RE F
INA
NC
ING
| T
HE A
RT O
F L
ON
G T
ERM
VIS
ION
AFC / 2015 ANNUAL REPORT & ACCOUNTS

The internal credit risk rating bucket has been caliberated to the S&P rating grades for obligors. Our
credit grades are not intended to replicate external credit grades (where these are available), and
ratings assigned by external ratings agencies are not used in determining our internal credit grades.
Nonetheless, as the factors used to grade a borrower may be similar, a borrower rated poorly by an
external rating agency is typically assigned a worse internal credit grade.
The credit quality of the balances with banks, loans and advances and debt securities that are neither
past due nor impaired is detailed below:
31 December 2015 31 December 2014
US$'000 US$'000
Counterparties with international credit rating
(S&P, Fitch, Moody's)
Investment grade (AAA to BBB-) 898,131 564,006
Others (BB+, BB, BB-, B+, B, B-) 570,227 334,641
1,468,358 898,647
Counterparties without international credit ratings
Group 1 42,189 265,191
Group 2 1,264,637 1,067,528
1,306,826 1,332,719
Total unimpaired nor past due loans,
advances and debt securities 2,775,184 2,231,366
Group 1 – New customers/related parties (less than 6 months).
Group 2 – Existing customers/related parties (more than 6 months) with no defaults in the past.
Using the Corporation's internal credit rating, the credit quality of the loans and advances to banks
and other customers that are neither past due nor impaired is detailed below:
2015 2014
US$'000 US$'000
Cash and balance with banks:
- Excellent 39,665 80,328
- Strong - 4,992
- Good 737 1,212
Total neither past due nor impaired 40,402 86,532
Loan and advances to banks:
- Excellent 735,664 253,199
- Strong 110,009 117,004
- Good 130,457 273
Total neither past due nor impaired 976,130 370,476
79
NOTES TO THE CONSOLIDATED FINANCIAL STATEMENTS
INFRA
STRU
CTU
RE F
INA
NC
ING
| TH
E A
RT O
F LO
NG
TERM
VIS
ION
AFC / 2015 ANNUAL REPORT & ACCOUNTS

2015 2014
US$'000 US$'000
Loan and advances to other customers:
Project Finance:
- Strong 604 1,562
- Good 400,020 321,939
- Fair 293,876 249,041
Trade Finance:
- Strong 50,005 50,087
- Good 464,761 226,050
- Fair - 464,761
Total neither past due nor impaired 1,177,864 1,087,390
Financial assets at fair value through profit or loss
Hybrid instruments (convertible debt)
- Good 53,625 72,316
Asset under management
- Good 14,469 17,266
Total neither past due nor impaired 68,094 89,582
Investment securities:
Corporate debt securities:
- Excellent 24,381 -
- Strong 15,025 54,697
- Good 373,258 335,768
- Fair 20,489 63,633
Government debt securities:
- Good 68,326 80,988
Total neither past due nor impaired 501,479 535,086
Other assets
Fee receivable:
- Strong - 32,852
Account receivable:
- Strong 11,215 29,448
Total neither past due nor impaired 11,215 62,300
The Corporation holds collateral and other credit enhancements against certain of its credit
exposures. For loans and advances to customers, the general credit worthiness of a customer tends to
be the most relevant indicator of credit quality of a loan extended to it. However, collateral provides
additional security and the Corporation generally requests that borrowers provide it. The extent to
which collateral values are actively managed will depend on the credit quality and other
circumstances of the obligor. Although lending decisions are predominantly based on expected
80
NOTES TO THE CONSOLIDATED FINANCIAL STATEMENTS
INFRA
STRU
CTU
RE F
INA
NC
ING
| T
HE A
RT O
F L
ON
G T
ERM
VIS
ION
AFC / 2015 ANNUAL REPORT & ACCOUNTS

cash flows, any collateral provided may impact the pricing and other terms of a loan or facility
granted; this will have a financial impact on the amount of net interest income recognised and on
internal loss-given-default estimates that contribute to the determination of asset quality.
For unimpaired secured lending, the Corporation reports assets gross of collateral and therefore
discloses the maximum loss exposure. The Corporation believes that this approach is appropriate
as collateral values at origination and during a period of good performance may not be
representative of the value of collateral if the obligor enters a distressed state.
Unimpaired secured lending is predominantly managed on a cash flow basis. On occasion, it may
include an assessment of underlying collateral, although, for impaired lending, this will not always
involve assessing it on a fair value basis. No aggregated collateral information for the entire
unimpaired secured wholesale lending portfolio is provided to EXCO
Valuation of collateral is updated when the credit risk of a loan deteriorates significantly and the loan
is monitored more closely. No collateral is held for balances with commercial banks, loans and
advances to banks, debt securities and other assets.
Please refer to note 2.11 on the Corporation's policy on repossessed collateral.
3.1.7 Concentration of risks of financial assets with credit risk exposure
Geographical sectors
The following table analyses the Corporation's main credit exposures at their carrying amounts,
categorised by geographical region, as at 31 December 2015. The Corporation has allocated
exposures to regions based on the country of domicile of its counterparties.
West Africa Others Total
31 December 2015 US$'000 US$'000 US$'000
Cash and balances with commercial banks 39,665 737 40,402
Loans and advances to banks:
- Placements with banks 150,464 825,666 976,130
Loans and advances to other customers:
- Project finance 537,311 157,189 694,500
- Trade finance 262,960 220,404 483,364
Financial assets at fair value through profit or loss:
- Hybrid instruments (convertible debt) - 53,625 53,625
- Asset under management - 14,469 14,469
Investment securities:
- Corporate debt securites 384,943 48,210 433,153
- Government debt securities 56,284 12,042 68,326
Other assets:
- Account receivable 11,215 - 11,215
1,442,842 1,332,342 2,775,184
Commitments 111,877 28,883 140,760
81
NOTES TO THE CONSOLIDATED FINANCIAL STATEMENTS
INFRA
STRU
CTU
RE F
INA
NC
ING
| TH
E A
RT O
F LO
NG
TERM
VIS
ION
AFC / 2015 ANNUAL REPORT & ACCOUNTS

West Africa Others Total
31 December 2014 US$'000 US$'000 US$'000
Cash and balances with commercial banks 1,218 85,314 86,532
Loans and advances to banks:
- Placements with banks 272 370,204 370,476
Loans and advances to other customers:
- Project finance 517,454 55,088 572,542
- Trade finance 344,777 170,071 514,848
Financial assets at fair value through profit or loss:
- Hybrid instruments (convertible debt) - 72,316 72,316
- Asset under management - 17,266 17,266
Investment securities:
- Corporate debt securities 410,264 43,834 454,098
- Government debt securities 68,945 12,043 80,988
Other assets:
- Fee receivable 32,494 358 32,852
- Account receivable 29,448 - 29,448
1,404,872 826,494 2,231,366
Commitments 47,385 9,196 56,581
Credit Concentration by Industry
31 December 2015 Natural Heavy Power Transport Financial Total Resources Industry & Services Telecoms & Others US$'000 US$'000 US$'000 US$'000 US$'000 US$'000
Cash and balances with banks - - - - 40,402 40,402
Loans and advances to banks:
- Placements with banks - - - - 976,130 976,130
Loans and advances to other customers:
- Project finance 330,248 51,173 192,996 120,083 - 694,500
- Trade finance 208,223 103,912 - 7,336 163,893 483,364
Financial assets at fair value
through profit or loss:
- Hybrid instruments (convertible debt) - 53,625 - - - 53,625
- Asset under management - - - - 14,469 14,469
Investment securities:
- Corporate debt securities - - 30,209 67,691 335,253 433,153
- Government debt securities - - - - 68,326 68,326
Other assets:
- Account receivable - - - - 11,215 11,215
538,471 208,710 223,205 195,110 1,609,688 2,775,184
Commitments - 48,883 10,829 67,848 13,200 140,760
82
NOTES TO THE CONSOLIDATED FINANCIAL STATEMENTS
INFRA
STRU
CTU
RE F
INA
NC
ING
| T
HE A
RT O
F L
ON
G T
ERM
VIS
ION
AFC / 2015 ANNUAL REPORT & ACCOUNTS

31 December 2014 Natural Heavy Power Transport Financial Total Resources Industry & Services Telecoms & Others US$'000 US$'000 US$'000 US$'000 US$'000 US$'000
Cash and balances with banks - - - - 86,532 86,532
Loans and advances to banks:
- Placements with banks - - - - 370,476 370,476
Loans and advances to other customers:
- Project finance 315,329 30,015 180,059 47,139 - 572,542
- Trade finance 164,805 117,645 - 11,025 221,373 514,848
Financial assets at fair value
through profit or loss:
- Hybrid instruments (convertible debt) - 72,316 - - - 72,316
- Asset under management - - - - 17,266 17,266
Investment securities:
- Corporate debt securities - 32,092 31,540 69,402 321,064 454,098
- Government debt securities - - - - 80,988 80,988
Other assets:
- Fee receivable - - 32,852 - - 32,852
- Account receivable - - - - 29,448 29,448
480,134 252,068 244,451 127,566 1,127,147 2,231,366
Commitments 45,880 - 10,701 - - 56,581
3.2 Market Risk
AFC takes on exposures to market risks, which is the risk that the fair value or future cash flows of a
financial instrument will fluctuate because of changes in market prices. Market risks arise from open
positions in interest rates, commodities, currency and equity products, all of which are exposed to
general and specific market movements and changes in the level of volatility of market rates or prices
such as interest rates, commodity prices, credit spreads, foreign exchange rates and equity prices.
3.2.1 Market risk measurement techniques
The major measurement techniques used to measure and control market risk are outlined below.
(a) Value at Risk
Value at risk (“VAR”) methodology is applied to quantify and control market risk of assets and
liabilities designated at fair value. This methodology is applied to individual portfolios and on an
enterprise wide basis. The Corporation applies VAR for items designated as held-to-maturity
where there are observable prices.
Historical Simulation methodology is applied used for calculating Value at Risk (VaR). This
variant has an implicit assumption that future market movements are similar to historical market
movements. This methodology accurately reflects the historical probability distribution of market
variables. In applying the model, a time series is created by revaluing the portfolio using market
83
NOTES TO THE CONSOLIDATED FINANCIAL STATEMENTS
INFRA
STRU
CTU
RE F
INA
NC
ING
| TH
E A
RT O
F LO
NG
TERM
VIS
ION
AFC / 2015 ANNUAL REPORT & ACCOUNTS

variables (e.g. Yield curves, Foreign Exchange and implied volatilities for Derivatives) for the last
251 business days. The resulting historical series of 250 portfolio value changes is sorted into
percentiles. The VaR for the portfolio is the value change corresponding to the required level of
confidence.
As the Corporation does not have a trading book, VAR sensitivities have not been computed.
VAR is a statistically based estimate of the maximum expected loss on the current portfolio from
adverse market movements. This maximum expected loss is determined with a level of
confidence (95%) and a holding period (1 day). This implies that realized losses may exceed the
VAR estimate 5 days out of every 100 days. This assumption is monitored daily by comparing
realized gains/losses against the VAR estimate.
As VAR constitutes an integral part of the Corporation's market risk control regime, VAR limits are
established by the Board annually and allocated to business units. Actual exposure against limits,
together with a Corporation-wide VAR, is reviewed daily. For the 2015 financial year, the
average daily FX VAR was US$285,186 (2014: US$172,158) and average daily Interest Rate
VAR was US$3,059,000 (2014: US$1,870,097). The quality of the VAR model is continuously
monitored by back-testing the VAR estimates against actuals. All back-testing exceptions (positive
or negative) are investigated, and reported to ALCO monthly.
VAR position summary
(b) Stress Test
Stress tests provide an indication of the potential size of losses that could arise in extreme
conditions. The Corporation carries out stress tests for its core investment and treasury portfolios.
The Board Risk and Investment Committee agrees the range of scenarios to be tested and the
independent risk management function co-ordinates the process, using bottom-up analysis
performed by the businesses. The results of the stress tests are reviewed by the Executive
Management and the Board Risk and Investment Committee.
12 months to 31 December 2015
12 months to 31 December 2014
All numbers in US$'000 Average High Low Average High Low
Foreign exchange risk 285 595 90 172 194 155
Interest rate risk 3,059 2,238 1,719 1,870 2,270 1,576
Total VAR 3,344 2,833 1,809 2,042 2,464 1,731
84
NOTES TO THE CONSOLIDATED FINANCIAL STATEMENTS
INFRA
STRU
CTU
RE F
INA
NC
ING
| T
HE A
RT O
F L
ON
G T
ERM
VIS
ION
AFC / 2015 ANNUAL REPORT & ACCOUNTS

3.2.2 Foreign exchange risk
In the normal course of business, the Corporation is exposed to the effects of fluctuations in the
prevailing foreign currency exchange rates on its financial position and cash flows. The Board sets
limits on the level of exposure by currency, which are monitored. The table below summarizes the
Corporation's exposure to foreign exchange rate risk at 31 December 2015. Included in the table are
the Corporation's financial instruments at carrying amounts, categorised by currency.
Concentrations of currency risk – on-balance sheet financial instruments
31 December 2015 US dollars Others Total
US$'000 US$'000 US$'000
Assets
Cash and balances with commercial banks 39,759 655 40,414
Loans and advances to banks 976,130 - 976,130
Derivative financial assets 3,534 - 3,534
Loans and advances to other customers 1,124,659 53,205 1,177,864
Financial assets at fair value through profit or loss 200,923 25,305 226,228
Investment securities 584,765 11,531 596,296
Other assets 9,922 1,293 11,215
Total financial assets 2,939,692 91,989 3,031,681
Borrowings 1,619,833 27,103 1,646,936
Derivative financial liabilities 2,718 - 2,718
Accrued expenses and other liabilities 6,874 593 7,467
Total financial liabilities 1,629,425 27,696 1,657,121
Net financial position 1,310,267 64,293 1,374,560
Commitments 151,407 37,848 189,255
31 December 2014
Assets
Cash and balances with commercial banks 66,857 19,694 86,551
Loans and advances to banks 370,203 273 370,476
Derivative financial assets 639 - 639
Loans and advances to other customers 1,087,390 - 1,087,390
Financial assets at fair value through profit or loss 173,012 16,136 189,148
Investment securities 606,646 28,813 635,459
Other assets 60,370 1,930 62,300
Total financial assets 2,365,117 66,846 2,431,963
85
NOTES TO THE CONSOLIDATED FINANCIAL STATEMENTS
INFRA
STRU
CTU
RE F
INA
NC
ING
| TH
E A
RT O
F LO
NG
TERM
VIS
ION
AFC / 2015 ANNUAL REPORT & ACCOUNTS
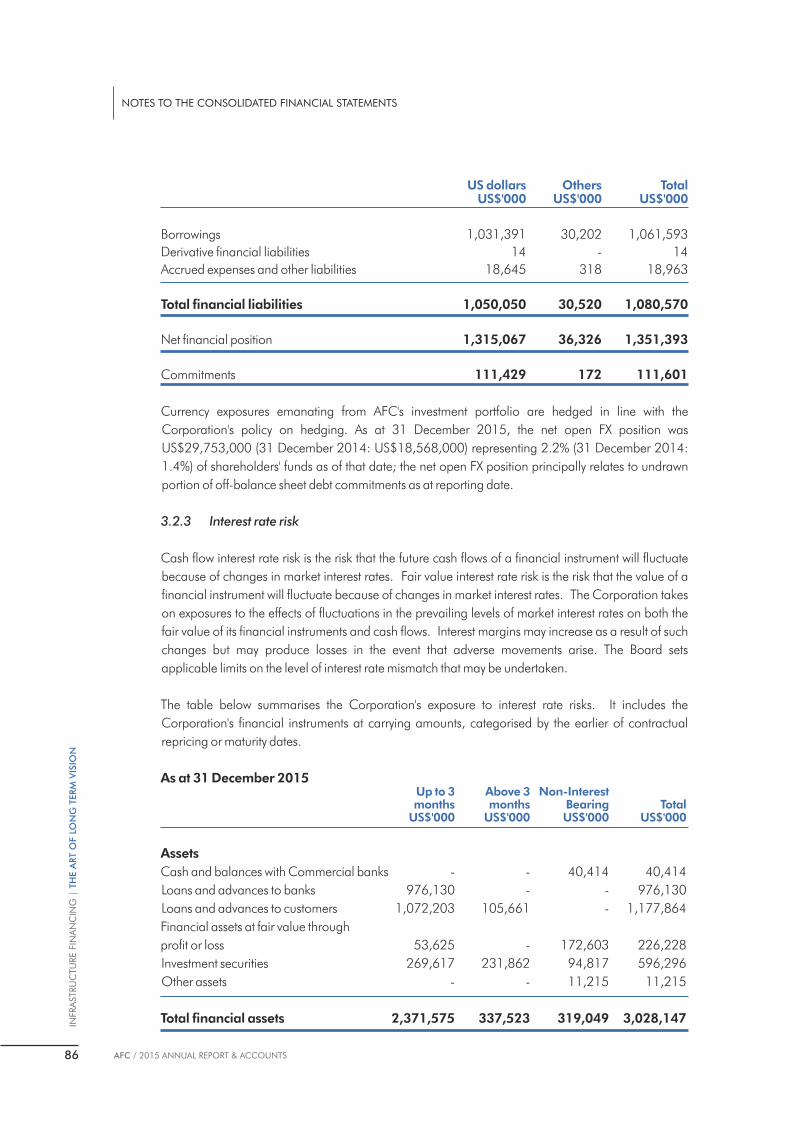
US dollars Others Total US$'000 US$'000 US$'000
Borrowings 1,031,391 30,202 1,061,593
Derivative financial liabilities 14 - 14
Accrued expenses and other liabilities 18,645 318 18,963
Total financial liabilities 1,050,050 30,520 1,080,570
Net financial position 1,315,067 36,326 1,351,393
Commitments 111,429 172 111,601
Currency exposures emanating from AFC's investment portfolio are hedged in line with the
Corporation's policy on hedging. As at 31 December 2015, the net open FX position was
US$29,753,000 (31 December 2014: US$18,568,000) representing 2.2% (31 December 2014:
1.4%) of shareholders' funds as of that date; the net open FX position principally relates to undrawn
portion of off-balance sheet debt commitments as at reporting date.
3.2.3 Interest rate risk
Cash flow interest rate risk is the risk that the future cash flows of a financial instrument will fluctuate
because of changes in market interest rates. Fair value interest rate risk is the risk that the value of a
financial instrument will fluctuate because of changes in market interest rates. The Corporation takes
on exposures to the effects of fluctuations in the prevailing levels of market interest rates on both the
fair value of its financial instruments and cash flows. Interest margins may increase as a result of such
changes but may produce losses in the event that adverse movements arise. The Board sets
applicable limits on the level of interest rate mismatch that may be undertaken.
The table below summarises the Corporation's exposure to interest rate risks. It includes the
Corporation's financial instruments at carrying amounts, categorised by the earlier of contractual
repricing or maturity dates.
As at 31 December 2015 Up to 3 Above 3 Non-Interest months months Bearing Total US$'000 US$'000 US$'000 US$'000
Assets
Cash and balances with Commercial banks - - 40,414 40,414
Loans and advances to banks 976,130 - - 976,130
Loans and advances to customers 1,072,203 105,661 - 1,177,864
Financial assets at fair value through
profit or loss 53,625 - 172,603 226,228
Investment securities 269,617 231,862 94,817 596,296
Other assets - - 11,215 11,215
Total financial assets 2,371,575 337,523 319,049 3,028,147
86
NOTES TO THE CONSOLIDATED FINANCIAL STATEMENTS
INFRA
STRU
CTU
RE F
INA
NC
ING
| T
HE A
RT O
F L
ON
G T
ERM
VIS
ION
AFC / 2015 ANNUAL REPORT & ACCOUNTS

As at 31 December 2015 cont’d Up to 3 Above 3 Non-Interest months months Bearing Total US$'000 US$'000 US$'000 US$'000
Liabilities
Borrowings 823,375 823,561 - 1,646,936
Other liabilities - - 7,467 7,467
Total financial liabilities 823,375 823,561 7,467 1,654,403
Total interest repricing gap 1,548,200 (486,038) 311,582 1,373,744
As at 31 December 2014 Up to 3 Above 3 Non-Interest months months Bearing Total US$'000 US$'000 US$'000 US$'000
Assets
Cash and balances with Commercial banks - - 86,551 86,551
Loans and advances to banks 370,476 - - 370,476
Loans and advances to customers 961,548 125,842 - 1,087,390
Financial assets at fair value
through profit or loss 72,316 - 116,832 189,148
Investment securities 51,704 483,382 100,373 635,459
Other assets - - 62,300 62,300
Total financial assets 1,456,044 609,224 366,056 2,431,324
Liabilities
Borrowings 707,774 353,819 - 1,061,593
Other liabilities - - 18,963 18,963
Total financial liabilities 707,774 353,819 18,963 1,080,556
Total interest repricing gap 748,270 255,405 347,093 1,350,768
3.3 Liquidity Risk
Liquidity risk is the risk that the Corporation is unable to meet its payment obligations associated with
its financial liabilities when they fall due and to replace funds when they are withdrawn. The
consequence may be the failure to meet obligations to repay lenders and fulfil commitments to lend
The Corporation's liquidity management process includes:
Ÿ day-to-day funding, managed by monitoring future cash flows to ensure that requirements can be
met;
Ÿ monitoring statement of financial position liquidity ratios against internal requirements; and
Ÿ managing the concentration and profile of debt maturities.
The Corporation holds a diversified portfolio of cash and High-Quality Liquid Assets (“HQLA”) to
support financial obligations and contingent funding in a stressed market environment. The
87
NOTES TO THE CONSOLIDATED FINANCIAL STATEMENTS
INFRA
STRU
CTU
RE F
INA
NC
ING
| TH
E A
RT O
F LO
NG
TERM
VIS
ION
AFC / 2015 ANNUAL REPORT & ACCOUNTS

Corporation's assets held for managing liquidity risk comprise:
Ÿ cash and balances with commercial banks, loan and advances to banks ; and
Ÿ investment grade sovereign and corporate securities with a highly liquid secondary market
Monitoring and reporting take the form of daily cash flow measurement and projections. The starting
point for those projections is an analysis of the contractual maturity of the financial liabilities and the
expected collection date of the financial assets.
The Corporation has a Liquidity Policy and Contingency Funding Plan that defines extensively how
liquidity risk would be managed within the Corporation. The policy requires that the Corporations
keeps High Quality Liquid Assets (“HQLA”) to covers its Minimum Liquidity Level (“MLL”) at twelve and
eighteen months under 'stress' and business as usual (“BAU”) conditions respectively. MLL, for the
purpose of the Corporation, is defined as the level of liquidity that is available to meet the
Corporation's financial obligations (repayment of borrowing, operating expenses and other non-
cancellable debt and equity commitments) . Similar to the provisions of Basel III Capital Accord on
Liquidity, the Corporation has defined its Liquidity Coverage Ratio (“LCR”) as its stock of HQLA as a
proportion of its MLL, as defined above. Under both stress and BAU conditions, the LCR is required to
be greater than 100%.
As at 31 December 2015, the LCR was 192% under stress scenario (December 2014: 169%) and
249% under normal circumstances (December 2014: 155%).
The table below analyses the Corporation's financial instruments into relevant maturity groupings
based on the remaining period at the statement of financial position date to the contractual maturity
date. The amounts disclosed in the table are the contractual undiscounted cash flows.
All gures in US$'000 Carrying amount
Within 1 month
1 to 3 months
3 to 6 months
6 to 12 months
1 to 2yrs 2 -5 yrs Above5 yrs
Total Financial Assets 3,028,147 1,101,718 78,146 307,857 134,240 233,103 1,096,692 605,093
Total Financial Liabilities 1,671,281 14,008 6,923 121,291 230,500 313,397 875,989 171,136
Derivative Liabilities 2,718 - 2,718 - - - - -
Loan commitments 140,760 10,702 13,200 48,788 - 68,070 - -
Funding gap - 1,077,008 55,305 137,778 (96,260) (148,364) 220,703 423,957
Cummulative funding gap - 1,077,008 1,132,313 1,270,091 1,173,831 1,025,467 1,246,170 1,680,127
As at 31 December 2015
All gures in US$'000 Carrying amount
Within 1 month
1 to 3 months
3 to 6 months
6 to 12 months
1 to 2yrs 2 -5 yrs Above 5 yrs
Total Financial Assets 2,431,324 531,366 199,538 230,063 121,429 188,608 934,931 741,090
Total Financial Liabilities 1,086,697 149,354 17,546 11,444 332,644 179,145 340,852 160,340
Loan commitments 56,581 - 13,767 9,196 - - 33,618 -
Funding gap - 382,012 168,225 209,423 (211,215) 9,463 560,461 580,750
Cummulative funding gap - 382,012 550,237 759,660 548,445 557,908 1,118,369 1,699,119
As at 31 December 2014
88
NOTES TO THE CONSOLIDATED FINANCIAL STATEMENTS
INFRA
STRU
CTU
RE F
INA
NC
ING
| T
HE A
RT O
F L
ON
G T
ERM
VIS
ION
AFC / 2015 ANNUAL REPORT & ACCOUNTS

The gap identified in the 6 months to 2 years period will be funded with maturities from earlier
periods, as evidenced in the cumulative funding gap contained in the table above.
3.4 Capital Management & Governance structure
The Board of Directors has ultimate responsibility for policy formulation, strategy and decision
making, with specific authority delegated to three subsidiary committees and Executive Management
for day-to-day operations. Below represents the reporting structures of the various Board committees
within the Corporation.
In carrying out its oversight functions, EXCO through various committees manages the day to day
operations of the Corporation. Below is a chart of the various sub committees of EXCO and their
mandates.
The Corporation's objectives when managing capital, which is a broader concept than the 'equity' on
the face of the statement of financial position are:
Ÿ to comply with the capital requirements set by the Board of Directors of the Corporation;
Ÿ to safeguard the Corporation's ability to continue as a going concern so that it can continue to
provide returns for shareholders and benefits for other stakeholders; and
Ÿ to maintain a strong capital base to support the development of its business.
Board ofDirectors
Board Nominationsand Governance
Committee
Board Auditand Compliance
Committee
Board Riskand Investment
Committee
Nominations and AppointmentsGovernance Policy and Monitoring
Audit Review and ApprovalInternal Compliance Monitoring
Risk Policy and UnitsInvestment Strategy and Approvals
Quarterly Quarterly Quarterly + As required
Delegated Role
Sitting Frequency
Board ofDirectors
InvestmentCommittee
Asset & LiabilityCommittee (ALCO)
Risk Committee(RISKCO)
Valuation Committee(VALCO)
Procurement Committee(PC)
IT SteeringCommittee
Sub-InvestmentCommittee
Executive MangementCommittee (EXCO)
Critically appraisespotential investment
commitments
As required
Responsible forliquidity management
and market risk
Monthly
Implementation ofthe risk management
framework
Monthly
Review valuations ofequity and hybrid
investments
Quarterly
Manages theprocurement process.
Ensures value for money
As required
Provides strategicdirection on IT
architecture andinfrastructure
As required
89
NOTES TO THE CONSOLIDATED FINANCIAL STATEMENTS
INFRA
STRU
CTU
RE F
INA
NC
ING
| TH
E A
RT O
F LO
NG
TERM
VIS
ION
AFC / 2015 ANNUAL REPORT & ACCOUNTS

Capital adequacy is monitored regularly by the Corporation's management, employing techniques
derived from the guidelines developed by the Basel Committee. The Corporation's Capital Adequacy
Framework requires the business to maintain a ratio of total risk capital to the risk-weighted asset (the
Basel ratio) at a minimum of 30%. To allow for a proactive management of any issue with its capital
position, the Corporation has further defined an internal trigger at 40% that would necessitate the
activation of a remedial action.
The Corporation's capital is managed by the Finance and Financial Services Divisions and currently
comprises of Tier 1 (96%) and Tier 2 (4%) capital as shown below:
Tier 1: Comprises of share capital, retained earnings and reserves created by appropriations of
retained earnings.
Tier 2: Comprises of unrealised gains arising on the fair valuation of equity instruments held as
available-for-sale and collective impairment allowance made on loans and advances.
The risk weighted assets are measured by means of a hierarchy of risk weights classified according to
the nature of (and reflecting an estimate of credit, market and other risks associated with) each asset
and counterparty, taking into account any eligible collateral or guarantees. A similar treatment is
adopted for off-balance sheet exposures, with some adjustments to reflect the more contingent nature
of the potential losses.
The table below summarises the composition of capital and the ratios of the Corporation for the period
ended 31 December 2015. The Corporation has no externally imposed capital requirements, but
complied with its own internal capital adequacy requirements described above, during the year under
review.
31 Dec. 2015 31 Dec. 2014
US$'000 US$'000
Tier 1 capital
Share capital 1,089,067 1,089,067
Retained earnings 255,335 239,700
Total qualifying Tier 1 capital 1,344,402 1,328,767
Net fair valuation gain on available-for-sale assets 21,312 23,628
Collective impairment allowance 26,710 -
Total qualifying capital 1,392,424 1,352,395
Risk-weighted assets:
On-balance sheet 2,703,622 2,231,685
Off-balance sheet 73,787 66,028
Total risk-weighted assets 2,777,409 2,297,713
Basel ratio 50.1% 58.9%
90
NOTES TO THE CONSOLIDATED FINANCIAL STATEMENTS
INFRA
STRU
CTU
RE F
INA
NC
ING
| T
HE A
RT O
F L
ON
G T
ERM
VIS
ION
AFC / 2015 ANNUAL REPORT & ACCOUNTS

3.5 Fair value of financial assets and liabilities
The fair values of financial assets and financial liabilities that are traded in active markets are based
on quoted market prices or dealer price quotations. For all other financial instruments, the
Corporation determines fair values using other valuation techniques. For financial instruments that
trade infrequently and have little price transparency, fair value is less objective, and requires varying
degrees of judgement depending on liquidity, concentration, uncertainty of market factors, pricing
assumptions and other risks affecting the specific instrument.
(a) Valuation models
The Corporation measures fair values using the following fair value hierarchy, which reflects the
significance of the inputs used in making the measurements.
- Level 1: inputs that are quoted market prices (unadjusted) in active markets for identical
instruments.
- Level 2: inputs other than quoted prices included within Level 1 that are observable either
directly (i.e. as prices) or indirectly (i.e. derived from prices). This category includes instruments
valued using: quoted market prices in active markets for similar instruments; quoted prices for
identical or similar instruments in markets that are considered less than active; or other valuation
techniques in which all significant inputs are directly or indirectly observable from market data.
- Level 3: inputs that are unobservable. This category includes all instruments for which the
valuation technique includes inputs not based on observable data and the unobservable inputs
have a significant effect on the instrument's valuation. This category includes instruments that are
valued based on quoted prices for similar instruments for which significant unobservable
adjustments or assumptions are required to reflect differences between the instruments.
Valuation techniques include net present value and discounted cash flow models, comparison with
similar instruments for which market observable prices exist, Black-Scholes and polynomial option
pricing models and other valuation models. Assumptions and inputs used in valuation techniques
include risk-free and benchmark interest rates, credit spreads and other premia used in estimating
discount rates, bond and equity prices, foreign currency exchange rates, equity and equity index
prices and expected price volatilities and correlations.
The objective of valuation techniques is to arrive at a fair value measurement that reflects the price
that would be received to sell the asset or paid to transfer the liability in an orderly transaction between
market participants at the measurement date.
The Corporation uses widely recognised valuation models for determining the fair value of common
and plain vanilla financial instruments, such as interest rate and currency swaps that use only
observable market data and require little management judgement and estimation. Observable prices
or model inputs are usually available in the market for listed debt and equity securities, exchange-
traded derivatives and simple over-the-counter derivatives such as interest rate swaps. Availability of
observable market prices and model inputs reduces the need for management judgement and
91
NOTES TO THE CONSOLIDATED FINANCIAL STATEMENTS
INFRA
STRU
CTU
RE F
INA
NC
ING
| TH
E A
RT O
F LO
NG
TERM
VIS
ION
AFC / 2015 ANNUAL REPORT & ACCOUNTS

estimation and also reduces the uncertainty associated with determining fair values. Availability of
observable market prices and inputs varies depending on the products and markets and is prone to
changes based on specific events and general conditions in the financial markets.
For more complex financial instruments, the Corporation uses proprietary valuation models, which
are usually developed from recognised valuation models. Some or all of the significant inputs into
these models may not be observable in the market, and are derived from market prices or rates or are
estimated based on assumptions. Examples of instruments involving significant unobservable inputs
include unquoted equity securities for which there is no active market. Valuation models that employ
significant unobservable inputs require a higher degree of management judgement and estimation in
the determination of fair value. Management judgement and estimation are usually required for
selection of the appropriate valuation model to be used, determination of expected future cash flows
on the financial instrument being valued, determination of the probability of counterparty default and
prepayments and selection of appropriate discount rates.
Fair value estimates obtained from models are adjusted for any other factors, such as liquidity risk or
model uncertainties, to the extent that the Corporation believes that a third party market participant
would take them into account in pricing a transaction. Fair values reflect the credit risk of the
instrument and include adjustments to take account of the credit risk of the counterparty where
appropriate.
(b) Valuation framework
The Corporation has an established control framework with respect to the measurement of fair
values. This framework includes a Product Control function, which is independent of front office
management and reports to the Chief Financial Officer, and which has overall responsibility for
independently verifying the results of investment operations and all fair value measurements. Specific
controls in the Corporation's valuation control framework include:
- an established procedure for the verification of observable market prices;
- an established procedure for the independent re-performance and validation of model-based
valuations;
- a review and approval process for new models and changes to models analysis and investigation
of significant daily valuation movements; and
- review of unobservable inputs, valuation adjustments and changes to the fair value
measurement of Level 3 instruments compared with the previous period, by the valuation
committee (a committee which includes the Chief Financial Officer and the Chief Risk Officer)
Level 2 and 3 categories, fair valuation adjustments are approved by the Board of Directors through
two of its subsidiary committees: Audit and Compliance Committee and Risk and Investment
Committee.
The following table analyses financial instruments measured at fair value as at 31 December 2015,
by the level in the fair value hierarchy into which the fair value measurement is categorised. The
amounts are based on the values recognised in the statement of financial position.
92
NOTES TO THE CONSOLIDATED FINANCIAL STATEMENTS
INFRA
STRU
CTU
RE F
INA
NC
ING
| T
HE A
RT O
F L
ON
G T
ERM
VIS
ION
AFC / 2015 ANNUAL REPORT & ACCOUNTS

31 December 2015 Level 1 Level 2 Level 3
US$'000 US$'000 US$'000
Derivatives assets
- Options - 2,041 -
- Forward contracts - 1,493 -
Financial assets at fair value through profit or loss:
- Assets under management 14,469 - -
- Hybrid instrument (convertible debt) - 53,625 -
- Equity securities 3,059 - 155,075
Investment securities:
- Equity securities (available-for-sale) - - 94,817
- Corporate debt securities 3,674 - -
Total 21,202 57,159 249,892
Derivatives Liabilities:
- Interest rate swaps - 2,718 -
31 December 2014 Level 1 Level 2 Level 3
US$'000 US$'000 US$'000
Derivatives assets (Options contract) - 639 -
Financial assets at fair value through profit or loss:
- Assets under management 17,266 - -
- Hybrid instrument (convertible debt) - 72,316 -
- Equity securities - - 99,566
Investment securities:
- Equity securities (available-for-sale) - - 100,373
Total 17,266 72,955 199,939
Derivatives Liabilities:
- Option contract - 14 -
There were no transfers between levels 1 and 2 for recurring fair value measurements during the year.
For transfers in and out of level 3 measurements, see reconciliation overleaf:
93
NOTES TO THE CONSOLIDATED FINANCIAL STATEMENTS
INFRA
STRU
CTU
RE F
INA
NC
ING
| TH
E A
RT O
F LO
NG
TERM
VIS
ION
AFC / 2015 ANNUAL REPORT & ACCOUNTS
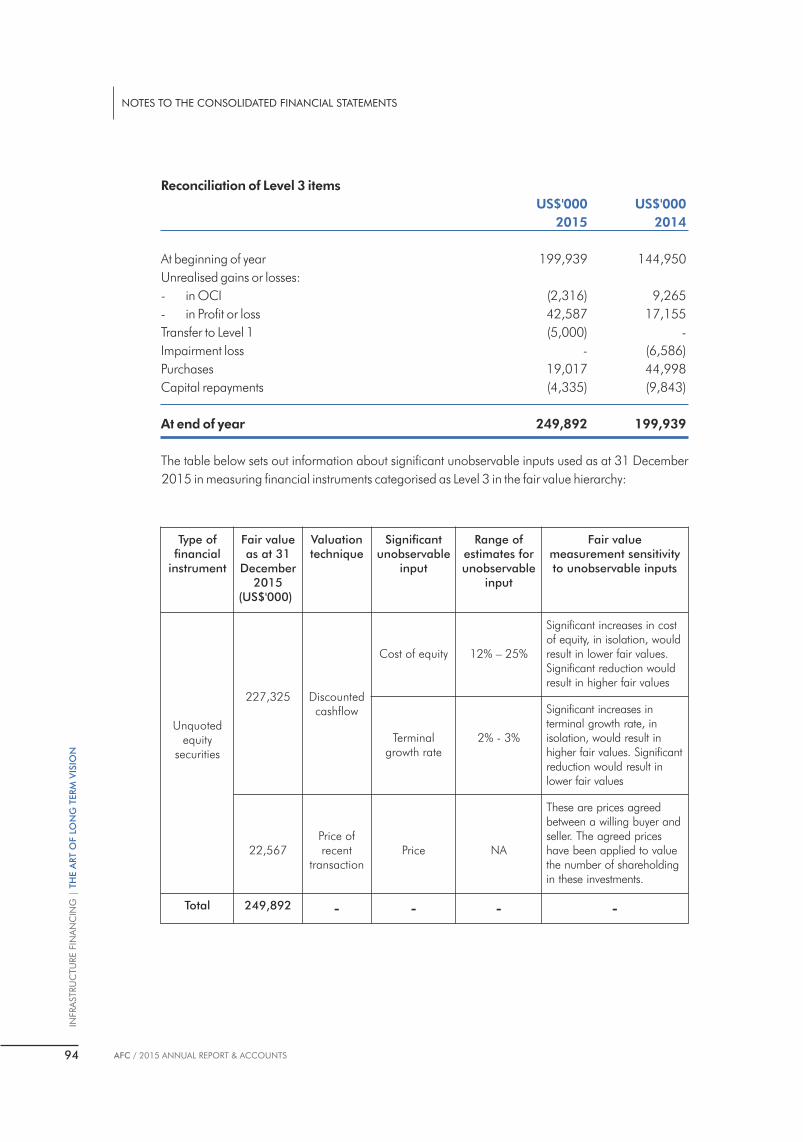
Reconciliation of Level 3 items
US$'000 US$'000
2015 2014
At beginning of year 199,939 144,950
Unrealised gains or losses:
- in OCI (2,316) 9,265
- in Profit or loss 42,587 17,155
Transfer to Level 1 (5,000) -
Impairment loss - (6,586)
Purchases 19,017 44,998
Capital repayments (4,335) (9,843)
At end of year 249,892 199,939
The table below sets out information about significant unobservable inputs used as at 31 December
2015 in measuring financial instruments categorised as Level 3 in the fair value hierarchy:
Type of nancial
instrument
Fair valueas at 31
December 2015
(US$'000)
Valuation technique
Signicant unobservable
input
Range of estimates for unobservable
input
Fair valuemeasurement sensitivity to unobservable inputs
Unquoted equity
securities
227,325 Discounted cashflow
Cost of equity 12% – 25%
Significant increases in cost of equity, in isolation, would result in lower fair values. Significant reduction would result in higher fair values
Terminal growth rate
2% - 3%
Significant increases in terminal growth rate, in isolation, would result in higher fair values. Significant reduction would result in lower fair values
22,567Price of recent
transaction Price NA
These are prices agreed between a willing buyer and seller. The agreed prices have been applied to value the number of shareholding in these investments.
Total 249,892 - - - -
94
NOTES TO THE CONSOLIDATED FINANCIAL STATEMENTS
INFRA
STRU
CTU
RE F
INA
NC
ING
| T
HE A
RT O
F L
ON
G T
ERM
VIS
ION
AFC / 2015 ANNUAL REPORT & ACCOUNTS

** Certain equity investments which were previously valued using the income approach were valued
using the market approach as there were recent equity transactions in those investee entities. These
are prices agreed between a willing buyer and seller and were adjusted to reflect the timing of those
transactions and other transaction specific conditions.
Significant unobservable inputs in the discounted cash flow technique applied are developed as
follows:
i. The Corporation applied the Capital Asset Pricing Model to determine the cost of equities for its
various unquoted equities which were fair valued at year end.
ii. The risk free rate was determined using the yield on the US Government bond of the appropriate
tenor and this was adjusted for country risk premium (for unquoted securities denominated in
US$) .
iii. Equity risk premium was determined using Standards and Poors (S&P) 500 Stock Price Index, for
similar business sectors.
iv. Beta estimates were obtained from Damodaran Online.
The Corporation believes that its estimates of fair values are appropriate. However, the use of different
methodologies or assumptions could lead to different measurements of fair value. For fair value
measurements in Level 3, changing the cost of equity or terminal growth rate by a reasonable
possible value, in isolation, would have the following effects on Other Comprehensive Income and
profit or loss for the year as follows:
Type of nancial
instrument
Fair valueas at 31
December 2014
(US$'000)
Valuation technique
Signicant unobservable
input
Range of estimates for unobservable
input
Fair valuemeasurement sensitivity to unobservable inputs
Unquoted equity
securities
112,479 Discounted cashflow
Cost of equity 15% – 25%
Significant increases in cost of equity, in isolation, would result in lower fair values. Significant reduction would result in higher fair values
Terminal growth rate
2% - 3%
Significant increases in terminal growth rate, in isolation, would result in higher fair values. Significant reduction would result in lower fair values
87,460Price of recent
transaction **
Price NA
These are prices agreed between a willing buyer and seller. The agreed prices have been applied to value the number of shareholding in these investments.
Total 199,939 - - - -
95
NOTES TO THE CONSOLIDATED FINANCIAL STATEMENTS
INFRA
STRU
CTU
RE F
INA
NC
ING
| TH
E A
RT O
F LO
NG
TERM
VIS
ION
AFC / 2015 ANNUAL REPORT & ACCOUNTS

The hybrid instrument was valued using a binomial distribution methodology involving three to twenty
five steps. The table below highlights the market data used for the purpose of valuation of the
convertible instrument:
The derivative assets (option contract) was valued using the Black Scholes option pricing model. The
table below highlights the market data used for the purpose of valuation of the derivative instrument:
c) Financial instruments not measured at fair value
The following table sets out the fair values of financial instruments not measured at fair value and
analyses them by the level in the fair value hierarchy into which each fair value measurement is
categorised.
US$'000 Effect on Other Comprehensive Income Effect on prot or loss
Key Assumption 1% Increase 1% Decrease 1% Increase 1% Decrease
Cost of equity (7,793) 8,650 (5,543) 6,165
Terminal growth rate 5,308 (4,300) 7,883 (6,599)
Parameters Input Market Data
Risk free rate 1.76%
Credit risk 4.7% - 6.6%
Standard deviation/Volatility 44%
Dividend Yield 1.44%
Period 6 years/American
Sensitivity 10%
Parameters Input Market Data
Volatility 20.62%
Delta 85.79%
96
NOTES TO THE CONSOLIDATED FINANCIAL STATEMENTS
INFRA
STRU
CTU
RE F
INA
NC
ING
| T
HE A
RT O
F L
ON
G T
ERM
VIS
ION
AFC / 2015 ANNUAL REPORT & ACCOUNTS
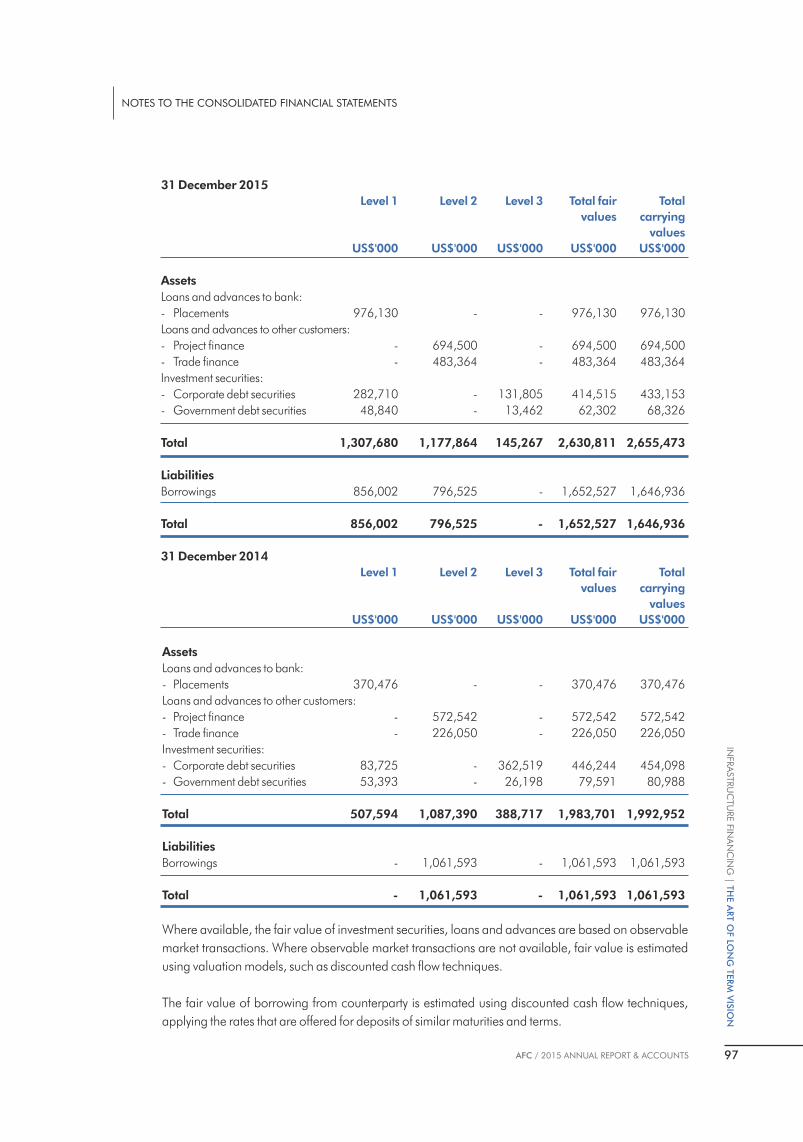
31 December 2015
Level 1 Level 2 Level 3 Total fair Total
values carrying
values
US$'000 US$'000 US$'000 US$'000 US$'000
Assets
Loans and advances to bank:
- Placements 976,130 - - 976,130 976,130
Loans and advances to other customers:
- Project finance - 694,500 - 694,500 694,500
- Trade finance - 483,364 - 483,364 483,364
Investment securities:
- Corporate debt securities 282,710 - 131,805 414,515 433,153
- Government debt securities 48,840 - 13,462 62,302 68,326
Total 1,307,680 1,177,864 145,267 2,630,811 2,655,473
Liabilities
Borrowings 856,002 796,525 - 1,652,527 1,646,936
Total 856,002 796,525 - 1,652,527 1,646,936
31 December 2014
Level 1 Level 2 Level 3 Total fair Total
values carrying
values
US$'000 US$'000 US$'000 US$'000 US$'000
Assets
Loans and advances to bank:
- Placements 370,476 - - 370,476 370,476
Loans and advances to other customers:
- Project finance - 572,542 - 572,542 572,542
- Trade finance - 226,050 - 226,050 226,050
Investment securities:
- Corporate debt securities 83,725 - 362,519 446,244 454,098
- Government debt securities 53,393 - 26,198 79,591 80,988
Total 507,594 1,087,390 388,717 1,983,701 1,992,952
Liabilities
Borrowings - 1,061,593 - 1,061,593 1,061,593
Total - 1,061,593 - 1,061,593 1,061,593
Where available, the fair value of investment securities, loans and advances are based on observable
market transactions. Where observable market transactions are not available, fair value is estimated
using valuation models, such as discounted cash flow techniques.
The fair value of borrowing from counterparty is estimated using discounted cash flow techniques,
applying the rates that are offered for deposits of similar maturities and terms.
97
NOTES TO THE CONSOLIDATED FINANCIAL STATEMENTS
INFRA
STRU
CTU
RE F
INA
NC
ING
| TH
E A
RT O
F LO
NG
TERM
VIS
ION
AFC / 2015 ANNUAL REPORT & ACCOUNTS

3.6 Financial instruments by category
31 December 2014
Assets as per Statement of Financial Position Fair value Loans and through Available- Held-to- Receivables Profit or loss for-sale Maturity Total US$'000 US$'000 US$'000 US$'000 US$'000
Cash and balances with
commercial banks 40,414 - - - 40,414
Loans and advances to banks:
- Placements with banks 976,130 - - - 976,130
Derivatives - 3,534 - - 3,534
Financial assets at fair value
through profit or loss - 226,228 - - 226,228
Loan and advances to other customers:
- Project finance 694,500 - - - 694,500
- Trade finance 483,364 - - - 483,364
Investment securities:
- Debt securities 63,110 - 3,674 434,695 501,479
- Equity securities - - 94,817 - 94,817
Other assets:
- Account receivable 11,215 - - - 11,215
Net book amount 2,268,733 229,762 98,491 434,695 3,031,681
31 December 2014
Assets as per Statement of Financial Position Fair value Loans and through Available- Held-to- Receivables Profit r loss for-sale Maturity Total US$'000 US$'000 US$'000 US$'000 US$'000
Cash and cash equivalents 86,551 - - - 86,551
Loans and advances to banks:
- Placements with banks 370,476 - - - 370,476
Derivatives - 639 - - 639
Financial assets at fair value
through profit or loss - 189,148 - 189,148
Loan and advances to other customers:
- Project finance 572,542 - - - 572,542
- Trade finance 514,848 - - - 514,848
Investment securities:
- Debt securities 63,633 - - 471,453 535,086
- Equity securities - - 100,373 - 100,373
Other assets
- Fee receivable 32,852 - - - 32,852
- Account receivable 29,448 - - - 29,448
Net book amount 1,670,350 189,787 100,373 471,453 2,431,963
The Corporation's financial liabilities are all measured at amortised costs.
98
NOTES TO THE CONSOLIDATED FINANCIAL STATEMENTS
INFRA
STRU
CTU
RE F
INA
NC
ING
| T
HE A
RT O
F L
ON
G T
ERM
VIS
ION
AFC / 2015 ANNUAL REPORT & ACCOUNTS

4. Critical accounting estimates and judgements in applying accounting policies
AFC's financial statements and its financial result are influenced by accounting policies, assumptions,
estimates and management judgement, which necessarily have to be made in the course of preparation of
the financial statements.
The Corporation makes estimates and assumptions that affect the reported amounts of assets and
liabilities within the next financial year. Estimates and judgements are continually evaluated and are based
on historical experience and other factors, including expectations of future events that are believed to be
reasonable under the circumstances
(a) Assumption and estimation uncertainties
Information about assumptions and estimation uncertainties that have a significant risk of resulting in
a material adjustment in the year ending 31 December 2015 is set out in note 3.5 (a) (determination
of the fair value of financial instruments with significant unobservable inputs) relation to the
impairment of financial instruments and in the following notes in relation to other areas:
(b) Impairment losses on loans and advances
The Corporation reviews its loan portfolio to assess impairment on an ongoing basis. In determining
whether an impairment loss should be recorded in the statement of comprehensive income, the
Corporation makes judgements as to whether there is any observable data indicating that there is a
measurable decrease in the estimated future cash flows from a portfolio of loans before the decrease
can be identified with an individual loan in that portfolio. This evidence may include observable data
indicating that there has been an adverse change in the payment status of borrowers in a group, or
national or local economic conditions that correlate with defaults on assets of the Corporation.
Management uses estimates based on knowledge of the client business and agreed worked out
solutions when scheduling its future cash flows. The methodology and assumptions used for
estimating both the amount and timing of future cash flows are reviewed regularly to reduce any
differences between loss estimates and actual loss experience.
The Corporation's loan portfolio consists of two classes namely – trade loans and project finance
loans. Trade loans are granted for trade finance and have an average tenor of one year while project
finance loans have an average tenor of up to five years. The Corporation, being a supranational,
enjoys preferred creditor status across its member countries; this is a strong loss mitigant for the
Corporation. Also, the Corporation does not have a credit loss history on its loan portfolio since
inception. The Corporation's credit framework is very robust as all credits are reviewed and
forwarded to the BRIC for ratification/approval depending on size of the facility.
The Corporation performs extensive review of its loan portfolio quarterly. The status of each credit is
assessed independently by relevant industry specialists and Risk Management by comparing the
actual level of the project against the plan and assessing its performace based on market information
and other operational indices. The quarterly assessment is reviewed and approved by the
management's investment committee (INVESTCO), EXCO and the Board Risk and Investment
Committee (BRIC).
In measuring credit risk of loans and advances to various counterparties, the Corporation considers
99
NOTES TO THE CONSOLIDATED FINANCIAL STATEMENTS
INFRA
STRU
CTU
RE F
INA
NC
ING
| TH
E A
RT O
F LO
NG
TERM
VIS
ION
AFC / 2015 ANNUAL REPORT & ACCOUNTS
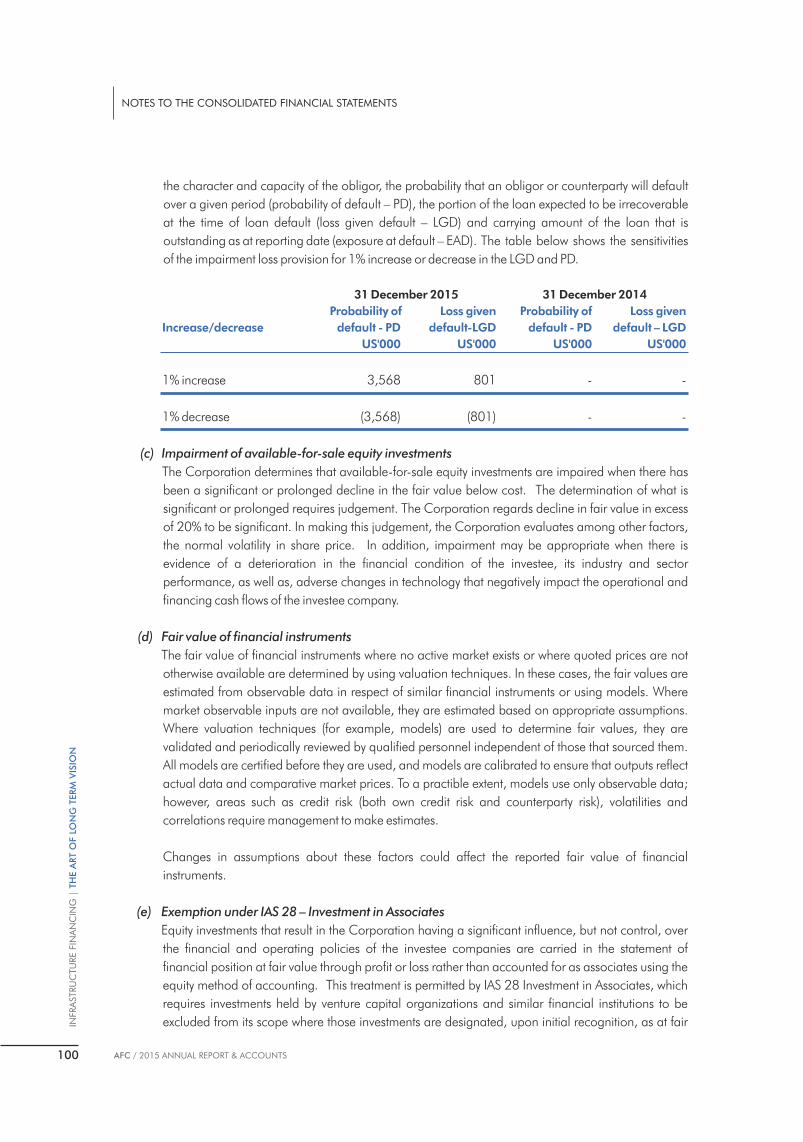
the character and capacity of the obligor, the probability that an obligor or counterparty will default
over a given period (probability of default – PD), the portion of the loan expected to be irrecoverable
at the time of loan default (loss given default – LGD) and carrying amount of the loan that is
outstanding as at reporting date (exposure at default – EAD). The table below shows the sensitivities
of the impairment loss provision for 1% increase or decrease in the LGD and PD.
31 December 2015 31 December 2014
Probability of Loss given Probability of Loss given
Increase/decrease default - PD default-LGD default - PD default – LGD
US'000 US'000 US'000 US'000
1% increase 3,568 801 - -
1% decrease (3,568) (801) - -
(c) Impairment of available-for-sale equity investments
The Corporation determines that available-for-sale equity investments are impaired when there has
been a significant or prolonged decline in the fair value below cost. The determination of what is
significant or prolonged requires judgement. The Corporation regards decline in fair value in excess
of 20% to be significant. In making this judgement, the Corporation evaluates among other factors,
the normal volatility in share price. In addition, impairment may be appropriate when there is
evidence of a deterioration in the financial condition of the investee, its industry and sector
performance, as well as, adverse changes in technology that negatively impact the operational and
financing cash flows of the investee company.
(d) Fair value of financial instruments
The fair value of financial instruments where no active market exists or where quoted prices are not
otherwise available are determined by using valuation techniques. In these cases, the fair values are
estimated from observable data in respect of similar financial instruments or using models. Where
market observable inputs are not available, they are estimated based on appropriate assumptions.
Where valuation techniques (for example, models) are used to determine fair values, they are
validated and periodically reviewed by qualified personnel independent of those that sourced them.
All models are certified before they are used, and models are calibrated to ensure that outputs reflect
actual data and comparative market prices. To a practible extent, models use only observable data;
however, areas such as credit risk (both own credit risk and counterparty risk), volatilities and
correlations require management to make estimates.
Changes in assumptions about these factors could affect the reported fair value of financial
instruments.
(e) Exemption under IAS 28 – Investment in Associates
Equity investments that result in the Corporation having a significant influence, but not control, over
the financial and operating policies of the investee companies are carried in the statement of
financial position at fair value through profit or loss rather than accounted for as associates using the
equity method of accounting. This treatment is permitted by IAS 28 Investment in Associates, which
requires investments held by venture capital organizations and similar financial institutions to be
excluded from its scope where those investments are designated, upon initial recognition, as at fair
100
NOTES TO THE CONSOLIDATED FINANCIAL STATEMENTS
INFRA
STRU
CTU
RE F
INA
NC
ING
| T
HE A
RT O
F L
ON
G T
ERM
VIS
ION
AFC / 2015 ANNUAL REPORT & ACCOUNTS

value through profit or loss and accounted for in accordance with IAS 39, with changes in fair value
recognised in the income statement in the period of the change. The Corporation's operational
activities typically entail provision of equity finance to unquoted companies and taking an active role
in helping to build and develop such companies by having a representation on the Board of the
investee companies. The equity business of the Corporation is managed and appraised
independently from other business entities within the Corporation, with the objective of earning
capital return on its venture capital investments upon exit in the medium term. The Corporation is also
a member of the Africa Private Equity & Venture Capital Association (AVCA).
5. Business Units
The Corporation's primary objective is to finance infrastructure projects across Africa and to provide
advisory, project development and other services related thereto.
Operating units are reported in a manner consistent with the internal reporting provided to executive
management committee and Board of Directors. Segment information is provided on the basis of
business units as the Corporation manages its affairs and business through these areas. The business units
presented reflect the management structure of the Corporation and the way in which the Corporation's
management reviews performance. The Corporation evaluates the performance of its operating
segments primarily based on segment operating profit, as defined below:
1) Investment Division
The Corporation's Investment division is responsible for the end-to-end project development,
origination, structuring and execution of investments. This division is further divided into groups based
on sector classifications, with each group responsible for customer relationship management and
investments within its sector. The Investment division also works closely with Risk Management to
perform portfolio management functions for the Corporation's investment portfolio. The Investment
division offers a diverse range of financing products, such as loans, quasi-equity financing, equity and
arranging services to infrastructure projects in Africa. It also provides technical and economic
advisory services to projects that are in the early stage of project development.
2) Financial Services Division
The Corporation's Financial Services division is divided into three groups, (i) treasury and funding, (ii)
financial institutions and syndication, and (ii) financial advisory. The treasury and funding group is
responsible for the Corporation's capital raising and covers both debt and equity. Its function is to seek
to ensure that the Corporation has adequate capital and the appropriate capital structure.
The treasury and funding group interfaces with the Corporation's shareholders, bankers, potential
lenders, rating agencies and other providers of capital. It is also responsible for the management of
the liquidity of the Corporation, ensuring that all liquidity risk management indices are met and that
the Corporation is able to meet its contractual obligations under normal as well as stressed
environments. It is also responsible for designing and executing hedging activities to manage the
Corporation's exposures to market risk. The financial institutions and syndication team is responsible
for leading syndications of the Corporation's transactions and participations in external syndications,
as well as seeking and executing asset buy and sell down opportunities. It is also responsible for trade
finance transactions that do not fall under one of the sectors in the Investment division and those that
101
NOTES TO THE CONSOLIDATED FINANCIAL STATEMENTS
INFRA
STRU
CTU
RE F
INA
NC
ING
| TH
E A
RT O
F LO
NG
TERM
VIS
ION
AFC / 2015 ANNUAL REPORT & ACCOUNTS

involve financial institutions. The financial advisory group is responsible for providing advisory
services to clients and generating fee-based income for the Corporation.
The segment information provided to the Corporation's Board for the reportable segments for the
period ended 31 December 2015 is as follows:
31 December 2015 Investment Financial Total
Services
US$'000 US$'000 US$'000
Interest income 97,859 60,874 158,733
Fee, commission and other income 7,348 2,573 9,921
Net gain on financial instruments at
fair value through profit or loss 22,283 (3,416) 18,867
Collective impairment (26,710) - (26,710)
Loss on financial instruments at amortised cost - (4,348) (4,348)
Interest & administrative expenses (55,499) (28,371) (83,870)
Operating profit 45,281 27,312 72,593
Total Assets 1,453,687 1,586,026 3,039,713
Total liabilities 24,345 1,649,654 1,673,999
Expenditure on reportable segment:
Non-current assets 538 331 869
Depreciation and amortisation 964 592 1,556
31 December 2014
Interest income 69,650 34,790 104,440
Fee, commission and other income 63,932 - 63,932
Net gain on financial instruments at
fair value through profit or loss 9,979 287 10,266
Impairment loss on financial assets (6,586) - (6,586)
Interest & administrative expenses (55,972) (11,394) (67,366)
Operating profit 81,003 23,683 104,686
Total Assets 1,559,574 879,532 2,439,106
Total liabilities 14,027 1,072,684 1,086,711
Expenditure on reportable segment:
Non-current assets 1,238 161 1,399
Depreciation and amortisation 1,228 160 1,388
102
NOTES TO THE CONSOLIDATED FINANCIAL STATEMENTS
INFRA
STRU
CTU
RE F
INA
NC
ING
| T
HE A
RT O
F L
ON
G T
ERM
VIS
ION
AFC / 2015 ANNUAL REPORT & ACCOUNTS

2015 2014
US$'000 US$'000
6. Interest income
From
- Loans and advances to other customers 96,228 67,178
- Loans and advances to banks 29,084 8,644
- Investment securities 33,421 28,618
158,733 104,440
Interest expense
Borrowings from financial institutions 35,970 28,790
Corporate bonds 17,880 -
53,850 28,790
7. Dividend income
Available-for-sale securities 30 1,228
30 1,228
8. Fee and commission income
Risk participation and commitment fees 3,974 3,350
Advisory and structuring fees 3,602 8,632
Development fees - 21,401
Arrangement and facility fees 2,315 5,216
9,891 38,599
9. In prior year, the Corporation recognised income from sale of its investments in certain equity
securities, in line with the Corporation's exit strategy on these investments. There were no exits in the
current year. 2015 2014
US$'000 US$'000
10. Net gain/(loss) on financial instruments at
fair value through profit or loss
Equity investments 40,646 17,155
Hybrid instruments (20,060) (7,176)
Asset under management 236 287
Derivatives held for risk management purposes:
Interest rate (2,718) -
Foreign exchange 763 (487)
18,867 9,779
103
NOTES TO THE CONSOLIDATED FINANCIAL STATEMENTS
INFRA
STRU
CTU
RE F
INA
NC
ING
| TH
E A
RT O
F LO
NG
TERM
VIS
ION
AFC / 2015 ANNUAL REPORT & ACCOUNTS
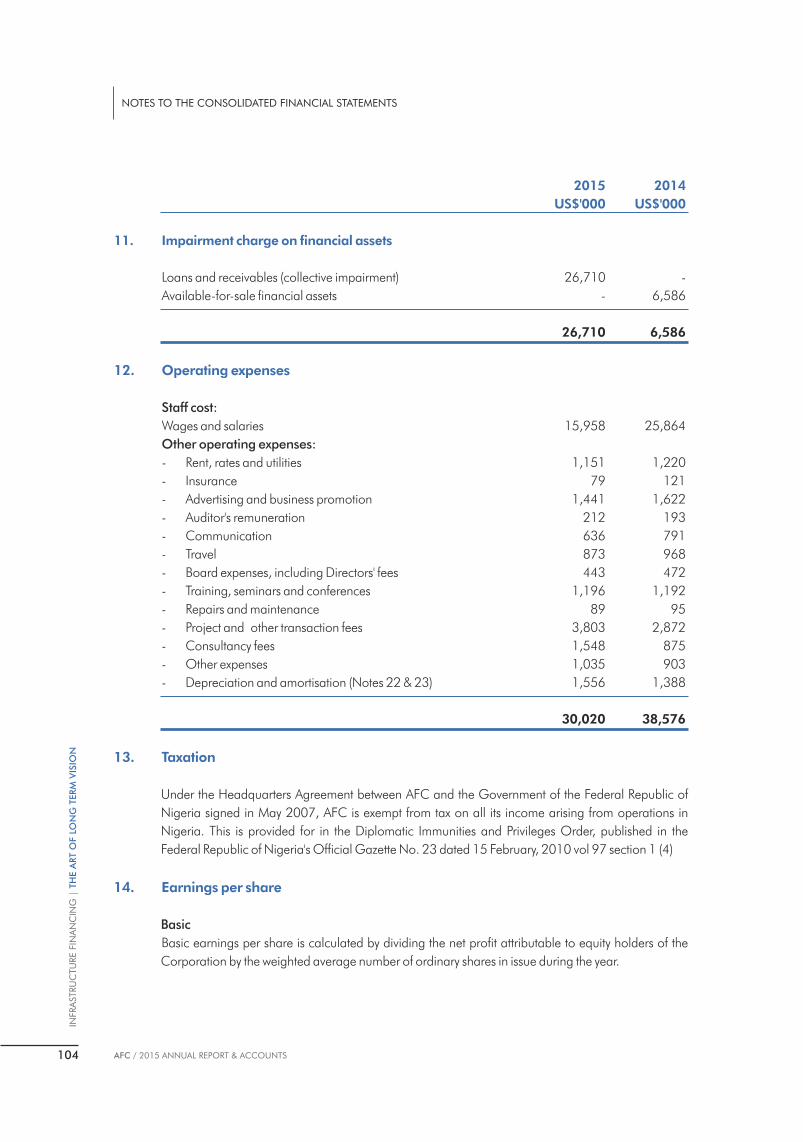
2015 2014
US$'000 US$'000
11. Impairment charge on financial assets
Loans and receivables (collective impairment) 26,710 -
Available-for-sale financial assets - 6,586
26,710 6,586
12. Operating expenses
Staff cost:
Wages and salaries 15,958 25,864
Other operating expenses:
- Rent, rates and utilities 1,151 1,220
- Insurance 79 121
- Advertising and business promotion 1,441 1,622
- Auditor's remuneration 212 193
- Communication 636 791
- Travel 873 968
- Board expenses, including Directors' fees 443 472
- Training, seminars and conferences 1,196 1,192
- Repairs and maintenance 89 95
- Project and other transaction fees 3,803 2,872
- Consultancy fees 1,548 875
- Other expenses 1,035 903
- Depreciation and amortisation (Notes 22 & 23) 1,556 1,388
30,020 38,576
13. Taxation
Under the Headquarters Agreement between AFC and the Government of the Federal Republic of
Nigeria signed in May 2007, AFC is exempt from tax on all its income arising from operations in
Nigeria. This is provided for in the Diplomatic Immunities and Privileges Order, published in the
Federal Republic of Nigeria's Official Gazette No. 23 dated 15 February, 2010 vol 97 section 1 (4)
14. Earnings per share
Basic
Basic earnings per share is calculated by dividing the net profit attributable to equity holders of the
Corporation by the weighted average number of ordinary shares in issue during the year.
104
NOTES TO THE CONSOLIDATED FINANCIAL STATEMENTS
INFRA
STRU
CTU
RE F
INA
NC
ING
| T
HE A
RT O
F L
ON
G T
ERM
VIS
ION
AFC / 2015 ANNUAL REPORT & ACCOUNTS

2015 2014
Profit attributable to equity holders of the Corporation (US$' 000) 72,593 104,686
Weighted average number of ordinary shares in issue (' 000) 1,089,067 1,089,067
Basic earnings per share (expressed in US cents per share) 6.67 9.61
Diluted
The dilutive earnings per share is calculated by adjusting the weighted average number of ordinary
shares to assume conversion of all dilutive potential ordinary shares. (There were no potential dilutive
ordinary shares during the year).
2015 2014
Weighted average number of ordinary shares in issue (' 000) 1,089,067 1,089,067
Diluted earnings per share (expressed in US cents per share) 6.67 9.61
15. Cash and balances commercial banks
2015 2014
US$'000 US$'000
Cash in hand 12 19
Balances with commercial banks 40,402 86,532
40,414 86,551
16. Loans and advances to banks
2015 2014
US$'000 US$'000
Placements with banks 976,130 370,476
All loans and advances to banks are current.
17. Derivative financial instruments
The table below shows the fair values of derivative financial instruments recorded as assets or
liabilities together with their notional amounts. The notional amount, recorded gross, is the amount of
a derivative's underlying asset, reference rate or index and is the basis upon which changes in the
value of derivatives are measured. The notional amounts indicate the volume of transactions
outstanding at the year end and are indicative of neither the market risk nor the credit risk.
105
NOTES TO THE CONSOLIDATED FINANCIAL STATEMENTS
INFRA
STRU
CTU
RE F
INA
NC
ING
| TH
E A
RT O
F LO
NG
TERM
VIS
ION
AFC / 2015 ANNUAL REPORT & ACCOUNTS

Assets Liabilities Notionals 2015 2015 2015 US$'000 US$'000 US$'000
Derivatives
Options 2,041 - 14,576
Forward contracts 1,493 57,812
Interest rate swaps - 2,718 770,000
3,534 2,718 842,388
Assets Liabilities Notionals 2014 2014 2014 US$'000 US$'000 US$'000
Derivatives Options 639 14 17,930
All derivatives are current in nature.
18. Financial assets at fair value through profit or loss 2014 2013 US$'000 US$'000
Designated at initial recognition
- Hybrid instruments (convertible debt) (a) 53,625 72,316
- Equity securities (b) 158,134 99,566
Assets under management (c) 14,469 17,266
226,228 189,148
Current 361 341
Non-current 225,867 188,807
(a) The option component of the convertible debt is equity indexed, which results in no closely
related risks inherent in the host contract. The Corporation therefore designated the hybrid
contract as financial asset at fair value through profit or loss. Valuation was carried out using a
binomial distribution methodology.
(b) Equity securities at fair value through profit or loss include:
2015 2014 Percentage US$'000 US$'000 shareholding
MainOne Cable Company (i) 40,359 36,265 23%
Cabeolica S.A. (ii) 14,900 13,899 42%
Vigeo Power (iii) 12,739 7,795 20%
Cenpower Generation Company (iv) 78,605 36,607 32%
Ncondezi (v) 3,059 5,000 23%
Socoprim 8,161 - 26%
Singrobro 311 - 22%
158,134 99,566
106
NOTES TO THE CONSOLIDATED FINANCIAL STATEMENTS
INFRA
STRU
CTU
RE F
INA
NC
ING
| T
HE A
RT O
F L
ON
G T
ERM
VIS
ION
AFC / 2015 ANNUAL REPORT & ACCOUNTS

(i) MainOne Cable Company: is a telecommunications company and a leading provider of
innovative telecom services and network solutions for businesses in West Africa. Total direct and
indirect holding in MainOne stood at 23% as at 31 December 2015. The summarized un-audited
financial information for MainOne is presented below:
October October 2015 2014 US$'000 US$'000
Current assets 38,085 33,340
Non-current assets 219,506 230,996
Current liabilities 32,122 30,662
Non-current liabilities 57,969 48,511
Revenue 46,646 44,818
Profit/(loss) after tax 979 3,175
Total comprehensive income/(loss) 979 2,391
(ii) Cabeolica S.A: a wind power company based in Cape Verde supplying about 20% of installed
electricity capacity of the country. The summarized un-audited financial information for
Cabeolica S.A. is presented below: December December 2015 2014 US$'000 US$'000
Current assets 9,198 10,855
Non-current assets 53,970 63,998
Current liabilities 7,278 9,133
Non-current liabilities 53,706 64,364
Revenue 11,453 12,835
Profit/(loss) after tax 1,291 821
Total comprehensive income/(loss) 1,291 821
(iii) Vigeo Power Limited: a power distribution company in south-west part of the host country
Nigeria.
(iv) Cenpower Generation Company: a power generating company in Ghana. The summarized
un-audited financial information for Cenpower is presented below:
December December 2015 2014 US$'000 US$'000
Current assets 50,255 21,142
Non-current assets 7 207,588
Current liabilities 29 132,968
Non-current liabilities - 63,927
(v) Ncondezi: a power development company with an integrated thermal coal power plant and
mine project located on the Ncondezi licences in the Tete Province, Northern Mozambique.
107
NOTES TO THE CONSOLIDATED FINANCIAL STATEMENTS
INFRA
STRU
CTU
RE F
INA
NC
ING
| TH
E A
RT O
F LO
NG
TERM
VIS
ION
AFC / 2015 ANNUAL REPORT & ACCOUNTS

The Corporation acquired stakes in these companies with the intention to exit at a future date. The
Corporation does not have any commitments to these entities outside the existing investments.
(c) Assets under management represent funds that are managed by a third party investment
company on a discretionary basis. The market prices of these investments are observable.
19. Loans and advances to other customers 2015 2014 US$'000 US$'000
Project finance loans 713,885 572,542
Advances under trade finance 490,689 514,848
1,204,574 1,087,390
Collective impairment (26,710) -
1,177,864 1,087,390
Current 378,299 426,104
Non-current 799,565 661,286
20. Investment securities 2015 2014 US$'000 US$'000
(a) Debt securities at amortised cost (see note(i) below):
- Corporate debt securities 429,479 454,098
- Sovereign debt securities 68,326 80,988
497,805 535,086
Current 108,672 38,419
Non-current 389,133 496,667
(i) Included in investment securities are debt securities which have been transferred but not
derecognised in the consolidated financials statement as the Corporation still retained the risks
and rewards as at reporting date. These transactions were conducted under terms that are usual
and customary to standard lending and repurchase activities.
Details are as below: 2015 2014
US$'000 US$'000
Carrying amount of the assets (See note 25) 158,300 214,325
Carrying amount of the associated liabilities (See note 25) 108,836 148,928
Fair value of the assets 136,505 208,732
Fair value of the liabilities (108,836) (148,928)
Net fair value 27,669 59,80
108
NOTES TO THE CONSOLIDATED FINANCIAL STATEMENTS
INFRA
STRU
CTU
RE F
INA
NC
ING
| T
HE A
RT O
F L
ON
G T
ERM
VIS
ION
AFC / 2015 ANNUAL REPORT & ACCOUNTS

As at 31 December 2015, the Corporation held no collateral, which it was permitted to sell or
repledge in the absence of default by the owner of the collateral (31 December 2014: Nil).
(b) Financial assets at fair value through OCI 2015 2014 US$'000 US$'000
- Equity securities – unlisted (see note (i) below) 94,817 100,373
- Debt securities 3,674 -
98,491 100,373
Current - -
Non-current 98,491 100,373
(i) The movement in financial assets at fair value through OCI (equities) from the preceding
financial year is as follows: 2015 2014 US$'000 US$'000
At beginning of the year 100,373 99,966
Additions 1,095 1,650
Net (loss)/gain on fair valuation through
other comprehensive income (2,417) 9,265
Impairment loss on financial assets - (6,586)
Capital repayments (4,234) (3,922)
At end of the year 94,817 100,373
21. Other assets
Fees receivable - 32,852
Account receivable 11,215 29,448
Prepayments 5,545 3,904
16,760 66,204
Current 6,389 64,799
Non-current 10,371 1,405
Other assets are neither past due nor impaired.
109
NOTES TO THE CONSOLIDATED FINANCIAL STATEMENTS
INFRA
STRU
CTU
RE F
INA
NC
ING
| TH
E A
RT O
F LO
NG
TERM
VIS
ION
AFC / 2015 ANNUAL REPORT & ACCOUNTS

22. Property and equipment Motor Leasehold Furniture & Vehicles improvement equipment Total US$'000 US$'000 US$'000 US$'000
At 1 January 2014
Cost 2,529 1,582 2,921 7,032
Accumulated depreciation (1,084) (1,568) (2,247) (4,899)
Net book amount 1,445 14 674 2,133
Year ended December 2014
Opening net book value 1,445 14 674 2,133
Additions 473 12 405 890
Disposal – cost (587) - (37) (624)
Disposals – accumulated depreciation 400 - 37 437
Depreciation charge (594) (5) (236) (835)
Closing net book amount 1,137 21 843 2,001
At 1 January 2015
Cost 2,415 1,594 3,288 7,297
Accumulated depreciation (1,278) (1,573) (2,445) (5,296)
Net book amount 1,137 21 843 2,001
Period ended 31 December 2015
Opening net book value 1,137 21 843 2,001
Additions 502 - 343 845
Disposal – cost (276) - (107) (383)
Disposals – accumulated depreciation 236 - 82 318
Depreciation charge (610) (7) (319) (936)
Closing net book amount 989 14 842 1,845
At 31 December 2015
Cost 2,641 1,594 3,524 7,759
Accumulated depreciation (1,652) (1,580) (2,682) (5,914)
Net book amount 989 14 842 1,845
110
NOTES TO THE CONSOLIDATED FINANCIAL STATEMENTS
INFRA
STRU
CTU
RE F
INA
NC
ING
| T
HE A
RT O
F L
ON
G T
ERM
VIS
ION
AFC / 2015 ANNUAL REPORT & ACCOUNTS

23. Intangible assets
2015 2014 US$'000 US$'000
Software cost 642 1,238
Software costs are costs incurred on the purchase and implementation of the Corporation's software.
The movement in intangible assets from the preceding financial year is as follows:
2015 2014 US$'000 US$'000
At 1 January 1,238 1,282
Additions 24 509
Amortisation (620) (553)
At 31 December 642 1,238
24. Accrued expenses and other liabilities
2015 2014 US$'000 US$'000
Unearned commission 6,878 6,115
Accruals 3,253 11,104
Accounts payable 4,188 4,742
Deposit for shares (note (i)) 10,000 -
Balances held under facility agency arrangement (note(ii)) - 3,018
Pension liabilities - 99
Other liabilities 26 26
24,345 25,104
All liabilities above are current.
(i) Amount represents deposit made by the Republic of Ghana during the year, for subscription to
the shares of the Corporation.
(ii) Balances held under facility agency arrangement represents amount received by the
Corporation in its capacity as Facility Agent from the borrower in a project finance transaction.
111
NOTES TO THE CONSOLIDATED FINANCIAL STATEMENTS
INFRA
STRU
CTU
RE F
INA
NC
ING
| TH
E A
RT O
F LO
NG
TERM
VIS
ION
AFC / 2015 ANNUAL REPORT & ACCOUNTS

25. Borrowings 2015 2014 US$'000 US$'000
Corporate bonds issued (note (i)) 853,406 -
Other borrowings (note (ii)) 793,530 1,061,593
1,646,936 1,061,593
Current 340,942 455,337
Non-current 1,305,994 606,256
(i) Amount represents outstanding balance on issuances made under the Corporation's maiden
Eurobond program. The Corporation had its maiden eurobond issue during the year and
established a US$3billion Global Medium Term Notes (GMTN) program under the eurobond
issue. The terms and conditions of the term notes issued under the Corporation's GMTN
program are as follows:
Year of Maturity Rate (%) Rate Type
US$ 750 million GMTN 2020 4.375 Fixed
US$ 50 million GMTN 2017 1.314 Floating
US$ 20 million GMTN 2016 1.500 Fixed
US$ 20 million GMTN 2016 1.326 Floating
US$ 14 million GMTN 2016 1.212 Floating
(ii) Other borrowings comprises borrowings from banks and other development financial
institutions within Africa and Europe. These are floating rate liabilities and repricing of these
borrowings are between 3 months and 6 months.
(iii) Included in other borrowings is an amount of US$ 108,836,072 (2014: US$148,928,014)
which has been secured using Corporate and Sovereign securities of US$158,300,000 (2014:
US$214,325,000). See note 20(a)(i) for more details.
(iv) The Corporation has not had any defaults of principal, interest and other covenant breaches with
respect to its borrowings.
(v) The maturity profile of borrowings are as follows:
2015 2014 US$'000 US$'000
Less than 1 year 340,942 455,337
1 – 3 years 318,109 401,405
Over 3 years 987,885 204,851
1,646,936 1,061,593
112
NOTES TO THE CONSOLIDATED FINANCIAL STATEMENTS
INFRA
STRU
CTU
RE F
INA
NC
ING
| T
HE A
RT O
F L
ON
G T
ERM
VIS
ION
AFC / 2015 ANNUAL REPORT & ACCOUNTS
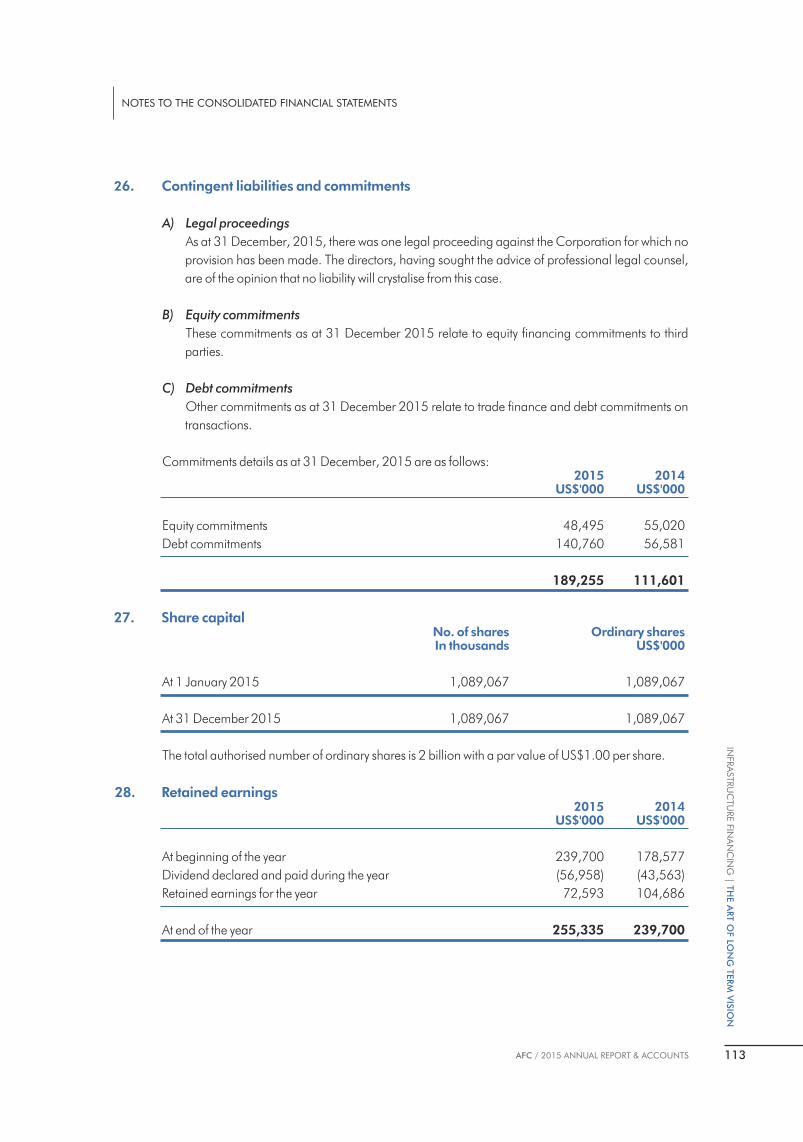
26. Contingent liabilities and commitments
A) Legal proceedings
As at 31 December, 2015, there was one legal proceeding against the Corporation for which no
provision has been made. The directors, having sought the advice of professional legal counsel,
are of the opinion that no liability will crystalise from this case.
B) Equity commitments
These commitments as at 31 December 2015 relate to equity financing commitments to third
parties.
C) Debt commitments
Other commitments as at 31 December 2015 relate to trade finance and debt commitments on
transactions.
Commitments details as at 31 December, 2015 are as follows: 2015 2014 US$'000 US$'000
Equity commitments 48,495 55,020
Debt commitments 140,760 56,581
189,255 111,601
27. Share capital No. of shares Ordinary shares In thousands US$'000
At 1 January 2015 1,089,067 1,089,067
At 31 December 2015 1,089,067 1,089,067
The total authorised number of ordinary shares is 2 billion with a par value of US$1.00 per share.
28. Retained earnings 2015 2014 US$'000 US$'000
At beginning of the year 239,700 178,577
Dividend declared and paid during the year (56,958) (43,563)
Retained earnings for the year 72,593 104,686
At end of the year 255,335 239,700
113
NOTES TO THE CONSOLIDATED FINANCIAL STATEMENTS
INFRA
STRU
CTU
RE F
INA
NC
ING
| TH
E A
RT O
F LO
NG
TERM
VIS
ION
AFC / 2015 ANNUAL REPORT & ACCOUNTS

29. Fair value reserves 2015 2014
US$'000 US$'000
At beginning of the year 23,628 14,363
Net gains on available-for-sale financial assets (2,316) 9,265
At end of the year 21,312 23,628
30. Dividends
Dividends are not accounted for until they have been ratified at the Annual General Meeting.
The Board of Directors is proposing a dividend of 3.23 US cents per share (2014: 5.23 cents per
share), amounting to approximately US$ 35,176,865 (2014: US$56,958,205). The resolution on
payment of dividend will be tabled before the annual general meeting scheduled for 4 April 2016
and if approved, the dividend will be paid to all qualifying shareholders who are on the register of
members as of that date.
31. Cash and cash equivalents
For the purposes of the cash flow statement, cash and cash equivalents comprise the following
balances with less than three months maturity from the date of acquisition.
2015 2014 US$'000 US$'000
Cash in hand and balances with
commercial banks (Note 15) 40,414 86,551
Placements with other banks (see (i) below) 975,552 370,468
At end of the year 1,015,966 457,019
(i) Amount excludes the interest receivable portion of placements with other banks.
32. Related party transactions
Parties are considered to be related if one party has the ability to control the other party or exercise
influence over the other party in making financial and operational decisions, or one other party
controls both. The definition includes subsidiaries, associates, significant shareholders and their
companies as well as key management personnel.
A number of transactions were entered into during the year with related parties in the normal course
of business. These transactions were with banks that are shareholders of the Corporation and an
institutional shareholder. The outstanding related party transactions at year end and the related
income for the year are as follows:
114
NOTES TO THE CONSOLIDATED FINANCIAL STATEMENTS
INFRA
STRU
CTU
RE F
INA
NC
ING
| T
HE A
RT O
F L
ON
G T
ERM
VIS
ION
AFC / 2015 ANNUAL REPORT & ACCOUNTS

a) Loans and advances to related parties Banks and other shareholders
2015 2014 US$'000 US$'000
Loans outstanding as at end of year 229,984 152,708
Corporate bonds as at end of year 199,128 152,000
Interest income earned 44,582 22,586
20% of the loans made to related parties are secured. The remaining unsecured balance represents
loans which are short term in nature. No specific provisions have been recognised in respect of any
related party credit facility.
b) Key management compensation 2015 2014 US$'000 US$'000
Salaries and other short-term benefits 3,610 3,790
Post employment benefits 448 1,481
Key management staff refers to members of the Executive Management Committee, which are: (a)
President and Chief Executive Officer, (b) Executive Director, Chief Operating Officer and General
Counsel, (c) Executive Director and Chief Investment Officer, (d) Executive Director, Financial
Services, (e) Director & Chief Financial Officer, and (f) Senior Vice President & Chief Risk Officer.
33. Events after the statement of financial position date
There were no events after the statement of financial position date which materially affect these
financial statements.
115
NOTES TO THE CONSOLIDATED FINANCIAL STATEMENTS
INFRA
STRU
CTU
RE F
INA
NC
ING
| TH
E A
RT O
F LO
NG
TERM
VIS
ION
AFC / 2015 ANNUAL REPORT & ACCOUNTS

Principal Bankers
Access Bank plcOyin Jolayemi Street Victoria IslandLagos StateNigeria
Deutsche Bank AG Herengracht 450 2nd Floor 1017 CA Amsterdam Netherlands
Ecobank plcPlot 21 Ahmadu Bello WayVictoria IslandLagos StateNigeria
Guaranty Trust Bank plcPlot 635, Akin AdesolaVictoria IslandLagos StateNigeria
J P Morgan Chase & Co. 270 Park AvenueNew York, NY 10017-2070 USA
Standard Chartered Bank Head Ofce1 Basinghall AvenueLondon EC2V 5DDUK
United Bank for Africa UBA House, 57 Marina P.O. Box 2406Lagos StateNigeria
Zenith Bank plcPlot 84 Ajose Adeogun Street Victoria IslandLagos StateNigeria
Africa Finance Corporation
A: Headquarters3a Osborne Road lkoyiLagos StateNigeria
T: +234 1 279 9600 E: [email protected]: africafc.org
AuditorsPriceWaterHouseCoopersPlot 252E Muri Okunola Street Victoria IslandLagos StateNigeria
116
INFRA
STRU
CTU
RE F
INA
NC
ING
| T
HE A
RT O
F L
ON
G T
ERM
VIS
ION
AFC / 2015 ANNUAL REPORT & ACCOUNTS
CORPORATE INFORMATION
CORPORATE INFORMATION

AFRICA FINANCE CORPORATION ... Building the New Africa
