infrared spectroscopy investigations in neurovascular
TRANSCRIPT

DOCTOR OF MEDICAL SCIENCE DANISH MEDICAL JOURNAL
DANISH MEDICAL JOURNAL 1
This review was accepted as a thesis together with seven original papers by University of Copenhagen December 23, 2014 and defended on September 23, 2015. Official opponents: Professor Flemming Winther Bach and Professor Arne May Correspondence: Danish Headache Center, Department of Neurology, Rigshospitalet Glostrup, Nordre Ringvej 57, 2600 Glostrup Denmark E‐mail: [email protected]
Dan Med J 2015;62(12)B5166
The thesis is based on the following papers: 1. Schytz HW, Wienecke T, Jensen LT, Selb J, Boas DA & Ashina
M. Changes in cerebral blood flow after acetazolamide: an experimental study comparing near‐infrared spectroscopy and SPECT. European Journal of Neurology 2009; 16: 461‐467.
2. Phillip D, Schytz HW, Selb J, Payne S, Iversen HK, Skovgaard LT, Boas DA & Ashina M. Low frequency oscillations in ce‐phalic vessels assessed by near infrared spectroscopy. European Journal of Clinical Investigations 2012; 42: 1180‐1188.
3. Schytz HW, Ciftçi K, Akin A, Ashina M & Bolay H. Intact neurovascular coupling during executive function in mi‐graine without aura: interictal near‐infrared spectroscopy study. Cephalalgia 2010; 30: 457‐466.
4. Schytz HW, Hansen JM, Phillip D, Selb J, Boas DA & Ashina M. Nitric oxide modulation of low‐frequency oscillations in cortical vessels in FHM ‐ a NIRS study. Headache 2012; 52: 1146‐1154.
5. Schytz HW, Barløse M, Guo S, Selb J, Caparso A, Jensen R & Ashina M. Experimental activation of the sphenopalatine ganglion provokes cluster‐like attacks in humans. Cephalal‐gia 2013; 33(10):831‐41.
6. Schytz HW, Jensen BE, Jennum P, Selb J, Boas DA & Ashina M. Low‐frequency oscillations and vasoreactivity of cortical vessels in obstructive sleep apnea during wakefulness: A near infrared spectroscopy study. Sleep Medicine 2013; 14(5):416‐21.
7. Schytz HW, Guo S, Jensen LT, Kamar M, Nini A, Gress DR & Ashina M. A new technology for detecting cerebral blood flow: a comparative study of ultrasound tagged NIRS and 133Xe‐SPECT. Neurocritical Care 2012; 17: 139‐145.
INTRODUCTION The human brain depends on a fascinating intricate and complex interaction between neurons and the cerebral vasculature. Neurovascular disease encompasses a growing number of neuro‐logical diseases based on recent scientific explorations. As an example, neurovascular dysregulation has been demonstrated in Alzheimer´s disease (AD) and is likely to be involved in the disease mechanism of AD (1). In the primary headaches, especially within the field of migraine, there is an ongoing debate on possible neurovascular dysautoregulation, which is still not resolved (2‐6). It is of obvious great interest to investigate brain function and vascular changes with different imaging modalities. Most imaging methods detect brain activity indirectly by monitoring hemody‐namic changes and uptake of tracers consequent to neuronal activity, these include single photon emission computer tomogra‐phy (SPECT), positron emission tomography (PET) and magnetic resonance imaging (MRI) (7). Near infrared spectroscopy (NIRS) is an emerging optical imaging method (8), which is non‐invasive, easy to use, has a high patient‐tolerability and does not expose patients to radiation. However, NIRS is largely unknown in clinical neurology, even at specialized centers, despite being an often used research tool (9). It is therefore of key interest to examine neurological diseases, which NIRS may be useful in, and to de‐velop new NIRS methods to be applied in neurology. Recently, Obrig (9) reviewed the present state of NIRS in neurological dis‐eases and identified neurovascular diseases, primary headache and epilepsy as the three major disease entities in which NIRS may become more than a promising tool. In stroke research NIRS would especially be of interest to apply as a non‐invasive method to study changes in cerebral blood flow (CBF) and cerebral auto‐regulation, but NIRS has yet not proven to measure CBF reliably, and validation studies in cerebral autoregulation studies have not been performed yet. In headache research NIRS has been applied in a few studies in migraine with aura (MA) and migraine without aura (MO) to investigate vasoreactivity (10‐12), functional neurovascular coupling (13) and vascular alterations during and between attacks (14). The studies are difficult to compare due to differences in design and migraine subtype, and other primary headache disorders have not been investigated with NIRS. Hence, further studies within the headache field are highly needed to explore headache pathophysiology and possibly find specific biological headache markers using NIRS. In obstructive sleep apnea (OSA), which may be coined a cerebrovascular disease based on the increased risk of heart attack and stroke (15‐17), NIRS has been applied in studies measuring primarily vascular alteration during apnea episodes (18, 18‐21), and further studies
Near infrared spectroscopy ‐ investigations in neurovascular diseases
Henrik Winther Schytz

DANISH MEDICAL JOURNAL 2
are in demand to investigate if there are other vascular changes that may explain the increased stroke risk. The purpose of this thesis was to explore and develop methods, where NIRS can be applied in different neurovascular diseases, in order to find biological markers that may become useful in clinical neurology. The thesis specifically aimed to explore the ability of NIRS: A) To study changes in CBF, B) to reliably detect spontane‐ous cerebral autoregulation, C) to detect neurovascular coupling in MO patients, D) to study vasoreactivity in familial hemiplegic migraine (FHM) patients, E) to study cephalic vascular changes following neurostimulation of the sphenopalatine ganglion (SPG) in cluster headache (CH) patients, F) to study increased sympa‐thetic tone in cortical vessels in OSA patients. NEAR INFRARED SPECTROSCOPY IN NEUROLOGY Basic physical principles of near infrared spectroscopy In 1977 Frans F. Jöbsis at Duke University in the U.S. demon‐strated that it was possible to measure changes in near infrared light attenuation from temple to temple in anesthetized cats during normoxia, anoxia and asphyxia (22), which thereby initi‐ated the field of NIRS brain imaging. Then 8 years later, in 1985, the first human brain clinical studies were published by Brazy et al. (23, 24) and Ferrari et al. (25). Since then the utility of NIRS in neuroscience has been expanding (8). NIRS utilizes the absorption and scattering properties of light at wavelengths of approximately 650‐950 nm, which is the so‐called “optical window” into biologi‐cal tissue (7, 22). The biological chromophores of primary interest are oxygenated (HbO) and deoxygenated hemoglobin (HbR), which absorb light in the near infrared spectrum. Thus, changes in detected light from a constant source reflect changes in HbO and HbR concentrations, assuming that the concentrations of other biological absorbing and scattering tissue are constant. There are 3 technological approaches to NIRS (figure 1). Continu‐ous‐wave (CW)‐NIRS, which measures the changes in attenuation of light from a constant light source (8). Frequency domain (FD)‐NIRS uses light that is amplitude modulated at a high frequency (a few hundred MHz) and measures the reduction in amplitude and phase shift of the transmitted signal (26). Time‐domain (TD)‐NIRS measures the temporal distribution of photons produced when a short duration (a few picoseconds) pulse of light is transmitted through the object of interest (26). FD‐ and TD‐NIRS are more complex systems, but can retrieve absolute values of oxygenation and cerebral blood value, whereas CW‐NIRS can only retrieve relative concentrations of chromophores. Yet, CW‐NIRS is the most widely used system in clinical neurology and neuroscience, including all studies in this thesis.
Figure 1 Illustration of different near infrared spectroscopy approaches. I: intensity, ϕ: phase shift, M: modulation depth, t: time. Adapted from the PhD thesis “Development of a Time‐Resolved Optical Tomography System for Neonatal Brain Imaging” by Florian E. W. Schmidt, 1999. Bio‐medical Optics Research Laboratory, University College London of Medical Physics and Bioengineering, England.
To quantify changes in HbO and HbR, the NIRS light intensity is converted to time series of variations in HbO and HbR concentra‐tions using the modified Beer–Lambert law (MBLL) (27, 28):
ΔOD(λ) = Δµa(λ)LℓDPF(λ) = (ɛHbO(λ)Δ(HbO) + ɛHbR(λ)Δ(HbR)) × LℓDPF(λ) ΔOD(λ) is change in optical density at a given wavelength, Δµa(λ) is the corresponding change in tissue absorption, L is the separa‐tion between source and detector and ℓDPF(λ) is the differential pathlength factor. The change in absorption is related to relative changes in concentrations of HbO and HbR by the extinction coefficients ɛHbO(λ) and ɛHbR(λ), which are wavelength depend‐ent. If changes in optical density are measured with two different wavelengths, then the concentrations changes can be calculated based on two equations with two unknown. When applying the MBLL in CW‐NIRS in vivo in the human brain certain assumptions are violated, which affect the accuracy and quantification of HbO and HbR. The key assumptions are that monitored areas are homogeneous, and that changes are ho‐mogenous (8). These assumptions are wrong as the scalp, skull and brain are heterogeneous in composition, and since HbO changes predominate in the arterial compartment, whereas HbR changes predominate in the venous compartment. A theoretical and experimental study suggests that following a motor‐task 76% of the entire ΔHbO signal and 19% of the entire ΔHbR signal arise from the cortical region (29). The remaining 24% and 81% of the ΔHbO and ΔHbR signals respectively originate from the pial veins located at the surface of the cortex, where a change in oxygen saturation takes place following brain activation (29). So when focal or global changes are elicited in the cortex by a specific stimulation, this will influence the magnitude of the change calcu‐lated and produce cross talk (30), which is an erroneous calcula‐tion of a change in one chromophore due to the real change in another. During functional NIRS studies it is also estimated, using source‐detector distances between 2‐5 cm, that the activated region only represents a 10 % fraction of the sampling region (31). These issues lead to a relative low spatial resolution for CW‐NIRS compared to other vascular imaging, such as fMRI, PET and SPECT, which is contrasted by the excellent temporal resolution in CW‐NIRS. It is also well known that the CW‐NIRS signal is strongly contaminated by systemic interference occurring in the superfi‐cial layers of the head (32) and has in one study been estimated to account for 17% of the total NIRS signal (33). The contribution is dependent upon the experimental setting. Thus, in a quiet non‐stressful environment functional changes in cortical HbO and HbR can be relatively easily measured via functional stimuli (34), but experiment inducing both systemic and cerebral effects may be very difficult to interpret. To minimize the skin contribution data from superficial 1 cm channel can be regressed out from the corresponding 3 cm channel (aiming at measuring only cortical vascular changes). Thus, experimental studies demonstrate that a single short separation channel produces an average reduction in noise of 33% for HbO, and by using two short separation meas‐urements further increases the performance to an average noise reduction of 59% (35). NIRS is also very susceptible to signal arti‐facts caused by relative motion between the NIRS fibers and the scalp. These artifacts can be very damaging to the utility of NIRS, particularly in challenging patient groups where motion can be unavoidable. A number of approaches to the removal of motion artifacts from NIRS data have been suggested (36, 36, 37), and developments within this field are ongoing. To sum up, when using CW‐NIRS the degree of assumption viola‐tions and artifacts are very dependent upon the experimental setting, challenge and patient selection, which is very important to keep in mind when designing NIRS studies.

DANISH MEDICAL JOURNAL 3
NIRS and measurement of cerebral blood flow Given that NIRS is so easy to use, it would be of great benefit to use as a non‐invasive system to estimate alterations in cerebral blood flow (CBF). CW‐NIRS is currently being used in both routine surgical procedures and intensive care units, but there is insuffi‐cient data on the ability of NIRS to measure CBF in clinical settings (38). CW‐ NIRS does not directly measure CBF, and following acetazolamide only a small (4–5 %) increase in cerebral oxygena‐tion is observed using NIRS (39‐41). The primary problems with CW‐NIRS are limitations based on the previous mentioned as‐sumptions and artifacts, which deems it very difficult to measure CBF reliably. Alternative approaches have been used to obtain CBF markers with CW‐NIRS. The use of the optical dye indocyanine green (ICG) as an intravascular tracer to measure relative changes in CBF with CW‐NIRS has been suggested as an easy, safe and reliable method for serial bedside measurements of relative CBF changes (42, 43). The method is based on monitoring the first passage of an in‐jected ICG bolus through the cerebral vasculature by NIRS, and is assumed to be a specific indicator of cerebral, not extracerebral, circulation (44). The accuracy of the method was confirmed in a piglet model, in which the NIRS blood flow index (BFI), a relative measure of CBF, significantly correlated with the gold standard microspheres technique (44). Human studies have shown that repeated measurements of BFI have an acceptable coefficient of variation during baseline recordings (43, 45, 46). However, no studies so far have correlated the BFI method to established methods of measuring CBF in humans, such as SPECT or PET. Furthermore, the vast majority of NIRS studies using an ICG bolus to estimate CBF were performed using CW systems and single source‐detector (SD) distance separation configurations (43, 45, 47, 48). This method is known to be impaired by strong contami‐nation of the cerebral signal from superficial tissue layers (49). As an alternative, Steinbrink et al (50) used a FD‐NIRS system and Kohl‐Bareis et al. (51) a TD‐NIRS system to track the passage of an ICG bolus in healthy subjects and patients undergoing cardiopul‐monary bypass respectively. By measuring modulation and time‐of‐flight of photons, they were able to get depth‐resolved meas‐urements of the bolus time course and therefore to distinguish between extra‐ and intracerebral signals. Both studies showed that a conventional single‐distance CW analysis will fail to detect changes in CBF due to skin blood flow contamination. To develop a new approach to detect changes in CBF using ICG as a tracer in combination with CW‐NIRS Schytz et al. (52) investi‐gated a multi‐source detector separation configuration in order to assess a corrected BFI (BFIcorr) value, which attempts to elimi‐nate contamination of skin blood flow. The BFIcorr method was compared simultaneously to the established method 133Xenon SPECT (133Xe‐SPECT). Ten healthy subjects were investigated before and after a bolus of acetazolamide.
Figure 2 Increase in percent from baseline for CBF of the middle cerebral
artery (CBFMCA) (■) measured by single photon computer tomography (SPECT), blood flow index (BFI) (○), BFIcorr (□), indocyanine green (ICG) ICGmax (▲) and rise time (grey box) measured with continuous wave near infrared spectroscopy (CW‐NIRS) after infusion of acetazolamide. A significant increase in CBFMCA was found 15 min (48.9 ±6.6, *** P < 0.001) and 60 min (26.0 ±6.8, ** P = 0.003) after the acetazolamide bolus.
The results showed no significant correlation between CBF changes measured by 133Xe‐SPECT and BFIcorr (0.133, P = 0.732) (figure 2). After acetazolamide, a 49% increase in CBF was de‐tected using the 133Xe‐SPECT method, whereas no changes in any ICG variables were observed after acetazolamide. Thus, the study clearly showed, by comparing the ICG‐NIRS method to the gold standard of measuring CBF, that it was not possible to obtain reliable BFI data with the ICG CW‐NIRS method, even when using multi‐source detectors to eliminate superficial contribution (52) . The NIRS results were not caused by technical problems as the quality of NIRS and dye‐densitometer measurements recorded after every injection of ICG was high. Moreover, at longer SD separations, the BFI increased, and the absorption peak became narrower and arrived earlier (figure 3). Such a pattern is charac‐teristic of the bolus time course in the brain, and is consistent with larger separations being more sensitive to brain, while the time course at short distance is more characteristic of ICG perfu‐sion in the skin. One possible explanation for the failure of the ICG method could be a change in the relative contribution from skin and brain from one injection to the other, for instance through a change in the skin blood volume. It would be interest‐ing to inject ICG into the internal carotid artery instead, but this would make the ICG method more invasive and difficult to apply in a clinical setting. Given that acetazolamide would also be ex‐pected to increase skin blood flow (53), it is very surprising that there were no changes in BFI at all. This also raises serious con‐cerns about that ICG CW‐NIRS method.
Figure 3 Optical density curve after an indocyanine green (ICG) bolus. Colored lines show source detector pairs at different distances. Y axis: ΔOD = delta optical density. The design by Schytz et al. (52) was different from previous stud‐ies using ICG dilution techniques, which measured baseline values without comparison with a conventional measurement technique and without inducing changes in blood flow (43, 45, 54). A recent NIRS study by Terborg et al. (55) in ischemic stroke patients showed a diminished BFI and increased time to peak (TTP) at the affected hemisphere. The authors also showed that TTP meas‐ured with NIRS correlated with TTP values assessed by perfusion weighted MRI (55). Oldag et al. (56) investigated cortical maps of TTP in patients unilaterally affected by servere stenosis or occlu‐sion of the middle cerebral artery (MCA) acquired by multichan‐nel NIRS after an ICG bolus. The authors demonstrated that TTP

DANISH MEDICAL JOURNAL 4
was increased on the affected hemisphere in the distribution of the affected MCA in 9/10 patients (56). Again, a correlation be‐tween TTP NIRS values and MRI was found to be statistically significant (56). Thus, side to side comparisons using NIRS‐ICG technique seems feasible and is also supported by Schytz et al. (52) who found no difference in ICG values between hemispheres within the healthy subjects, which suggests that the ICG values are not completely random and reflect brain perfusion. The Schytz et al. study was supported by Rothoerl et al. (57), who showed lack of correlation between ICG area under the curve and rise time compared with 133Xe‐SPECT values found during base‐line. Tachtsidis et al. (47) also failed to show any changes in ICG values after acetazolamide infusion using a single SD pair of 5 cm. In conclusion, ICG‐CW‐NIRS is not at present suitable as a method of detecting changes in CBF over time in a clinical setting, but may be used to detect hemisphere differences in stroke and carotid disease. NIRS and low frequency oscillations Over the last 10 years, an increasing number of studies have assessed spontaneous oscillations in velocity of the MCA (VMCA) using transcranial Doppler (TCD) (58). Spontaneous VMCA changes may be oscillations at respiratory and cardiac frequen‐cies. However, numerous studies (59‐67) have focused on changes in low frequency oscillations (LFOs), known as Mayer waves (68) centered around 0.1 Hz. Interventional studies have shown that neurogenic (69), metabolic (70) and myogenic (71) stimuli all affect LFOs. The etiology behind and physiological significance of spontaneous oscillations in cerebral vessels are not yet fully elucidated, but experimental studies indicate that spon‐taneous oscillations in cerebral blood flow reflect impaired cere‐bral autoregulation (58). Measuring changes in VMCA is an indirect method of investigat‐ing oscillations, because fluctuations in CBF are caused by changes in small resistance vessels downstream from the MCA. As an alternative, some studies have demonstrated detection of LFOs in humans by NIRS (66, 72‐75). NIRS LFOs analysis have been investigated in different pathologies and shown that HbO LFOs amplitude are decreased in cerebral microangiopathy (74), upon hypercapnia (72) and declines with age (73, 76). During paced breathing in carotid disease the phase relation between the arterial blood pressure (ABP) and HbO is right shifted, which is identical to the ABP‐VMCA phase relation (66). But whether ABP‐VMCA and ABP‐HbO are correlated during spontaneous breathing has not been investigated during. The questions arises whether NIRS measurements of LFOs in the human brain is a reliable method to investigate cerebrovascular alterations? To answer this, the first step is to assess the variabil‐ity between hemispheres and over time of NIRS LFOs. If the NIRS LFOs method is reliable, it may then become an important inves‐tigative tool in neurovascular diseases affecting one hemisphere, such as stroke and carotid artery disease, and by measuring changes in LFOs over time following disease development, aging or therapy. To investigate this, Phillip et al. (77) investigated hemispheric and day‐to‐day variations in 0.1 Hz LFOs using NIRS simultaneously with TCD during spontaneous and paced breath‐ing (6 breaths per minute) on two separate days in 44 healthy subjects. The study aimed to determine the variations between hemispheres for phase shift and gain of both HbO and VMCA to the ABP (table 1).
Phase Hemispheres ABP
Day to day ABP
Hemispheres direct
Day to day direct
HbO 3 (39) ‐5 (61) ‐4 (25) ‐1 (32)
VMCA ‐2 (57) ‐ 10 (45) 5 (60) 3 (46)
Paced HbO ‐9 (70) 2 (82) ‐1 (55) ‐7 (57)
Paced VMCA 0 (19) 1 (57) 4 (42) 2 (16)
Gain Hemispheres ABP
Day to day ABP
Hemispheres direct
Day to day direct
HbO ‐6 (69) 2 (297) 0.927 (44) ‐2 (60)
VMCA ‐8 (158) ‐8 (166) 0.828 (138) 11 (141)
Paced HbO ‐7 (120) ‐3 (388) 1.071 (105) 9 (97)
Paced VMCA ‐6 (83) ‐ 15 (235) 0.890 (115) 7 (77)
Table 1 Mean values and prediction intervals (±PI) between hemispheres and days in healthy subjects for spontaneous 0.1 Hz phase shift and gain between arterial blood pressure (ABP) and oxyhemoglobin (HbO) (meas‐ured by near infrared spectroscopy) as well as ABP and velocity of the middle cerebral artery (VMCA) (measured by transcranial Doppler). Mean values (±PI) are also shown for direct hemisphere HbO and VMCA phase shift and gain. The table also shows mean values (±PI) during paced breathing at 0.1 Hz for the same parameters. Mean values represent values measured on day 1 for between hemispheres and left side for ABP‐HbO/VMCA between days. Mean gain values (±PI) are in percent. The study also determined for both HbO and VMCA the direct left–right phase shifts (i.e. time difference between the two hemispheres LFOs) and gain (i.e. amplitude difference between the two hemispheres LFOs). The NIRS measurements were per‐formed using CW‐NIRS, and the optodes were placed bilateral on the forehead with one light source at two wavelengths (690 and 830 nm) and two detectors on each side, avoiding the midline sinus. The distance between source and detectors was 3 cm, with the detectors lateral to the source. Thus, the detectors measured the frontal cortex region in the territory supplied by the MCA. The study showed that spontaneous LFOs HbO phase shift and gain parameters varied less than LFOs VMCA, based on the pre‐diction intervals, except between days for ABP‐HbO/VMCA (table 1). The opposite pattern was seen for parameters at paced breathing, except that ABP‐VMCA still showed less variation between days and the direct hemisphere variation was still dis‐cretely lower for HbO than VMCA. The study also demonstrated no linear relation between phase shift and gain of ABP‐oxyHb and ABP‐VMCA at rest, which was in contrast to paced breathing showing a significant linear relation for both phase and gain. The study did not show changes for any parameters in relation to age and gender. At present there are no other studies comparing spontaneous LFOs variation between hemispheres and over days in healthy subjects using NIRS. Reinhard et al. (78) did show a significant correlation coefficient between days for VMCA LFOs phase and gain in patients with unilateral stenosis, which is difficult to di‐rectly compare to the Phillip et al. study in healthy subjects. Thus, the Phillip et al. study was important, as it showed that LFOs ABP‐HbO vary less than LFOs ABP‐VMCA when assessing between hemispheres, as well as HbO interhemispheric parameters di‐rectly and over time. The lack of linear relation between sponta‐neous ABP‐VMCA and ABP‐HbO may be due to local cortical autoregulatory mechanisms, which may be altered during dis‐ease. Paced breathing induces a linear correlation, which has also found by others (66). The linear relation is likely to be driven by CO2 modulation (79) and changes in the intrathoracic pressure (66, 72). Furthermore, VMCA showed less variation during paced breathing, which also reflects that VMCA is more influenced than HbO by paced breathing. HbO LFOs amplitude has been shown to decline with age (76), and if ABP LFOs also decreases with age, the Philip et al. study would not be able to demonstrate a de‐crease of ABP‐HbO gain with age, as the relation between ABP

DANISH MEDICAL JOURNAL 5
and HbO amplitudes would remain constant. In support, Vermeij et al. (76), in a study published after the Philips et al. study, showed that both spontaneous HbO (measured with NIRS) and ABP LFOs amplitude are decreased in a group of older adults in comparison to younger adults. Furthermore, ABP‐HbO LFOs phase and gain were not influenced by age. A caveat of the Phillips et al. study was that the superficial contribution to the LFOs was not assessed, which could have been obtained using a source detec‐tor distance of 1 cm as a control. Overall, the Phillips et al. study was the first to investigate varia‐tions in NIRS LFOs oscillations in healthy subjects, and the results suggest that analysis of NIRS LFOs is a feasible tool upon assessing spontaneous LFOs in between groups and over time in neurologi‐cal diseases. Further NIRS studies of spontaneous LFOs should therefore be applied in neurovascular diseases, and could also become a possible prognostic and treatment marker in cere‐brovascular disease. NIRS IN MIGRAINE WITHOUT AURA Migraine – a neurovascular disorder? The underlying goal of much of the human research in primary headaches is to find a specific marker of the specific headache type and subtype. Migraine is suggested to be a neurovascular coupling disorder, but this is based on an assumption, derived from familial hemiplegic (FHM) mutations and animal models (4), and has not been fully proven in humans. So far NIRS has only been applied in the common migraine subtypes to investigate altered cortical vasomotor reactivity following different types of metabolic (10, 11, 80), physiological (12, 14), pharmacological (81) and functional tests (13). The breathhold test is a way to test vasoreactivity during changes in arterial CO2 concentration (82). Using this, Akin et al. (10) showed that following breathhold tests in 6 migraine without aura (MO) patients interictally HbR, but not HbO, amplitude increases were smaller than in healthy controls. Liboni et al. (11) showed smaller HbO increases and lower HbR decreases in 30 MO patients than in healthy controls, but this result may have been biased by a shorter breath holding duration in MO patients com‐pared to the healthy subjects. Another way of assessing vasomo‐tor reactivity is via head down maneuver inducing elevated ve‐nous pressure and an increase in frontal lobe pressure, which usually leads to elevated CBF. This maneuver produced a signifi‐cantly smaller increase in right‐sided total hemoglobin (HbT, which is the product of HbO+HbR) in migraineurs when compared to volunteers (12). In migraineurs, the maneuver produced a significantly smaller increase in right‐sided HbT than in left‐sided HbT, but also produced a significantly greater increase in right‐sided THb than in left‐sided HbT in healthy volunteers (12). The patients were not coded as having MO and/or migraine with aura (MA) and the migraine attacks of some patients were mainly unilateral confined to the right or left, but the frequent side of the migraine attacks did not have any effect on the change in HbT. The lateralized vasoreactivity is difficult to understand, but could, speculatively, be attributed to a possible sympathetic lateralization in the right hemisphere and, conversely parasympa‐thetic predominance in the left hemisphere (83, 84), even though it is not known if this may lead to asymmetric vasomotor re‐sponses. Another group (80) investigated within differences in MA patients in the interictal period patients showing an increased cerebral vasoreactivity to CO2 inhalation measured by NIRS in the most frequent attack side. A recent study investigated 10 patients with MA, 10 with MO during the interictal period of migraine in comparison to healthy controls (85). The time‐delay between the
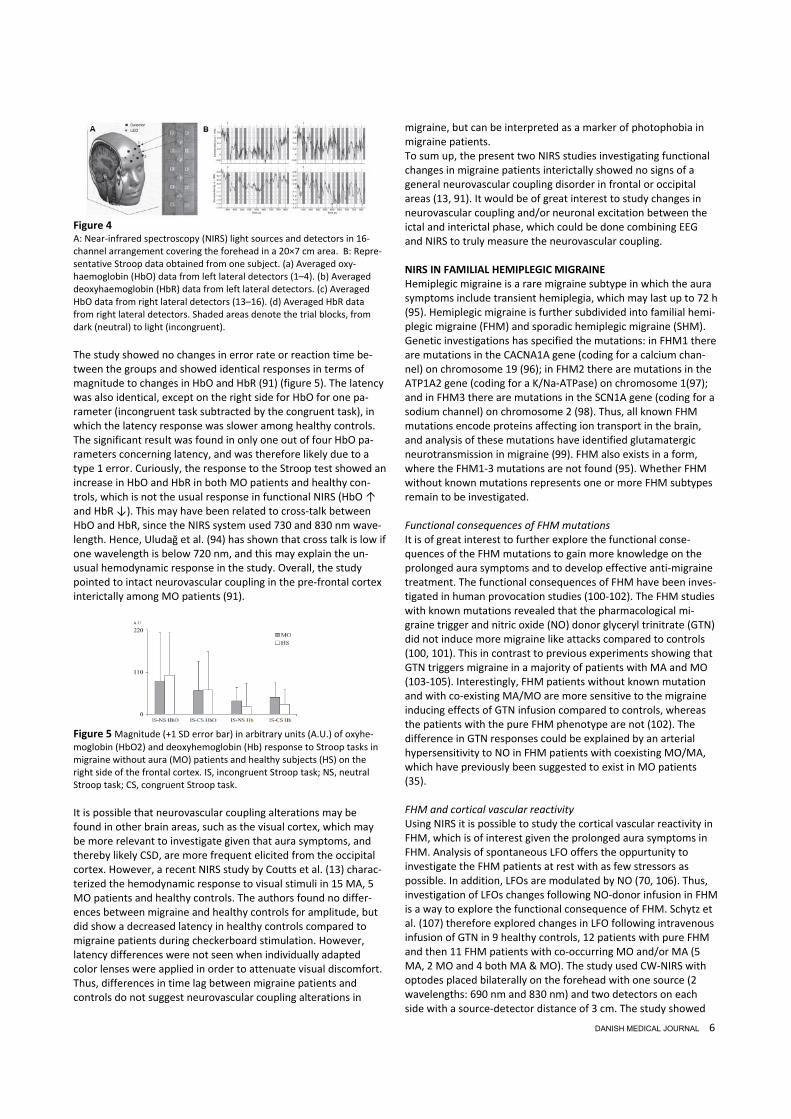
R‐wave of an electrocardiogram and the arterial pulse wave of cerebral microcirculation, detected by NIRS on the frontal cortex of both side, was determined to evaluate the presence of cerebral arteriolar vasoconstriction. Both migraine groups had a signifi‐cantly longer time delay than the control subjects, but there were no differences between sides. The same group measured the amplitude of the arterial pulse wave in patients with prolonged aura (1 h to 7 days) and found during aura a significant decrease of the arterial pulse wave and an increase of cerebral tissue oxy‐gen saturation ipsilateral to the pain side and contralateral to aura symptoms compared with the headache‐free periods (14). Overall, the studies on vasomotor reactivity are few and the results do not all translate into one concept of altered vasomotor reactivity following metabolic and physiological changes in mi‐graine patients. This is likely due to differences in design, NIRS system used and migraine subtype. NIRS has also been used to detect pharmacological changes fol‐lowing sumatriptan, a 5HT1B‐D agonist and effective in migraine treatment. Watanabe et al. (81) investigated 4 MO patients dur‐ing attacks following subcutaneous sumatriptan injection in com‐parison to 4 subjects receiving sham injections. The authors showed following sumatriptan injection a simulatenous decrease in HbO measured by NIRS, which was correlated to changes in skin blood flow measured by laser Doppler flowmetry. In vivo human studies have not shown that sumatriptan constricts ex‐tracerebral arteries more than cerebral arteries (86‐88), and the decrease found by Watanabe may therefore very likely be a sys‐temic extracerebral effect. Thus, NIRS monitoring using scalp probes are probably not entirely brain specific, and the clinical value of this type of investigation, when systemic changes are expected, is questionable. Studies attempting to separate superfi‐cial and cerebral signals would be useful to further explore these types of pharmacological effects. Neurovascular investigation ‐ Stroop test Migraine has been suggested to be a neurovascular coupling disorder (4, 89), and NIRS has an excellent temporal resolution that can detect specific cortical vascular changes during brain activation (34) and correlates with evoked potentials (90). There‐fore, NIRS may be an ideal tool to investigate neurovascular cou‐pling among migraine patients. To investigate if neurovascular coupling may be altered in migraine without aura in the interictal state, Schytz et al. (91) investigated 12 MO patients aura in com‐parison to 13 healthy controls during activation of the prefrontal cortex interictally. The activation consisted of neutral, congruent and incongruent Stroop tests, which is known to be an efficient and consistent activator of the prefrontal cortex (92, 93). CW‐NIRS was used with light sources and detectors giving a total of 16 channels in an area of 20 × 7 cm of the forehead, and the center bottom light was placed on the Fz position of the international 10–20 EEG system.
DANISH MEDICAL JOURNAL 6
Figure 4 A: Near‐infrared spectroscopy (NIRS) light sources and detectors in 16‐channel arrangement covering the forehead in a 20×7 cm area. B: Repre‐sentative Stroop data obtained from one subject. (a) Averaged oxy‐haemoglobin (HbO) data from left lateral detectors (1–4). (b) Averaged deoxyhaemoglobin (HbR) data from left lateral detectors. (c) Averaged HbO data from right lateral detectors (13–16). (d) Averaged HbR data from right lateral detectors. Shaded areas denote the trial blocks, from dark (neutral) to light (incongruent).
The study showed no changes in error rate or reaction time be‐tween the groups and showed identical responses in terms of magnitude to changes in HbO and HbR (91) (figure 5). The latency was also identical, except on the right side for HbO for one pa‐rameter (incongruent task subtracted by the congruent task), in which the latency response was slower among healthy controls. The significant result was found in only one out of four HbO pa‐rameters concerning latency, and was therefore likely due to a type 1 error. Curiously, the response to the Stroop test showed an increase in HbO and HbR in both MO patients and healthy con‐trols, which is not the usual response in functional NIRS (HbO ↑ and HbR ↓). This may have been related to cross‐talk between HbO and HbR, since the NIRS system used 730 and 830 nm wave‐length. Hence, Uludağ et al. (94) has shown that cross talk is low if one wavelength is below 720 nm, and this may explain the un‐usual hemodynamic response in the study. Overall, the study pointed to intact neurovascular coupling in the pre‐frontal cortex interictally among MO patients (91).
Figure 5 Magnitude (+1 SD error bar) in arbitrary units (A.U.) of oxyhe‐
moglobin (HbO2) and deoxyhemoglobin (Hb) response to Stroop tasks in migraine without aura (MO) patients and healthy subjects (HS) on the right side of the frontal cortex. IS, incongruent Stroop task; NS, neutral Stroop task; CS, congruent Stroop task.
It is possible that neurovascular coupling alterations may be found in other brain areas, such as the visual cortex, which may be more relevant to investigate given that aura symptoms, and thereby likely CSD, are more frequent elicited from the occipital cortex. However, a recent NIRS study by Coutts et al. (13) charac‐terized the hemodynamic response to visual stimuli in 15 MA, 5 MO patients and healthy controls. The authors found no differ‐ences between migraine and healthy controls for amplitude, but did show a decreased latency in healthy controls compared to migraine patients during checkerboard stimulation. However, latency differences were not seen when individually adapted color lenses were applied in order to attenuate visual discomfort. Thus, differences in time lag between migraine patients and controls do not suggest neurovascular coupling alterations in
migraine, but can be interpreted as a marker of photophobia in migraine patients. To sum up, the present two NIRS studies investigating functional changes in migraine patients interictally showed no signs of a general neurovascular coupling disorder in frontal or occipital areas (13, 91). It would be of great interest to study changes in neurovascular coupling and/or neuronal excitation between the ictal and interictal phase, which could be done combining EEG and NIRS to truly measure the neurovascular coupling. NIRS IN FAMILIAL HEMIPLEGIC MIGRAINE Hemiplegic migraine is a rare migraine subtype in which the aura symptoms include transient hemiplegia, which may last up to 72 h (95). Hemiplegic migraine is further subdivided into familial hemi‐plegic migraine (FHM) and sporadic hemiplegic migraine (SHM). Genetic investigations has specified the mutations: in FHM1 there are mutations in the CACNA1A gene (coding for a calcium chan‐nel) on chromosome 19 (96); in FHM2 there are mutations in the ATP1A2 gene (coding for a K/Na‐ATPase) on chromosome 1(97); and in FHM3 there are mutations in the SCN1A gene (coding for a sodium channel) on chromosome 2 (98). Thus, all known FHM mutations encode proteins affecting ion transport in the brain, and analysis of these mutations have identified glutamatergic neurotransmission in migraine (99). FHM also exists in a form, where the FHM1‐3 mutations are not found (95). Whether FHM without known mutations represents one or more FHM subtypes remain to be investigated. Functional consequences of FHM mutations It is of great interest to further explore the functional conse‐quences of the FHM mutations to gain more knowledge on the prolonged aura symptoms and to develop effective anti‐migraine treatment. The functional consequences of FHM have been inves‐tigated in human provocation studies (100‐102). The FHM studies with known mutations revealed that the pharmacological mi‐graine trigger and nitric oxide (NO) donor glyceryl trinitrate (GTN) did not induce more migraine like attacks compared to controls (100, 101). This in contrast to previous experiments showing that GTN triggers migraine in a majority of patients with MA and MO (103‐105). Interestingly, FHM patients without known mutation and with co‐existing MA/MO are more sensitive to the migraine inducing effects of GTN infusion compared to controls, whereas the patients with the pure FHM phenotype are not (102). The difference in GTN responses could be explained by an arterial hypersensitivity to NO in FHM patients with coexisting MO/MA, which have previously been suggested to exist in MO patients (35). FHM and cortical vascular reactivity Using NIRS it is possible to study the cortical vascular reactivity in FHM, which is of interest given the prolonged aura symptoms in FHM. Analysis of spontaneous LFO offers the oppurtunity to investigate the FHM patients at rest with as few stressors as possible. In addition, LFOs are modulated by NO (70, 106). Thus, investigation of LFOs changes following NO‐donor infusion in FHM is a way to explore the functional consequence of FHM. Schytz et al. (107) therefore explored changes in LFO following intravenous infusion of GTN in 9 healthy controls, 12 patients with pure FHM and then 11 FHM patients with co‐occurring MO and/or MA (5 MA, 2 MO and 4 both MA & MO). The study used CW‐NIRS with optodes placed bilaterally on the forehead with one source (2 wavelengths: 690 nm and 830 nm) and two detectors on each side with a source‐detector distance of 3 cm. The study showed

DANISH MEDICAL JOURNAL 7
that GTN increased the LFOs amplitude in FHM patients, but not healthy controls. Furthermore, only in FHM patients with coexist‐ing common migraine types did GTN infusion induced changes in LFO amplitudes (P < .001), where post‐hoc analysis revealed an increase in LFO amplitude 15 minutes (P = .003) and 40 (P = .013) minutes after start of infusion compared with baseline (figure 6). There were no correlation between LFOs amplitude changes and blood pressure or heart rate changes. The findings by Schytz et al. support the concept that the sensitiv‐ity to NO resides within the common migraine phenotypes rather than the FHM phenotype. The study was the first to show a corti‐cal vascular marker in line with the headache results (107). Thus, cortical LFOs may be a marker of NO hypersensitivity in MO/MA, but not FHM. This also suggests, that NO‐inhibition is probably not effective as treatment in FHM. The study would have benefit‐ted from having a control group with MO/MA patients without FHM, in order to show GTN induced LFOs changes as a marker of these common migraine subtypes. Another concern is that FHM without mutations is a heterogeneous group with potentially different mutations, which might have different functional conse‐quences. Even though there were no correlation between sys‐temic blood pressure and heart rate, it is possible that the changes found in the study reflect changes in systemic LFOs, and the study would have benefited from having a control source detector to control for changes in superficial skin LFOs. As the study was the only of its kind in humans there is no literature to confirm or challenge the findings. This was the first time a NO donor was given systemically to detect LFOs amplitude changes of cortical vessels in human. The results were in contrast to experi‐mental animal models, where NO synthase inhibitors increase cerebral LFOs amplitude (70, 106). This difference may be due to NO synthase inhibitors constricting animal cephalic vessels, de‐creasing cerebral blood flow by 18% (108) and raising systemic blood pressure by 26% (70). The increase in LFOs amplitude among FHM patients with co‐morbidity may also be explained by a reflex increase in sympathetic tone (109), though there were no significant correlation between changes in systemic hemodynam‐ics and the LFOs amplitude changes (107).
Figure 6 Boxplots during baseline, 15 min from infusion start and 40 min after infusion start for familial hemiplegic migraine (FHM) with co‐occurring migraine with aura (MA) and migraine without aura (MO), abbreviated FHM+MA/MO (grey boxes), pure FHM (striped boxes) and healthy controls (dotted boxes). Band near the middle is the median value. The bottom and top of the boxes is the 25th and 75th percentile. The ends of the whiskers represent the maximum and minimum of the data. Y‐axis units are in micromoles (µm). Outliers are shown except one
extreme outlier in FHM+MA/MO patients (15 min: 233 micromoles) and two extreme outliers in healthy subjects (15 min: 216 micromoles; 40 min: 130 micromoles). For FHM+MA/MO patients there were an increase in LFO amplitude 15 minutes (P = 0.003) and 40 (P = 0.013) minutes after start of infusion compared with baseline. In conclusion, the study revealed interesting vascular differences within migraine subtypes, which were very much in line with headache results from the same population. As the design was novel, and the investigated population rare, it would be of great interest to investigate the model in other migraine subtypes to possibly confirm the results. Thus, further studies are very much warranted to investigate the effects of NO on LFOs measured with NIRS. NIRS IN CLUSTER HEADACHE Cluster headache (CH) is one of the most painful primary head‐aches characterized by attacks of severe or very severe unilateral orbital, supraorbital and/or temporal pain associated with ipsilat‐eral cranial autonomic symptoms (95). The autonomic symptoms during attacks are due to outflow from the superior salivatory nucleus (SSN) via the sphenopalatine ganglion (SPG). It has also been shown that attacks involve activation in the posterior hypo‐thalamus (110). A pronociceptive role of the parasympathetic nervous system in cluster headache The parasympathetic features define the cluster attacks and are easy to detect clinically, but the interesting question is whether parasympathetic outflow has a role in the development of pain during a cluster attack. There are experimental evidence for the SPG to induce pain; 1) activity in meningeal nociceptros are modulated by efferent parasympathetic SPG fibers (111), 2) ace‐tylcholine, a parasympathetic neurotransmitter, can activate C‐fibers (112), 3) NO, which is found in parasympathetic perivascu‐lar nervefibers (113), can induce cluster attacks and sensitize dural nociceptors (114), 4) SPG activation lead to dural plasma extravasation (115). In addition, a recent animal cluster headache model showed that stimulation of the SSN using frequencies between 10‐50 Hz leads to firing of second order neurons in the trigeminal nucleus caudalis (TNC) in rats, which can be explained by an increased parasympathetic outflow via the SPG (116). Col‐lectively, experimental data suggest that cranial parasympathetic outflow may in fact initiate and/or sustain head pain during CH attacks. Experimental studies of sphenopalatine ganglion stimulation Recently, Schoenen et al. (117) conducted a multicenter‐trial to investigate the therapeutic response in chronic CH patients to high frequency (HF) SPG stimulation. The study reported that pain relief was achieved in 67 % of full stimulation‐treated attacks compared to 7 % of sham‐treated (117). HF SPG stimulation may primarily activate parasympathetic neurons or pre/post gangli‐onic parasympathetic nerve fibers well above the intrinsic firing rates, which may physiologically block parasympathetic outflow, and result in an acute effect on head pain and autonomic symp‐toms. The HF therapeutic SPG stimulation used in the multicenter study was applied for at least 15 minutes during an attack. In contrast, low frequency (LF) SPG stimulation may correspond to a more intrinsic pattern, which would possibly lead to increased parasympathetic outflow and subsequent head pain. The ration‐ale for LF stimulation is based on animal studies demonstrating ipsilateral dilatation after SPG activation using electrical stimula‐

DANISH MEDICAL JOURNAL 8
tion (range 5 – 60 Hz) of the middle cerebral artery (MCA) (118), small pial arteries (119), internal carotid artery (ICA) (118), ante‐rior carotid artery (ACA) (118) and increased ipsilateral cortical blood flow (120). Schytz et al. (121) therefore conducted a dou‐ble‐blind randomized cross‐over study to record headache char‐acteristics and autonomic symptoms during and after HF or LF SPG stimulation using the same neurostimulation system as Schoenen et al. (117). To record changes in scalp and cortical vessels NIRS optodes were placed bilaterally on the forehead with one source (two wavelengths: 690 nm and 830nm) and two de‐tectors on each side, carefully avoiding the midline sinus. The two detectors were placed with a distance of 1 and 3 cm lateral from the source. Thus, the 1 cm detector was measuring frontal scalp territory primarily supplied by the superficial temporal artery, while the 3 cm detector was measuring mixed contribution from the scalp territory and the frontal cortex territory supplied by the anterior cerebral artery (ACA) and middle cerebral artery (MCA). To minimize contribution of the scalp physiology, the data from each 1 cm channel were regressed out from the corresponding measurement at 3 cm. The study demonstrated that three out of six patients (50 %) reported ipsilateral cluster‐like attacks during or within 30 min of LF SPG stimulation, whereas one out of six reported a cluster‐like attack with 3 min HF SPG stimulation. The superficial NIRS recordings showed an increase (3.0 ± 1.1 µM) (mean ± SEM) for HbO following stimulation, which was most pronounced on the ipsilateral side following HF experimental stimulation. The NIRS recordings primarily assessing cortical vascular changes showed a moderate increase, which was most pronounced (1.7 ± 0.6 µM) for HbO on the ipsilateral side follow‐ing HF experimental stimulation. For all compartments HbR tended to stay constant or decrease following both HF and LF stimulation (figure 7).
Figure 7 Continuous wave near infrared spectroscopy changes with normalized relative oxygenated hemoglobin (HbO) and deoxygenated hemoglobin (HbR) values during 3 min high frequency (HF) therapy stimu‐lation (range 80–120 Hz) and low frequency (LF) stimulation at 5 Hz. 3 cm optodes measuring cortical changes in which the signal from 1 cm opto‐des have been regressed out. Y‐axis is micromolar (µM) concentration. Error bars show SEM. There was a moderate increase, which was most pronounced (1.7 (±0.6)) on the ipsilateral side following HF stimulation. The study also showed a decrease in VMCA following both HF and LF stimulation, which was most pronounced on the ipsilateral side and following LF stimulation. The NIRS recordings showed changes, which would be expected to be seen during an increase in CBF (HbO↑ and HbR↓) and are therefore in line with the experimental animal data. The study has some limitations as the population, although unique, was very small. The vascular data are therefore descriptive and needs to be reproduced in larger
studies, where repeated measurements are applied. Future stud‐ies should attempt to focus on demonstrating frequency‐response curves for the hemodynamic parameters. The individual changes in HbO and HbR did not have a distinct pattern, which could explain why some patient experienced pain. It was surpris‐ing that HF and LF stimulation caused similar vascular changes. This may reflect that 3 min stimulation causes depletion of para‐sympathetic neurotransmitters irrespective of HF or LF stimula‐tion, whereas HF stimulation has to be ongoing for at least 10 minutes to lead into a physiological block. It is of great interest to investigate objective vascular markers following SPG stimulation, as a reliable marker can be used during surgery to confirm the correct placement and to find the best possible treatment setting. In summary, the study by Schytz et al. (121) demonstrated for the first time the feasibility of NIRS recordings following SPG neu‐rostimulation in humans and showed hemodynamic changes, which were similar to experimental animal studies. NIRS IN OBSTRUCTIVE SLEEP APNEA Obstructive sleep apnea (OSA) is characterized by repetitive episodes of partial or complete upper airway obstruction during sleep associated with intermittent oxygen desaturation, snoring and sleep fragmentation (122). The prevalence of OSA has been reported up to 33 % (123) in the general population and is strongly associated with transitory ischemic attacks (TIA) (15) and cerebral infarction (15‐17) independent of other risk factors. During apnea periods, NIRS has been used to measure changes in relative hemoglobin parameters and cerebral oxygenation. HbO decreases during obstructive apnea periods and is correlated to peripheral oxygen concentrations (18‐20), whereas both HbT and HbR increase (18, 21). Outside of the apnea brain tissue oxygena‐tion is decreased during general sleep compared to the awake state, and oxygen levels are lower in patients with severe OSA compared to those with mild and moderate OSA (124). Overall, the NIRS studies in the OSA field are congruent and point to a deficient autoregulatory mechanisms during apneas, in which CBF fails to compensate for the lack of respiration, resulting in a de‐creased HbO and increased in HbR. This is also in line with the fact that brain activity decreases during OSA (125). These findings demonstrate the utility of NIRS and may point to the increased susceptibility to ischemic stroke during sleep. In fact, one study demonstrated that patients with wake‐up stroke had larger apnea hypopnea index (AHI) than non wake‐up stroke patients (126). However, the above OSA NIRS studies are limited to apnea peri‐ods, and do not explore changes such as arterial stiffness and sympathetic tone in the awake phase. Obstructive sleep apnea and the autonomic nervous system OSA is associated with increased sympathetic activity, which has been shown in animal and human models (127). In rats hypoxia for 7 h per day for 30 days leads to increased blood pressure, which can be blocked by chemical denervation of the peripheral sympathetic nervous system (128). Mice exposed to hypoxia for 8 h per day leads to increased levels of urine catecholamine after 14 days (129). In OSA patients urine catecholamine levels are elevated throughout the day as compared to controls (130) and awake OSA patients show elevated muscle sympathetic nerve activity and plasma norepinephrine compared to controls (131). Effective nasal continuous positive airway therapy (CPAP) reduces the cardiovascular outcomes associated with OSA (17), but the mechanism behind this effect is unclear. It could be speculated that the effect may be due to a reduction in sympathetic nerve activity. Thus, randomized controlled studies have reported re‐

DANISH MEDICAL JOURNAL 9
duced 24 h catecholamine excretion in OSA patients after CPAP therapy for 4‐6 months (132, 133). A possible linkage between stroke risk and sympathetic activity is not yet clear, but may be related to increased systemic arterial stiffness correlated to in‐creased sympathetic tone. Arterial stiffness is obtained via aug‐mentation index, which measures how fast a pulse wave is re‐turned from the periphery, the faster the pulse wave, the stiffer is the artery. A randomized trial with 4 weeks of CPAP therapy showed reduced systemic arterial stiffness (133), which was also shown in two other trial with 4 (132) and 6 (134) months of CPAP treatment. The changes in arterial stiffens found in the above studies are found in systemic vessels, which raises the question if cerebral vessels might also be affected in OSA patients? Sympathetic alteration in cerebral vessels following CPAP therapy Experimental animal models have shown increased cortical LFOs amplitude following sympathetic alterations (135, 136). In hu‐mans, Tachtsidis et al. (75) measured increased HbO LFOs ampli‐tude with NIRS upon posture‐dependent activation of the auto‐nomic reflex. Furthermore, Pierro et al. (137) investigated LFOs amplitude in healthy subjects and showed that HbO and HbR LFOs amplitude decreased during non‐rapid eye movement (non‐REM) sleep as opposed to the awake and REM sleep states. This can be interpreted as a sign of decreased sympathetic activity during non‐REM sleep, which is accordance with heart rate variability spectral analysis showing higher parasympathetic drive during non‐REM sleep as opposed to REM sleep (138). Thus, NIRS may a tool to investigate changes in sympathetic activity using LFOs amplitude analysis. Based on this, Schytz et al. (139) investigated if OSA patients showed signs of increased sympathetic activity and decreased vasoreactivity in cerebral cortical vessels as meas‐ured with NIRS, and if this may be reversed by CPAP treatment. In total 23 OSA patients naive to CPAP were included in a prospec‐tive interventional study, where the OSA patients received CPAP therapy for at least two months. HbO LFOs amplitude at rest and HbO vasoreactivity during a breath hold test were measured with NIRS and compared between baseline, after CPAP treatment and to 13 healthy controls The NIRS optodes were placed bilaterally on the forehead with one source (two wavelengths: 690 nm and 830 nm) and two detectors on each side, avoiding the frontal sinus. The distance between sources and detectors were three cm with the detectors lateral to the source. The study showed a decrease in LFO amplitude after CPAP therapy (P = 0.022) in OSA patients, but no differences in LFO amplitudes between untreated OSA patients and healthy controls (P = 0.934) (139) (figure 8). In addition, there were no differences in peak vascular response following breath hold tests in OSA patients before or after CPAP therapy or compared to healthy controls (139).
Figure 8 Low frequency oscillation amplitudes of oxygenated hemoglobin
(oxyHb) and total hemoglobin (totalHb) for 14 obstructive sleep apnea (OSA) patients before and after continuous positive airway pressure (CPAP) treatment for at least two months. 23 OSA patients before CPAP treatment were also compared to 13 healthy controls, right sided figure. Error bars are standard error of the mean. µM = micromolar oxyHb or totalHb concentration. Black boxes are OSA patients before CPAP treat‐
ment, striped grey boxes are OSA patients after CPAP treatment, and grey boxes are healthy subjects. *Indicates a P value = 0.022. Interestingly, the study showed no differences between healthy subjects and untreated OSA patients (139). It is possible that sympathetic activity and arterial stiffness have opposite effect on LFOs amplitude (sympathetic activity increases, while stiffness decreases LFOs amplitude), which may hide the pathological effect in OSA patients in comparison to healthy subjects. The study showed no change in vasoreactivity following CPAP, as measured with the breathhold test, which suggests that cortical arterial stiffness was either not present or not modulated by CPAP. The study did not control for the superficial contribution to the changes in LFOs, and it is possible that the LFO alterations are actually systemic (139). In fact, the LFOs amplitude between different sleep and awake states by Pierro et al. (138) was meas‐ured with 4 source‐detector pair, in which the HbO amplitude did not vary between different source‐detector distances, a finding also noticed by Obrig et al. (72). However, as suggested by Obrig et al. (72), LFOs at 3 cm are modulated following specific cortical activation, and if the oscillations were to solely stem from the skin, their magnitude should be smaller when sampling with a larger probe separation, due to a partial volume effect. The study showed quite large variations between sessions and groups, which may blunt smaller alterations between groups and treat‐ment. Furthermore, it would have been desirable to have a non‐compliant OSA group to show that LFOs amplitude is unchanged over time, when CPAP therapy is not administered. In summary, Schytz et al. (139) showed for the first time in awake OSA patients a decrease in HbO LFOs amplitude following suc‐cessful CPAP treatment measured with NIRS. This may be a marker of decreased sympathetic activity in cortical vessels and is a potential source of increased stroke risk in OSA patients. Fur‐ther studies are needed to elucidate this novel finding further. NIRS ‐ NEW TECHNOLOGIES So far, NIRS cannot measure changes in CBF in a reliable way, which may be due to the limitations of CW‐NIRS. Schytz et al. (52), as previously described, failed to detect obvious changes in CBF using ICG after acetazolamide injection. Even TD‐ or FD‐NIRS techniques have not yet been able to reliably detect changes in CBF over time in a clinical setting. The need for non‐invasive CBF measurements are of obvious interest and new technological approaches must be pursued to reach this. Ultrasound tagged near infrared spectroscopy In 1998 Mahan et al. (140) presented a new non‐invasive hybrid technology employing ultrasound tagged NIRS (UT‐NIRS). This technique may estimate changes in CBF using a cerebral flow index (CFI) without the need of an injected tracer, but the tech‐nology has not yet been used clinically or in human experiments. Recently, a commercial available system was FDA and CE cleared (CerOx, Ornim Medical Ltd., Israel). This system consists of a single probe, which illuminates the tissue with coherent light at three wavelength between 780‐830nm and collects the scattered light back to the detector, placed at a distance of 12 mm from the source. The probe also incorporates a small ultrasound trans‐ducer that provides low‐power waves for inducing the UT‐NIRS signal. UT‐NIRS is a hybrid technology based on locally modulat‐ing coherent light (laser) with a localized low power ultrasound wave via the acousto‐optic effect (140, 141). The ultrasound signal is a sequence of phase modulated waves with a central frequency at 1 MHz. This frequency is similar to the frequency (2

DANISH MEDICAL JOURNAL 10
MHz) of transcranial Doppler ultrasound (TCD) used to monitor blood flow velocity through the skull, and is less attenuated by the bone than 2 MHz. The ultrasound signal induces a modulation in the detected light intensity, which is correlated with the pat‐tern of the transmitted ultrasound wave as a function of the time of propagation of the ultrasound wave. In biological tissue the changes in the cross correlation signal is assumed to be due to movement of scattering particles (namely blood cells), in which an increase in blood flow results in poorer correlation. By measur‐ing the degree of local correlation over the random fluctuations, UT‐NIRS flowmetry is assumed to measure blood flow in the microcirculation in deep tissue in volumes of about 1cm3. The blood flow signal is independent of the specific wavelength of light, and consequently is independent of the oxygen saturation signal. The UT‐NIRS probe collects light from all depths and the signal processing algorithm selects a certain segment of the signal (corresponding to a predefined distance from the skin) for calcu‐lating the regional CFI. Consequently, the UT‐NIRS signal does not require as large a source‐detector separation as conventional NIRS systems to reach gray matter vasculature, and a 12 mm separation provides brain tissue perfusion (primarily grey matter). The first experimental human study of cerebral blood flow using ultrasound tagged NIRS The CerOx is a new system based on a novel principle. It is highly needed to test the system in a clinical setting, and compare with known and established technologies to measure CBF. Therefore, Schytz et al. (142) tested if this new hybrid technique, combining NIRS and ultrasound, could detect CBF changes in healthy sub‐jects. The study investigated changes over time for UT‐NIRS CFI and 133XE‐SPECT CBF data assessed in 10 healthy volunteers after an intravenous bolus of acetazolamide. UT‐NIRS CFI was measured continuously, whereas SPECT CBF was measured at baseline, 15 and 60 min after acetazolamide. CFI showed a signifi‐cant increase of 33 % at 15 min and 43% at 60 min after aceta‐zolamide injection (142). The global CBF measured with SPECT (which closely followed local CBF changes in the MCA and ACA regions) showed a significant increase of 53% at 15 min and 36% at 60 min after acetazolamide injection (figure 9) (142). There was a significant correlation between CFI and SPECT CBF values (r = 0.67 & P < 0.033) at 15 min, but not at 60 min (P ≥ 0.777) (142). Thus, the study showed an increase in CFI, which correlated with CBF measured with 133Xe‐SPECT at 15 min, but not 60 min (142).
Figure 9 Relative percent changes in cerebral flow index (CFI) measured with ultrasound tagged NIRS and CBF measured with single photon com‐puter tomography (SPECT) 15 and 60 min after acetazolamide. Mean increase from baseline (%) for CFI (grey square), CBFglobal (black triangle), CBF of the anterior cerebral artery CBFACA (open circle) and CBF of the middle cerebral artery (CBFMCA) (black square). Values represent average for all subjects. *P < 0.011 after acetazolamide as compared to baseline.
The Schytz et al. study (142) was the first controlled study to explore the clinical feasibility of measuring a CFI using UT‐NIRS technique, which can be used as a marker of cortical CBF below the probes. There are no human or animal studies to compare the obtained results with. One caveat of the study is that it was nec‐essary to remove movement artifacts post‐hoc, which is not practical and feasible to do in a clinical setting. This issue may be overcome by developing probes less sensitive to movement. It was unexpected that CFI values increased between 15 and 60 min, and based on the present and previous study it would be expected that CBF decreased between 15 and 60 min post‐injection (52, 142). As the use of 133XE‐SPECT mandates a wash‐out period of the tracer, it is a shortcoming that there is a lack of a comparator, which can track CBF changes over time noninva‐sively. In future studies it would be of clear benefit to investigate CBF for more than 60 min based on the present findings. It may be a technical issue, such as drift of the signal or undetected motion artifact (as it becomes increasingly difficult for the sub‐jects to lie still for up to at least 60 min). Other explanations may also account for the discrepancy between SPECT and UT‐NIRS values at 60 min. Thus, normal CBF in the human brain is ap‐proximately 50 mL/100 g/min averaged over the brain volume, with blood flow to the grey matter higher (80 mL/100 g/min) than to the white matter (20 mL/100 g/min). SPECT slices encompass a larger region of interest, while the UT‐NIRS CFI signal is derived from a much smaller tissue volume of about 1cm3 encompassing mostly grey matter (cortex). Bruhn et al. (143) demonstrated, using MRI imaging, that post acetazolamide the changes in their signal in the white matter were different from those observed in the grey matter (cortex). So it is possible that the discrepancy is caused by the magnitude or time course of blood flow differ between grey and white matter following acetazolamide. Fur‐thermore, SPECT measures CBF in the overall vascular regions of interest from transactional slices, whereas UT‐NIRS measures microcirculatory blood flow within the interrogated volume of 1cm3. This quantity is affected by the diameter of the mixed vessels, the velocity of the scattering particles (blood cells) and their concentration. Therefore, changes in vessel diameter and flow velocity may be reflected differently by the two methods. Nevertheless, the obvious mismatch at 60 min between CFI and SPECT CBF values cannot be clearly explained (142), and further studies are highly needed to investigate this. CONCLUDING REMARKS AND FUTURE PERSPECTIVES New imaging methods are needed to further explore pathophysi‐ology and treatment effects in neurology. Near infrared spectros‐copy (NIRS) has a number of advantages that makes it an attrac‐tive investigate tool in clinical neurology. NIRS also has some inherent limitations, and it is therefore crucial that NIRS is used and interpreted correctly. This thesis shows that continuous wave NIRS (CW‐NIRS) cannot reliably be used as a marker of cerebral blood flow (CBF), even with the use of multi‐source detectors and indocyanine green (ICG) as an intravenous contrast agent. In‐stead, side to side comparisons using NIRS‐ICG technique is a possible approach in neurovascular diseases with unilateral affec‐tion such as stroke and carotid artery disease. The study on low frequency oscillations (LFOs) in cortical vessels suggests that analysis of NIRS LFOs is a feasible tool upon assessing LFOs in neurological diseases between hemispheres and over time. In addition, detection of a linear relationship between velocity of the middle cerebral artery (VMCA) and oxygenated hemoglobin (HbO) in the LFOs spectrum may be a marker of defect local auto‐regulatory function. The study on neurovascular coupling in

DANISH MEDICAL JOURNAL 11
migraine without aura (MO) patients reveals no apparent inter‐ictal neurovascular coupling disorder. Future studies are needed to further explore this, and whether there might be changes ictally. The NIRS study in familial hemiplegic migraine (FHM) reveals a different cortical vascular response to nitric oxide (NO) depending on the specific subtypes, which supports differences in headache sensitivity to NO within primary headache subtypes. Thus, the study indicates that LFOs alterations in cortical vessels following infusion of vasoactive substances are a marker of an underlying difference in pathophysiology between migraine sub‐types. For the first time a study is presented, which indicates that NIRS can measure cephalic vascular changes following stimulation of a parasympathetic ganglion. Future studies should attempt, with larger subject numbers, to examine other differences in headache and vascular function to explore the underlying patho‐physiological mechanisms. Obstructive sleep apnea (OSA) pa‐tients have increased sympathetic tone that decreases following continuous positive airway pressure (CPAP) treatment, and it is shown that this state might also be detected in cortical LFOs measured with NIRS. Future studies could investigate if the de‐gree of OSA severity is correlated to the LFOs amplitude, and if LFOs amplitude may be a stroke predictor. The study using the hybrid technique ultrasound tagged NIRS (UT‐NIRS) suggests that CBF estimation may be possible, but as the study is the first hu‐man clinical study using UT‐NIRS further methodological and clinical and explorative studies are necessarily needed. The thesis demonstrates various approaches to study neurovascular dis‐eases using NIRS. It is possible to perform these studies, as NIRS is an easy non‐invasive technique to apply and analyze in human experiments. The thesis also demonstrates technical and theo‐retical challenges upon using NIRS. NIRS could increasingly be‐come a more valuable tool in clinical neurology and research if future studies carefully deals with these limitations and chal‐lenges. If so, NIRS will possibly lead to a new and deeper under‐standing of the human brain and neurovascular diseases. Overall, the present thesis contributes to our understanding of disease states in clinical neurology and shows several novel approaches by which NIRS may be used in clinical neurology. SUMMARY The purpose of this thesis was to explore and develop methods, where continuous wave near infrared spectroscopy (CW‐NIRS) can be applied in different neurovascular diseases, in order to find biological markers that are useful in clinical neurology. To develop a new method to detect changes in cerebral blood flow (CBF), the first study investigated a multi‐source detector separa‐tion configuration and indocyanine green (ICG) as a tracer to calculate a corrected blood flow index (BFI) value. The study showed no correlation between CBF changes measured by 133Xenon single photon emission computer tomography (133Xe‐SPECT) and the corrected BFI value. It was concluded, that it was not possible to obtain reliable BFI data with the ICG CW‐NIRS method. NIRS measurements of low frequency oscillations (LFOs) may be a reliable method to investigate vascular alterations in neurovascular diseases, but this requires an acceptable LFOs variation between hemispheres and over time in the healthy brain. The second study therefore investigated day‐to‐day and hemispheric variations in LFOs with NIRS. It was shown that NIRS might be useful in assessing LFOs between hemispheres, as well as interhemispheric phase and gain directly and over time. Mi‐graine may be associated with persistent impairment of neurovascular coupling, but there is no experimental evidence to support this. The third study therefore investigated interictal
neurovascular coupling during a mental task by a Stroop test in migraine without aura (MO) patients, which is the most common type of migraine. The study showed intact neurovascular coupling in the prefrontal cortex outside of attacks in patients with MO. The fourth study aimed to investigate possible changes in LFOs amplitude following nitric oxide (NO) donor infusion in familial hemiplegic migraine (FHM), which is a rare Mendelian subtype of migraine with aura. This study showed increased LFOs amplitude only in FHM patients with co‐existing common type of migraine, but not in patients with pure FHM phenotype. This suggests that the sensitivity to NO resides within the common migraine pheno‐types rather than the FHM phenotype. Stimulation of the sphenopalatine ganglion (SPG) may lead to parasympathetic outflow and cause pain in cluster headache (CH). The fifth study therefore investigated pain and autonomic symptoms in relation to high or low SPG frequency stimulation in chronic CH patients. Cortical changes in oxygenated hemoglobin (HbO) were also recorded with NIRS and showed a moderate HbO increase, which was most pronounced on the ipsilateral CH side following high frequency stimulation. A possible application of NIRS to assess cerebral vascular changes due to sympathetic activity was investi‐gated in obstructive sleep apnea (OSA) patients, who have in‐creased sympathetic activity and risk of stroke. Following success‐ful continuous positive airway pressure (CPAP) therapy, OSA patients decreased their LFOs amplitude, which was interpreted as a marker of decreased sympathetic activity in cortical vessels. Finally, a novel hybrid technique, combining NIRS and ultrasound, was tested to detect CBF changes after acetazolamide injection in healthy volunteers using a cerebral flow index (CFI). The study showed an increase in CFI, which correlated with CBF measured with 133Xe‐SPECT at 15 min, but not 60 min. Further methodo‐logical and explorative clinical studies are needed to assess the feasibility of ultrasound tagged NIRS in clinical neurology. In summary, the thesis presents several novel approaches, by which NIRS may be used in clinical neurology, and potentials of NIRS to investigate complex mechanisms in neurovascular diseases. ACKNOWLEDGEMENTS This thesis is based on work carried out at the Danish Headache Center, Department of Neurology, Glostrup Hospital, University of Copenhagen, from 2007‐2012 during my appointments as a re‐search fellow and registrar. I would like to thank all of those in‐volved in the completion of this thesis. In particular, I would like to express my deepest appreciation to the following people: Professor Messoud Ashina, my mentor, for introducing me to experimental research, sharing his vast knowledge, boldly giving me the opportunity to develop projects and for constantly en‐couraging me with never ending constructive critique, enthusiasm and good cheer. Professor Jes Olesen for excellent support and generously sharing his impressive knowledge on human research. Juliette Selb, David A. Boas and Arthur DiMartino for introducing me to the NIRS field and for their continuous support, help and invaluable input throughout the studies. My other co‐authors and collaborators on the projects for their invaluable efforts and contributions: Lars Thorbjørn Jensen, Troels Wienecke, Poul Jennum, Rigmor Jensen, Benedicte Ersted Jensen, Hayrunissa Bolay, Koray Ciftçi, Ata Akin, Jakob M. Hansen, Dorte Phillip, Song Guo, Mads Barløse, Stephen Payne, Lene T. Skov‐gaard, Anthony Caparso, Helle K. Iversen, Moshe Kamar and Asaph Nini. Lab technicians Anette Foldager, Lene Elkjær and Winnie Grønning for excellent and very dedicated assistance.

DANISH MEDICAL JOURNAL 12
All the patients and control subjects participating in the studies for generously offering their time and effort. The studies in this thesis were supported by the Lundbeck Foun‐dation via the Center for Neurovascular Signaling, the Augustinus Foundation, the Toyota Foundation, the Danish Headache Soci‐ety, Autonomic Technologies, Inc., Ornim Medical Ltd., the Gang‐sted Foundation, Fridtmodt‐Heineke Foundation, Desirée and Niels Ydes Foundation. REFERENCES
1. Iadecola C. Neurovascular regulation in the normal brain and in Alzheimer's disease. Nat Rev Neurosci 2004; 5: 347‐360
2. Olesen J, Burstein R, Ashina M et al. Origin of pain in migraine: evidence for peripheral sensitisation. Lancet Neurol 2009; 8: 679‐690
3. Moskowitz MA, Macfarlane R. Neurovascular and molecular mechanisms in migraine headaches. Cerebrovasc Brain Metab Rev 1993; 5: 159‐77
4. Moskowitz MA, Bolay H, Dalkara T. Deciphering migraine mechanisms: clues from familial hemiplegic migraine genotypes. Ann Neurol 2004; 55: 276‐80
5. Brennan KC, Charles A. An update on the blood vessel in migraine. Curr Opin Neurol 2010; 23: 266‐274
6. Charles A. Migraine is not primarily a vascular disorder. Cephalalgia 2012; 32: 431‐432
7. Strangman G, Boas DA, Sutton JP. Non‐invasive neuroimaging using near‐infrared light. Biological Psychiatry 2002; 52: 679‐93
8. Obrig H, Villringer A. Beyond the visible‐‐imaging the human brain with light. J Cereb Blood Flow Metab 2003; 23: 1‐18
9. Obrig H. NIRS in clinical neurology ‐ a 'promising' tool? Neuroimage 2013;
10. Akin A, Bilensoy D. Cerebrovascular reactivity to hypercapnia in migraine patients measured with near‐infrared spectroscopy. Brain Res 2006; 1107: 206‐14
11. Liboni W, Molinari F, Allais G et al. Spectral changes of near‐infrared spectroscopy signals in migraineurs with aura reveal an impaired carbon dioxide‐regulatory mechanism. Neurol Sci 2009; 30 Suppl 1: S105‐S107
12. Shinoura N, Yamada R. Decreased vasoreactivity to right cerebral hemisphere pressure in migraine without aura: a near‐infrared spectroscopy study. Clin Neurophysiol 2005; 116: 1280‐5
13. Coutts LV, Cooper CE, Elwell CE et al. Time course of the haemodynamic response to visual stimulation in migraine, measured using near‐infrared spectroscopy. Cephalalgia 2012; 32: 621‐629
14. Viola S, Viola P, Litterio P et al. Pathophysiology of migraine attack with prolonged aura revealed by transcranial Doppler and near infrared spectroscopy. Neurol Sci 2010; 31 Suppl 1: S165‐S166
15. Yaggi HK, Concato J, Kernan WN et al. Obstructive sleep apnea as a risk factor for stroke and death. N Engl J Med 2005; 353: 2034‐2041
16. Redline S, Yenokyan G, Gottlieb DJ et al. Obstructive sleep apnea‐hypopnea and incident stroke: the sleep heart health study. Am J Respir Crit Care Med 2010; 182: 269‐277
17. Marin JM, Carrizo SJ, Vicente E et al. Long‐term cardiovascular outcomes in men with obstructive sleep apnoea‐hypopnoea with or without treatment with
continuous positive airway pressure: an observational study. Lancet 2005; 365: 1046‐1053
18. Matsuo A, Inoue Y, Namba K et al. Changes in cerebral hemoglobin indices in obstructive sleep apnea syndrome with nasal continuous positive airway pressure treatment. Sleep Breath 2011; 15: 487‐492
19. Pizza F, Biallas M, Wolf M et al. Nocturnal cerebral hemodynamics in snorers and in patients with obstructive sleep apnea: a near‐infrared spectroscopy study. Sleep 2010; 33: 205‐210
20. Hayakawa T, Terashima M, Kayukawa Y et al. Changes in cerebral oxygenation and hemodynamics during obstructive sleep apneas. Chest 1996; 109: 916‐921
21. Valipour A, McGown AD, Makker H et al. Some factors affecting cerebral tissue saturation during obstructive sleep apnoea. Eur Respir J 2002; 20: 444‐450
22. Jobsis FF. Noninvasive, infrared monitoring of cerebral and myocardial oxygen sufficiency and circulatory parameters. Science 1977; 198: 1264‐7
23. Brazy JE, Lewis DV, Mitnick MH et al. Noninvasive monitoring of cerebral oxygenation in preterm infants: preliminary observations. Pediatrics 1985; 75: 217‐225
24. Brazy JE, Lewis DV, Mitnick MH et al. Monitoring of cerebral oxygenation in the intensive care nursery. Adv Exp Med Biol 1985; 191: 843‐848
25. Ferrari M, Giannini I, Sideri G et al. Continuous non invasive monitoring of human brain by near infrared spectroscopy. Adv Exp Med Biol 1985; 191: 873‐882
26. Gibson AP, Hebden JC, Arridge SR. Recent advances in diffuse optical imaging. Phys Med Biol 2005; 50: R1‐43
27. Cope M, Delpy DT, Reynolds EO et al. Methods of quantitating cerebral near infrared spectroscopy data. Adv Exp Med Biol 1988; 222: 183‐189
28. Cope M, Delpy DT, Reynolds EO et al. Methods of quantitating cerebral near infrared spectroscopy data. Adv Exp Med Biol 1988; 222: 183‐189
29. Gagnon L, Yucel MA, Dehaes M et al. Quantification of the cortical contribution to the NIRS signal over the motor cortex using concurrent NIRS‐fMRI measurements. Neuroimage 2012; 59: 3933‐3940
30. Uludag K, Kohl M, Steinbrink J et al. Cross talk in the Lambert‐Beer calculation for near‐infrared wavelengths estimated by Monte Carlo simulations. J Biomed Opt 2002; 7: 51‐59
31. Strangman G, Franceschini MA, Boas DA. Factors affecting the accuracy of near‐infrared spectroscopy concentration calculations for focal changes in oxygenation parameters. Neuroimage 2003; 18: 865‐879
32. Canova D, Roatta S, Bosone D et al. Inconsistent detection of changes in cerebral blood volume by near infrared spectroscopy in standard clinical tests. J Appl Physiol 2011; 110: 1646‐1655
33. Smielewski P, Czosnyka M, Pickard JD et al. Clinical evaluation of near‐infrared spectroscopy for testing cerebrovascular reactivity in patients with carotid artery disease. Stroke 1997; 28: 331‐338
34. Huppert TJ, Hoge RD, Diamond SG et al. A temporal comparison of BOLD, ASL, and NIRS hemodynamic responses to motor stimuli in adult humans. Neuroimage 2006; 29: 368‐82
35. Gagnon L, Yucel MA, Boas DA et al. Further improvement in reducing superficial contamination in NIRS using double
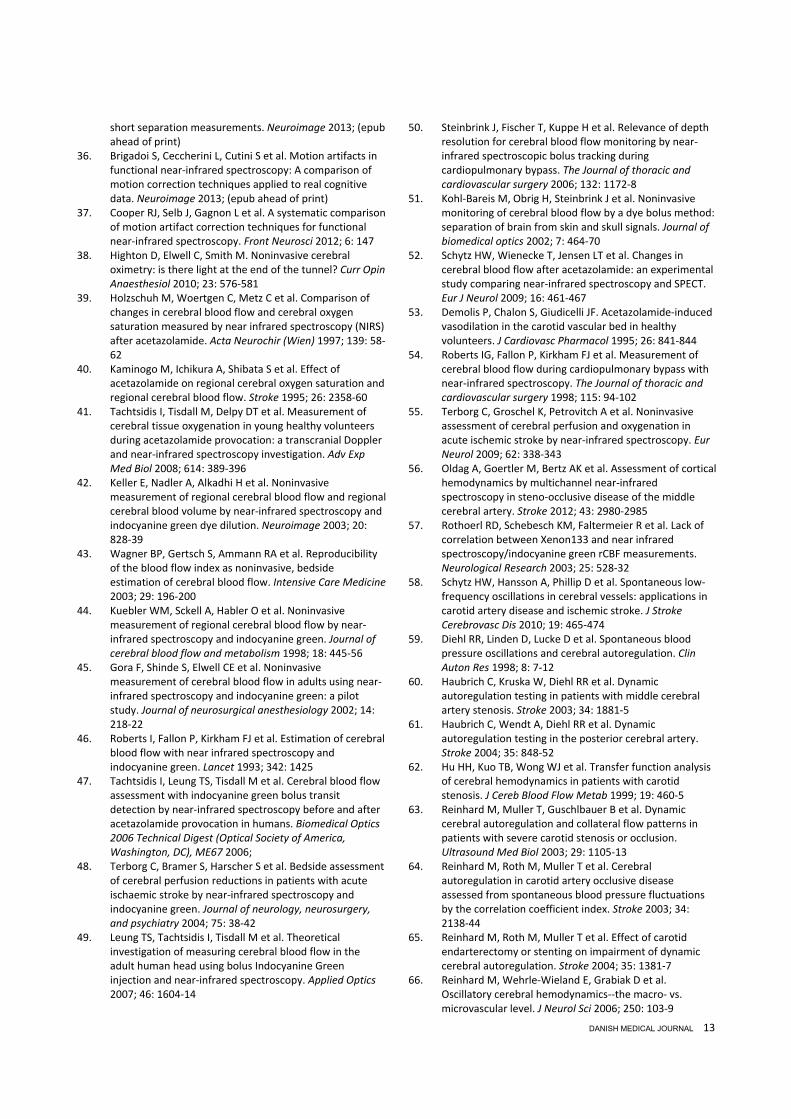
DANISH MEDICAL JOURNAL 13
short separation measurements. Neuroimage 2013; (epub ahead of print)
36. Brigadoi S, Ceccherini L, Cutini S et al. Motion artifacts in functional near‐infrared spectroscopy: A comparison of motion correction techniques applied to real cognitive data. Neuroimage 2013; (epub ahead of print)
37. Cooper RJ, Selb J, Gagnon L et al. A systematic comparison of motion artifact correction techniques for functional near‐infrared spectroscopy. Front Neurosci 2012; 6: 147
38. Highton D, Elwell C, Smith M. Noninvasive cerebral oximetry: is there light at the end of the tunnel? Curr Opin Anaesthesiol 2010; 23: 576‐581
39. Holzschuh M, Woertgen C, Metz C et al. Comparison of changes in cerebral blood flow and cerebral oxygen saturation measured by near infrared spectroscopy (NIRS) after acetazolamide. Acta Neurochir (Wien) 1997; 139: 58‐62
40. Kaminogo M, Ichikura A, Shibata S et al. Effect of acetazolamide on regional cerebral oxygen saturation and regional cerebral blood flow. Stroke 1995; 26: 2358‐60
41. Tachtsidis I, Tisdall M, Delpy DT et al. Measurement of cerebral tissue oxygenation in young healthy volunteers during acetazolamide provocation: a transcranial Doppler and near‐infrared spectroscopy investigation. Adv Exp Med Biol 2008; 614: 389‐396
42. Keller E, Nadler A, Alkadhi H et al. Noninvasive measurement of regional cerebral blood flow and regional cerebral blood volume by near‐infrared spectroscopy and indocyanine green dye dilution. Neuroimage 2003; 20: 828‐39
43. Wagner BP, Gertsch S, Ammann RA et al. Reproducibility of the blood flow index as noninvasive, bedside estimation of cerebral blood flow. Intensive Care Medicine 2003; 29: 196‐200
44. Kuebler WM, Sckell A, Habler O et al. Noninvasive measurement of regional cerebral blood flow by near‐infrared spectroscopy and indocyanine green. Journal of cerebral blood flow and metabolism 1998; 18: 445‐56
45. Gora F, Shinde S, Elwell CE et al. Noninvasive measurement of cerebral blood flow in adults using near‐infrared spectroscopy and indocyanine green: a pilot study. Journal of neurosurgical anesthesiology 2002; 14: 218‐22
46. Roberts I, Fallon P, Kirkham FJ et al. Estimation of cerebral blood flow with near infrared spectroscopy and indocyanine green. Lancet 1993; 342: 1425
47. Tachtsidis I, Leung TS, Tisdall M et al. Cerebral blood flow assessment with indocyanine green bolus transit detection by near‐infrared spectroscopy before and after acetazolamide provocation in humans. Biomedical Optics 2006 Technical Digest (Optical Society of America, Washington, DC), ME67 2006;
48. Terborg C, Bramer S, Harscher S et al. Bedside assessment of cerebral perfusion reductions in patients with acute ischaemic stroke by near‐infrared spectroscopy and indocyanine green. Journal of neurology, neurosurgery, and psychiatry 2004; 75: 38‐42
49. Leung TS, Tachtsidis I, Tisdall M et al. Theoretical investigation of measuring cerebral blood flow in the adult human head using bolus Indocyanine Green injection and near‐infrared spectroscopy. Applied Optics 2007; 46: 1604‐14
50. Steinbrink J, Fischer T, Kuppe H et al. Relevance of depth resolution for cerebral blood flow monitoring by near‐infrared spectroscopic bolus tracking during cardiopulmonary bypass. The Journal of thoracic and cardiovascular surgery 2006; 132: 1172‐8
51. Kohl‐Bareis M, Obrig H, Steinbrink J et al. Noninvasive monitoring of cerebral blood flow by a dye bolus method: separation of brain from skin and skull signals. Journal of biomedical optics 2002; 7: 464‐70
52. Schytz HW, Wienecke T, Jensen LT et al. Changes in cerebral blood flow after acetazolamide: an experimental study comparing near‐infrared spectroscopy and SPECT. Eur J Neurol 2009; 16: 461‐467
53. Demolis P, Chalon S, Giudicelli JF. Acetazolamide‐induced vasodilation in the carotid vascular bed in healthy volunteers. J Cardiovasc Pharmacol 1995; 26: 841‐844
54. Roberts IG, Fallon P, Kirkham FJ et al. Measurement of cerebral blood flow during cardiopulmonary bypass with near‐infrared spectroscopy. The Journal of thoracic and cardiovascular surgery 1998; 115: 94‐102
55. Terborg C, Groschel K, Petrovitch A et al. Noninvasive assessment of cerebral perfusion and oxygenation in acute ischemic stroke by near‐infrared spectroscopy. Eur Neurol 2009; 62: 338‐343
56. Oldag A, Goertler M, Bertz AK et al. Assessment of cortical hemodynamics by multichannel near‐infrared spectroscopy in steno‐occlusive disease of the middle cerebral artery. Stroke 2012; 43: 2980‐2985
57. Rothoerl RD, Schebesch KM, Faltermeier R et al. Lack of correlation between Xenon133 and near infrared spectroscopy/indocyanine green rCBF measurements. Neurological Research 2003; 25: 528‐32
58. Schytz HW, Hansson A, Phillip D et al. Spontaneous low‐frequency oscillations in cerebral vessels: applications in carotid artery disease and ischemic stroke. J Stroke Cerebrovasc Dis 2010; 19: 465‐474
59. Diehl RR, Linden D, Lucke D et al. Spontaneous blood pressure oscillations and cerebral autoregulation. Clin Auton Res 1998; 8: 7‐12
60. Haubrich C, Kruska W, Diehl RR et al. Dynamic autoregulation testing in patients with middle cerebral artery stenosis. Stroke 2003; 34: 1881‐5
61. Haubrich C, Wendt A, Diehl RR et al. Dynamic autoregulation testing in the posterior cerebral artery. Stroke 2004; 35: 848‐52
62. Hu HH, Kuo TB, Wong WJ et al. Transfer function analysis of cerebral hemodynamics in patients with carotid stenosis. J Cereb Blood Flow Metab 1999; 19: 460‐5
63. Reinhard M, Muller T, Guschlbauer B et al. Dynamic cerebral autoregulation and collateral flow patterns in patients with severe carotid stenosis or occlusion. Ultrasound Med Biol 2003; 29: 1105‐13
64. Reinhard M, Roth M, Muller T et al. Cerebral autoregulation in carotid artery occlusive disease assessed from spontaneous blood pressure fluctuations by the correlation coefficient index. Stroke 2003; 34: 2138‐44
65. Reinhard M, Roth M, Muller T et al. Effect of carotid endarterectomy or stenting on impairment of dynamic cerebral autoregulation. Stroke 2004; 35: 1381‐7
66. Reinhard M, Wehrle‐Wieland E, Grabiak D et al. Oscillatory cerebral hemodynamics‐‐the macro‐ vs. microvascular level. J Neurol Sci 2006; 250: 103‐9

DANISH MEDICAL JOURNAL 14
67. Reinhard M, Gerds TA, Grabiak D et al. Cerebral dysautoregulation and the risk of ischemic events in occlusive carotid artery disease. J Neurol 2008;
68. Mayer S. Studien zur physiologie des herzens und der blutgefässe. Sitz Kaiser Akad Wiss 1876; 74: 281‐307
69. Mayhew JE, Askew S, Zheng Y et al. Cerebral vasomotion: a 0.1‐Hz oscillation in reflected light imaging of neural activity. Neuroimage 1996; 4: 183‐93
70. Hudetz AG, Smith JJ, Lee JG et al. Modification of cerebral laser‐Doppler flow oscillations by halothane, PCO2, and nitric oxide synthase blockade. Am J Physiol 1995; 269: 114‐20
71. Auer LM, Gallhofer B. Rhythmic activity of cat pial vessels in vivo. Eur Neurol 1981; 20: 448‐68
72. Obrig H, Neufang M, Wenzel R et al. Spontaneous low frequency oscillations of cerebral hemodynamics and metabolism in human adults. Neuroimage 2000; 12: 623‐39
73. Schroeter ML, Schmiedel O, von Cramon DY. Spontaneous low‐frequency oscillations decline in the aging brain. J Cereb Blood Flow Metab 2004; 24: 1183‐91
74. Schroeter ML, Bucheler MM, Preul C et al. Spontaneous slow hemodynamic oscillations are impaired in cerebral microangiopathy. J Cereb Blood Flow Metab 2005; 25: 1675‐84
75. Tachtsidis I, Elwell CE, Leung TS et al. Investigation of cerebral haemodynamics by near‐infrared spectroscopy in young healthy volunteers reveals posture‐dependent spontaneous oscillations. Physiol Meas 2004; 25: 437‐45
76. Vermeij A, Meel‐van den Abeelen AS, Kessels RP et al. Very‐low‐frequency oscillations of cerebral hemodynamics and blood pressure are affected by aging and cognitive load. Neuroimage 2013;
77. Phillip D, Schytz HW, Selb J et al. Low frequency oscillations in cephalic vessels assessed by near infrared spectroscopy. Eur J Clin Invest 2012; 42: 1180‐1188
78. Reinhard M, Muller T, Guschlbauer B et al. Transfer function analysis for clinical evaluation of dynamic cerebral autoregulation‐‐a comparison between spontaneous and respiratory‐induced oscillations. Physiol Meas 2003; 24: 27‐43
79. Payne SJ, Selb J, Boas DA. Effects of autoregulation and CO2 reactivity on cerebral oxygen transport. Ann Biomed Eng 2009; 37: 2288‐2298
80. Vernieri F, Tibuzzi F, Pasqualetti P et al. Increased cerebral vasomotor reactivity in migraine with aura: an autoregulation disorder? A transcranial Doppler and near‐infrared spectroscopy study. Cephalalgia 2008; 28: 689‐695
81. Watanabe Y, Tanaka H, Dan I et al. Monitoring cortical hemodynamic changes after sumatriptan injection during migraine attack by near‐infrared spectroscopy. Neurosci Res 2011; 69: 60‐66
82. Settakis G, Lengyel A, Molnar C et al. Transcranial Doppler study of the cerebral hemodynamic changes during breath‐holding and hyperventilation tests. J Neuroimaging 2002; 12: 252‐258
83. Hilz MJ, Dutsch M, Perrine K et al. Hemispheric influence on autonomic modulation and baroreflex sensitivity. Ann Neurol 2001; 49: 575‐584
84. Avnon Y, Nitzan M, Sprecher E et al. Autonomic asymmetry in migraine: augmented parasympathetic
activation in left unilateral migraineurs. Brain 2004; 127: 2099‐108
85. Viola S, Viola P, Litterio P et al. A new near‐infrared spectroscopy parameter as marker for patients with migraine. Neurol Sci 2013; 34 Suppl 1: S129‐S131
86. Amin FM, Asghar MS, Ravneberg JW et al. The effect of sumatriptan on cephalic arteries: A 3T MR‐angiography study in healthy volunteers. Cephalalgia 2013; 33: 1009‐1016
87. Amin FM, Asghar MS, Hougaard A et al. Magnetic resonance angiography of intracranial and extracranial arteries in patients with spontaneous migraine without aura: a cross‐sectional study. Lancet Neurol 2013; 12: 454‐461
88. Asghar MS, Hansen AE, Amin FM et al. Evidence for a vascular factor in migraine. Ann Neurol 2011; 69: 635‐645
89. Brennan KC, Charles A. An update on the blood vessel in migraine. Curr Opin Neurol 2010; 23: 266‐274
90. Obrig H, Israel H, Kohl‐Bareis M et al. Habituation of the visually evoked potential and its vascular response: implications for neurovascular coupling in the healthy adult. Neuroimage 2002; 17: 1‐18
91. Schytz HW, Ciftci K, Akin A et al. Intact neurovascular coupling during executive function in migraine without aura: interictal near‐infrared spectroscopy study. Cephalalgia 2010; 30: 457‐466
92. Macleod CM. Half a century of research on the Stroop effect: an integrative review. Psychol Bull 1991; 109: 163‐203
93. Zysset S, Muller K, Lohmann G et al. Color‐word matching stroop task: separating interference and response conflict. Neuroimage 2001; 13: 29‐36
94. Uludag K, Steinbrink J, Villringer A et al. Separability and cross talk: optimizing dual wavelength combinations for near‐infrared spectroscopy of the adult head. Neuroimage 2004; 22: 583‐589
95. International Classification Committee of the International Headache Society (IHS). The International Classification of Headache Disorders, 3rd edition (beta version). Cephalalgia 2013; 33: 629‐808
96. Ophoff RA, Terwindt GM, Vergouwe MN et al. Familial hemiplegic migraine and episodic ataxia type‐2 are caused by mutations in the Ca2+ channel gene CACNL1A4. Cell 1996; 87: 543‐552
97. De FM, Marconi R, Silvestri L et al. Haploinsufficiency of ATP1A2 encoding the Na+/K+ pump alpha2 subunit associated with familial hemiplegic migraine type 2. Nat Genet 2003; 33: 192‐196
98. Dichgans M, Freilinger T, Eckstein G et al. Mutation in the neuronal voltage‐gated sodium channel SCN1A in familial hemiplegic migraine. Lancet 2005; 366: 371‐377
99. van den Maagdenberg AM, Haan J, Terwindt GM et al. Migraine: gene mutations and functional consequences. Curr Opin Neurol 2007; 20: 299‐305
100. Hansen JM, Thomsen LL, Marconi R et al. Familial hemiplegic migraine type 2 does not share hypersensitivity to nitric oxide with common types of migraine. Cephalalgia 2008; 28: 367‐375
101. Hansen JM, Thomsen LL, Olesen J et al. Familial hemiplegic migraine type 1 shows no hypersensitivity to nitric oxide. Cephalalgia 2008; 28: 496‐505
DANISH MEDICAL JOURNAL 15
102. Hansen JM, Thomsen LL, Olesen J et al. Coexisting typical migraine in familial hemiplegic migraine. Neurology 2010; 74: 594‐600
103. Afridi SK, Kaube H, Goadsby PJ. Glyceryl trinitrate triggers premonitory symptoms in migraineurs. Pain 2004; 110: 675‐680
104. Christiansen I, Thomsen LL, Daugaard D et al. Glyceryl trinitrate induces attacks of migraine without aura in sufferers of migraine with aura. Cephalalgia 1999; 19: 660‐667
105. Thomsen LL KCIHOJ. A nitric oxide donor triggers genuine migraine attacks. Eur J Neurol 1994; 1: 73‐80
106. Dirnagl U, Lindauer U, Villringer A. Nitric oxide synthase blockade enhances vasomotion in the cerebral microcirculation of anesthetized rats. Microvasc Res 1993; 45: 318‐323
107. Schytz HW, Hansen JM, Phillip D et al. Nitric oxide modulation of low‐frequency oscillations in cortical vessels in FHM‐‐a NIRS study. Headache 2012; 52: 1146‐1154
108. Dirnagl U, Lindauer U, Villringer A. Nitric oxide synthase blockade enhances vasomotion in the cerebral microcirculation of anesthetized rats. Microvasc Res 1993; 45: 318‐323
109. Tachtsidis I, Elwell CE, Lee CW et al. Spectral characteristics of spontaneous oscillations in cerebral haemodynamics are posture dependent. Adv Exp Med Biol 2003; 540: 31‐6
110. May A, Bahra A, Buchel C et al. Hypothalamic activation in cluster headache attacks. Lancet 1998; 352: 275‐278
111. Bolay H, Reuter U, Dunn AK et al. Intrinsic brain activity triggers trigeminal meningeal afferents in a migraine model. Nat Med 2002; 8: 136‐142
112. Tanelian DL. Cholinergic activation of a population of corneal afferent nerves. Exp Brain Res 1991; 86: 414‐20
113. Uddman R, Tajti J, Moller S et al. Neuronal messengers and peptide receptors in the human sphenopalatine and otic ganglia. Brain Res 1999; 826: 193‐9
114. Levy D, Strassman AM. Modulation of dural nociceptor mechanosensitivity by the nitric oxide‐cyclic GMP signaling cascade. J Neurophysiol 2004; 92: 766‐72
115. Delepine L, Aubineau P. Plasma protein extravasation induced in the rat dura mater by stimulation of the parasympathetic sphenopalatine ganglion. Exp Neurol 1997; 147: 389‐400
116. Cohen AS, Burns B, Goadsby PJ. High‐flow oxygen for treatment of cluster headache: a randomized trial. JAMA 2009; 302: 2451‐2457
117. Schoenen J, May A, Jensen R, Lainez MJ, Lantèri‐Minet M, Gaul C, Goodman A, Carpaso A. 2012 Pathway CH‐1 Study: Sphenopalatine Ganglion (SPG) Stimulation for Acute Treatment of Chronic Cluster Headache (CCH).
118. Takahashi M, Zhang ZD, Macdonald RL. Sphenopalatine ganglion stimulation for vasospasm after experimental subarachnoid hemorrhage. J Neurosurg 2011; 114: 1104‐1109
119. Suzuki N, Gotoh F, Gotoh J et al. Evidence for in vivo cerebrovascular neurogenic vasodilatation in the rat. Clin Auton Res 1991; 1: 23‐26
120. Suzuki N, Hardebo JE, Kahrstrom J et al. Selective electrical stimulation of postganglionic cerebrovascular parasympathetic nerve fibers originating from the
sphenopalatine ganglion enhances cortical blood flow in the rat. J Cereb Blood Flow Metab 1990; 10: 383‐391
121. Schytz HW, Barlose M, Guo S et al. Experimental activation of the sphenopalatine ganglion provokes cluster‐like attacks in humans. Cephalalgia 2013; 33: 831‐841
122. Sleep‐related breathing disorders in adults: recommendations for syndrome definition and measurement techniques in clinical research. The Report of an American Academy of Sleep Medicine Task Force. Sleep 1999; 22: 667‐689
123. Tufik S, Santos‐Silva R, Taddei JA et al. Obstructive sleep apnea syndrome in the Sao Paulo Epidemiologic Sleep Study. Sleep Med 2010; 11: 441‐446
124. Akhan G, Ayik S, Songu M. Cerebral oxygenation during sleep in patients with obstructive sleep apnea: a near‐infrared spectroscopy study. J Otolaryngol Head Neck Surg 2012; 41: 437‐442
125. Walsleben JA, O'Malley EB, Bonnet K et al. The utility of topographic EEG mapping in obstructive sleep apnea syndrome. Sleep 1993; 16: S76‐S78
126. Hsieh SW, Lai CL, Liu CK et al. Obstructive sleep apnea linked to wake‐up strokes. J Neurol 2012; 259: 1433‐1439
127. Kohler M, Stradling JR. Mechanisms of vascular damage in obstructive sleep apnea. Nat Rev Cardiol 2010; 7: 677‐685
128. Lesske J, Fletcher EC, Bao G et al. Hypertension caused by chronic intermittent hypoxia‐‐influence of chemoreceptors and sympathetic nervous system. J Hypertens 1997; 15: 1593‐1603
129. Dematteis M, Julien C, Guillermet C et al. Intermittent hypoxia induces early functional cardiovascular remodeling in mice. Am J Respir Crit Care Med 2008; 177: 227‐235
130. Fletcher EC, Miller J, Schaaf JW et al. Urinary catecholamines before and after tracheostomy in patients with obstructive sleep apnea and hypertension. Sleep 1987; 10: 35‐44
131. Carlson JT, Hedner J, Elam M et al. Augmented resting sympathetic activity in awake patients with obstructive sleep apnea. Chest 1993; 103: 1763‐1768
132. Drager LF, Bortolotto LA, Figueiredo AC et al. Effects of continuous positive airway pressure on early signs of atherosclerosis in obstructive sleep apnea. Am J Respir Crit Care Med 2007; 176: 706‐712
133. Kohler M, Pepperell JC, Casadei B et al. CPAP and measures of cardiovascular risk in males with OSAS. Eur Respir J 2008; 32: 1488‐1496
134. Saito T, Saito T, Sugiyama S et al. Effects of long‐term treatment for obstructive sleep apnea on pulse wave velocity. Hypertens Res 2010; 33: 844‐849
135. Japundzic N, Grichois ML, Zitoun P et al. Spectral analysis of blood pressure and heart rate in conscious rats: effects of autonomic blockers. J Auton Nerv Syst 1990; 30: 91‐100
136. Cerutti C, Barres C, Paultre C. Baroreflex modulation of blood pressure and heart rate variabilities in rats: assessment by spectral analysis. Am J Physiol 1994; 266: 1993‐2000
137. Pierro ML, Sassaroli A, Bergethon PR et al. Phase‐amplitude investigation of spontaneous low‐frequency oscillations of cerebral hemodynamics with near‐infrared spectroscopy: a sleep study in human subjects. Neuroimage 2012; 63: 1571‐1584

DANISH MEDICAL JOURNAL 16
138. Cabiddu R, Cerutti S, Viardot G et al. Modulation of the Sympatho‐Vagal Balance during Sleep: Frequency Domain Study of Heart Rate Variability and Respiration. Front Physiol 2012; 3: 45
139. Schytz HW, Jensen BE, Jennum P et al. Low‐frequency oscillations and vasoreactivity of cortical vessels in obstructive sleep apnea during wakefulness: a near infrared spectroscopy study. Sleep Med 2013; 14: 416‐421
140. Mahan GD, Engler WE, Tiemann JJ et al. Ultrasonic tagging of light: theory. Proc Natl Acad Sci U S A 1998; 95: 14015‐14019
141. Yao G, Wang LV. Theoretical and experimental studies of ultrasound‐modulated optical tomography in biological tissue. Appl Opt 2000; 39: 659‐664
142. Schytz HW, Guo S, Jensen LT et al. A new technology for detecting cerebral blood flow: a comparative study of ultrasound tagged NIRS and 133Xe‐SPECT. Neurocrit Care 2012; 17: 139‐145
143. Bruhn H, Kleinschmidt A, Boecker H et al. The effect of acetazolamide on regional cerebral blood oxygenation at rest and under stimulation as assessed by MRI. J Cereb Blood Flow Metab 1994; 14: 742‐748