information theoretic approaches for detecting causality...
TRANSCRIPT

Information Theoretic Approaches for Detecting Causality
in Gene Regulatory Networks
Kangkan MedhiDept of Computer Sc. & Engg.
Indian School of MinesDhanbad, India
Syed Sazzad AhmedDept of Information
TechnologyNorth-Eastern Hill University
Shillong, [email protected]
Swarup RoyDept of Information
TechnologyNorth-Eastern Hill University
Shillong, [email protected]
Dhruba K BhattacharyyaDept of Computer Sc. & Engg.
Tezpur UniversityTezpur, India
Jugal K KalitaDept of Computer Sc.University of ColoradoColorado Spring, [email protected]
ABSTRACTCausality detection in gene regulatory networks (GRN) is achallenging and important task. Very few techniques havebeen proposed so far to infer causality in GRN. A major-ity of them adapts information theory as a measure to infera causal relationship. In this work we evaluate the per-formance of information theoretic causality detection tech-niques in GRN.
We consider two such measures, namely, Transfer En-tropy and Interaction Information and compare their per-formance with Granger causality, a statistical causality in-ference method. For evaluation, we use synthetic gold stan-dard data and underlying causal networks from DREAMchallenges.
Experimental results reveal that Interaction Informationperforms better in comparison to other candidate methodsfor inferring causality in GRN. It is also evident from theresults that performance of information theoretic approachesis sensitive towards discretization method used.
CCS Concepts•Applied computing!Computational biology; Recog-nition of genes and regulatory elements; Biological networks;
KeywordsGene Regulatory Network; Causality; Inference; Mutual In-formation; Transfer Entropy
1. INTRODUCTIONThe genome encodes thousands of genes whose products
Permission to make digital or hard copies of all or part of this work for personal orclassroom use is granted without fee provided that copies are not made or distributedfor profit or commercial advantage and that copies bear this notice and the full cita-tion on the first page. Copyrights for components of this work owned by others thanACM must be honored. Abstracting with credit is permitted. To copy otherwise, or re-publish, to post on servers or to redistribute to lists, requires prior specific permissionand/or a fee. Request permissions from [email protected].
ICTCS ’16, March 04-05, 2016, Udaipur, India
c� 2016 ACM. ISBN 978-1-4503-3962-9/16/03. . . $15.00
DOI: http://dx.doi.org/10.1145/2905055.2905188
enable numerous cellular functions. The amounts and thetemporal patterns in which these products appear in the cellare crucial to the processes of life. Gene regulatory networksgovern the levels of these gene products and thus play a veryimportant role in every process of life, including cell di↵eren-tiation, metabolism, the cell cycle and signal transduction.
In Gene Regulatory Network (GRN) a group of genes in acell intercommunicate with each other and with other sub-stances like proteins, metabolites, etc., in the cell therebyregulating the rates at which genes in the network are tran-scribed into mRNA [7].
Computationally, quite often GRN is represented as agraph to describe the interactions among biomolecules. Anode in a graph represents a biomolecule such as a gene,a protein or a metabolite, and an edge (or link) indicatesthe interaction between these two biomolecules. Such inter-actions may be physical interactions, metabolite flow, reg-ulatory relationships, co-expression relationships, etc. [11].Depending upon the nature of the edges in GRN, we gettwo types of GRN: Directed with causal relationships andUndirected (also called as Gene Co-Expression Network). Incontrast to gene co-expression networks, a GRN is a directedrepresentation providing additional information giving di-rection of influence between two genes. In a GRN, causalinformation is an important component in deducing the ex-isting regulatory relationship between genes or gene prod-ucts. Causation describes the relationship that is presentbetween a cause and its e↵ect, where the later is an out-come of the former. Causation plays an important role inGRN and is depicted by a directed graph where the directededges correspond to causal influences between gene-activities(nodes).
A number of techniques have been proposed to infer causal-ity in general for various application domains. They are ei-ther statistical or information theoretic approaches. Thesemethods have been applied in finding causality in GRN. Ma-jority of them are mainly based on information theory.
In this work, we consider transfer entropy and interactioninformation measures for inferring causality and comparetheir performance with Granger causality measure.
2. MEASURES FOR INFERRING CAUSAL-ITY IN GRN
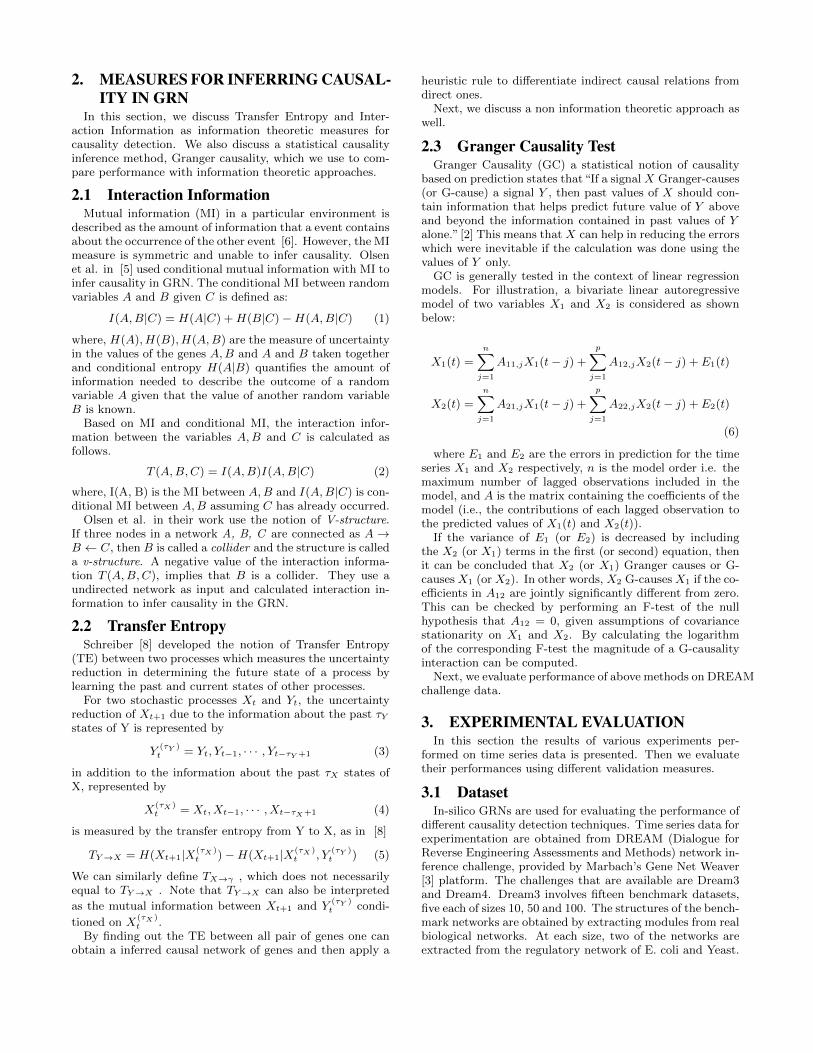
In this section, we discuss Transfer Entropy and Inter-action Information as information theoretic measures forcausality detection. We also discuss a statistical causalityinference method, Granger causality, which we use to com-pare performance with information theoretic approaches.
2.1 Interaction InformationMutual information (MI) in a particular environment is
described as the amount of information that a event containsabout the occurrence of the other event [6]. However, the MImeasure is symmetric and unable to infer causality. Olsenet al. in [5] used conditional mutual information with MI toinfer causality in GRN. The conditional MI between randomvariables A and B given C is defined as:
I(A,B|C) = H(A|C) +H(B|C)�H(A,B|C) (1)
where, H(A), H(B), H(A,B) are the measure of uncertaintyin the values of the genes A,B and A and B taken togetherand conditional entropy H(A|B) quantifies the amount ofinformation needed to describe the outcome of a randomvariable A given that the value of another random variableB is known.
Based on MI and conditional MI, the interaction infor-mation between the variables A,B and C is calculated asfollows.
T (A,B,C) = I(A,B)I(A,B|C) (2)
where, I(A, B) is the MI between A,B and I(A,B|C) is con-ditional MI between A,B assuming C has already occurred.
Olsen et al. in their work use the notion of V-structure.If three nodes in a network A, B, C are connected as A !B C, then B is called a collider and the structure is calleda v-structure. A negative value of the interaction informa-tion T (A,B,C), implies that B is a collider. They use aundirected network as input and calculated interaction in-formation to infer causality in the GRN.
2.2 Transfer EntropySchreiber [8] developed the notion of Transfer Entropy
(TE) between two processes which measures the uncertaintyreduction in determining the future state of a process bylearning the past and current states of other processes.
For two stochastic processes Xt
and Yt
, the uncertaintyreduction of X
t+1 due to the information about the past ⌧Y
states of Y is represented by
Y(⌧Y )t
= Yt
, Yt�1, · · · , Yt�⌧Y +1 (3)
in addition to the information about the past ⌧X
states ofX, represented by
X(⌧X )t
= Xt
, Xt�1, · · · , Xt�⌧X+1 (4)
is measured by the transfer entropy from Y to X, as in [8]
TY !X
= H(Xt+1|X(⌧X )
t
)�H(Xt+1|X(⌧X )
t
, Y(⌧Y )t
) (5)
We can similarly define TX!�
, which does not necessarilyequal to T
Y !X
. Note that TY !X
can also be interpretedas the mutual information between X
t+1 and Y(⌧Y )t
condi-
tioned on X(⌧X )t
.By finding out the TE between all pair of genes one can
obtain a inferred causal network of genes and then apply a
heuristic rule to di↵erentiate indirect causal relations fromdirect ones.
Next, we discuss a non information theoretic approach aswell.
2.3 Granger Causality TestGranger Causality (GC) a statistical notion of causality
based on prediction states that“If a signalX Granger-causes(or G-cause) a signal Y , then past values of X should con-tain information that helps predict future value of Y aboveand beyond the information contained in past values of Yalone.” [2] This means that X can help in reducing the errorswhich were inevitable if the calculation was done using thevalues of Y only.
GC is generally tested in the context of linear regressionmodels. For illustration, a bivariate linear autoregressivemodel of two variables X1 and X2 is considered as shownbelow:
X1(t) =nX
j=1
A11,jX1(t� j) +pX
j=1
A12,jX2(t� j) + E1(t)
X2(t) =nX
j=1
A21,jX1(t� j) +pX
j=1
A22,jX2(t� j) + E2(t)
(6)
where E1 and E2 are the errors in prediction for the timeseries X1 and X2 respectively, n is the model order i.e. themaximum number of lagged observations included in themodel, and A is the matrix containing the coe�cients of themodel (i.e., the contributions of each lagged observation tothe predicted values of X1(t) and X2(t)).
If the variance of E1 (or E2) is decreased by includingthe X2 (or X1) terms in the first (or second) equation, thenit can be concluded that X2 (or X1) Granger causes or G-causesX1 (orX2). In other words, X2 G-causesX1 if the co-e�cients in A12 are jointly significantly di↵erent from zero.This can be checked by performing an F-test of the nullhypothesis that A12 = 0, given assumptions of covariancestationarity on X1 and X2. By calculating the logarithmof the corresponding F-test the magnitude of a G-causalityinteraction can be computed.
Next, we evaluate performance of above methods on DREAMchallenge data.
3. EXPERIMENTAL EVALUATIONIn this section the results of various experiments per-
formed on time series data is presented. Then we evaluatetheir performances using di↵erent validation measures.
3.1 DatasetIn-silico GRNs are used for evaluating the performance of
di↵erent causality detection techniques. Time series data forexperimentation are obtained from DREAM (Dialogue forReverse Engineering Assessments and Methods) network in-ference challenge, provided by Marbach’s Gene Net Weaver[3] platform. The challenges that are available are Dream3and Dream4. Dream3 involves fifteen benchmark datasets,five each of sizes 10, 50 and 100. The structures of the bench-mark networks are obtained by extracting modules from realbiological networks. At each size, two of the networks areextracted from the regulatory network of E. coli and Yeast.
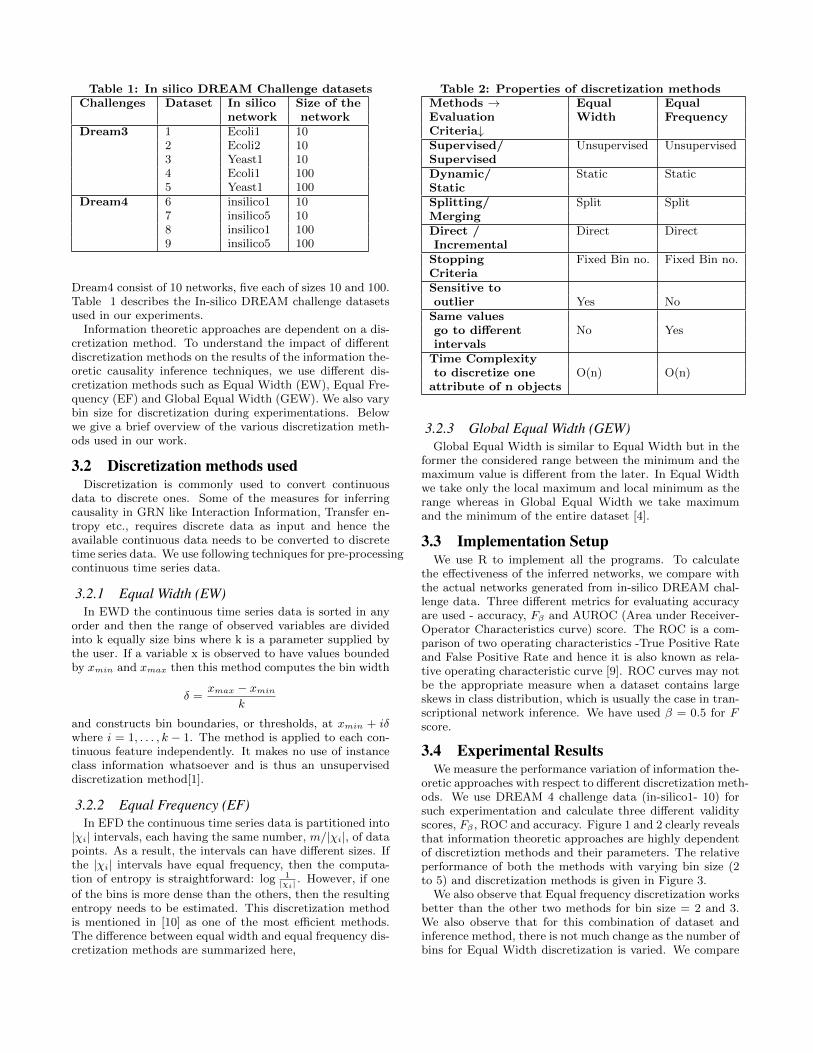
Table 1: In silico DREAM Challenge datasets
Challenges Dataset In silico Size of the
network network
Dream3 1 Ecoli1 102 Ecoli2 103 Yeast1 104 Ecoli1 1005 Yeast1 100
Dream4 6 insilico1 107 insilico5 108 insilico1 1009 insilico5 100
Dream4 consist of 10 networks, five each of sizes 10 and 100.Table 1 describes the In-silico DREAM challenge datasetsused in our experiments.
Information theoretic approaches are dependent on a dis-cretization method. To understand the impact of di↵erentdiscretization methods on the results of the information the-oretic causality inference techniques, we use di↵erent dis-cretization methods such as Equal Width (EW), Equal Fre-quency (EF) and Global Equal Width (GEW). We also varybin size for discretization during experimentations. Belowwe give a brief overview of the various discretization meth-ods used in our work.
3.2 Discretization methods usedDiscretization is commonly used to convert continuous
data to discrete ones. Some of the measures for inferringcausality in GRN like Interaction Information, Transfer en-tropy etc., requires discrete data as input and hence theavailable continuous data needs to be converted to discretetime series data. We use following techniques for pre-processingcontinuous time series data.
3.2.1 Equal Width (EW)
In EWD the continuous time series data is sorted in anyorder and then the range of observed variables are dividedinto k equally size bins where k is a parameter supplied bythe user. If a variable x is observed to have values boundedby x
min
and xmax
then this method computes the bin width
� =xmax
� xmin
k
and constructs bin boundaries, or thresholds, at xmin
+ i�where i = 1, . . . , k � 1. The method is applied to each con-tinuous feature independently. It makes no use of instanceclass information whatsoever and is thus an unsuperviseddiscretization method[1].
3.2.2 Equal Frequency (EF)
In EFD the continuous time series data is partitioned into|�
i
| intervals, each having the same number, m/|�i
|, of datapoints. As a result, the intervals can have di↵erent sizes. Ifthe |�
i
| intervals have equal frequency, then the computa-tion of entropy is straightforward: log 1
|�i|. However, if one
of the bins is more dense than the others, then the resultingentropy needs to be estimated. This discretization methodis mentioned in [10] as one of the most e�cient methods.The di↵erence between equal width and equal frequency dis-cretization methods are summarized here,
Table 2: Properties of discretization methods
Methods ! Equal Equal
Evaluation Width Frequency
Criteria#Supervised/ Unsupervised UnsupervisedSupervised
Dynamic/ Static StaticStatic
Splitting/ Split SplitMerging
Direct / Direct DirectIncremental
Stopping Fixed Bin no. Fixed Bin no.Criteria
Sensitive to
outlier Yes NoSame values
go to di↵erent No Yesintervals
Time Complexity
to discretize one O(n) O(n)attribute of n objects
3.2.3 Global Equal Width (GEW)
Global Equal Width is similar to Equal Width but in theformer the considered range between the minimum and themaximum value is di↵erent from the later. In Equal Widthwe take only the local maximum and local minimum as therange whereas in Global Equal Width we take maximumand the minimum of the entire dataset [4].
3.3 Implementation SetupWe use R to implement all the programs. To calculate
the e↵ectiveness of the inferred networks, we compare withthe actual networks generated from in-silico DREAM chal-lenge data. Three di↵erent metrics for evaluating accuracyare used - accuracy, F
�
and AUROC (Area under Receiver-Operator Characteristics curve) score. The ROC is a com-parison of two operating characteristics -True Positive Rateand False Positive Rate and hence it is also known as rela-tive operating characteristic curve [9]. ROC curves may notbe the appropriate measure when a dataset contains largeskews in class distribution, which is usually the case in tran-scriptional network inference. We have used � = 0.5 for Fscore.
3.4 Experimental ResultsWe measure the performance variation of information the-
oretic approaches with respect to di↵erent discretization meth-ods. We use DREAM 4 challenge data (in-silico1- 10) forsuch experimentation and calculate three di↵erent validityscores, F
�
, ROC and accuracy. Figure 1 and 2 clearly revealsthat information theoretic approaches are highly dependentof discretiztion methods and their parameters. The relativeperformance of both the methods with varying bin size (2to 5) and discretization methods is given in Figure 3.
We also observe that Equal frequency discretization worksbetter than the other two methods for bin size = 2 and 3.We also observe that for this combination of dataset andinference method, there is not much change as the number ofbins for Equal Width discretization is varied. We compare

Figure 1: Performance of Transfer Entropy with dif-
ferent discretization methods for DREAM4.
Figure 2: Performance of Interaction Information
with di↵erent discretization methods for DREAM4.
the performance of information theoretic approaches withGC and present the results of the experiments in Figure 4.
Comparison of the result reveals that the Interaction In-formation method for casuality inference performs consis-tently better than the other two methods for all datasets.However, it fails to infer positive edges.
4. CONCLUSIONIn this work, we evaluate the performance of informa-
tion theoretic approaches such as Interaction information orTransfer Entropy to infer causal relationship in GRNs fromtime-series gene expression data. We also compare theirperformance with a statistical causality inference method,Granger Causality. We use DREAM challenge data for ex-perimentation. We also use di↵erent discretization methodsas performance of information theoretic method depends onthem. Experimental results reveals that Interaction Infor-mation measures are more e↵ective in inferring causal rela-tion in comparison to other candidate methods.
5. REFERENCES[1] J. Dougherty, R. Kohavi, M. Sahami, et al. Supervised
and unsupervised discretization of continuous features.In Machine learning: proceedings of the twelfthinternational conference, volume 12, pages 194–202,1995.
Figure 3: Comparison of Interaction Information
and Transfer Entropy for the dataset Yeast-1,size10.
Figure 4: Performance of Granger Causality Test,
Transfer entropy and Interaction Information.
[2] C. W. Granger. Investigating causal relations byeconometric models and cross-spectral methods.Econometrica: Journal of the Econometric Society,pages 424–438, 1969.
[3] D. Marbach, T. Scha↵ter, C. Mattiussi, andD. Floreano. Generating realistic in silico genenetworks for performance assessment of reverseengineering methods. Journal of computationalbiology, 16(2):229–239, 2009.
[4] P. E. Meyer, F. Lafitte, and G. Bontempi. minet:Ar/bioconductor package for inferring largetranscriptional networks using mutual information.BMC bioinformatics, 9(1):461, 2008.
[5] C. Olsen, P. E. Meyer, and G. Bontempi. Inferringcausal relationships using informationtheoreticmeasures. In Proceedings of the 5th BeneluxBioinformatics Conference (BBC09), 2009.
[6] I. Priness, O. Maimon, and I. Ben-Gal. Evaluation ofgene-expression clustering via mutual informationdistance measure. BMC bioinformatics, 8(1):111, 2007.
[7] S. Roy, D. Das, D. Choudhury, G. G. Gohain,R. Sharma, and D. K. Bhattacharyya. Causalityinference techniques for in-silico gene regulatory
network. In Mining Intelligence and KnowledgeExploration, pages 432–443. Springer, 2013.
[8] T. Schreiber. Measuring information transfer. Physicalreview letters, 85(2):461, 2000.
[9] J. A. Swets. Signal detection theory and ROC analysisin psychology and diagnostics: Collected papers.Psychology Press, 2014.
[10] Y. Yang and G. I. Webb. Discretization fornaive-bayes learning: managing discretization bias andvariance. Machine learning, 74(1):39–74, 2009.
[11] S. Zhang, G. Jin, X.-S. Zhang, and L. Chen.Discovering functions and revealing mechanisms atmolecular level from biological networks. Proteomics,7(16):2856–2869, 2007.