information systems and science for...
TRANSCRIPT

Information Systems and Science for Energy
School of Computer Science Colloquium S. Keshav
October 17, 2013

IPCC Report: 27 Sep 2013
! Warming of the climate system is unequivocal

Gasoline combustion
1 liter of gasoline = 2.27kg of CO2

Electricity generation > Transportation!
IPCC 2007

Today’s Electrical Grid
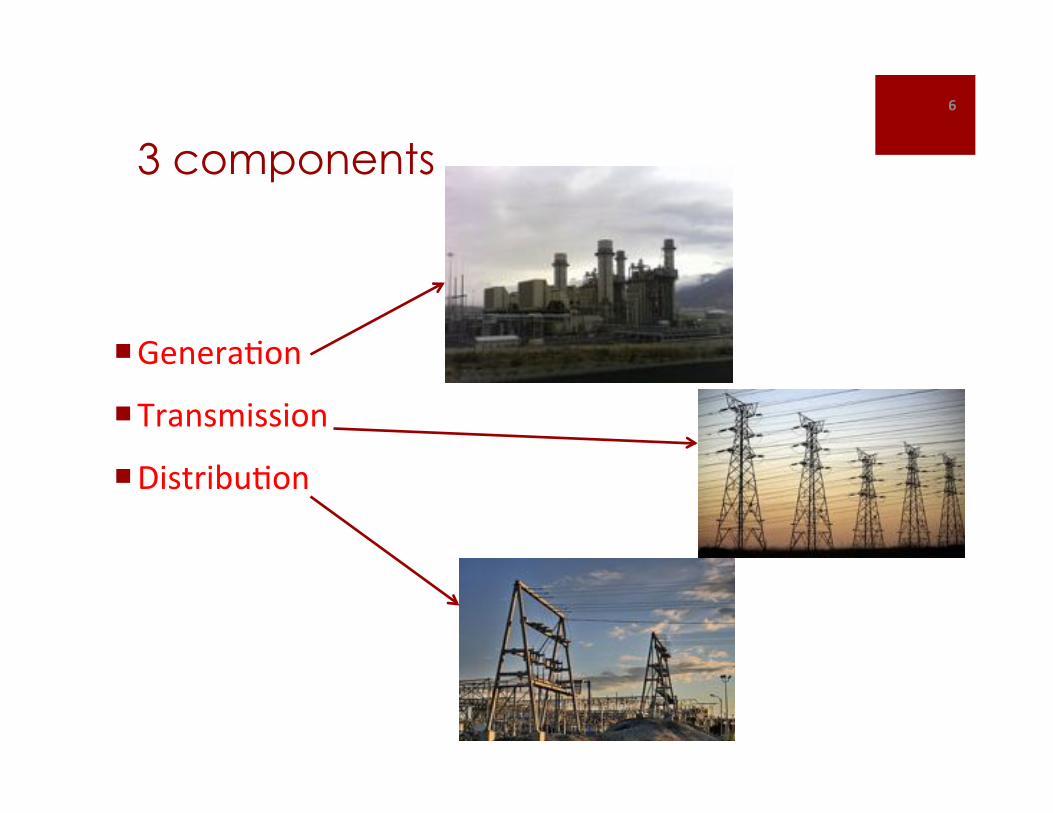
! !"#"$%&'#(
! )$%#*+,**,'#(
! -,*.$,/0&'#(((
!"
3 components

Howstuffworks.com

Grid characteristics

((
#"
1. Overprovisioned by design
capacity

2. Inefficient
5% better efficiency of US grid
= zero emission from 53 million cars
http://www.oe.energy.gov/

3. Aging
Post-war infrastructure is reaching EOL

4. Uneven
TWh generated
! China 4,938
! US 4,256
Daily W/capita (2012 est.)
395
1402
Wikipedia

5. Poorly measured

6. Poorly controlled
! Electrons are not addressible

7. Ridiculously cheap
Wikipedia

Technology is changing the grid

1. Wind
“Revolution Now,” US DOE Sept. 17. 2013
WIND POWER CENTS/KILOWATT-HOUR
INSTALLED CAPACITY (GW)

2. Solar
“Revolution Now,” US DOE Sept. 17. 2013
Module cost $/W Deployment MW

The future is here now!
! Wind and solar produced 60% of Germany’s electricity on October 3
Image: BCCONSULT
60%
3. Storage: the holy grail
! Global investment in energy storage technologies to reach $122 Billion by 2021: Pike Research
! Many new technologies ! Batteries
! Flywheels
! Supercapacitors
! Compressed air storage
…

4. Electric vehicles
! Spur research on lower-cost storage
! Huge consumers of electricity
Nissan Leaf chassis

5. Pervasive sensing
Michigan Micro Mote

6. Pervasive computation
Freescale KL02 microcontroller 1.9 mm x 2.0 mm

7. Pervasive communication
Trilliant Corp.

8. Pervasive control
Control 4’s EMS-100 in-home display

Current grid
! Decentralized
! Storage rich
! Renewables/low carbon
! Sensing rich
! Control rich
! Flexible
! Energy frugal
Centralized
Little to no storage
High carbon
Poorly measured
Poorly controlled
Ossified
Inefficient
“Smart” grid

OK, we’re done, right?

Maybe not…

1. Matching demand and supply
Barnhart et al, Proc. Energy and Environment, 6:2804, 2013

2. Storage is expensive
! Buying 1 KWh = 10c ! Storing 1 KWh = ~$450!
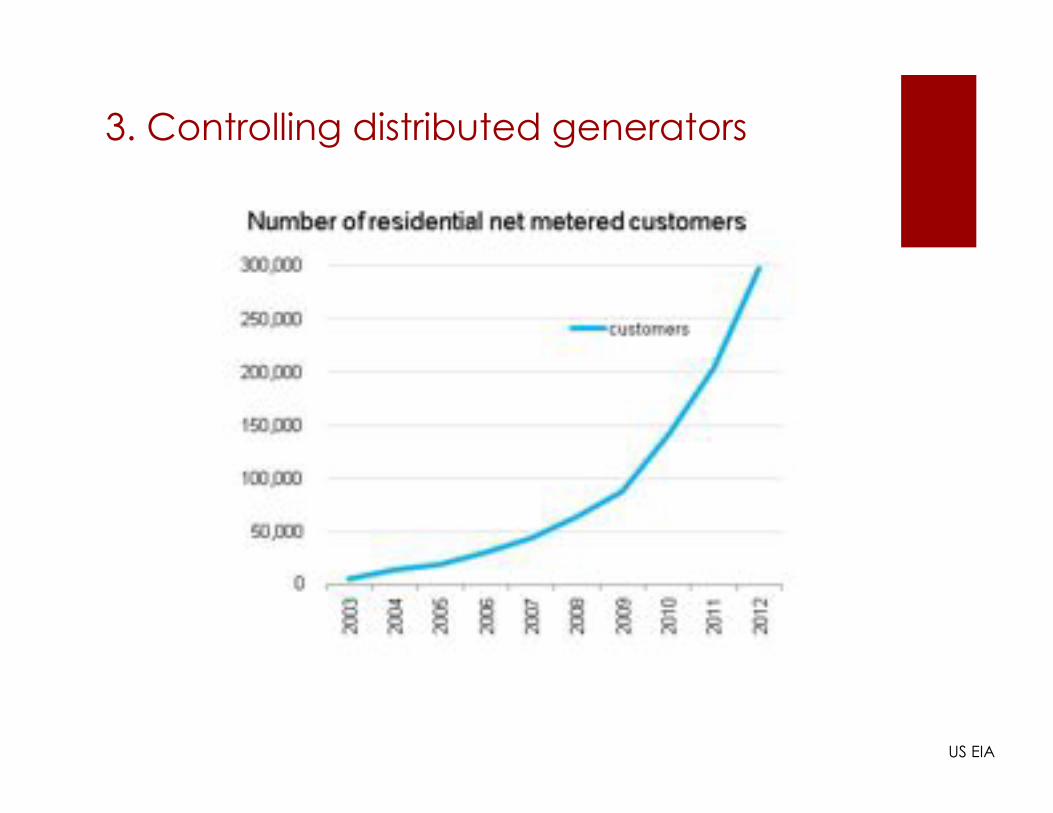
3. Controlling distributed generators
US EIA

4. Control over many time scales
Jeff Taft, Cisco

5. Communication is complex
Wid
e A
rea
Mon
itorin
g an
d C
ontro
l Sys
tem
(WA
MC
S) N
etw
orks
Conventional Wind Solar Storage
Internet
Distributed Energy Resources (DER)
(large scale)
Converged Voice, Data, and Video
Area ControlError (ACE)
Control
Virtual Power Plant (VPP)/Demand Response (DR)
Application
Reference Model
Trans-Regional Balancing Org.
Interchange Authority/Reliability Coordinator Grid Direct Current (DC) Inter-Ties Other Regions
Other Energy Traders
Utility EnergyTrading
UtilityNOC
• Customers• Suppliers• Retail Energy Providers (REP)• Third Parties
Third PartyStabilization
Services
Other TransmissionSystem Operators (TSO)/
Distribution System Operators (DSO) and Verticals
IndependentPower
Producers(IPP)
Other Region Phasor Measurement Unit
(PMU) Data
Other TSO PMU Data
Web Portals
Balancing Authority
VPP/DRApplication
ACEControl
Other Balancing Authorities
Trans-Regional Energy Markets
Wholesale Energy Markets
Trans-Regional/Trans-National TierTrans-Regional Networks
System Control TierInter-Substation Networks
Interchange TierInterchange Networks
Balancing TierControl Area Networks
Synchronous Grid Inter-Tie Control
WAMCS Network Operations Center (NOC)/
Data Center
Inter-Control Center NetworksEnterprise Networks Utility Tier
Intra-Control/Data Center Tier
AncillaryServices
VPP/DR Data/Signals
Control CenterNetwork
FieldDispatch
CallCenter
Control Center Control CenterControl CenterApplicationsand Users
EnterpriseApplicationsand Users
Control CenterNetwork
Data CenterData Center
Network
Transmission PMU Data
Substation Tier
D Level 1 Tier
D Level 2 Tier
Transmission Substation
Intra-Substation Networks
Sensor Networks
PhasorMeasurement
Unit (PMU)
Distribution Substation
Intra-Substation Networks
Sub-Transmission Substation
Intra-Substation Networks
Traction Substation
Intra-Substation Networks
Urban FANs Rural FANs
Sensor Networks
Electric Vehicle (EV)Sub-networks
Prosumer Tier
Third Party Aggregator of DR, Distributed
Generation (DG), etc.
FeederD-PMU
Nets
Sensors
Controls
Home Energy Controller
Controls
Displays
ChargerMeter
Inverter Control
Protection and Control
Inverter Control
Distribution PMU
Feeder
DistributeResourc
(large
Streetlight Systems
Line Sensor
Volt/ VAR Regulation
Fault Isolation and Service Restoration Nets
Sensor Subsystems
Inverter Control
DA Devices
DER Protection
Distribution Automation (DA) Sub-networks
Gateway
Transmission LevelStabilization
© 2011 Cisco and the Cisco Logo are trademarks of Cisco and/or its a!liates in the U.S. and other countries. A listing of Cisco’s trademarks can be found at www.cisco.com/go/trademarks. Third-party trademarks mentioned are the property of their respective owners. The use of the word partner does not imply a partnership relationship between Cisco and any other company. (1009R) C82-676734 6/11
Distribution LevelStabilization
(DSTATCOM)
Neighborhood Area Networks (NAN) (Residential, Commercial and Industrial)
Residential Networks Building Networks Private Microgrid Networks In-Vehicle Networks
In
D
Cisco

6. Consumers have no incentive to save
! Energy savings of 10% ! $10/month

7. Utilities have no incentive to save!


ISS4E
Mission
To use information systems and science to ! increase the efficiency ! reduce the carbon footprint
of energy systems

3 Approaches
1. Exploiting equivalency of grid and Internet*
2. Problem-oriented research
3. Data-driven research*
* novel

1. Grid = Internet
S. Keshav and C. Rosenberg, How Internet Concepts and Technologies Can Help Green and Smarten the Electrical Grid, CCR, January 2011.

Grid
Electrons
Load
Communication link
Battery/energy store
Demand response
Transmission network
Distribution network
Stochastic generator
Internet
= Bits
= Source
= Transmission line
= Buffer
= Congestion control
= Tier 1 ISP
= Tier 2/3 ISP
= Variable bit rate source
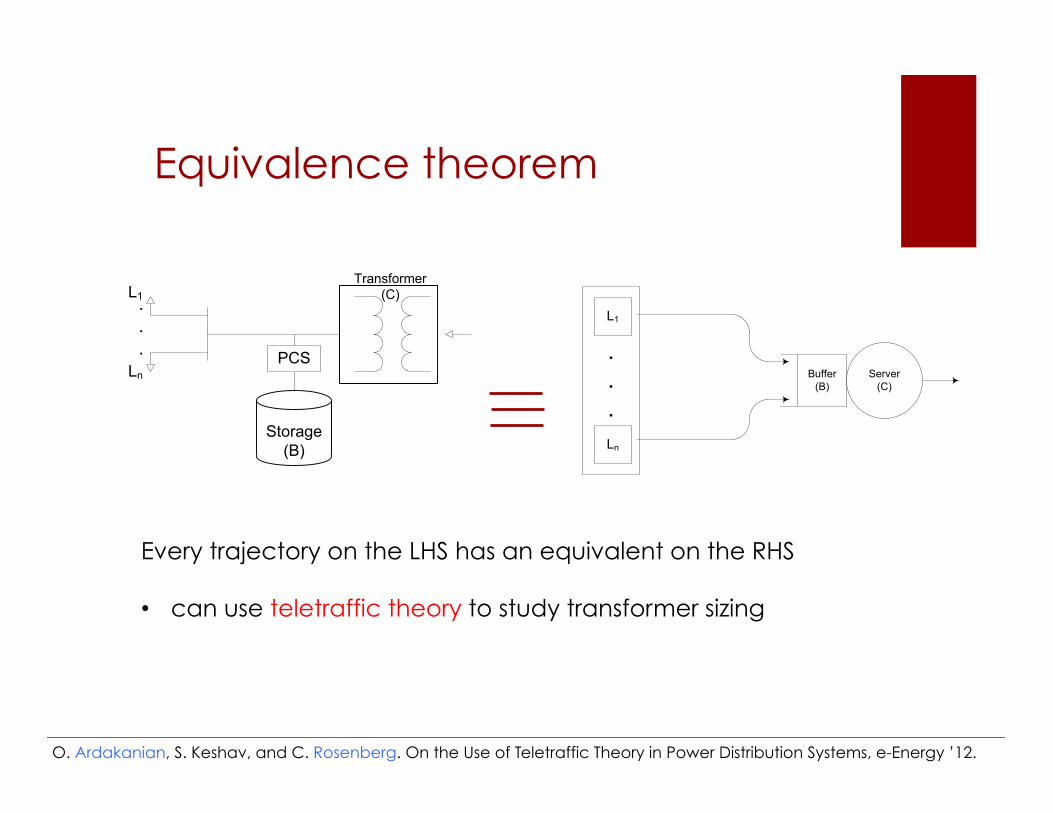
Equivalence theorem
Server(C)
L1
Ln
Buffer (B)
Storage(B)
L1
Ln
.
.
.
Transformer (C)
PCS
Every trajectory on the LHS has an equivalent on the RHS • can use teletraffic theory to study transformer sizing
O. Ardakanian, S. Keshav, and C. Rosenberg.!On the Use of Teletraffic Theory in Power Distribution Systems, e-Energy ’12.

A. Guidelines for transformer sizing
HydroOne’s guidelines
Prediction from teletraffic theory
O. Ardakanian, S. Keshav, and C. Rosenberg.!On the Use of Teletraffic Theory in Power Distribution Systems, e-Energy ’12.
Can also quantify impact of storage

!"#$%&'("%)'*+,'-.+"/%0123"*+'12%012+,1$%41,%5$"6+,'6#$%7"8'6$"%08#,3'23%
9(#,+%:,'/%;,68'+"6+.,"%%
<%
O. Ardakanian, C. Rosenberg and, S. Keshav, “Distributed Control of Electric Vehicle Charging”. e-Energy ’13
B. TCP for EV charging
! 1 EV = 5 homes ! Creates hotspots
! Real-time AIMD control of EV charging rate
! Solution is both fair and efficient

C. Matching supply and demand

“Rainbarrel” model
uncontrolled stochastic input
uncontrolled stochastic output
range What barrel size to avoid overflow and underflow “with high probability”?

Envelope idea
lower envelope " Σinput " upper envelope
lower envelope " Σ output " upper envelope
Envelopes are computed from a dataset of trajectories
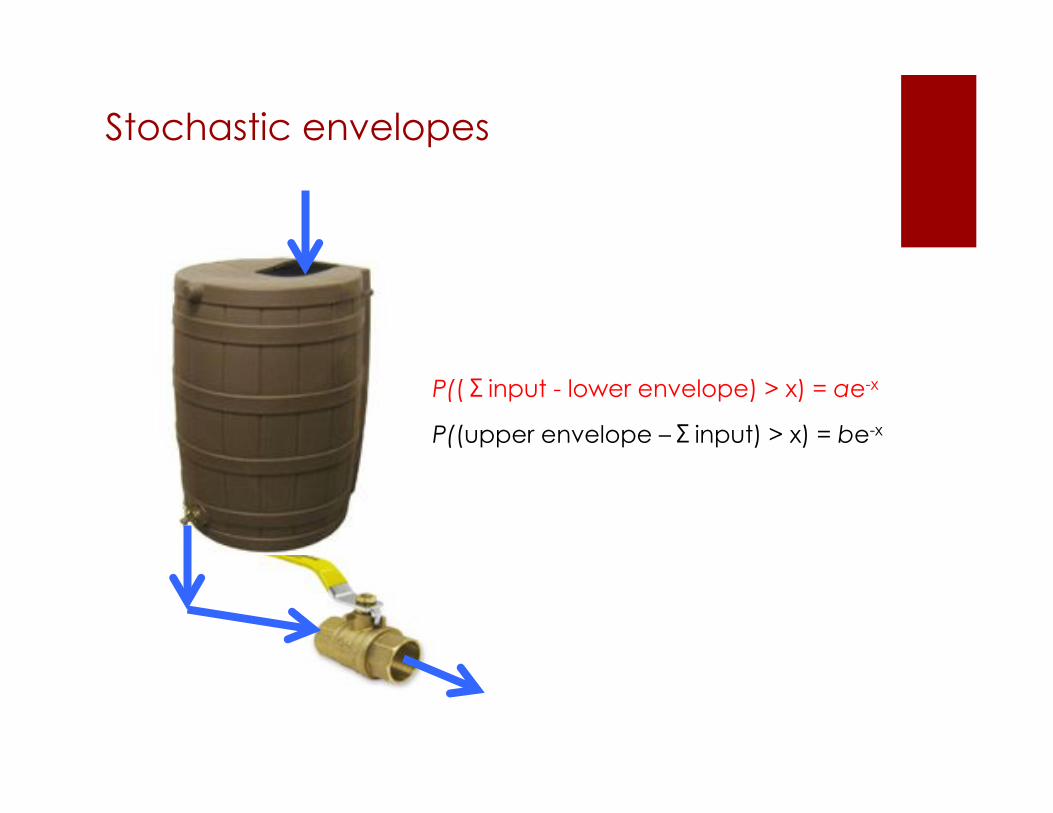
Stochastic envelopes
P((Σinput - lower envelope) > x) = ae-x
P((upper envelope –Σinput) > x) = be-x

Stochastic network calculus
Equivalence
Wang, Kai, et al. "A stochastic power network calculus for integrating renewable energy sources into the power grid.” Selected Areas in Communications, IEEE Journal on 30.6 (2012): 1037-1048.

Analytic results
! Minimizing storage size to smooth solar/wind sources
! Optimal participation of a solar or wind farm in day-ahead energy markets*
! Modeling of imperfect storage devices*
! Optimal operation of diesel generators to deal with power cuts in developing countries*
Joint work with Y. Ghiassi-Farrokhfal, S. Singla, and C. Rosenberg

2. Problem-oriented research
Problem formulation
Modeling
Analysis
Design
Implementation
Evaluation ! Data
Increase efficiency, reduce carbon footprint
! Optimization ! Queueing theory ! Network calculus ! Control theory ! Network flow ! Algorithms
! New technologies ! Storage ! EVs ! Pervasive computation,
sensing ! Renewable generation

Smart Personal Thermal Comfort
Reduce building energy use with fine-grained thermal control of individual offices
P.X. Gao and S. Keshav, Optimal Personal Comfort Management Using SPOT+, Proc. BuildSys Workshop, 2013. P. X. Gao and S. Keshav, SPOT: A Smart Personalized Office Thermal Control System, Proc. ACM e-Energy 2013, May 2013.

Our insight
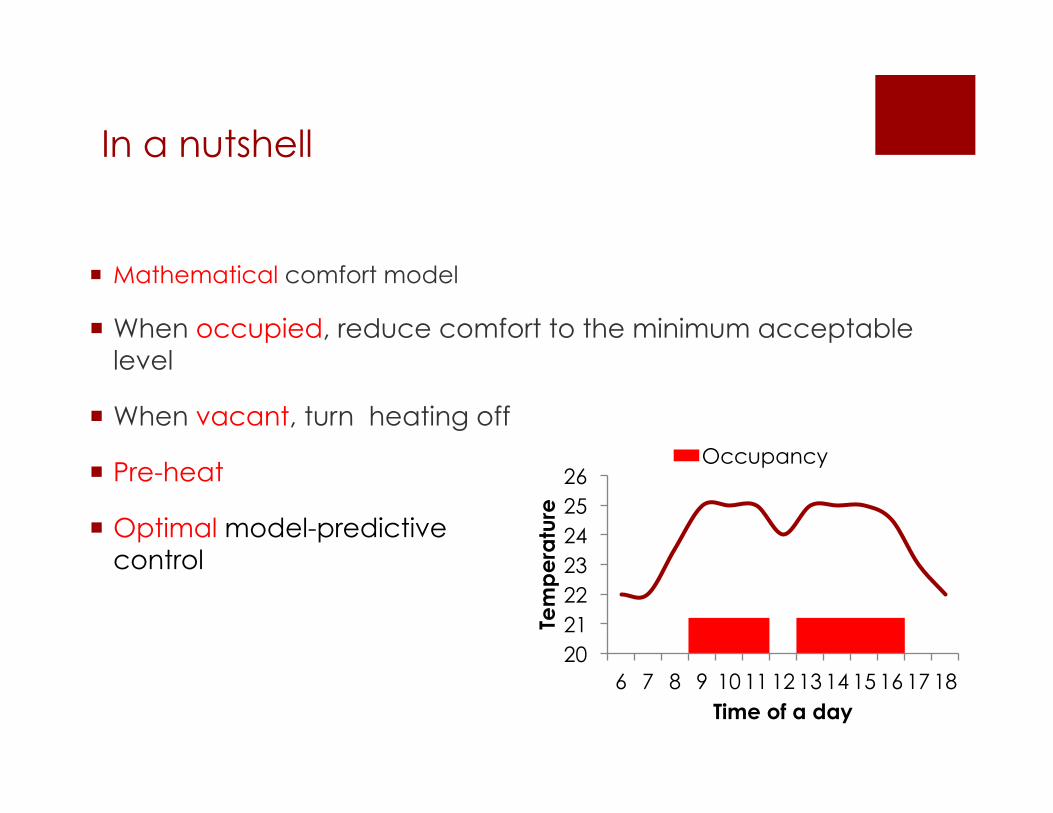
In a nutshell
! Mathematical comfort model
! When occupied, reduce comfort to the minimum acceptable level
! When vacant, turn heating off
! Pre-heat
! Optimal model-predictive control
20 21 22 23 24 25 26
6 7 8 9 10 11 12 13 14 15 16 17 18
Tem
pe
ratu
re
Time of a day
Occupancy

New technology: sensing
Microsoft Kinect
51(,#2$%$"3(*"#*'$ Servos
901(,#2$%$"3(*"#*'$
Weatherduck *"#*'$ Microcontroller

Evaluation: clothing level estimation
! Root mean square error (RMSE) = 0.0918
! Linear correlation = 0.92

New technology: data mining for occupancy prediction
! Predict occupancy using historical data
Match previous similar history
Predict using matched records
0 .3 1 1 1 .3

Comparision of schemes
!
"
#!
#"
$!
$"
!%& !%" !%' !%( !%) !%*
!"#$%&#'(%
)*+',-#
$&+'./012'
!"#$%&#'!345*67#'889'
+,-./012./34./5.617,8.9:.;<5.617,8.9==>?<7,;64
Discomfort

3. Data-driven research
Obtain dataset
Problem formulation
Analysis
Insights
Difficult!
! Data mining ! Machine learning ! Big data analytics ! What-if analysis ! Simulation
! Effect of new technologies ! Storage ! EVs ! Pervasive computation ! Renewable generation
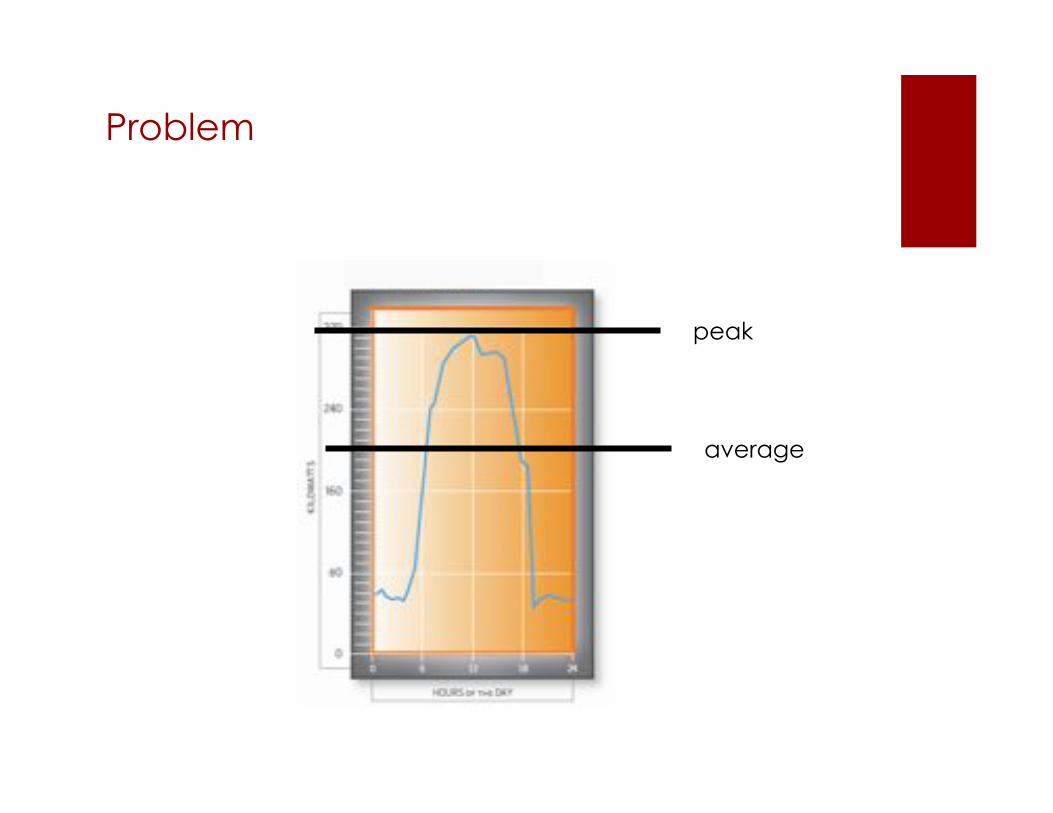
Problem
peak
average
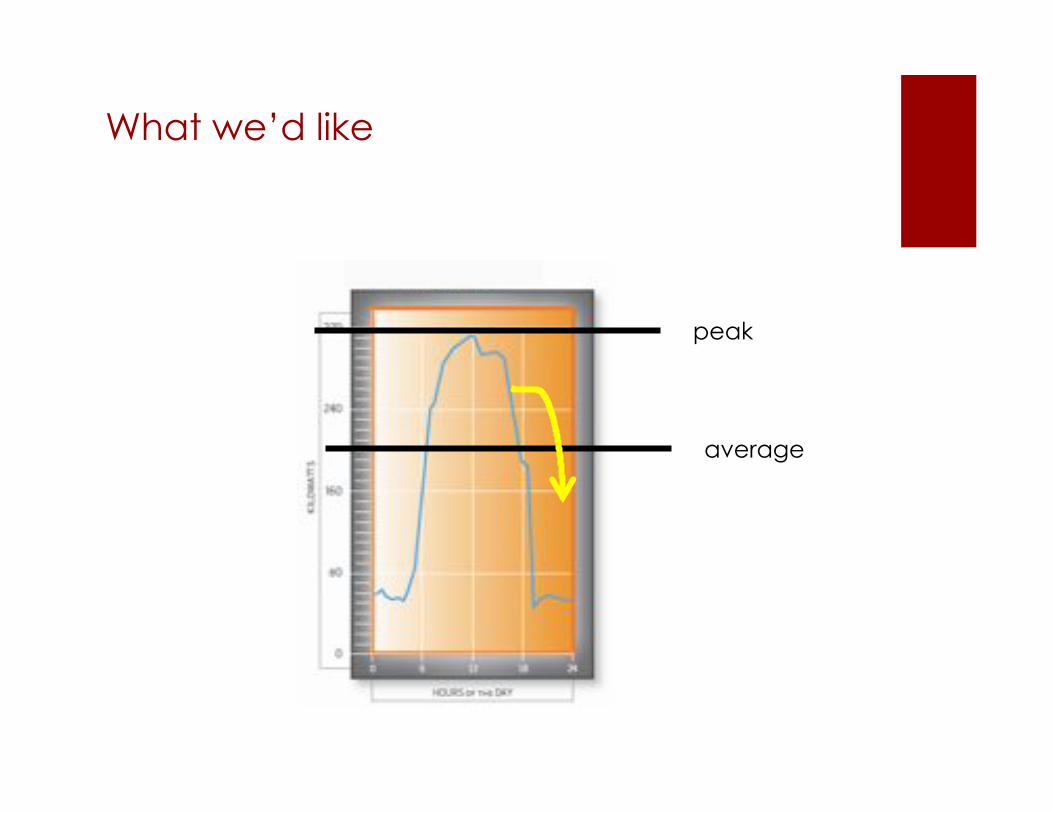
What we’d like
peak
average

New technology
! ~5 million ‘smart meters’ installed in Ontario

Ontario Time-Of-Use (TOU) Scheme
peak mid-peak off-peak

Questions
! Is 2 the right number of seasons?
! Should they be 6 months long?
! Do they start at the right times?
! Do peak times correspond to load peaks?
! Does the scheme reduce peak loads?
A. Adepetu, E. Rezaei, D. Lizotte, and S. Keshav!Critiquing Time-Of-Use Pricing in Ontario, IEEE SmartGridComm Symposium 2013, Vancouver, October 2013.

Dataset
! Aggregate hourly energy use in Ontario for the last 10 years
Aggregate Ontario load for the first two weeks of May over 4 years
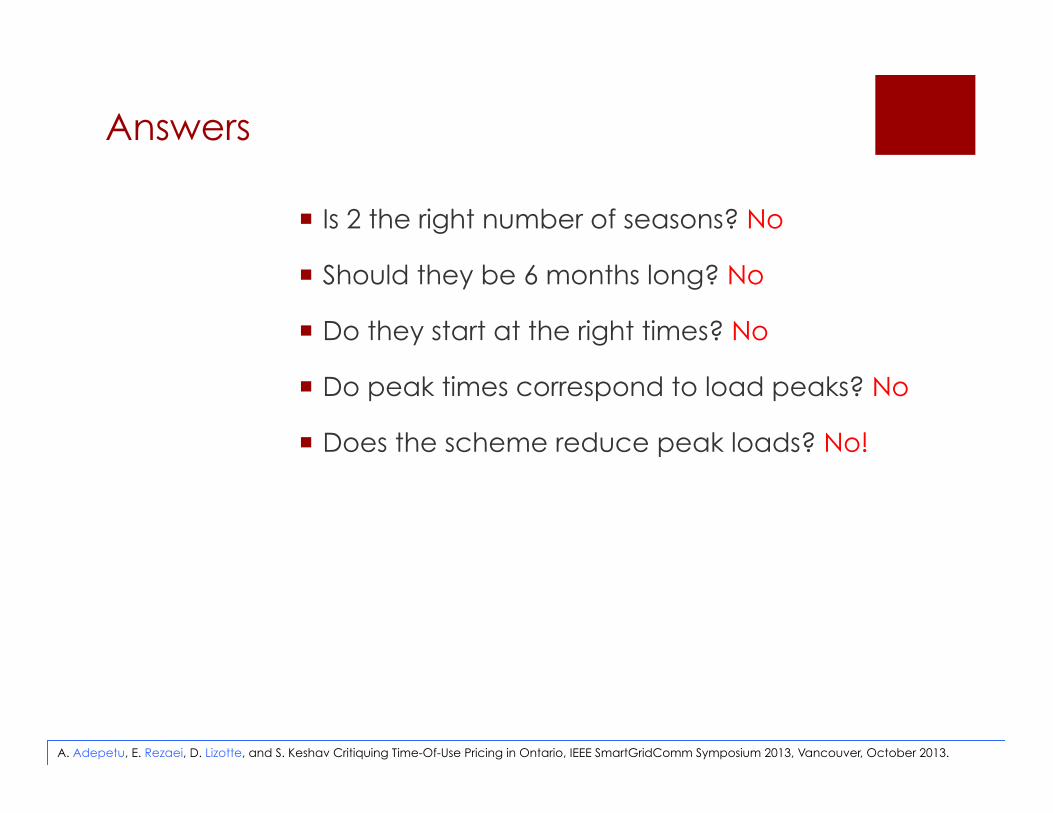
Answers
! Is 2 the right number of seasons? No
! Should they be 6 months long? No
! Do they start at the right times? No
! Do peak times correspond to load peaks? No
! Does the scheme reduce peak loads? No!
A. Adepetu, E. Rezaei, D. Lizotte, and S. Keshav!Critiquing Time-Of-Use Pricing in Ontario, IEEE SmartGridComm Symposium 2013, Vancouver, October 2013.

A better scheme
Summer
Fall
Winter
Spring
4 seasons
A. Adepetu, E. Rezaei, D. Lizotte, and S. Keshav!Critiquing Time-Of-Use Pricing in Ontario, IEEE SmartGridComm Symposium 2013, Vancouver, October 2013.

Other datasets
! Hourly electrical load from 26,000 homes in Ontario
! Hourly electrical load from 5,000 homes in Ireland
! Hourly water usage from 27,000 homes in Abbotsford
! Per-appliance energy use for ~500 appliances
! 50 commercial buildings’ energy use over 2-4 years (Pulse)
! 500 taxi driving records for 1 month (Cabspotting)
! 7 years of car rental records (Grand River Carshare)
! Hourly electricity prices and use for 10 years (IESO)
! Solar and wind production over 10 years (NREL)
! Weather records (Ontario)

Reflections on the research area

Energy research
Pros ! Rapidly growing research
area
! Many open problems
! Industry interest and support
! Motivated students
! Potential for impact
Cons ! Requires learning new
concepts and ideas
! Entrenched interests
! Difficult to obtain data
! Field trials nearly impossible

Many open research problems
! Renewable integration
! Multi-level control
! Non-cash incentive design for consumers
! Energy efficiency policies for utilities
! Storage size minimization in energy systems
! Incentives for EV adoption
! Data mining of energy data sets
! Peak load reduction
! HCI for energy applications
! Data center energy minimization
! Microgrid/nanogrid design
! Building energy use monitoring and reduction

Join us!
! ISS4E mailing list
! ISS4E seminar series starting October 2013 ! next speaker: Pascal van Hentenryck, 4pm on
Oct. 24th
! Open weekly group meetings, 10:30-11:30 on Wednesdays in DC 1331

Conclusions
! Technology is changing the grid
! Computer Science has a role to play
! Opportunity for interesting, impactful research

Acknowledgements

ISS4E Faculty
Co-Director
Affiliated faculty
Co-authors
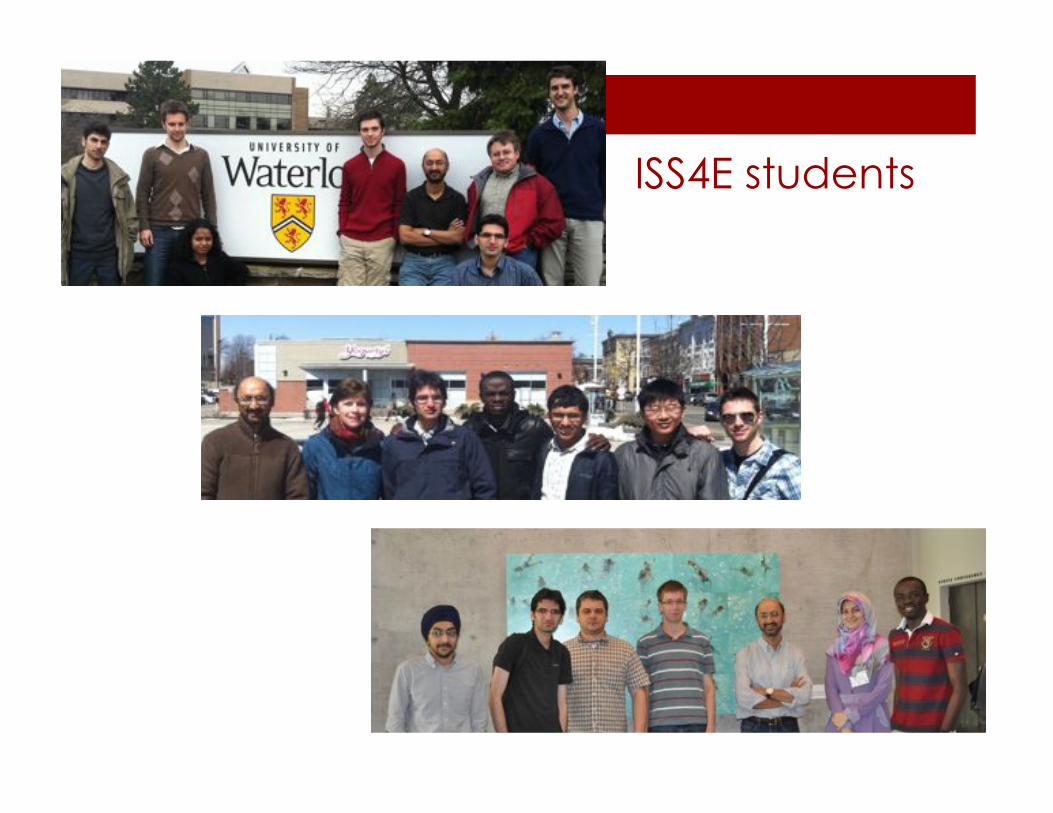
ISS4E students

WISE
! Prof. Jatin Nathwani (Executive Director)
! Tracey Forrest (Director)
! Prof. Claudio Canizares (ECE)
! Prof. Kankar Bhattacharya (ECE)

Funding agencies

Corporate sponsors

Our next project

Backup slides

What kills birds?
! According to Environment Canada ! Wind turbines: 16,700
! High-rise buildings: 64,000
! Single family homes and low-rises: 22,000,000
! Cats: 196,000,000
http://metronews.ca/news/canada/811474/cats-blamed-for-70-of-bird-deaths-in-canada-study/

Impacts
! Physical ! Extreme weather
! Ocean acidification
! Sea level rise
! Ocean currents
! Social ! Food supply
! Water availability
! Health
! Ecological ! Species loss
! Migration
Wikipedia

Carbon emitters
Wikipedia

Top emitters
Wikipedia

Per capita carbon emissions
WorldBank

Renewable energy

Pervasive communication
Trilliant Corp.


Storage
“Bytes”
“Bits/s”

Solar SSPE
! Model stochastic sources (solar, wind) and stochastic loads using Markov models or stochastic sample path envelopes
1 2 3 4 5 6 7 80
1000
2000
3000
4000
5000
6000
7000
8000
time (hour)
I g(t) (W
h/m
2 )
sample pathProbabsilitic envelopeMean rate envelopeBound on samples

Pervasive communication

Carbon from gasoline combustion
! 2C8H18 + 25O2 -> 16CO2 + 18H20 C9H20 + 14O2 -> 9CO2 + 10H20 2C10H22 + 31O2 -> 20CO2 + 22H20 C11H24 + 17O2 -> 11CO2 + 12H20 2C6H6 + 15O2 -> 12CO2 + 6H20 C7H8 + 9O2 -> 7CO2 + 4H20 4C8H7 + 39O2 -> 32CO2 + 7H20 2C8H10 + 21O2 -> 16CO2 + 10H2O
! 1 liter of gasoline (~800g) produces 2.27kg of CO2

Ontario Time-Of-Use (TOU) Scheme 94

Publication venues Conferences and
workshops ! eEnergy
! SmartGridComm
! Buildsys
! GreenMetrics
! ACM Sustainability
! AAAI: Sustainability track
! AAMAS
Journals
! IEEE Trans. Smart Grid
! IEEE PES magazine
! Energy and Buildings
! J. Solar Power
! J. Power Sources
! Transportation