information security risk assessment methodologies in vulnerability assessment … · information...
TRANSCRIPT

Master Thesis
Information Security Risk Assessment Methodologies in
Vulnerability Assessment of Information Systems
Aliaksandr Astafyeu
Technical University of Denmark
November 20, 2015

2

3
Abstract
FortConsult A/S performs so called penetration tests (pentests) within clients' organizations to
find possible ways that attackers could follow to affect the organizations' assets.
Currently, FortConsult uses a modification of the risk assessment model called DREAD to classify
vulnerabilities identified during pentests. This classification provides clients with information
about the priority of vulnerabilities (e.g. critical, high, middle, low), allowing them to understand
which of vulnerabilities they have to care of first.
This project has several goals:
To analyze the use of the DREAD model, particularly it's advantages and disadvantages,
and provide practical examples of its efficiency. This analysis should also examine
different fields of application, such as wireless tests, web app tests, internal infrastructure
tests, denial of service tests, etc.
To study the current implementation of the DREAD model within FortConsult and
determine how it fits the company's needs. This means to perform an analysis of data
taken from the previous and current pentests. As a result, we must answer if the DREAD
model results are appropriately related to the real issues of the clients' organizations, for
example if it helps reduce their costs of information security etc. It will help to understand
the strengths and weaknesses of the current implementation of DREAD.
Using the collected data and the experience gained from analyzing the DREAD model, we
are going to study existing risks assessment models to determine if there is one which
better fits the company's needs.
The project should determine whether the existing implementation of DREAD model may be
adjusted and improved. After comparing all the appropriate models, FortConsult may decide to
test and integrate other model for their purposes.
The proposed analysis will be performed within a particular company, but the expected results
may have more general applications, such as a general approach for measuring the efficiency of
information security risks assessment models.

4

5
Preface
This thesis project is the final part of my studies at the MSc in Computer Science and Engineering
program at the Technical University of Denmark.
The project was performed under supervision of Christian Damsgaard Jensen, Associate Professor
at the Department of Applied Mathematics and Computer Science of the Technical University of
Denmark, in collaboration with FortConsult A/S, the company well-known worldwide for
providing the service of Information Security Testing.
The topics of the thesis was proposed by FortConsult A/S and arises from the need of the
company to analyze the model that they currently use, to be able to make a decision if they have
to consider implementation of another model.

6

7
Acknowledgements
I want to thank my supervisor Prof. Christian Damsgaard Jensen for his academic support,
important advices and for keeping my mind process within the scope of the project.
I am also thankful to FortConsult A/S for the interesting topic of the project, and their team for
good atmosphere and their expertise in the field of Information Security Testing and
Vulnerabilities Analysis.

8

9
Table of content
Abstract .............................................................................................................................................. 3
Preface ............................................................................................................................................... 5
Acknowledgements ............................................................................................................................ 7
Table of content ................................................................................................................................. 9
List of Figures ................................................................................................................................... 13
List of Tables ..................................................................................................................................... 15
List of formulas and equations ......................................................................................................... 17
Introduction ..................................................................................................................................... 19
Scope, assumptions and limitations ............................................................................................. 20
Setting up definitions ....................................................................................................................... 21
What is Information Security Testing? ......................................................................................... 21
What is Risk and Risk Assessment? .............................................................................................. 21
The place of Risk Assessment in Information Security Risk Management .................................. 23
Information Security Risk management in ISO/IEC 27001:2013, ISO/IEC 27005:2011, ISO
31000:2009 .............................................................................................................................. 23
Information Security Risk Management in NIST 800-39 .......................................................... 24
Models for analysis .......................................................................................................................... 25
Description of the MS DREAD model ........................................................................................... 25
MS1 model ............................................................................................................................... 25
MS2 model ............................................................................................................................... 27
Description of the FC model ......................................................................................................... 29
Risk Estimation ......................................................................................................................... 29
Exploitability ............................................................................................................................. 31
Risk evaluation ......................................................................................................................... 32
The OWASP Risk Rating Methodology ......................................................................................... 32
Identifying a Risk (Step 1) ......................................................................................................... 32
Factors for Estimating Likelihood (Step 2) ............................................................................... 33
Factors for Estimating Impact (Step 3) ..................................................................................... 33
Determining Severity of the Risk (Step 4) ................................................................................ 33
Deciding What to Fix (Step 5) ................................................................................................... 34
Customizing Your Risk Rating Model (Step 6) .......................................................................... 35
Common Vulnerability Scoring System (CVSS) ............................................................................. 35
CVSS v2 ..................................................................................................................................... 36
CVSS v3 ..................................................................................................................................... 37
OCTAVE Allegro ............................................................................................................................ 37
10
Explanation about choice of the models ...................................................................................... 39
What is Target Model? ................................................................................................................. 39
Analysis of the models ..................................................................................................................... 41
The difference between implemented FC model and original MS DREAD model ....................... 41
The need to change the FC model ............................................................................................... 42
Analysis of the MS DREAD model ................................................................................................. 43
MS1 model ............................................................................................................................... 43
MS2 model ............................................................................................................................... 43
Deeper explanation of FC model and its analysis ........................................................................ 44
Damage Potential ..................................................................................................................... 44
Affected users or systems ........................................................................................................ 45
Reproducibility ......................................................................................................................... 46
Exploitability ............................................................................................................................. 47
Discoverability .......................................................................................................................... 47
Examples of uncertainty in the model ..................................................................................... 48
Combinatorial analysis of the models .......................................................................................... 48
MS1 model ............................................................................................................................... 48
Risk Severity distribution in OWASP-R ..................................................................................... 49
Theoretical combinatorial distribution of Risk Level in the FC model ..................................... 53
FC and FC1 model ..................................................................................................................... 55
CVSS v2 ..................................................................................................................................... 57
CVSS v3 ..................................................................................................................................... 58
Conclusion to combinatorial analysis ........................................................................................... 60
Statistical analysis ........................................................................................................................ 60
CVSS v2 ..................................................................................................................................... 60
CVSS v3 ..................................................................................................................................... 61
FC model ................................................................................................................................... 61
Conclusion about statistical analysis ........................................................................................ 64
OCTAVE Allegro ............................................................................................................................ 64
Methodology for risk assessment models comparison ................................................................... 64
One approach: .............................................................................................................................. 64
Second approach .......................................................................................................................... 64
Risk assessment models criteria ...................................................................................................... 64
Efforts needed to implement the model ..................................................................................... 65
Absolute criteria ........................................................................................................................... 65

11
Definitions and formalization ................................................................................................... 65
Risk perception and subjectivity .............................................................................................. 65
Distribution quality ................................................................................................................... 66
Rating appropriateness (Adequacy) ......................................................................................... 66
Results comparability ............................................................................................................... 66
Efficiency without a tool .......................................................................................................... 66
Efficiency with a tool ................................................................................................................ 67
Understandable for customers ................................................................................................ 67
Trustworthiness........................................................................................................................ 67
Flexibility .................................................................................................................................. 67
(Official tool) Tool feasibility .................................................................................................... 68
Relative criteria ............................................................................................................................ 68
Other criteria and properties ....................................................................................................... 68
Properties of Target Model .............................................................................................................. 70
FC Target Model ........................................................................................................................... 70
Desired Target Model ................................................................................................................... 70
Situational importance of Criteria .................................................................................................... 70
Criteria applied to the models ......................................................................................................... 71
Evaluation method for Risk Assessment models ............................................................................. 74
Absolute evaluation ..................................................................................................................... 74
Relative (situational) evaluation .................................................................................................. 74
Method 1 .................................................................................................................................. 74
Method 2 .................................................................................................................................. 74
Examples of changes to the FC model ............................................................................................. 79
FC1 model..................................................................................................................................... 79
Conclusion ........................................................................................................................................ 80
Further directions of work ............................................................................................................... 81
List of references .............................................................................................................................. 82
Appendix A ....................................................................................................................................... 85
Appendix B. Glossary ........................................................................................................................ 87
Appendix C. Abbreviations ............................................................................................................... 90
Appendix D. Generalized risk sub-components ............................................................................... 91

12
13
List of Figures
Figure 1. Relationships between the risk management principles, framework and process. From
[ISO 31000:2009] .............................................................................................................................. 23
Figure 2. Relationships between the risk management principles, framework and process. From
[NIST SP 800-39] ............................................................................................................................... 24
Figure 3. Combinatorial analysis of MS1 model ............................................................................... 49
Figure 4. Histogram for combinatorial distribution of Risk Severity in OWASP-R model combined
by Severity Levels ............................................................................................................................. 51
Figure 5. Histogram for amounts of values Impact * Likelihood ..................................................... 52
Figure 6. Histogram for number of combinations of sub-factors for different values of Risk_DREAD
.......................................................................................................................................................... 55
Figure 7. Histogram for number of combinations of sub-factors separately for different values of
Impact and Likelihood ...................................................................................................................... 56
Figure 8. ............................................................................................................................................ 57
Figure 9. Histogram for combinatorial number of Base Score values ............................................. 57
Figure 10. Number of Base Scores values aggregated by Risk Levels in CVSS v2 ............................ 58
Figure 11. Histogram for combinatorial number of Base Score values ........................................... 59
Figure 12. Number of Base Scores values aggregated by Risk Levels in CVSS v3 ............................ 59
Figure 13. Distribution of CVSS Scores ............................................................................................. 61
Figure 14. Distribution of values for each risk sub-component in selection for FC model .............. 62
Figure 15. The comparison between amount of different values of Impact and Likelihood in the
selection ........................................................................................................................................... 63
Figure 16. Distributions of Impact and Likelihood derived from the selection ............................... 63

14

15
List of Tables
Table 1. Mackman et al. [1] Threat Rating Table. ............................................................................ 26
Table 2. MS1 model – properties for different values of sub-factors. ............................................. 27
Table 3. MS2 model risk sub-components description .................................................................... 28
Table 4. Damage Potential (Da) ....................................................................................................... 30
Table 5. Affected users or systems (A) ............................................................................................. 30
Table 6. Reproducibility (R) in FC model .......................................................................................... 30
Table 7. Exploitability (E) .................................................................................................................. 31
Table 8. Discoverability (Di) .............................................................................................................. 31
Table 9. FC model Risk Evaluation Table .......................................................................................... 32
Table 10. Factors for Estimating Likelihood ..................................................................................... 33
Table 11. Factors for Estimating Impact .......................................................................................... 33
Table 12. Qualitative scale for Likelihood and Impact values in OWASP-R ..................................... 34
Table 13. Risk Matrix in OWASP-R ................................................................................................... 34
Table 14. CVSS v3 Base Metric Group .............................................................................................. 36
Table 15. Damage Potential ............................................................................................................. 44
Table 16. Affected users or systems ................................................................................................ 45
Table 17. Reproducibility.................................................................................................................. 46
Table 18. Exploitability ..................................................................................................................... 47
Table 19. Discoverability .................................................................................................................. 47
Table 20. Impact distribution ........................................................................................................... 49
Table 21. Likelihood distribution ...................................................................................................... 50
Table 22. Combinatorial distribution of Risk Severity in OWASP-R model in Risk Matrix ............... 50
Table 23. Combinatorial distribution of Risk Severity in OWASP-R model combined by Severity
Levels ................................................................................................................................................ 51
Table 24. ........................................................................................................................................... 51
Table 25. ........................................................................................................................................... 52
Table 26. ........................................................................................................................................... 52
Table 27. ........................................................................................................................................... 53
Table 28. ........................................................................................................................................... 53
Table 29. ........................................................................................................................................... 54
Table 30. ........................................................................................................................................... 54
Table 31. ........................................................................................................................................... 54
Table 32. Amount of mathematical operations in models .............................................................. 67
Table 33. ........................................................................................................................................... 70
Table 34. ........................................................................................................................................... 71
Table . ............................................................................................................................................... 73
Table ................................................................................................................................................. 74
Table xx. Values of properties according to criteria. ....................................................................... 76
First line of this table shows the FC weights of criteria. .................................................................. 76
Table xx. Rating components for FC weights ................................................................................... 77
Table ................................................................................................................................................. 79
Table ................................................................................................................................................. 85
Table ................................................................................................................................................. 85
Table ................................................................................................................................................. 86
Table ................................................................................................................................................. 92

16
Table ................................................................................................................................................. 93

17
List of formulas and equations
(1) ..................................................................................................................................................... 25
(2) ..................................................................................................................................................... 27
(3) ..................................................................................................................................................... 28
(4) ..................................................................................................................................................... 29
(5) ..................................................................................................................................................... 29
(6) ..................................................................................................................................................... 29
(7) ..................................................................................................................................................... 29
(8) ..................................................................................................................................................... 34
(9) ..................................................................................................................................................... 36
(10) ................................................................................................................................................... 36
(11) ................................................................................................................................................... 37
(12) ................................................................................................................................................... 42

18
19
Introduction
Information Security Testing process usually includes Risk Assessment step, results of which can
make it much easier to finally prioritize the found vulnerabilities and make a decision which of
them to fix first, second etc.
The main attention of this project was at the model that the company FortConsult A/S uses for
Risk Assessment, which was created on the ground of well-known Microsoft DREAD model.
The need of this project came from the several needs, some of them are the explicit needs of
FortConsult, and others appeared at the initial stage of the project when its scope was defined:
To explain the model currently used by FortConsult for Risk Assessment, which is based
on the MS DREAD model, but with changes which are not broadly described or proven;
To analyze the FC model and to find grounds to make an evaluation of it. The company
needs some kind of proof of the correctness and appropriateness of their model;
To describe and make a comparison of different risk assessment models, which can be
used for different purposes, e.g. for building of set of criteria for desired risk assessment
model;
To develop a new improved model according to the criteria which also have to be
developed and formulated;
To build a method for comparison and evaluation of different risk assessment models.
This document consists of main parts:
Brief description of the set of definitions that we have combined;
Explanation of the models that will be used for analysis and comparison;
Description of the results of the analysis of risk assessment models;
Description of the set of Criteria and the methods of application of it for evaluation of risk
assessment models;
Analysis of different risk sub-components used in different models and outlining an
approach of using it for creation of risk assessment models appropriate for the certain
conditions.
Typical vulnerability report from FortConsult is structured in the way when found vulnerabilities
are described following the descending order by the Risk Level (from Very High to Low) and Risk
Value. The intention was to demonstrate first the vulnerabilities with higher risk, and to take into
account more carefully those vulnerabilities which appear first. This is usually done with the
vulnerabilities ratings, and this is also a reason why the appropriate score of vulnerabilities is
important.

20
FortConsult needs to be sure that the risk assessment model they use has the certain properties,
including properties of the scoring it produces. We will come to the explanation of these
properties with the help of Criteria which we have developed.
Scope, assumptions and limitations
We mainly consider Information Security Risk Assessment, which we may sometimes call just Risk
Assessment, as a part of Information Security Testing and Information Security Risk Management.
In addition, the main focus of ours is specifically on Risk Assessment of vulnerabilities of
Information Security Systems.
We are not going to improve or somehow develop the vulnerabilities analysis methodology that
company uses, but we consider the list of vulnerabilities as an input, which we need to evaluate.
In other words, among the three phases/areas of risk assessment (in terms of ISO 31000:2009
[41]) the risk identification phase is considered as have been performed by security evaluator, and
the outcome of this phase is the list of found vulnerabilities. But the risk analysis and risk
evaluation steps have to be performed to, among other, provide appropriate scoring of found
vulnerabilities.
The risk assessment model that FortConsult uses also is considered as an input to the phases of
analysis and evaluation of the risk assessment models.
In the terms of Threat Analysis we can assume that Threat Identification lies outside the scope of
this project, therefore we do not mention Threat Modeling a lot.

21
Setting up definitions
We are going to work with very different methodologies, some of them do not even have well
described definitions set. To prevent getting tangled, we need to agree on certain understanding
of terms that we are going to use.
We have combined a set of definitions from different standards, which supposed to be sufficient
for our project. We also put efforts to check that these definition set is noncontradictory. It is
provided in the Appendix B.
In this chapter we will discuss the most important of terms.
What is Information Security Testing?
Information Security Testing service provided by FortConsult is based on the standard NIST Special
Publication 800-115 [NIST SP 800-115]. According to it Information Security Testing is “The
process of validating the effective implementation of security controls for information systems and
networks, based on the organization’s security requirements.”
One of the steps during creation of report with vulnerabilities is to provide a score for each
vulnerability and, if possible, the ranking of the set of found vulnerabilities, for example
categorizing vulnerabilities by Risk Levels.
But, the analysis of the process of Information Security Testing is out of the scope of this project,
despite there are such interesting questions about it as Immediate Mitigation, which also might
be connected to the research of the properties of risk assessment models. How should
vulnerability evaluator react if the model provides the highest Risk Value possible? For example, it
might require from evaluator to inform client’s responsible persons immediately. On the one
hand we leave the decision of action for that to the evaluator’s company. On the other hand, such
action may depend a lot on the model used for Risk Assessment. For example, as we will see later,
the highest possible value in CVSS v2 appears relatively often, in comparison to FC model, for
which in the given selection were no one vulnerability with the highest Risk Level. It means that
the highest Risk Value for FC model could indicate the more critical vulnerability than another
vulnerability with the highest score in CVSS v2, and therefore the actions for Immediate
Mitigation for these two models might be different.
So, even leaving such issues on the FortConsult’s Delivery Model, which describes interaction with
customers about results of the Information Security Testing service, we want to mention that this
Delivery Model might need to be changed it the Risk Assessment model have been changed.
What is Risk and Risk Assessment?
Building a common set of terminology which can be used for description of different Risk
Assessment models and methodologies became non-trivial task within our project. We
constructed the Glossary (Appendix B) of terms which will be used through this paper.
Some of these terms have several definitions by the reason that it is not always possible to
construct the universal term for different risk assessment methodologies. Such terms have
numbers in definitions, and in case if other definition for the same term is needed than the

22
default one (1st is used by default), we denote it with the index number in brackets, e.g. the term
Risk(2) has the definition ‘Combination of the probability of an event and its consequence’.
In many papers and standards Risk is defined as some function or combination of the probability
of potential event and consequences in case of this event appearance. In most cases
consequences are considered as negative effect of the event. We will continue with such
definition in mind, i.e. with the definition Risk(2), because this meaning is used very often, but for
more general discussions we still will use the default definition of risk as the ‘Effect of uncertainty
on objectives’.
According to ISO/IEC 27000:2009 [43] Risk assessment is the overall process of Risk analysis and
Risk evaluation. Risk analysis include estimation of risk, and risk evaluation is the process of
comparing the estimated risk against given risk criteria to determine the significance of the risk.
Not all risk assessment methods follow the same distinguishing between risk analysis and risk
evaluation. But we will try to find a match between these terms and the parts of the risk
assessment models.
The difference between qualitative and quantitative risk analysis is explained very clear in the
section 8.3.1 of ISO/IEC 27005:2011 [46].
In addition to that in [NIST SP 800-30] there is also considered semi-quantitative assessment, and
this term is used in NIST risk-related publications.
It might seem weird that we are going to use the definitions from the Risk Management and
Assessment frameworks (NIST and ISO relevant families of standards) which will not participate in
our analysis and comparison of the Risk Assessment models. But, these methodologies are well-
developed and consistent, especially in the part of definitions and terms in comparison to other
models that we are going to analyze. Anyway, mentioned methodologies are well-recognized and
widely used by Information Security communities, and are often considered as so called ‘Good
practices’, so usually set of terminology in Risk Assessment is more or less aligned with them.
We will call risk sub-components the representation of risk factors (qualitative, quantitative or
semi-quantitative), i.e. they can be for example variables in the formulas for calculation of the
risk.
We also will use two main terms for actors related to the use of the risk assessment
methodologies: Implementer and Evaluator.
Implementer is and entity (individual, group or organization) implementing a Risk Assessment
Methodology in the organization which is going to use this methodology.
Evaluator (in slang: pentester) is an entity which is using the methodology which is already
implemented within organization, which the evaluator belongs or has relation to.
Another meaning has the term Evaluator of the Model (or Evaluator of the Methodology), which
means the entity which makes an evaluation of the Risk Assessment Model (Methodology), which
can be implemented as well as not implemented in the organization.

23
The place of Risk Assessment in Information Security Risk Management
The main reason why we mention Risk Management is the fact that FortConsult’s customers have
the need to transfer results of Information Security Tests into their companies’ Risk Management
systems. In order to take this requirement into account, we need a general understanding of how
Risk Management can be performed. Also, we will talk about integration of Risk Assessment
method into the company, therefore we need to know the place of Risk Assessment within Risk
Management, and activities connected to the process of such integration.
By the reason that we used the definitions from ISO/IEC 27000:2014 and NIST 800-30, we will
consider Risk Management systems aligned with these standards, i.e. ISO/IEC 27005:2011, ISO
31000:2009 and NIST 800-39.
Information Security Risk management in ISO/IEC 27001:2013, ISO/IEC 27005:2011, ISO
31000:2009
We will use the scheme from ISO 31000:2009 [41] to demonstrate the connection between Risk
Assessment and Risk Management.
Figure 1. Relationships between the risk management principles, framework and process. From [ISO
31000:2009]
From this illustration (Figure 1) we see the cyclic nature of the processes of Risk Assessment and
Risk Management. This may be very close to the approach of Risk Management within the
customers’ organizations.

24
Information Security Risk Management in NIST 800-39
According to [NIST SP 800-39] organization can look at the risk from the perspective of three
Tiers: from strategic risk to tactical risk. And the risk management process is combined from
components and flows between them (Figure 2).
Figure 2. Relationships between the risk management principles, framework and process. From [NIST
SP 800-39]
We can see how in this standard Risk Assessment is interconnected with other main components
of Risk Management.

25
Models for analysis
Description of the MS DREAD model
Searching enough information about original Microsoft DREAD model (hereinafter we denote it as
MS model) to perform deeper analysis of it became another challenge during this project. Finally,
we got to the point that most of the sources mentioning and describing DREAD model refer to the
main two sources, which are [1] and [2].
But, even these available sources which we consider as original/initial, does not describe in details
the DREAD model. Many other sources just repeat the same brief description provided in [1] or
[2] without extra explanation or analysis or DREAD model, e.g. [7].
The broadest description of DREAD we were able to find is the one in the “Writing secure code”
book [2], but it is still brief and allows to understand the DREAD parameters widely. For example,
this is how Howard & Leblanc [2] describe one of the Risk Component of the MS model –
Discoverability:
“This is probably the hardest metric to determine and, frankly, I always assume that a threat will
be taken advantage of, so I label each threat with a 10. I then rely on the other metrics to guide
my threat ranking.”
This means, that one of the components (Discoverability) in their approach is constant and does
not influence on the model’s outcome depending on the input.
On the other hand Mackman et al. [1] propose another way of using DREAD, including
Discoverability, which is not constant there.
In addition, the traditional way to calculate the risk by multiplying the criticality of the
vulnerability and the likelihood of its occurring is called there as “a simple way to calculate risk”,
and DREAD methodology description is provided after that.
Also, authors *1+ propose that “Ratings do not have to use a large scale because this makes it
difficult to rate threats consistently alongside one another”, which is a kind of opposite to
approach in [2].
Because of such big differences in these two descriptions of DREAD model, and ambiguity of the
model, we will consider two versions of DREAD, one is example from [1], second is from [2, page
64], and will call them MS1 model and MS2 model respectively.
MS1 model
MS1 model has the scale from 1 to 3 for each risk sub-component, and each of these values are
clearly and simply defined.
Risk value is calculated simply by adding sub-components’ values:
RiskDREAD = Da + R + E + A + Di (1)
Risk factors definitions from [1] are provided in the following Table 1:

26
\ Rating High (3) Medium (2) Low (1)
Da
The attacker can subvert the security system; get full trust authorization; run as administrator; upload content.
Leaking sensitive information.
Leaking trivial information.
R
The attack can be reproduced every time and does not require a timing window.
The attack can be reproduced, but only with a timing window and a particular race situation.
The attack is very difficult to reproduce, even with knowledge of the security hole.
E A novice programmer could make the attack in a short time.
A skilled programmer could make the attack, then repeat the steps.
The attack requires an extremely skilled person and in-depth knowledge every time to exploit.
A All users, default configuration, key customers.
Some users, non-default configuration.
Very small percentage of users, obscure feature; affects anonymous users.
Di
Published information explains the attack. The vulnerability is found in the most commonly used feature and is very noticeable.
The vulnerability is in a seldom-used part of the product, and only a few users should come across it. It would take some thinking to see malicious use.
The bug is obscure, and it is unlikely that users will work out damage potential.
Table 1. Mackman et al. [1] Threat Rating Table.
To have better understanding of the meaning of risk sub-components we can rephrase this table
in the way to state in more clear form an effect or obstacles related to each risk factor from the
previous Table.
Table 2 can help in matching between sub-components in comparison to other models.
By the reason that the scale consists just of three values for each sub-component, it is possible to
have only 35 = 243 combinations of risk factors.
Some basic properties of MS1 model:
Simplicity. Only 5 risk sub-components. Scale from 1 to 3 for each sub-component. Final Risk
Score is calculated just as an addition of 5 sub-components.
Among the models that we describe and compare in this report, the MS1 model is the easiest to
calculate without any tool, and the result is a positive integer number. We believe that it was one
of the main desired properties of the original MS DREAD model.

27
\ Rating High (3) Medium (2) Low (1)
Da CIA compromised Confidentiality of sensitive information
Confidentiality of trivial information.
R Reproducible: always Timing requirement: none
Reproducible: conditional Timing requirement: within a timing window
Reproducible: hard
E Agent’s skills and time needed: Low
Agent’s skills: High. Agent’s ability to reproduce the attack: High
The attack requires an extremely skilled person and in-depth knowledge every time to exploit.
A
Amount of affected users: High Configuration: Default Customers: Important
Amount of affected users: Low Configuration: Non-default
Amount of affected users: Very Low Configuration: obscure feature Users: anonymous users
Di
Info about attack: Published Vulnerable asset: the most commonly used feature and is very noticeable.
The vulnerability is in a seldom-used part of the product, and only a few users should come across it. It would take some thinking to see malicious use.
The bug is obscure, and it is unlikely that users will work out damage potential.
Table 2. MS1 model – properties for different values of sub-factors.
MS2 model
DREAD is used in this book [2] for the risk assessment after performing the threat analysis using
STRIDE Threat model [8].
It is interesting to mention that the first edition of this book [3] in 2002 referred to the OCTAVE
method for the threat analysis. In addition, the book [11] was mentioned there. The second
edition [2] was released next year with the description of DREAD model, which we call MS2 model
in this report. It can indicate the approximate year of appearance of DREAD model (between 2002
and 2003).
Original description of the MS2 model [2] uses spoken language, so sometimes will re-formulate it
with the common terms used for Information Security Risks in order to make it more easy to
compare the MS2 model with other models.
The goal of the approach is to calculate the Risk Rank (called RiskDREAD) for the given vulnerability.
According to [2] Risk Rank is calculated as:
RiskDREAD = ( Da + R + E + A + Di ) / 5 (2)
Where the risk sub-components are described in Table 3. We also provided in this table original
descriptions of sub-components from [2], they are marked with *.

28
Damage potential Da
Estimation of the extent of potential damage caused by the threat. * ”How great can the damage be? Measure the extent of actual damage possible with the threat. Typically, the worst (10) is a threat that allows the attacker to circumvent all security restrictions and do virtually anything. Elevation of privilege threats are usually a 10. Other examples relate to the value of data being protected; medical, financial, or military data often ranks very high. “
Reproducibility R
The score of the potential to reproduce the same attack. * “How easy is it to get a potential attack to work? Measures how easy it is to get a threat to become an exploit. Some bugs work every time (10), but others, such as complex time-based race conditions, are unpredictable and might work only now and then. Also, security flaws in features installed by default have high reproducibility. High reproducibility is important for most attackers to benefit.”
Exploitability E
Estimation of the efforts needed to implement the attack. * “How much effort and expertise is required to mount an attack? For example, if a novice programmer with a home PC can mount the attack, that scores a big fat 10, but a national government needing to invest $100,000,000 to mount an attack is probably 1. In addition, an attack that can be scripted and used by script kiddies is a big fat 10, too. Also consider what degree of authentication and authorization is required to attack the system. For example, if an anonymous remote user can attack the system, it ranks 10, while a local user exploit requiring strong credentials has a much lower exploitability.”
Affected users A
Amount of users affected in the case of successful attack. * “If the threat were exploited and became an attack, how many users would be affected? This measures roughly what percentage of users would be impacted by an attack: 91–100 percent (10) on down to 0–10 percent (1). Sometimes the threat works only on systems that have installed a certain option or set some configuration state in a specific way; again, estimate impact as best you can. Server and client distinction is very important; affecting a server indirectly affects a larger number of clients and, potentially, other networks. This will inflate the value compared to a client-only attack. You also need to think about market size and absolute numbers of users, not just percentages. One percent of 100 million users is still a lot of affected people!”
Discoverability Di
Efforts needed to discover the vulnerability. * “This is probably the hardest metric to determine and, frankly, I always assume that a threat will be taken advantage of, so I label each threat with a 10. I then rely on the other metrics to guide my threat ranking.”
Table 3. MS2 model risk sub-components description
So, in this approach the risk equation in fact becomes the following:
RiskDREAD = ( Da + R + E + A + 10 ) / 5 = 2 + ( Da + R + E + A ) / 5 (3)

29
After estimation of all the risk sub-components the Risk Rating is found using formula (2). All
vulnerabilities after that can be ranged by RiskDREAD, perhaps with additional evaluation of risk, e.g.
such as described in [5].
Description of the FC model
The structure of the FC model in general follows the original MS DREAD model. But, looking at it
more closely we will see important differences, which make this model very different from MS1
model and MS2 model.
FC model has three main differences from the original MS model.
First, despite the risk sub-components use the same names as MS DREAD model, the meaning of
sub-components is different.
Second, in Risk Rank calculation formula FC model uses different coefficients (weights) for
different risk components, formula (4).
The formula for RiskDREAD (also sometimes denoted as Risk_DREAD) is the following:
RiskDREAD = ( (Da + A) / 2 + (R + E + Di) / 3 ) / 2 (4)
This brings different weights to the different sub-components (1/4 to Da and A, and 1/6 to R, E
and Di), in comparison to 1/5 coefficient to all components in the MS2 model.
Third, as the last step of risk level calculation, the Asset Criticality is taken into account in the way
that final risk level is found from the Table 9. This step is called FC Risk Evaluation.
The description of the model is provided below according to [37].
Risk Estimation
The first part generally follows the original MS DREAD model (differences will be shown later).
In this part the main goal is to calculate a Risk Rank:
RiskDREAD = ( IMPACT + LIKELIHOOD ) / 2 (5)
IMPACT = (Da + A) / 2 (6)
LIKELIHOOD = (R + E + Di) / 3 (7)
Where specific risk sub-components Da, A, R, E, Di are evaluated by answering the following
questions.
Damage Potential
Sub-component name: DAMAGE (Da)

30
If a vulnerability exploit occurs, how much damage will be caused?
Sensitive Data Infrastructure Physical access
0 Information leakage that could lead to compromise of sensitive data or systems
1 The presence of this vulnerability contributes to other vulnerabilities being exploited
2 Sensitive data compromised Access to places with no
critical systems
3 User account compromised System completely
compromised Access to places with critical
systems
Table 4. Damage Potential (Da)
NOTE: if vulnerability violates PCI compliance it is automatically marked as 3
Affected users or systems
Sub-component name: AFFECTED USERS (A)
How many users or systems will be affected if the vulnerability is exploited?
Users Systems
0 None None
1 One user Affected systems < 25%
2 Group of users Affected systems < 90%
3 All users Affected systems ≥ 90%
Table 5. Affected users or systems (A)
Reproducibility
Sub-component name: REPRODUCIBILITY (R)
What kind of access is necessary to exploit this vulnerability?
Access level
0 Physical access to target machine
1 Valid credentials to the system
2 Same network as the victim
3 Internet access with no credentials
Table 6. Reproducibility (R) in FC model

31
Exploitability
Sub-component name: EXPLOITABILITY (E)
What is needed to exploit this vulnerability?
Requirements (any of the following)
0 Advanced programming and
networking knowledge Custom or advanced attack
tools
Depends on other vulnerabilities being present
which have not been discovered
1 Requires victim’s intervention, possibly through social engineering
2 Tool or malware is available on the internet Exploit is easily performed
3 Just a web browser or no tools necessary
Table 7. Exploitability (E)
Discoverability
Sub-component name: DISCOVERABILITY (Di)
How easy is it to discover and exploit this vulnerability?
Difficulty Equivalent threat agent
0 Very hard to impossible; requires source code, administrative access or classified
information
Intentional skilled and resourceful attacker (organized crime or government)
1 Hard; requires partial knowledge of internal
structure, or involves guessing Intentional skilled attacker (hacker)
2 Medium; details of faults like this are
already in public domain and can be easily discovered using a search engine
Intentional unskilled attacker (script kiddie)
3 Low; information is visible in a browser address bar, form, or readily visible or
accessible in case of physical vulnerabilities Accidental attacker or malware
Table 8. Discoverability (Di)

32
Risk evaluation
During the second part of the FC model we need to find a final Risk Level. We use the Asset
Criticality for this in the way that the final Risk Level is found from the following table:
Asset Criticality Risk level
Major Moderate Minor
RiskDREAD
2,5 < Risk ≤ 3,0 - - Very High
2,0 ≤ Risk ≤ 2,5 2,5 ≤ Risk ≤ 3,0 - High
1,5 ≤ Risk < 2,0 2,0 ≤ Risk < 2,5 2,5 ≤ Risk ≤ 3,0 Medium
0 < Risk < 1,5 0 < Risk < 2,0 0 < Risk < 2,0 Low
Table 9. FC model Risk Evaluation Table
The value of Risk Level is the final qualitative Risk assessment value used for vulnerability
prioritization within the one particular report of vulnerabilities.
The OWASP Risk Rating Methodology
The OWASP Risk Rating Methodology (denoted as OWASP-R onwards) is very important to
consider in our report, because it was developed with the main purpose to prioritize the needs to
fix vulnerabilities, e.g. found during pentest or code review. By this reason it has a lot of
similarities to FC model.
OWASP-R is well-known and widely used methodology *…+.
In addition, the model “from the box” allows making changes in it depending on the needs.
The following are the steps in the “classic” OWASP-R model [6]:
Step 1: Identifying a Risk
Step 2: Factors for Estimating Likelihood
Step 3: Factors for Estimating Impact
Step 4: Determining Severity of the Risk
Step 5: Deciding What to Fix
Step 6: Customizing Your Risk Rating Model
From the point of view of our needs the steps 2, 3 and 4 are more important, so they are
explained more broad and the rest is just mentioned briefly.
Below there are risk factors used in the OWASP-R explained. In the original model possible values
of each factor are from the range [0; 9], we will use it.
Identifying a Risk (Step 1)
Methodology does not provide a certain method for Risk Identification. The main points are:
“The tester needs to gather information about the threat agent involved, the attack that will be
used, the vulnerability involved, and the impact of a successful exploit on the business. “

33
“In general, it's best to err on the side of caution by using the worst-case option, as that will result
in the highest overall risk.”
Factors for Estimating Likelihood (Step 2)
There are two groups of Likelihood risk factors: Threat Agent Factors and Vulnerability Factors.
Likelihood factors
Threat agent factors Vulnerability factors
Skill level Motive Opportunity Size Ease of
discovery Ease of exploit
Awareness Intrusion detection
Table 10. Factors for Estimating Likelihood
The main point here is that for the final Likelihood value we are using the average value of all of
these 8 factors.
Factors for Estimating Impact (Step 3)
There are two groups of Impact risk factors: Technical Impact Factors and Business Impact
Factors.
Impact factors
Technical Impact Business Impact
Loss of confidentiali
ty
Loss of integrity
Loss of availability
Loss of accountabili
ty
Financial damage
Reputation damage
Non-compliance
Privacy violation
Table 11. Factors for Estimating Impact
The main point here is that for the final Impact value we are using the average value of 4 factors
of only one group.
The OWASP model has important step, it states that for severity calculation, impact level should
be taken from the business impact information if this information is “good”, which means that if
we have an ability to calculate/estimate all the Business Impact sub-factors.
Otherwise, if we do not have information about impact on the business, then the Technical
Impact have to be used in the Severity calculation.
By this reason of having mutually exclusive ways of calculation of Impact, we will refer to the final
result (Risk Severity) as Business Risk or Technical Risk.
As OWASP is customizable model, we can later consider an option to build a hybrid model which
can take both Technical and Business Impact into account.
Determining Severity of the Risk (Step 4)
The goal of the OWASP-R methodology is to get the qualitative Risk Severity.

34
At this step the numerical assessment of Impact and Likelihood is matched with the
corresponding qualitative level according to the Table 12. After that the Overall Risk Severity is
determined by Table 13 using these qualitative assessments of Impact and Likelihood.
Likelihood and Impact Levels
0 ≤ Mean_value < 3 LOW
3 ≤ Mean_value < 6 MEDIUM
6 ≤ Mean_value ≤ 3 HIGH
Table 12. Qualitative scale for Likelihood and Impact values in OWASP-R
Where Mean_value is the the mean Likelihood and Impact retrieved from Step 2 and Step 3
respectively.
The final prioritization of the threats and vulnerabilities is based on so called severity of the risk
which basically can be counted as the production of Risk Likelihood and Risk Impact:
Risk = Likelihood * Impact (8)
But, by the reason that this is qualitative evaluation, no numbers are included (all they are
modified by the Table 12) and instead of the formula above the following method is used:
Overall Risk Severity
Impact
HIGH Medium High Critical
MEDIUM Low Medium High
LOW Note Low Medium
LOW MEDIUM HIGH
Likelihood
Table 13. Risk Matrix in OWASP-R
Here the value “Note” means that the risk have to be reported, but considering its severity below
the “Low” level the mitigation actions most porbably might not be needed.
Also, from the Table 13 we can assume that the OWASP-R model will have as output not so many
“Critical” cases.
Note: The meaning of Risk Levels in OWASP-R is different than is FC model.
Deciding What to Fix (Step 5)
At this Step the decision is made what to fix first, second etc. Even though after Step 4 we
received a priority which we can follow directly, some additional decisions can be made, which
could make the list of fix tasks differ from the risk rating, e.g. in the case if the cost of fix is too
high comparing to Risk Severity.
On the other hand, it is interesting to compare this Step with Howard & Leblanc’s note about use
of MS DREAD model [2]:
35
“IMPORTANT
Some teams I have worked with also factor in the cost and effort to mitigate the threat. Of course,
your users don't care how much it takes to fix, they simply don't want to be attacked! Remember
that!”
One of the reasons of such different opinions is the position/need of assessment: internal or
external.
CVSS v2 and CVSS v3 even have an explicit metric similar to this property of OWASP’s Step 5,
called Remediation Level, which reduces the risk the higher is availability of something what fixes
the vulnerability.
Customizing Your Risk Rating Model (Step 6)
OWASP-R allows to make changes to the model, but does not guide specifically how to do that. It
only outlines the possible ways to do that. OWASP-R model can be adjusted by the following
ways:
1. Adding factors
2. Customizing options
3. Weighting factors
But, OWASP-R also does not define any criteria against which the implementer can check if the
changes have been made appropriately and the model does still provide adequate results.
Common Vulnerability Scoring System (CVSS)
The development of CVSS was started by the National Infrastructure Advisory Council (NIAC) [26]
in 2003, and in 2005 they released the final version of CVSS v1. After that the development and
responsibility for the framework was given to the Forum of Incident Response and Security Teams
(FIRST) [25], and the next releases CVSS v2 and CVSS v3 were developed based on a lot of
feedback and in collaboration with a lot of recognizable organizations in IT.
In this paper we do not describe CVSS v1 because it is rarely used already, but it generally has the
structure and ideas similar to CVSS v2. But, we will consider both versions CVSS v2 and CVSS v3,
because despite they have similar design, the differences make them provide sometimes very
different scoring for the same vulnerabilities.
CVSS is probably the mostly used methodology for vulnerabilities scoring. For example, NIST
National Vulnerability Database (NVD) [34] is using CVSS. Some organizations switch from using of
their own methodologies to CVSS, e.g. well-known CERT Division of the Software Engineering
Institute (SEI) – cert.org – started to use CVSS for description of vulnerabilities published after
March 27, 2012 instead of their CERT Vulnerability Scoring [27].
Nowadays two versions of CVSS are in active use: CVSS v2 and CVSS v3, but of course CVSS v3
meant to be more modern and improved compared to CVSS v2.
Those two models are good to illustrate how the changes within the model can significantly
influence on the final result of the Vulnerability Score (similar to Risk Level and Risk Severity). In
[17] we can see such comparison of scores for the same vulnerabilities. Sometimes the difference

36
is quite sensible, e.g. 5 vs 7.5, 4.3 vs 6.1, 7.1 vs 5.5 (CVSSv2 scores in comparison to CVSSv3 scores
for the same vulnerabilities, examples from the mentioned document [17]).
One of the main difference of CVSS (v2 and v3) from the previously described models is that it
calculates the final Score using more sophisticated equations, putting different weights on
different risk sub-components and using few more general coefficients through the calculations.
But, the charm of CVSS is that the evaluator does not suppose to see those numbers and
formulas. The methodology provides a match between qualitative and quantitative assessment,
so the evaluator works with very simple intuitive method performing only qualitative assessment
using very clearly defined Metrics, which provide very distinguishing qualitative values and
descriptions of these values. The amount of possible values varies from 2 to 5 for different
metrics, i.e. it is not too high. The calculations are supposed to be done by special tools called
CVSS calculators [21], [22].
So, despite from the user’s point of view the model looks qualitative, it is quantitative in fact, and
the final value for risk is a number from 0 to 10.
CVSS require to provide along with the CVSS score itself the “vector” string which allows to see
the values of each components and to validate the score if needed.
Another idea of CVSS is to separate metrics to 3 groups: Base, Temporal and Environmental. This
is interesting part of the model. The score can be calculated by using only Base Metric Group
(Table 14) – and this result claimed to be static and not depending on particular company, system
or attacker. All the “dynamic” risk sub-components (Temporal and Environmental Metrics) are not
obligatory, but they can be used for particular circumstances to clarify the score.
Base Metrics
Impact Metrics Exploitability metrics
Scope Confidentiality Impact
Integrity Impact
Availability Impact
Attack Vector
Attack Complexity
Privileges Required
User Interaction
Table 14. CVSS v3 Base Metric Group
CVSS v2
CVSS version 2.0 was published in 2007 with the purpose to provide an open framework for
description and evaluation of security vulnerabilities of IT systems. Since then the use of CVSS v2
became very widely used, and even after introducing a new version, CVSS v2 is still in use.
Version 2.10 of the formula for the base equation [15]:
BaseScore =
= round_to_1_decimal(((0.6*Impact)+(0.4*Exploitability)-1.5)*
* f(Impact))
(9)
Impact = 10.41*(1-(1-ConfImpact)*(1-IntegImpact)*
*(1-AvailImpact)) (10)
37
Exploitability = 20 * AccessVector * AccessComplexity *
* Authentication (11)
CVSS v3
CVSS v3 was developed from 2012 to 2015.
One of the main improvements in CVSS v3 in comparison to CVSS v2 is adding a Scope property
which introduces some level of vulnerabilities’ interdependence representation and its influence
on Risk Level (Base Score). Scope factor can have one of two possible values: Unchanged (U) or
Changed (C). Scope is considered as Changed in case if the vulnerability
Basically, if Scope is Changed, then the Risk Level increases in comparison to Scope Unchanged for
the same values of other factors.
These two possible cases of Scope cases two different branches of calculations of Base Score, i.e.
different formulas of scores calculations (see below).
The same idea applies to Modified Base metrics, i.e. the same dependence on Modified Scope:
Unchanged or Changed.
The results of qualitative assessment from the “Metrics” [16] for the needs of actual calculation of
the score by “Formula” *16] are converted to the certain numbers. We can see that the matching
of those numerical values are not equal for different Risk Sub-components, e.g. High CIA impact is
represented with 0.56 value, and low impact is represented by 0.22, and None impact has value 0.
In this example perhaps the distance in the final value for Low and None can be too high, but on
the other hand it is by the reason that Impact assessment in CVSS allows to choose only one of
three discreet qualitative values: None, Low and High – so these values represent some kind of
average values, not distinguishing between “very low” and “high among low”.
Another example is Remediation Level (RL) value of which is varying from 0.95 (Official Fix) to 1
(Unavailable or Not Defined).
It means that in addition to more complicated formulas (in comparison to previously considered
models) with coefficients, there is also a “weight” for each of the variables defined by scale which
is specific and different for many variables.
OCTAVE Allegro
OCTAVE Allegro is the last generation of the OCTAVE method [36]. In the earlier versions method
consisted of different types of method depending on size of the organization (OCTAVE-S for small
companies).
OCTAVE Allegro method describes the overall Risk Assessment process. The approach consists of
four Phases, divided by so called Steps, and Steps consist of Activities. OCTAVE Allegro is self-
sufficient approach, but “heavy” if applied completely. For the purposes of this project we
consider just certain parts of this method.

38
Below there are all eight Steps of OCTAVE Allegro. We marked bold those of them which are the
most relevant specifically to Risk Estimation and Evaluation.
Step 1 - Establish Risk Measurement Criteria
Step 2 - Develop an Information Asset Profile
Step 3 - Identify Information Asset Containers
Step 4 - Identify Areas of Concern
Step 5 - Identify Threat Scenarios
Step 6 - Identify Risks
Step 7 - Analyze Risks
Step 8 - Select Mitigation Approach
At the Step 1 Risk Measurement Criteria are built specifically for the certain organization. Risk
Measurement Criteria is [36] “a qualitative set of measures against which you will be able to
evaluate a risk’s effect of your organization’s mission and business objectives”.
Risk Measurement Criteria built during the Activity 1 allows to use pre-defined bases to find
Impact Value within each of Impact Areas. Pre-defined metrics allows to reduce Risk
measurement subjectivity.
Risk Measurement Criteria allows to match any consequences of the Risk to the
Low/Moderate/High scale of impact within the certain Impact Area.
Among others, Impact Area Ranking is built, prioritizing the significance of different Impact Areas,
such as Reputation, Financial, Productivity, Safety and Health, Fines/Legal, etc (the higher is Rank,
the more important is the Impact Area).
Please note that Impact Areas are considered mainly as Business areas of impact (if other is not
defined in User Defined area). This explains the match in Table A.
Step 2 requires descriptions of assets that organization has.
Steps 6, 7 are the most interesting part for our purposes. They can be directly compared to the
parts of FC model.
Step 6 includes the description of the Consequences for each Threat Scenario.
At this step we will have a clear description of what happens if certain threat appears. Such
description if used in the FC model would allow to mach easily and exactly to the level of each
“DREAD risk variable”.
At Step 7, Activity 1 we use pre-defined Risk Measurement Criteria to assign a qualitative value to
all Impact Areas.
At Step 7, Activity 2 we use Impact Area Ranking built at the Step 1 and combine it with Impact
Values from the previous Activity. And the result is called the Relative Risk Score. This score is
directly used for the Risk prioritization purpose.
At the Step 8, the Probability is used only for Risk Mitigation decision. For example, even if the
Risk Score (i.e. the extent of possible Impact) is high, the “Defer or Accept” Mitigation Approach

39
can be chosen because of Low Risk Probability, i.e. no immediate actions or controls are
implemented.
OCTAVE Allegro does not provide at all a way of calculation of Risk Probability, it only says that
[36]: “Because it is often very difficult to accurately quantify probability (especially with respect to
security vulnerabilities and events), probability is expressed in this risk assessment qualitatively as
high, medium, or low. In other words, you must determine whether there is a strong (high) chance
that the scenario you have documented could occur, a medium chance (neutral), or if the scenario
is unlikely (low).”
To my opinion, OCTAVE Allegro provides a good approach and description to calculate an Impact
part of the classic Impact/Likelihood Risk concept. But, the influence of such risk factors as
Exploitability, Discoverability, Attacker skill level etc. on risk Likelihood is not clear at all.
There are a lot of Activities that can be directly matched to the parts of FC model.
That is why for the purposes of the Target Model (see below) we will take into account and
analyze more closely the following parts of OCTAVE Allegro which have direct relation to the
Impact Score calculation (in terms of OCTAVE Allegro):
Risk Measurement Criteria
Risk Identification
Risk analysis
And taking into account that those mainly deal with the Business part of the Impact…
Explanation about choice of the models
OWASP-R and CVSS are the best-known risk assessment methods among penetration testers for
vulnerabilities ranking. They both are used in published ratings, such as CVE [18].
Two version of CVSS were considered, because there is extremely many similarities between
them, but it is a good opportunity to show how changes in the model can influence on its
outcome a lot.
OCTAVE Allegro was used to make a comparison to one of the ‘heavy’ framework, which is
generally used to assess all the Information Security Risks not limiting only to security
vulnerabilities.
What is Target Model?
In this report we use the term Target Model for something what we are looking for. This is a Risk
assessment model with all desired properties. We already have seen a few examples of
imperfectness of the existing models, so for now we can say that we would really like some
mechanism in desired model which can fix those issues.
After combining all found “suspicious” parts of considered models, analyzing and comparing
them, we will be able to understand better what exactly should be fixed to make considered
models better.

40
We will also build a set of criteria which allows to determine if we reached a Target Model.
So, there is no only one Target Model. There are several ways to build a Target Model. One of
them is to improve the existing model in some way that the result fits those criteria. We will try to
use the way of putting together the best parts of different models, and leaving out the parts we
find are not good enough.
For example, having an overview of other models, we found it useful to distinguish between
specifics of the business and specifics of the vulnerability itself. Therefore e.g. talking about
Impact components in Target Model, we prefer to consider Absolute Impact Factors (which does
not depend on the business) and Relative Impact Factors. This is very close to the CVSS’s idea of
Base Metrics, and also correlates with other models (see Appendix D).

41
Analysis of the models
The difference between implemented FC model and original MS DREAD model
From the first point of view the FC model seems to have much more clear definitions of Risk
Factors. This obviously reduce the subjectivity – it is a kind of simplified version of OCTAVE
Criteria.
The model that company uses (FC model) differs from originally developed by Microsoft. While FC
model uses similar threat levels as Microsoft's example [1, pp. 63-65], i.e. 4 levels from 0 to 3
(comparing to 3 levels from 1 to 3 in MS1 model example), the FC model have the step called
"Risk Evaluation" where Risk_DREAD calculated using mainly the MS model is combined with
Asset Criticality to get the final Risk Level (one of the values: Low, Medium, High, Very High).
This found Risk Level is used to prioritize the vulnerabilities found during penetration tests.
The first opinion: Asset criticality (Minor, Moderate or Major) in FC model current implementation
does not have the formalized way to be calculated (high influence of subjectivity). If we look at
OCTAVE Allegro [10] model we can find that ... (Risk measurement criteria .. reputation, ... ) –
compare which risk factors from there might be involved in ours Asset criticality formally. So, one
of the ways of work is to develop better the definition of Asset criticality and to formalize the
guidance how to calculate it.
In addition, some of the properties which have influence on Asset criticality, already have been
taken into account in the model when calculating the DAMAGE and AFFECTED USERS variables..
If we understand better the need of involving of Asset Criticality, it would be easier to formulate
the requirements for the target model. As well as having the formal description of Asset criticality
we can answer more precisely about its (supposed) correlation with Da and A parameters
(Impact).
Such changes in FC model in comparison to MS model shows that there is a need for another
model, and Asset Criticality looks like a "fix" for a some version of FC model during its
development.
There is also a question about boundary values of Risk_DREAD in the table for Risk Level
evaluation. In some cases boundary values are included in higher level (e.g. Moderate Asset
criticality and Risk_DREAD == 2.5) in other to lower level (e.g. Major Asset criticality and
Risk_DREAD == 2.5). This might be important (I suppose that those boundary values appear more
often in distribution of values of Risk_DREAD - will be find out after this calculation of possible
values). {ToDo: we can collect statistical values from different reports and build/show the
distribution of vulnerabilities by Risk Level categories (from Very High to Low), then e.g. to build a
histogram for the case when the boundary values fits the risk categories differently, like if for
Major criticality both values 2 and 2.5 belong to the High Risk Level).
Instead of Asset Criticality other models [10], [13], [48] consider such risk sub-components as
monetary/financial loss, productivity loss, loss of customer confidence.

42
In addition, FC model combines probability-based risk approach with requirement-based. E.g. in
calculation of DAMAGE POTENTIAL (Da) there is a note "If vulnerability violates PCI compliance it
is automatically marked as 3". This is because one of the purposes of penetration testing is to
perform audits required by PCI standards [49].
We were not able to find differences how model is applied depending on the size of customer’s
company. Usually the choice of the risk assessment model is taking that into account, and perhaps
there could be a need to make FC model more flexible and propose different approaches for
different companies depending on their size.
But after changes will be made to the FC model it still have to be as easy in use as before (we will
call it efficiency later).
Another difference of FC model in comparison to MS model is that if we compare formulas (2) and
(4):
MS2 model: RiskDREAD = (Da + R + E + A + Di) / 5
FC model: RiskDREAD = ( (Da + A) / 2 + (R + E + Di) / 3 ) / 2
Those two calculations are not equal, meaning that in FC model Impact is valued more than
Likelihood. The weight of Da and A variables is 1/4 and the weight of remaining variables is 1/6.
As was mentioned before, on top of that the Asset criticality will be added on top of that
estimation, i.e. Impact will be counted twice, in other words:
Risk Level = F( G(Impact, X), H(Impact, Likelihood) ) (12)
It means that even though DREAD variables have the same scale in FC model (from 0 to 3), the
change of DA-variables influence on the final result more than the same change of the RED-
variables.
On the other hand, such approach helps with prioritization of vulnerabilities that would have the
same rating in MS model, - in FC model they could be different. For example compare D+A=5,
R+E+D=6 and D+A=6, R+E+D=5 in MS and FC models. In MS model they would have the same
rating 11, but in FC model they will have Risk Level 2,3 and 2,4 respectively. See Appendix A for
additional examples.
Also, such calculations spoiled the original property of MS1 model to operate with round
numbers.
The need to change the FC model
Understanding the need to change the implemented FC model we will know what we are going to
reach and therefore it will be easier to understand what exactly to change in the model.
The target model should take into account the type of penetration test performed.
Also, we saw some mistakes in the vulnerabilities prioritization, so is it as important if the order of
vulnerabilities by Risk level will not change too much in the target model? How can we evaluate

43
possible loss from inaccurate ordering of found vulnerabilities? Can we in addition to the risk from
vulnerability itself calculate the risk of counting that risk imprecisely? The loss can happen for
example if during fixing the one of the vulnerabilities assuming that it has higher risk, another
vulnerability which risk supposed to be lower but is greater in fact, was utilized. The cost of error
in this case is the amount of damage caused by such attack (it is not guaranteed that IMPACT was
calculated correctly).
The risk rating taken from reports not always can be directly used in the client's company. It easily
can be that business risk have different rating, because FC model is more technically-oriented. For
the same Asset Criticality in FC model we can have Risk_DREAD higher for one vulnerability for
example because of A variable is "2" in one case and "3" in another.
Analysis of the MS DREAD model
MS1 model
This model is simple enough to make analysis of different combinations of factors and compare
them with each other and with Risk Rating.
One of the questions to the MS DREAD model is why Risk Rating is not counted as production of
Impact and Likelihood (in terms of FC model), but instead evaluations of all DREAD variables are
summarized?
It means that even if the probability of the vulnerability V1 exploitation is extremely low, but its
Impact is high, then the Risk Rank of it can be even higher than the Risk Rank of some
vulnerability V2 with some medium Impact and medium Likelihood.
MS2 model
For example, on the scale 1-10 (for MS2 model) for each component we can have:
RiskDREAD (V1) = 3 * 1 + 2 * 10 = 23
RiskDREAD (V2) = 5 * 4 = 20
This ranking might be doubtable, especially if the score 1 for the Likelihood (R, E and Di) represent
impossible events (at the scale 1-10 we might have such, in comparison to the scale 1-3, where
the minimum Likelihood is Low). Are businesses in reality spend more efforts to prevent
themselves from the threats which have the lowest probability of occurrence? Please note that all
of Discoverability, Reproducibility and Exploitability in this example (V1) are the lowest possible.
So, is it appropriate prioritization for the client? Perhaps, for some critical systems it might be the
case. But, many companies do not expect from the Risk Assessment model to propose them to
implement costly controls to prevent them from ‘black swans’.
Let us add to this example vulnerability V1’ with a bit lower Impact, but the Risk Score is still
higher than RiskDREAD (V2):
RiskDREAD (V1’) = 3 * 1 + 2 * 9 = 21

44
In case of using more classical formula (2.1) which multiplies Impact and Likelihood, and
assuming that Impact = Da + A and Likelihood = Di + R + E, then the Risk Rank would be:
for the V1 will be 60 in comparison to 8 * 12 = 96 of the V2, and 54 for V1’.
David LeBlanc himself in [5] accept that the MS2 model does not provide correct answer in all
cases, and he even have provided an improvement for better prioritization of vulnerabilities. But,
this addition to the model we will not analyze because we cannot rely only on this short
description, and it was not mentioned in other sources and perhaps was used only internally.
Deeper explanation of FC model and its analysis
FC model is specifically used only to assess the vulnerabilities found during Information Security
Tests.
Initially one of the desire of FortConsult was to have (if necessary) different Risk Assessment
models for different types of Security Tests. Despite we have not provided such variety of models,
the Table xx in Appendix can be used for adjustment of the model for the specific needs. For
different types of tests the implementer of the model can include, exclude or put different
weights to different risk sub-components.
In this chapter we will repeat tables for risk sub-components assessment for convenience.
Damage Potential
If a vulnerability exploit occurs, how much damage will be caused?
Sensitive Data Infrastructure Physical access
0 Information leakage that could lead to compromise of sensitive data or systems
1 The presence of this vulnerability contributes to other vulnerabilities being exploited
2 Sensitive data compromised Access to places with no critical systems
3 User account compromised System completely
compromised Access to places with critical
systems
Table 15. Damage Potential
It have to be clear from the pentest report what systems in the client's company are counted as
“critical systems” and “sensitive data”. We are going to develop the definition for critical system
in order to answer this question. The same is about "sensitive data". This can affect mainly the
scores "2" and "3".
* “User account compromised” – can it be just one account? Then, it correlates with A-
component, but without additional damage, it will mean that A == 1.

45
Score "0" :
The score "0" is represented by "Information leakage that could lead to compromise of sensitive
data or systems". The extent of the term "could" can vary the evaluation broadly.
Version Scanning
** Case of this score sounds similar to the Scope Changes case in CVSS v3.
Score "1" :
The score "1" is represented by "The presence of this vulnerability contributes to other
vulnerabilities being exploited". One of the questions for this definition is - what if "other
vulnerabilities" only lead to damage represented by the score "0"?
Score "2" :
Score "3" :
Affected users or systems
How many users or systems will be affected if the vulnerability is exploited?
Users Systems
0 None None
1 One user Affected systems < 25%
2 Group of users Affected systems < 90%
3 All users Affected systems ≥ 90%
Table 16. Affected users or systems
Score "0" :
Score "1" :
Score "2" : groups of users can be very unequal (by size, privileges, importance to organization,
etc.). Perhaps we need to add extra parameters e.g. amount of users.
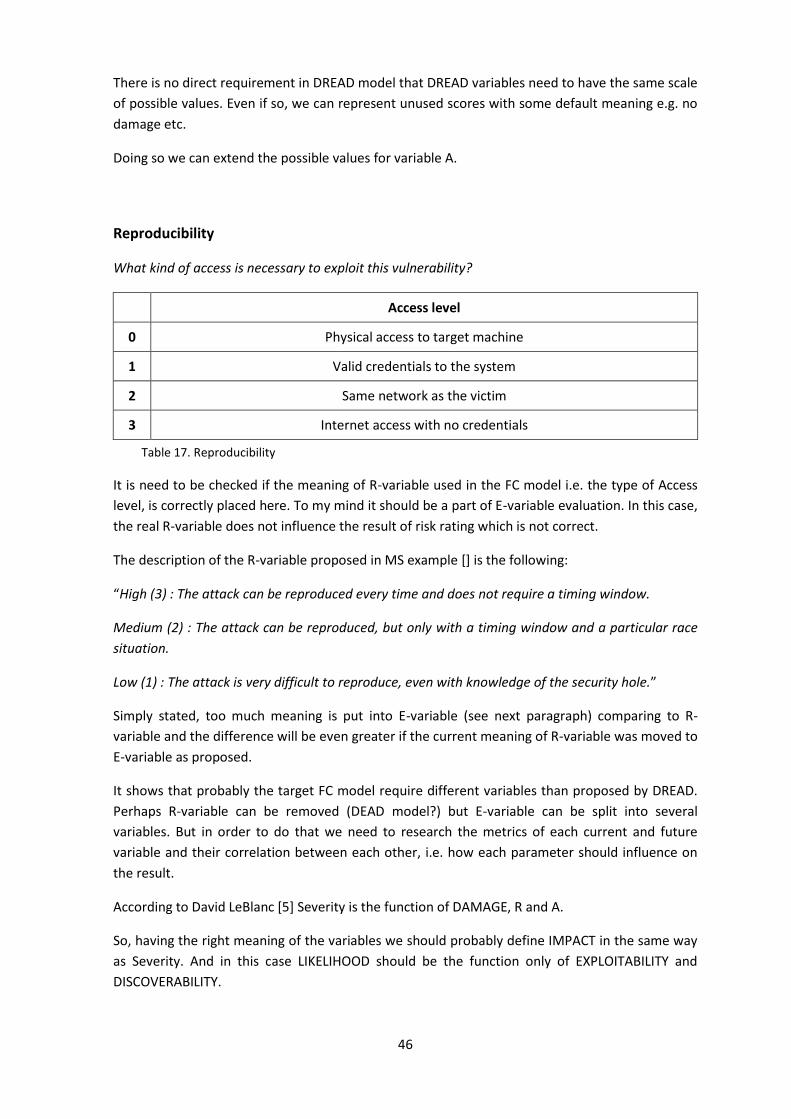
46
There is no direct requirement in DREAD model that DREAD variables need to have the same scale
of possible values. Even if so, we can represent unused scores with some default meaning e.g. no
damage etc.
Doing so we can extend the possible values for variable A.
Reproducibility
What kind of access is necessary to exploit this vulnerability?
Access level
0 Physical access to target machine
1 Valid credentials to the system
2 Same network as the victim
3 Internet access with no credentials
Table 17. Reproducibility
It is need to be checked if the meaning of R-variable used in the FC model i.e. the type of Access
level, is correctly placed here. To my mind it should be a part of E-variable evaluation. In this case,
the real R-variable does not influence the result of risk rating which is not correct.
The description of the R-variable proposed in MS example [] is the following:
“High (3) : The attack can be reproduced every time and does not require a timing window.
Medium (2) : The attack can be reproduced, but only with a timing window and a particular race
situation.
Low (1) : The attack is very difficult to reproduce, even with knowledge of the security hole.”
Simply stated, too much meaning is put into E-variable (see next paragraph) comparing to R-
variable and the difference will be even greater if the current meaning of R-variable was moved to
E-variable as proposed.
It shows that probably the target FC model require different variables than proposed by DREAD.
Perhaps R-variable can be removed (DEAD model?) but E-variable can be split into several
variables. But in order to do that we need to research the metrics of each current and future
variable and their correlation between each other, i.e. how each parameter should influence on
the result.
According to David LeBlanc [5] Severity is the function of DAMAGE, R and A.
So, having the right meaning of the variables we should probably define IMPACT in the same way
as Severity. And in this case LIKELIHOOD should be the function only of EXPLOITABILITY and
DISCOVERABILITY.

47
Exploitability
What is needed to exploit this vulnerability?
Requirements (any of the following)
0 Advanced programming and
networking knowledge Custom or advanced attack
tools
Depends on other vulnerabilities being
present which have not been discovered
1 Requires victim’s intervention, possibly through social engineering
2 Tool or malware is available on the internet Exploit is easily performed
3 Just a web browser or no tools necessary
Table 18. Exploitability
Score "0" :
Score "1" :
Score "2" :
Score "3" :
Discoverability
How easy is it to discover and exploit this vulnerability?
Difficulty Equivalent threat agent
0 Very hard to impossible; requires source code, administrative access or classified
information
Intentional skilled and resourceful attacker (organized crime or government)
1 Hard; requires partial knowledge of
internal structure, or involves guessing Intentional skilled attacker (hacker)
2 Medium; details of faults like this are
already in public domain and can be easily discovered using a search engine
Intentional unskilled attacker (script kiddie)
3 Low; information is visible in a browser address bar, form, or readily visible or
accessible in case of physical vulnerabilities Accidental attacker or malware
Table 19. Discoverability
Score "0" :
Examples include Advanced Persistent Threats (APT).
Such vulnerabilities vary rarely appears, or at least published.

48
Equivalent threat agent have to be so powerful that most probably FortConsult cannot be the one
like that, which means that the assessed vulnerability cannot be found (?).
Score "1" :
Score "2" :
Score "3" :
Despite the FC model explicitly defines IMPACT and LIKELIHOOD variables, still the risk value
Risk_DREAD is counted as their sum, not production.
Note: We are not considering risk management for now, because clients should use their own
implemented methods for this. Perhaps there will be found a way how to combine the results of
FC model with risk management systems better. FortConsult’s reports contain propositions of
corrective actions.
Examples of uncertainty in the model
Appendix A contains some examples of comparison of different set of values of risk sub-
components.
Combinatorial analysis of the models
MS1 model
Figure 3 shows the distribution of 243 possible cases of the model by the final Rating:
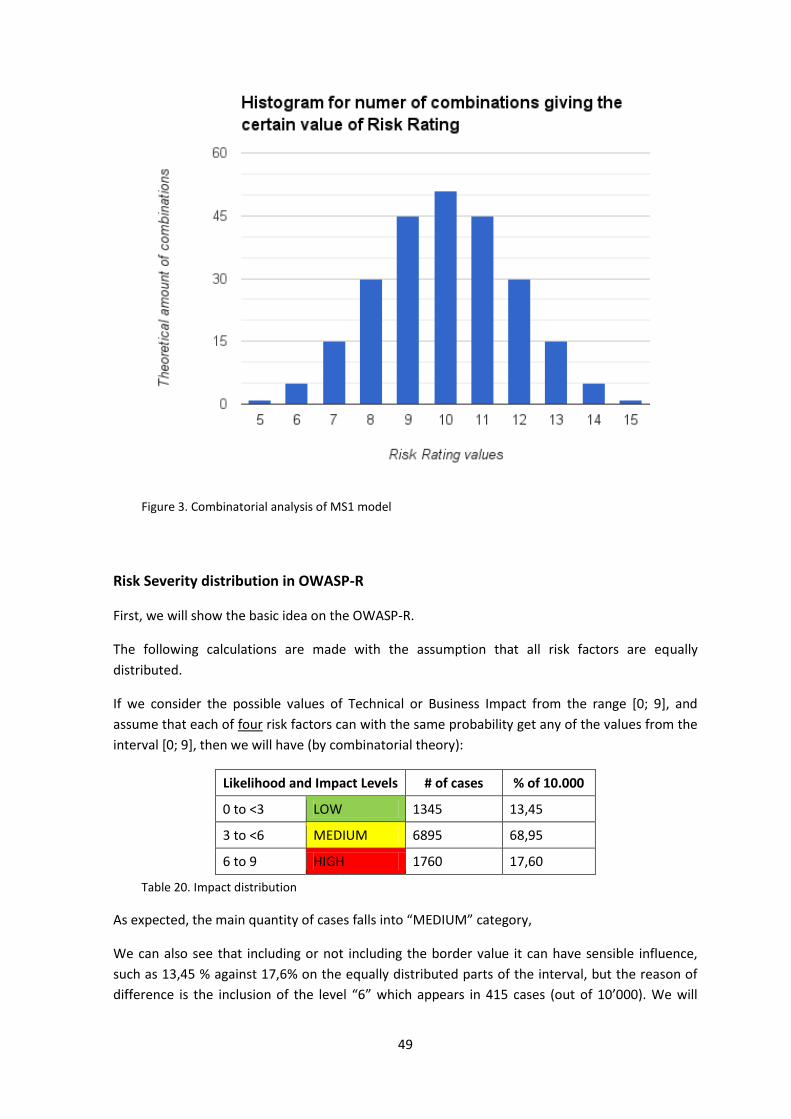
49
Figure 3. Combinatorial analysis of MS1 model
Risk Severity distribution in OWASP-R
First, we will show the basic idea on the OWASP-R.
The following calculations are made with the assumption that all risk factors are equally
distributed.
If we consider the possible values of Technical or Business Impact from the range [0; 9], and
assume that each of four risk factors can with the same probability get any of the values from the
interval [0; 9], then we will have (by combinatorial theory):
Likelihood and Impact Levels # of cases % of 10.000
0 to <3 LOW 1345 13,45
3 to <6 MEDIUM 6895 68,95
6 to 9 HIGH 1760 17,60
Table 20. Impact distribution
As expected, the main quantity of cases falls into “MEDIUM” category,
We can also see that including or not including the border value it can have sensible influence,
such as 13,45 % against 17,6% on the equally distributed parts of the interval, but the reason of
difference is the inclusion of the level “6” which appears in 415 cases (out of 10’000). We will

50
return to this question again in connection to FC model, but just wanted to stress here and show
on the example that this might be important.
Note: Changing the range of the first column in Table 20, we can adjust the model for different
needs, such as to have certain probability of “Critical” severity etc.
For the range [0; 9], but eight risk sub-factors (for Likelihood) we have:
Likelihood and Impact Levels # of cases % of 10.000.000
0 to <3 LOW 6265425 ~6,27
3 to <6 MEDIUM 85760575 ~85,76
6 to 9 HIGH 7974000 ~7,97
Table 21. Likelihood distribution
Comparing Table 20 with Table 21, we can see that the number of risk sub-factors have to be
taken into account because the average of values tends to fall into MEDIUM category more often
when the number of factors increases. Also, this fact have to be taken into account if “Adding
factors” at the Step 6 is used (please refer to the Step 6 of the methodology).
Also, this needed to be kept in mind when applying the Risk Severity Table (Table 2.4). If we
reduce of increase the number of risk sub-factors (e.g. when changing the model), especially both
of Impact and Likelihood factors, it will influence on the probability of falling into certain risk
category.
Table 21 shows that it might be too many MEDIUM cases, and perhaps some of them should be
moved to LOW. OWASP-R model does not take this fact of different amount of sub-components
into account.
After performing a risk severity determination by the Table 2.4 we have the following distribution
of the possible values of Risk Severity (approximately in percents %):
Impact
HIGH 1 15 1,4
MEDIUM 4 59 5,5
LOW 0,8 12 1
LOW MEDIUM HIGH
Likelihood
Table 22. Combinatorial distribution of Risk Severity in OWASP-R model in Risk Matrix
Finally, in combined form the Severity distribution can be represented like this (approx.):

51
Severity level Distribution (number of cases in %)
Critical 1,4
High 20,6
Medium 61,3
Low 15,9
Note 0,84
Table 23. Combinatorial distribution of Risk Severity in OWASP-R model combined by Severity Levels
Table 23 shows that there are a lot of MEDIUM Risk Severity cases.
Below we represent the same data but in the form easier to compare with other results of this
report:
Figure 4. Histogram for combinatorial distribution of Risk Severity in OWASP-R model combined by
Severity Levels
The next little step is if we assume that we do not have High Impact cases, i.e. Impact can only be
Low and Medium, so they both cover 100% cases, the distribution will be (approx. in %):
Impact MEDIUM 5,3 72 6,7
LOW 1 13,7 1,3
LOW MEDIUM HIGH
Likelihood
Table 24.

52
This case is needed to compare it with the Moderate Asset Criticality case in the FC model.
The combined Severity distribution is (approx. in %):
Severity level Distribution (number of cases in %)
High 6,7
Medium 73,3
Low 19
Note 1
Table 25.
For the case of only LOW Impact (to compare with the Minor Asset Criticality case in the FC
model) – the distribution is obviously the same as in the Table 21:
Impact LOW 6,3 85,8 8
LOW MEDIUM HIGH
Likelihood
Table 26.
Figure 5. Histogram for amounts of values Impact * Likelihood
Impact * Likelihood combinations (not precisely as in the model, but the shape will be similar).

53
Theoretical combinatorial distribution of Risk Level in the FC model
The idea is to compare the results from tables 22 – 26, and especially Table 23 with the properties
of the FC model.
Below we will do the similar to the OWASP’s combinatorial analysis of the FC model.
Having the formula:
RiskDREAD = ( (Da + A) / 2 + (R + E + Di) / 3 ) / 2
We want to change the scale in order to be able to work with round values of Risk:
RiskDREAD12 = 12 * RiskDREAD = 3 * (Da + A) + 2 * (R + E + Di)
The results of analysis for FC model are represented in the way if Asset Criticality is taken as
constant, i.e. separately for Major, Moderate and Minor Asset Criticality. Table shows the number
of cases in assumption that all factors are equally distributed. In other words, the table 27 shows
the distribution of the possible values of RiskDREAD for all combinations of Da, A, R, E, Di, but scales
separately within each of three columns for Major, Moderate and Minor Asset Criticality.
Asset Criticality Risk level
Major Moderate Minor
RiskDREAD
2,5 < Risk ≤ 3,0 – 2% - - Very High
2,0 ≤ Risk ≤ 2,5 – 17% 2,5 ≤ Risk ≤ 3,0 – 3% - High
1,5 ≤ Risk < 2,0 – 34% 2,0 ≤ Risk < 2,5 – 16% 2,5 ≤ Risk ≤ 3,0 – 3% Medium
0 < Risk < 1,5 – 47% 0 < Risk < 2,0 – 81% 0 < Risk < 2,0 – 97% Low
Table 27.
We see that if for the Major Asset Criticality the distribution is more or less similar to the
OWASP’s distribution, but for the Moderate and Minor Asset Criticality it might be problematic.
Here also is important to say that including or excluding the border values, results can change a
few percents.
On the other hand, we need something comparable with the Table 22, so the next Table 28
represents the distribution if taking all possibilities as 100%, and assuming that Asset Criticality
can with the same probability be Major, Moderate or Minor (i.e. with the probability of 33,(3)%
each).
Asset Criticality Risk level
Major Moderate Minor
RiskDREAD
0,6% - - Very High
5,8% 1% - High
11,3% 5,4% 1% Medium
15,7% 26,9% 32.3% Low
Table 28.

54
Combining the Table 22 and the Table 27 in a way, assuming Asset Criticality as a Business Impact,
and use RiskDREAD as a Likelihood in OWASP-R, we have:
Impact / Asset
Criticality
High / Major 1 / 11,3% 15 / 5,8% 1,4 / 0,6%
Medium / Moderate
4 / 15,7% 59 / 5,4% 5,5 / 1%
Low / Minor 0,8 / 15,7% 12 / 26,9% 1 / 1%
OWASP-R / FC model risk levels distribution
Low Medium High
Likelihood / RiskDREAD
Table 29.
Perhaps more accurate is to compare final combined distributions by Risk Levels:
Severity level / Risk Level OWASP-R distribution (% of cases) FC distribution (% of cases)
Critical / Very High 1,4 0,6%
High 20,6 6,8%
Medium 61,3 17,7%
Low 15,9 74,9%
Note 0,84 -
Table 30.
Table 29 and especially Table 30 shows that in FC model many cases tend to go into Low Risk
Level category comparing to OWASP-R (under taken assumptions).
Table 29 is just illustrative and does not prove anything, because RiskDREAD already include
Technical Impact in combination with the Likelihood.
But, Table 30 compares the final distributions, so it can be taken into account with less debate.
Separate columns of Table 27 can be also compared with the results from Tables 22, 24, 26.
On the other hand, we can see that for the Major Asset Criticality the FC distribution is most
similar to the OWASP’s distribution (at least is the most similar among showed results). If we
compare the “Major” column of the Table 27 with the Table 23:
Severity level OWASP-R distribution (% of cases) FC distribution (% of cases)
Critical / Very High 1,4 2%
High 20,6 17%
Medium 61,3 34%
Low 15,9 47%
Note 0,84 -
Table 31.

55
The Table 31 is made for the case if the Asset Criticality is fixed to the value “Major”. But
compared with the Risk Severity distribution of OWASP-R, where Impact is not fixed.
So the real comparison is shown by Table 30.
Such examples as Table 31 can only show the way, how to change the models to make them have
better matching.
FC and FC1 model
Figure 6. Histogram for number of combinations of sub-factors for different values of Risk_DREAD
Histogram for number of combinations of sub-factors (Da, A) for different values of Impact and
Histogram for number of combinations of sub-factors (R, E, Di) for different values of Likelihood
are demonstrated together at the Figure 7:

56
Figure 7. Histogram for number of combinations of sub-factors separately for different values of
Impact and Likelihood
At this histogram we have put both amounts of combinations for Impact and Likelihood without
normalization, i.e. they are counted independently. Later in statistical analysis we need to
remember that the total amount of combinations for Impact (with possible repetitions) for the
given selection have to be equal to the amount of combinations for Likelihood (with possible
repetitions), because in real cases we deal with all sub-components together.

57
Figure 8.
CVSS v2
CVSS Base Score consists of 6 sub-components each of which can take one of three values,
therefore there are 36 = 729 combinations possible.
Figure 9. Histogram for combinatorial number of Base Score values

58
The same data can be represented in the way when Base Scores are aggregated by 10 Risk Levels:
Figure 10. Number of Base Scores values aggregated by Risk Levels in CVSS v2
Please note that the upper border of each interval is not included, except [9; 10] interval, in order
to match the results with official statistics.
CVSS v3

59
Figure 11. Histogram for combinatorial number of Base Score values
The same data can be represented in the way when Base Scores are aggregated by 10 Risk Levels
(Figure 12):
Figure 12. Number of Base Scores values aggregated by Risk Levels in CVSS v3

60
Please note that the upper border of each interval is not included, except [9; 10] interval.
Conclusion to combinatorial analysis
The purpose of combinatorial analysis in this report is to retrieve data which can be compared
with the results of statistical analysis. The closer the statistical data will be to these theoretical
combinatorial results, it might indicate that the values of risk sub-components are equally
distributed. If statistical distribution does not follow combinatorial results, it might indicate
among other that evaluator is tend to pick one values more often than others (not necessarily
because of subjectivity thought, but for example because of specific definitions of risk factors).
This difference between combinatorial (theoretical data) and statistical (practical data) analysis
influence a lot on several of the important criteria that we will introduce in later chapters, such as
Rating Distribution and Rating Appropriateness.
It was interesting to check distributions of possible Risk Levels, because some of them such as
MS1 model precisely follows the normal probability distribution, because it mathematically
follows the ides. FC model still have the ‘bell curve’ shape, but with some deviations because it
puts different weights to different risk sub-components.
Such basic analysis allows us at least to “suspect” what might be wrong in the analyzed FC model.
The steps needed in this direction of study:
1. More grounded confirmation of the found results
2. The evaluation of the results
3. The same analysis in comparison to other models
4. How can those results be used to create an Improved FC model
5. Can the methods used for this analysis be a part of the desired methodology for risk
assessment models evaluation/comparison?
Statistical analysis
CVSS v2
There is available statistics for CVSS v2 at the official web-page [18], the histogram from there is
provided here without changes (at the state on 20.11.2015):

61
Figure 13. Distribution of CVSS Scores
Please note that the upper borders of the intervals are not included, except [9; 10] interval.
Figure xx represents the CVSS v2 Base Score for all vulnerabilities in the database [18], but the
similar pattern we can also see for different types of selections, e.g. by vendors or scores [19],
[20].
We can easily see few suspicious intervals, such as [6; 7), [8; 9), [9; 10].
The distribution at these intervals not only does not match to combinatorial distribution shape,
but raises such questions as:
why there are so many cases within the highest range of scores? Moreover, among 10439
vulnerabilities from the Highest range 5285 have the Score 10.0, and only 3 (!) have the score 9.7.
CVSS v3
CVSS v3 final release has appeared very recently, on June 10, 2015. We see the recency of the
model as one of the main reasons of absence of appropriate public available statistics that we can
use.
Nevertheless, later we will need to make an assumption, that the quality of the rating is High. We
believe that creators of CVSS v3 improved the model in comparison to CVSS v2, so our assumption
will be that rating distribution quality in CVSS v3 is at least higher than in CVSS v2. This
assumption can be confirmed when statistical data will be available.
FC model
We have 48 sets of values of risk sub-components for random found vulnerabilities.
By the fact that we have to deal with the given amount of data, we cannot get more data enough
for selection to be representative sample. We can only count the parameters for given amount.
Assuming that 1024 is general population (but generally it is not, because the examples in the set
can repeat), for the confidence interval is 13.82 , shouldn’t I use the Bayesian credible interval ? }

62
Figure 14. Distribution of values for each risk sub-component in selection for FC model
First of all, these results already show us that the different values of the same sub-factors are
unequal – by some reasons the evaluators tend to choose one value more often than another.
Some of these reasons were mentioned previously.
The most common values (in assumption they are independent):
3 * (2 + 1) + 2 * (2 + 2 + 2) = 9 + 12 = 21
21 / 12 = 1,75
The amount of RiskDREAD values in the selection:

63
Figure 15. The comparison between amount of different values of Impact and Likelihood in the
selection
Amount of Impact and Likelihood in the selection
Figure 16. Distributions of Impact and Likelihood derived from the selection
If we look at the Figure xx, it can be an explanation why in so many cases the Likelihood is equal
to 2. Because each of Likelihood sub-component (R, E, Di) is equal to 2 most often than to other
values.

64
Impact sub-components (Da and A) are balancing each other despite their values are not balanced
within each of them itself.
Conclusion about statistical analysis
The main idea was to compare the results of combinatorial analysis with respective statistical
data. Later we will use these results mainly for two criteria: Rating Distribution and Rating
Appropriateness. But we believe that these two criteria are among major and implementers of
Risk Assessment methodologies most probably will assign High importance weights to them.
OCTAVE Allegro
We are not performing such kind of analysis as above for OCTAVE Allegro.
First of all, OCTAVE Allegro does not define the factors and sub-components for calculation of the
Likelihood, therefore we do not even have an amount of sub-components to calculate possible
combinations.
{ OCTAVE Allegro does not prohibit to use additional extension for calculation of Likelihood taking
sub-components for it explicitly, e.g. from Table xx. }
Methodology for risk assessment models comparison
One approach:
Compare all models to the one chosen system. The “closer” is the comparable system, the
“better”.
This “chosen” model can be one well know and “good” model, or the newly built one with the
proven desired properties.
Second approach
Create the list of possible properties of the models and trying to compare them to each other, and
also compare the different sets of such properties.
Risk assessment models criteria
Understanding the FortConsult’s expectations from Risk Assessment model, analyzing the
properties of currently used FC model, considering criteria other researches mention [], [], we
become able to create a set of criteria which we believe can represent the most important
properties of models, and can be helpful for companies to make a grounded decision if they have
to change or implement a new model.
But, please be aware that the evaluation of the models according to these criteria can itself
involve its own subjectivity which is not covered by this chapter.

65
Relative and absolute criteria – depends if the property can be measured of described comparing
to other models, or independently.
But, even having such division, sometimes some absolute criteria can be not strictly absolute.
For purposes of the evaluation of Risk Assessment models according to these Criteria, we will use
the simple scale: Low, Medium and High. These levels show the degree of matching of model’s
property to each of criteria. In general, companies can implement their own scale depending on
their needs.
We will construct all the criteria in a way that Low level of matching to the criterion means
commonly undesirable property of the model, and opposite, High level of matching to the
criterion shows that the model is ‘good’.
Efforts needed to implement the model
It is a broad term, which involves , … -. But by the reason that estimation is qualitative, it is usually
easily seen which case the certain model belongs. For example, the use of OCTAVE is not possible
before Risk Measurement Criteria are established, which can be large amount of work.
It can be relative (?? E.g. for different sizes of organizations the cost will be different) – in the case
if another model is already integrated – then this criterion shows the amount of efforts needed to
make changes to use another model.
In our case, we want to use this criterion to compare several improved models to the current FC
model, and we want to take into account that it would be <better, faster, cheaper> to have less
changes.
The criterion can be also evaluated absolutely – if no another risk assessment methodology is
established.
“Efforts” here require a broad understanding – it is overall application of recourses needed for
implementation.
The criteria that we will choose will allow to understand what are the weaknesses and strengths
of each model.
Absolute criteria
Definitions and formalization
How well the model is described? Does it use the pre-defined well-structured terminology, or
ambiguous spoken language?
For example, FC model description is consistent, but the description is very brief and sometimes
relies on some common understanding of terms, but a bit another understanding can influence on
the result.
Risk perception and subjectivity

66
The use of several risk factors should reduce the risk subjectivity. *(how to prove that?)
If we take OWASP as an example, we see that use of only Business Impact can lead to the lower
Risk Severity than perhaps could seem initially, e.g. from the Technical Impact point of view.
Following the pre-defined methodology of risk assessment and approach of calculating each of
factors separately allows to decrease such subjectivity.
Risk subjectivity is on the one hand the property of certain risk assessment model, but on the
other hand there are other factors influencing on it. Such factors can include the correctness of
use of the model, evaluator’s attitude to the assessment process in general, etc. For now we are
not considering such factors, but want to emphasize that subjectivity-tendency property of the
model itself does not cover all the subjectivity involved in the process of risk assessment.
In the case with FortConsult we also does not want the situation when the client organization
following the same method ends up with results deviating a lot from the FortConsult’s results.
Distribution quality
The “right” distribution question is not obvious, but still in this criterion we can have some
characteristics related to the distribution. Of course, the way in which the company uses the
model, can influence on the distribution, but from the theoretical perspective it is still an absolute
criteria.
Rating appropriateness (Adequacy)
This is explanatory parameter which can generally describe the “average” appropriateness of the
model. For example, the rating cannot be flipped over in one model comparing to another,
otherwise at least one of these two model has very low adequacy.
Results comparability
The ability of the model to provide the scores that can be used externally without the need of
recalculation.
Efficiency without a tool
How much time/efforts/expertise needed to perform (one average) assessment, assuming that
the model is already implemented, but the implementation does not mean the use of automated
tool for risk calculations.
If we range the operations used in different models, e.g.:
1. Addition, Subtraction: +, - ; RoundUp, Minimum
2. Multiplication, Division: *, /
3. Exponentiation
Then we can build the prioritization of models’ efficiency based on the amount of these
operations used in the model.

67
Model # of +, -, etc. # of *, / # of ^ Risk matrix
MS1 4 0 0 -
MS2 4 1 0 -
FC model 4 3 0 -
OWASP 7 + 3 1 + 1 0 1
CVSS v2 6 8 0 -
CVSS v3 (Base score), Scope Unchanged
3 + 4 1 + 2 + 4 0 -
CVSS v3 (Base score), Scope Changed
3 + 3 + 4 1 + 2 + 2 + 4 1 -
OCTAVE Allegro
Table 32. Amount of mathematical operations in models
This table can be used for simple evaluation of model’s Efficiency (w/o a tool).
We also believe that the amount of operations partly influence on the Understandability of the
model.
Efficiency with a tool
How much time/efforts/expertise needed to perform (one average) assessment, assuming that
the model is already implemented, and the implementation require the use of automated tool for
risk calculations by an evaluator.
Understandable for customers
Partly relative criteria. On the one hand, this criterion depends on the simplicity of the model. On
the other hand, understandability of the same model can vary depending on the customer’s
ability to understand it, and also on the way how the evaluator’s company uses the model and
demonstrate its results.
Trustworthiness
The level of trust to the Risk Assessment methodology.
It is not necessary that high Trustworthiness means high level of such properties as Distribution
quality of Rating appropriateness. For example, CVSS v2 is widely used and we can with
confidence say that this methodology has high trustworthiness, even thought Distribution quality
for it is Middle.
Trustworthiness is not a static property, it can change through the time. For example,
Trustworthiness of MS DREAD models was most probably higher 12 years ago in comparison to
these days.
Flexibility
The ability of the methodology to be adjusted according to the needs of the implementer.

68
We already see that some of methodologies describe the ways how they can be changed if
needed. The change can even be obligatory, e.g. in OCTAVE Allegro the implementer needs to
introduce Risk Measurement Criteria specific for the organization.
(Official tool) Tool feasibility
This criterion generally means not only the presence and availability of the tool, but the ability to
create such tool if it is not available. If there is no tool, or it is expensive to buy or develop it, then
If, for example, company prioritize the Efficiency without a tool as High, and Efficiency with a tool
as Low, then this criterion might be not necessary for the evaluation of the methodology. If
Efficiency with a tool criterion has the higher weight, then the company has to take into account
the Tool feasibility criterion into account. The weight of this criterion will depend on the ability of
the company to buy or develop a tool.
Tool feasibility will probably influence on the Implementation Efforts criterion.
Relative criteria
Our main attention is at the absolute criteria, but we want to mention relative criteria also – for
the future reference, as well as to demonstrate the approach of alignment with ‘Good practices’.
Relative criteria (some are in alignment with ISO 31000):
1. Alignment of Risk Assessment model with company’s structure, roles, standards,
processes and other models, etc (ISO 31000 4.3.1.c-1, ISO 31000 4.3.1.c-7).
2. Acceptance of the model by the relevant employees, and by the company’s culture in
general. The model itself can be good, but the conservatism, laziness, concentration on
other tasks etc. can prevent company from its adoption (ISO 31000 4.3.1.a, ISO 31000
4.3.1.c-6, NISP SP 800-39 2.7).
3. Alignment of Risk Assessment model with company’s external obligations, e.g. contractual
(ISO 31000 4.3.1.c-8). In FortConsult case the model { have to be } appropriate to
FortConsult customers’ needs, accepted by them.
Other criteria and properties
Some papers, e.g. [50], [51] consider also properties mentioned in this paragraph. But, we do not
consider them as important to include into criteria set, because it will not influence (or influence a
lot, or should not influence) on the results. Below there are provided some of those properties
and brief explanation why they are not included into our criteria.
And those properties can also be divided by two categories: external and internal. External
properties does not concern model itself, but rather something about its use. Internal properties
are the ones of the model itself.
Such properties are:
1. External.
In general, external properties are not included into our Criteria set, because they are not

69
only out of the scope, but they do not influence or influence not sufficient on the evaluation
to become a criterion. We believe that the influence of internal properties of model is much
higher and mainly they have to be taken into account for models’ evaluation.
1.1. Price. Is the model description available for free? Or how much does it cost? Usually it
means if it is supposed to pay for the documentation (e.g. for ISO standards). In some
cases it can influence on Integration Efforts criterion, but we believe this influence is
relatively very low (price of document is usually not so high comparing to other costs
relevant to model implementation). The price of the tool (which might be more
expensive than the price of documentation) is not included here, see the Tool Feasibility
criterion.
1.2. Date of update (and date of first release). It is usually good when document is updated
and improved. But, for the purpose of Risk Assessment model evaluation – we ‘do not
care’. If it appears that the model last updated 10 years ago is ‘better’ than freshly
updated one according to other criteria, then we do not see how the date of update can
change this evaluation. For example, MS DREAD model was not updated for more than
10 years, but we compare it with modern models only looking at the model itself.
1.3. Geographical spread. This property of the model can maybe influence on reusability of
the model’s results. The more widely used is the model, the more there is a chance that
the client’s company is using the same model, and can integrate and accept the results in
easy way. But, we do not include the Reusability into Main Criteria set, and therefore,
the Geographical spread will also have no influence on the evaluation of the model.
1.4. Origin or sponsor. Categories can be e.g. Academic/Governmental/Commercial or
Public/Private.
1.5. Tool. We mention some tools, but we believe that this property can be included into
Implementation Efforts criterion if needed. Even if tool exists, the company most
probably would like to adapt or even re-write it.
2. Internal
2.1. Risk Identification. Our main focus is to prioritize the vulnerabilities that already have
been found by pentesters. It means that Risk Identification is out of the scope of this
project.
2.2. Quantitative vs Qualitative. We keep this property in mind and sometime mention it,
but on the other hand, the influence of this property on evaluation is not clear.
2.3. Results reusability (by clients). In general, this is very important property. But,
unfortunately it seems that the study of it lies outside the scope of this project, because
we do not have enough information about clients’ companies and their Risk Assessment
and Management methodologies. We can only live this criterion in the General Criteria
set for the purposes of future research.

70
Properties of Target Model
We combined here the criteria from the previous chapter to show how we see the target model,
and what expectations we have about it.
FC Target Model
One of the goals of our project is to improve the FC model if needed. It means that it requires
some of the relative criteria to be used. Taking into account the criteria we described, we can
formulate the following requirements for the Target Model for the needs of FortConsult:
1. Model is well defined or contains a guideline.
2. Low relative Integration Efforts.
3. Subjectivity resistance.
4. Proven “good”/appropriate distribution of possible values of Risk, and appropriate scales
for factors evaluation, and appropriate weights of risk factors. “Appropriate” means that
the prioritization of vulnerabilities is aligned with company’s needs, fits these needs.
5. Final ratings have to be appropriate to the needs of the company.
6. Extent of comparability of results, e.g. global (whoever make an assessment of any
vulnerability using the same model, the final results are comparable with each other) or
local (ranking according to the scores is valid only within e.g. one report).
7. Model have to be efficient enough to use, especially with using of the tool (approximately
the same simplicity as FC model).
8. Model have to be transparent to FC’s customers.
We can formulate this in the following table, which we will use later:
\ Absolute criterion or
property
Definitions and
formalization
Integration efforts
(easiness)
Subjectivity
resistance
Rating distribution quality
Rating adequacy
Results comparabil
ity
Efficiency w/o tool
Efficiency with a tool
Understandability by customers
Trustworthiness
Flexibility Official
tool
Values for Target Model
High High High High High Medium Middle High High Middle Middle Have to be
easy to implement
Table 33.
Desired Target Model
1. Easy to implement changes to the model (model’s flexibility). (this property is not the goal
of FortConsult, but will be needed by Absolute Target Model).
2. …
Situational importance of Criteria
Most probably Criteria will not be equal to each other by their Importance to company, which
uses them. Depending on the certain situation, and the certain company’s specifics, the
Importance of each criterion has to be evaluated separately or in comparison to other criteria.
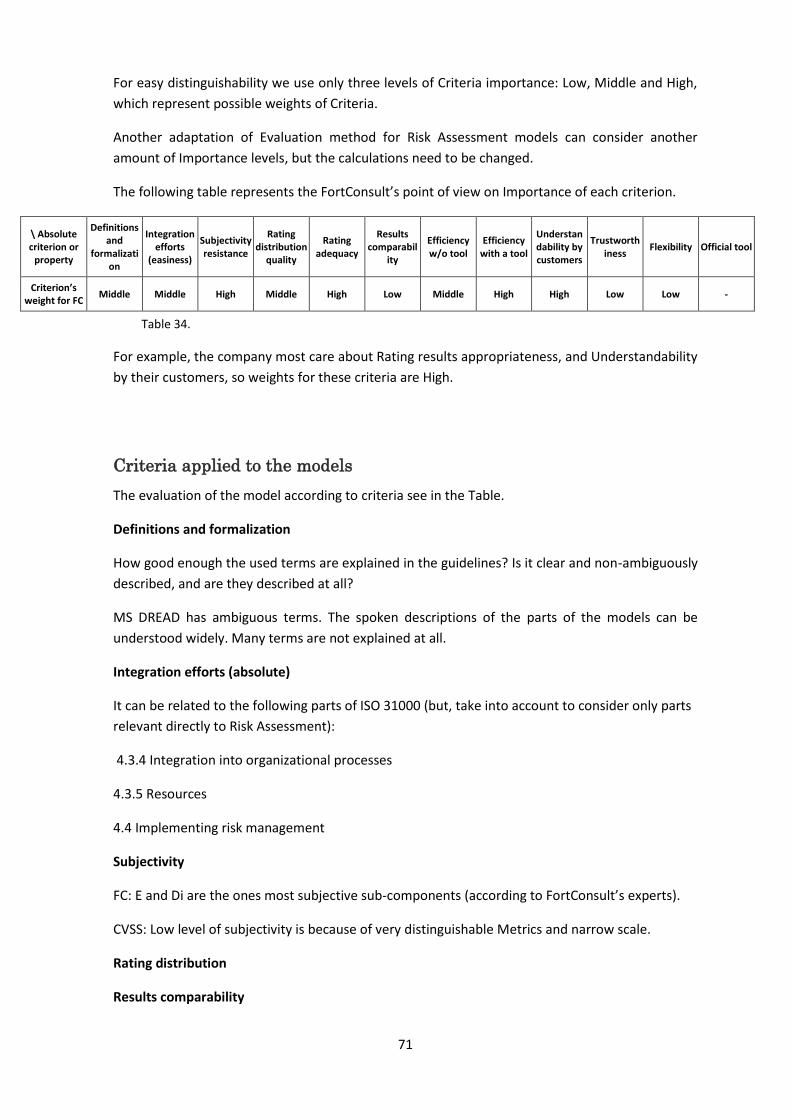
71
For easy distinguishability we use only three levels of Criteria importance: Low, Middle and High,
which represent possible weights of Criteria.
Another adaptation of Evaluation method for Risk Assessment models can consider another
amount of Importance levels, but the calculations need to be changed.
The following table represents the FortConsult’s point of view on Importance of each criterion.
\ Absolute criterion or
property
Definitions and
formalization
Integration efforts
(easiness)
Subjectivity resistance
Rating distribution
quality
Rating adequacy
Results comparabil
ity
Efficiency w/o tool
Efficiency with a tool
Understandability by customers
Trustworthiness
Flexibility Official tool
Criterion’s weight for FC
Middle Middle High Middle High Low Middle High High Low Low -
Table 34.
For example, the company most care about Rating results appropriateness, and Understandability
by their customers, so weights for these criteria are High.
Criteria applied to the models
The evaluation of the model according to criteria see in the Table.
Definitions and formalization
How good enough the used terms are explained in the guidelines? Is it clear and non-ambiguously
described, and are they described at all?
MS DREAD has ambiguous terms. The spoken descriptions of the parts of the models can be
understood widely. Many terms are not explained at all.
Integration efforts (absolute)
It can be related to the following parts of ISO 31000 (but, take into account to consider only parts
relevant directly to Risk Assessment):
4.3.4 Integration into organizational processes
4.3.5 Resources
4.4 Implementing risk management
Subjectivity
FC: E and Di are the ones most subjective sub-components (according to FortConsult’s experts).
CVSS: Low level of subjectivity is because of very distinguishable Metrics and narrow scale.
Rating distribution
Results comparability

72
CVSS: Base metrics suppose to be independent. Base score is used in published ratings.
Efficiency/simplicity*
How much time/efforts/expertise needed to perform (one average) assessment (assuming that
the model is already implemented).
Flexibility
The ability of model to be adjusted to the certain circumstances or environment.
MS DREAD: the model only allows to change scale and descriptions for risk factors.
FC: no changes allowed.
OWASP-R allows flexibility (Step 6), but it is up to the user to make and prove those changes. In
contrast to CVSS, where additional factors are well-described and integrated into the model, but
are not necessary.
OCTAVE Allegro: changes are necessary. They are made by developing Risk Measurement Criteria.

73
Absolute criterion or
property Model’s main characteristics
Definitions and
formalization
Integration efforts
Subjectivity Rating
distribution Rating
adequacy
Results comparabili
ty
Efficiency/simplicity*
Flexibility Official tool
w/o tool with a tool Understandable for
customers
Trustworthiness
MS DREAD Impact and Likelihood are not multiplied, but added
Low (Unclear)
Low High Low / Middle
High for the same versions
High High High Low Middle No
FC DREAD Impact and Likelihood are not multiplied, but added
Middle Low Medium Middle / High (?)
Low / Medium
High High High Middle Low In development
OWASP The final value depends totally only on one of the Impact areas: Business or Technical. Likelihood takes into account many of the standard factors.
High Low Medium Middle / High (?)
Low (with Business Impact), Middle/High (with Technical Impact)
Middle / High
High High Middle / High
Middle Exists, but limited
functionality
CVSS v2 No flexibility, but it is done to provide comparability of all results.
High Medium Low Middle / High
Medium/ High (Base Score)
Low / Middle
High Middle High Middle/High Yes
CVSS v3 Authorization Scope is used (Exploitable and Impact).
High Medium Low High High (Base Score)
Low / Middle
High Middle High Middle/High Yes
OCTAVE Allegro Needs to build Criteria and … in advance. Calculation of Risk Impact is more sophisticated then Probability. Probability assessment is very simplified.
High High Low High High (within organization)
Middle (?) Middle (?) Middle High Middle/High No (?)
NIST SP 800-30
Target Model 1. Low relative efforts 2. Subjectivity
resistance 3. Appropriate
distribution of Risk Levels
4. Comparability of results
High Low Low ? High Medium/ High
High Middle ?
High High - ?? High High ?
Table .
Among other here will be the explanation – what exactly makes each model’s criterion to have the certain value

74
Evaluation method for Risk Assessment models
Absolute evaluation
So, the criteria can be used in the way to provide a qualitative evaluation of model (precisely, a
set of qualitative assessments).
This evaluation does not depend on the context of organization, because it does not take into
account criteria weights.
Each line in the Table xx is an absolute evaluation for certain model, which already can be used for
purposes of model’s analysis.
Good example of when this method is usable is the comparison of properties of CVSS v2 and CVSS
v3. We can see that according to the Criteria the only difference is in Rating Appropriateness
(Middle vs. High).
Relative (situational) evaluation
Moreover, knowing the weight of each criterion and evaluation of the relative property of the
model, we can even build a method to use the criteria to make quantitative evaluation, which, for
example, can be used for prioritization.
If we bring the weights to all criteria, then it is even possible to build the formula for models’
prioritization.
Method 1
If we take the line of table from the previous Absolute Evaluation with the values of properties of
the model, and combine it with the line of Criteria’s importance – this can serve as situational
qualitative evaluation of the model. Even without numerical representation of these data, it can
say a lot about the model and answer some question implementer faces when deciding about the
model.
Method 2
Our proposition #2 is to use the following coefficients, which were found by empirical way {
Appendix – to explain how the ‘matrix’ was developed-:
The calculation depends both on the criterion’s weight and its value in the following way:
Value \ Criteria Minor Medium Prime
Low 0 -7 -16
Middle 1 5 15
High 2 13 31
Table

75
The first line of the following table contains the FC’s Situational Importance weights for each
criterion. They represent the company’s expectation from the model.
Using the mentioned way of calculation, we can find a Rating of each model that we consider.
* some of the values (such as Distribution quality) are just predicted, and will be adjusted later –
we need certain values for calculation.
For the explanation of way of constructing of Table xxx and possible changes to it see Appendix

76
Absolute criterion or property
Definitions and
formalization
Integration efforts
(easiness)
Subjectivity resistance
Rating distribution
quality
Rating adequacy
Results comparabilit
y
Efficiency w/o tool
Efficiency with a tool
Understandability by
customers
Trustworthiness
Flexibility Official tool Values of the
property
Criterion’s weight for FC
Middle Middle High Middle High Low Middle High High Low - ?? Low -
Values for FC model Middle High Medium Medium - ?? Middle Medium High High High Middle Low In
development
Values for MS1 model Middle High Low Middle Middle Medium High High High Low Middle No
Values for MS2 model Low High Low Middle Low Low High High High Low Middle No
Values for OWASP model
High High Medium Medium Middle Middle High High High Middle - ? Middle No (?)
Values for CVSS v2 model
High Medium High Middle Middle High (Base
Score) Low High Middle High High Yes
Values for CVSS v3 model
High Medium High Middle High High (Base
Score) Low High Middle High High Yes
Values for OCTAVE Allegro model
High Low High High High Middle Middle Middle Middle High Middle No (?)
Values for Target Model
High High High High High Medium Middle High High Middle Middle Have to be
easy to implement
Table xx. Values of properties according to criteria.
First line of this table shows the FC weights of criteria.

77
\ Absolute criterion or property
Definitions and
formalization
Integration efforts
(easiness)
Subjectivity resistance
Rating distribution
quality
Rating adequacy
Results comparabilit
y
Efficiency w/o tool
Efficiency with a tool
Understandability by
customers
Trustworthiness
Flexibility Rating
Criterion’s weight for FC
Middle Middle High Middle High Low Middle High High Low - ?? Low
Rating components for FC model
5 5 15 5 15 1 13 31 31 1 0 122
Rating components for MS1 model
5 5 -16 5 15 1 13 31 31 0 1 91
Rating components for MS2 model
-7 5 -16 5 -16 0 13 31 31 0 1 47
Rating components for OWASP model
13 13 15 5 15 1 13 31 31 1 1 139
Rating components for CVSS v2 model
13 5 31 5 15 2 -7 31 15 2 2 114
Rating components for CVSS v3 model
13 5 31 5 31 2 -7 31 15 2 2 130
Rating components for OCTAVE Allegro
model 13 -7 31 13 31 1 5 15 15 2 1 120
Rating components for Target Model
13 13 31 13 31 1 5 31 31 1 1 171
Table xx. Rating components for FC weights

78
In general, for 12 criteria (if weights are not defined), min/max are: [-192; 372].
For 11 criteria with FC’s weights, min/max are: *-92; 182].
Of course, the rating values are comparable only within the same set of criteria weights.
So, the rating by FC criteria is:
1. Target Model 171
2. OWASP-R 139
3. CVSS v3 130
4. FC model 122
5. OCTAVE Allegro 120
6. CVSS v2 114
7. MS1 model 91
8. MS2 model 47
* we accept and made a note before that the use of criteria is still subjective activity, but we tried
to reduce of the amount of levels and make them distinguishable, which should decrease the
subjectivity.
Analyzing this result of rating, we can notice that e.g. CVSS v2 was different from CVSS v3 only by
one parameter, but it was enough to go down by 3 lines in the rating. It means that models from 2
to 5 in the rating are in fact very close to their next one, but the method still allowed to
distinguish their appropriateness according to the company’s needs.
Of course, each company can build their own formula for Rating calculation, but they can still use
the described criteria.
For example, some can disagree that we only have 3 weights of each criterion, so some two
criteria which both have High importance, but one of them have to be higher than another. In this
case, the company can build their own calculation table, or use other method. For example, to
add extra coefficients in front of each criteria in calculation, such as 1.1 of higher coefficient for
the most critical criteria.

79
Examples of changes to the FC model
FC1 model
In the first, simplest change to the FC model we will only change the last equation in the Risk
Estimation step in the way that instead of:
RiskDREAD = ( IMPACT + LIKELIHOOD ) / 2
we will calculate:
RiskDREAD = IMPACT * LIKELIHOOD
But the equations for Impact and Likelihood we will leave the same { or to multiply by 6? }, not
concerning here the reason why sub-components have different weights:
IMPACT = (Da + A) / 2
LIKELIHOOD = (R + E + Di) / 3
According to our mathematical operations’ complexity rating (see …), the efforts for calculations
will be even less (* versus + and /), so theoretically is does not change the model’s complexity and
efficiency.
But, let us compare the results.
We do not expect totally different results, because this approach does not solve a lot of issues
that we mentioned, such as Risk Factors scaling and assigning the right quantitative value to each
risk sub-component. But, it can change the prioritization of some vulnerabilities.
we are going to take the real data and just to change the final calculation of RiskDREAD – and then
compare results of FC with results of FC1.
We expect that distribution can change, and Rating appropriateness also can change. The result
for appropriateness we expect to be confirmed by FC’s experts.
\ Absolute criterion
or property
Definitions and
formalization
Integration
efforts (easiness
)
Subjectivity
resistance
Rating distributi
on quality
Rating adequac
y
Results compara
bility
Efficiency w/o tool
Efficiency with a
tool
Understandability
by customer
s
Trustworthiness
Flexibility
Official tool
Criterion’s weight
for FC Middle Middle High Middle High Low Middle High High Low - ?? Low -
Values for FC model
Middle High Medium Medium -
?? Middle Medium High High High Middle Low
In develop
ment
Values for FC1 model
Middle High Medium Medium -
?? Middle Medium High High High Middle Low
In develop
ment
Table

80
Conclusion
We have collected information about MS DREAD model, which became a basis for FC model
creation.
We chose the methodologies mostly used for assessment of risks related with vulnerabilities,
explained and analyzed them.
We came to the understanding how the method for evaluation of risk assessment models can
look like. After that we have built the set of criteria which can be used for Risk Assessment
Models’ prioritization or independent evaluation of the model.
We made an evaluation of the properties of different models according to designed criteria.
We have also provided an approach for quantitative evaluation of risk assessment models for
given criteria weights.
In order to use the Criteria for model evaluation, the evaluator of the model needs to put weights
to all of those criteria, and to make evaluation of properties of the models they are
considering/comparing. Then the methodology will provide an answer which model fits better the
company’s needs, because these needs are represented by criteria and criteria’s weights.
We have developed a Generalized (but perhaps not complete) set of risk sub-components. This
set can be used to create a new Risk Assessment model, which will take into account factors
which (or their combinations) are not enough counted in other models.
We also outlined the directions of future work, taking into account feedback from FortConsult
about our findings, and their interest in further development of this project.
81
Further directions of work
FortConsult believes that there is a potential for further development of the findings of this paper.
The main directions in which the current findings can be improved are:
- Improvement the Criteria set, analyzing other possible criteria which were not taken into
account in this paper;
- Improvement of the quantitative method for models’ evaluation;
- Considering other Risk Assessment Methodologies for comparison and analysis;
- Taking more data for statistical analysis of FC model and other models, such as CVSS v3;
- Deciding about and performing other methods of the analysis of the models;
- Building other Risk Assessment models according to the certain needs with the help of
findings of this paper.

82
List of references
[1] Mackman, A., Dunner, M., Vasireddy, S., Escamilla, R., & Murukan, A. (2003). Improving web
application security: threats and countermeasures. Redmond, WA: Microsoft.
[2] Howard, M., & Leblanc, D. (2003). Writing Secure Code, Practical strategies and techniques for
secure application coding in a networked world. -2nd ed
[3] Howard, M., & LeBlanc, D. (2002). Writing secure code. Microsoft Press.
[4] Howard, M., & LeBlanc, D. (2007). Writing secure code for windows vista™. Microsoft Press.
[5] http://blogs.msdn.com/b/david_leblanc/archive/2007/08/13/dreadful.aspx (last visited on
19.11.2015)
[6] https://en.wikipedia.org/wiki/DREAD_%28risk_assessment_model%29 (last visited:
10.11.2015)
[7] Di, J., & Smith, S. (2007, April). A hardware threat modeling concept for trustable integrated
circuits. In Region 5 Technical Conference, 2007 IEEE (pp. 354-357). IEEE.
[8] The STRIDE Threat Model https://msdn.microsoft.com/en-
us/library/ee823878%28v=cs.20%29.aspx (last visited: 10.11.2015)
[9] F. Swiderski and W. Snyder, Threat Modeling, Microsoft Press, 2004.
[10] Caralli, R. A., Stevens, J. F., Young, L. R., & Wilson, W. R. (2007). Introducing octave allegro:
Improving the information security risk assessment process (No. CMU/SEI-2007-TR-012).
CARNEGIE-MELLON UNIV PITTSBURGH PA SOFTWARE ENGINEERING INST.
[11] Amoroso, E. G. Fundamentals of computer security technology. 1994. PTR Prentice Hall:
Englewood Cliffs, NJ, 15-29.
[12] OWASP Testing Guide v4
https://www.owasp.org/index.php/OWASP_Testing_Guide_v4_Table_of_Contents (last visited on
10.11.2015)
[13] OWASP Risk Rating Methodology
https://www.owasp.org/index.php/OWASP_Risk_Rating_Methodology (visited: 22.07.2015)
[14] Risk Rating Template Example in MS Excel
https://www.owasp.org/index.php/File:OWASP_Risk_Rating_Template_Example.xlsx (last visited
on 10.11.2015)
[15] CVSS v 2.0 Guide https://www.first.org/cvss/v2/guide (last visited on 20.11.2015)
[16] Common Vulnerability Scoring System v3.0: Specification Document
https://www.first.org/cvss/specification-document (last visited on 20.11.2015)
[17] Common Vulnerability Scoring System v3.0: Examples https://www.first.org/cvss/examples
(last visited on 20.11.2015)
[18] https://www.cvedetails.com/cvss-score-distribution.php (last visited on 20.11.2015)

83
[19] https://www.cvedetails.com/top-50-vendor-cvssscore-distribution.php (last visited on
18.11.2015)
[20] https://www.cvedetails.com/top-50-product-cvssscore-distribution.php (last visited on
18.11.2015)
[21] CVSS v2 Calculator https://nvd.nist.gov/CVSS-v2-Calculator (last visited on 09.11.2015)
[22] CVSS v3 Calculator https://www.first.org/cvss/calculator/3.0 (last visited on 06.11.2015)
[23] Implementation of CVSS v3 Calculator
https://www.first.org/_scripts/cvsscalc30_helptext.js?20150430 (last visited on 10.11.2015)
[24] https://en.wikipedia.org/wiki/CVSS (last visited on 18.11.2015)
[25] https://www.first.org/about (last visited on 18.11.2015)
[26] http://www.dhs.gov/national-infrastructure-advisory-council (last visited on 18.11.2015)
[27] http://www.kb.cert.org/vuls/html/fieldhelp#metric (last visited on 18.11.2015)
[28] Peltier, T. R. (2005). Information security risk analysis. CRC press.
[29] Information security risk analysis, Third Edition, 2010 - Peltier, Thomas R
[30], [NIST SP 800-30] NIST, S. (2012). 800-30 Revision 1, Guide for Conducting Risk Assessments.
[31], [NIST SP 800-39] NIST, Special Publication 800-39, March 2011. Managing Information
Security Risk
[32] NIST, Special Publication 800-53Ar4
[33], [NIST SP 800-115] NIST Special Publication 800-115
[34] NIST National Vulnerability Database (NVD) https://nvd.nist.gov/ (last visited on 18.11.2015)
[35] DHS Risk Steering Committee. (2010). DHS risk lexicon. Washington, DC: The Department of
Homeland Security.
[36] Caralli, R. A., Stevens, J. F., Young, L. R., & Wilson, W. R. (2007). Introducing octave allegro:
Improving the information security risk assessment process (No. CMU/SEI-2007-TR-012).
CARNEGIE-MELLON UNIV PITTSBURGH PA SOFTWARE ENGINEERING INST.
[37] FortConsult’s Risk Assessment model description
[38] FortConsult anonymized report #1
[39] FortConsult anonymized report #2
[40] FortConsult anonymized report #3
[41] ISO, I. (2009). 31000: 2009 Risk management–Principles and guidelines. International
Organization for Standardization, Geneva, Switzerland.
[42] IEC, I. (2009). ISO 31010: 2009-11. Risk management–Risk assessment techniques.

84
[43], [ISO/IEC 27000:2009] ISO/IEC 27000:2009. Information technology -- Security techniques --
Information security management systems -- Overview and vocabulary
[44], [ISO/IEC 27000:2014] ISO/IEC 27000:2014. Information technology -- Security techniques --
Information security management systems -- Overview and vocabulary
[45] ISO/IEC 27001:2013. Information security management
[46], [ISO/IEC 27005:2011] ISO/IEC 27005:2011. Information technology -- Security techniques --
Information security risk management
[47], [ISO Guide 73] Guide, I. S. O. (2009). 73: 2009: Risk management vocabulary. International
Organization for Standardization.
[48] Brock, J., Boltz, J., Doring, E., & Gilmore, M. (1999). Information security risk assessment
practices of leading organizations.
[49] https://www.pcisecuritystandards.org/security_standards/ (last visited on 20.11.2015)
[50] Kiran, K. V. D., Reddy, D. L., & Haritha, N. L. (2013). A Comparative Analysis on Risk
Assessment Information Security Models. International Journal of Ccomputer Applications, 82, 41-
46.
[51] Ionita, D. (2013). Current established risk assessment methodologies and tools.

85
Appendix A
Let us take an example:
Da == 0
A == 0
R, E, Di == 1, 2
So, we compare the same values of different components, e.g. if the same Risk_DREAD (e.g. ==
1/6, i.e. all components are 0, and one of R, E, Di == 1 ), so we will have the same Risk Level (for
the same asset) – so it means that the situation { R == 1, E == 0, Di == 0 } should be equal to the
situation { R == 0, E == 1, Di == 0 } and { R == 0, E == 0, Di == 1 }, because the Risk Value is the same
in these three cases.
Obviously the same risk in such situation will be not only in the case { Da == 0, A == 0 }, but for any
fixed Impact value.
So, for the same Impact FC model claims that the risks with the following factors are equal:
R == 1 Valid credentials to the system
E == 0 Advanced programming
and networking knowledge Custom or advanced attack
tools
Depends on other vulnerabilities being
present which have not been discovered
Di == 0 Very hard to impossible; requires source code, administrative access or classified
information
Intentional skilled and resourceful attacker (organized crime or government)
Table
In this case it is extremely hard to discover a vulnerability, even thought to exploit it we do not
need the physical access to the target. But, how can an attacker reproduce an attack which he
hardly can discover and hardly can exploit? (low probability)
R == 0 Physical access to target machine
E == 1 Requires victim’s intervention, possibly through social engineering
Di == 0 Very hard to impossible; requires source code, administrative access or classified
information
Intentional skilled and resourceful attacker (organized crime or government)
Table
It is still extremely hard to find a vulnerability, even though it is a bit easier to exploit it. But, how
can an attacker exploit something he is not able to discover? (low probability)
R == 0 Physical access to target machine
E == 0 Advanced programming
and networking knowledge Custom or advanced attack
tools
Depends on other vulnerabilities being
present which have not been discovered

86
Di == 1 Hard; requires partial knowledge of
internal structure, or involves guessing Intentional skilled attacker (hacker)
Table
An attacker have bigger chance to find a vulnerability, even though there are “strict”
requirements for exploitability.
The main points of this example is to show, that in order to perform any attack, an attacker have
to discover it first, and only after that try to exploit it. Which means that the sequence is Di -> E ->
R, and therefore the probability of mentioned sets () are not equal, because:
P { R == 1, E == 0, Di == 0 } = P { R == 1, E == 0 | Di == 0 } * P { Di == 0 }
P { R == 0, E == 0, Di == 1 } = P { R == 0, E == 0 | Di == 1 } * P { Di == 1 }
Where the condition Di == 1 obviously have higher probability than Di == 0.
but perhaps the problem was not so obvious in practice because not so extreme examples does
not appear – see statistical analysis.

87
Appendix B. Glossary
Note: some of the terms have several definitions by the reason that it is not always possible to
construct the universal term for different risk assessment methodologies and for different
applications of terms that we require. Such terms have numbers in definitions, and in case if other
definition for the same term is needed than the default one (1st is used by default), we denote it
with the index number in round brackets, e.g. the term Risk(2) has the definition ‘Combination of
the probability of an event and its consequence’, in comparison to Risk(1) (default meaning), which
has the definition ‘Effect of uncertainty on objectives’.
In addition, for the convenience each definition refers to the source from which it was taken.
Attacker, Adversary [NIST SP 800-30]
Individual, group, organization, or government that conducts or has the intent to conduct detrimental activities.
*Note: we use the term ‘Attacker’ in this paper as synonym to ‘Adversary’.
Availability [ISO/IEC 27000:2014]
Property of being accessible and usable upon demand by an authorized entity.
Confidentiality [ISO/IEC 27000:2014]
Property that information is not made available or disclosed to unauthorized individuals, entities, or processes.
Information Security Risk [NIST SP 800-30]
The risk to organizational operations (including mission, functions, image, reputation), organizational assets, individuals, other organizations, and the Nation due to the potential for unauthorized access, use, disclosure, disruption, modification, or destruction of information and/or information systems. See Risk.
Information System-Related Security Risks [NIST SP 800-30]
Risk that arises through the loss of confidentiality, integrity, or availability of information or information systems considering impacts to organizational operations and assets, individuals, other organizations, and the Nation. A subset of Information Security Risk. See Risk.
Information Security Testing [NIST SP 800-115]
The process of validating the effective implementation of security controls for information systems and networks, based on the organization’s security requirements.
Integrity [ISO/IEC 27000:2014]
Property of accuracy and completeness
Penetration Testing, Pentest [NIST SP 800-115]
Security testing in which evaluators mimic real-world attacks in an attempt to identify ways to circumvent the security features of an application, system, or network. Penetration testing often involves issuing real attacks on real systems and data, using the same tools and techniques used by actual attackers. Most penetration tests involve looking for combinations of vulnerabilities on a single system or multiple systems that can be used to gain more access than could be achieved through a single vulnerability.
Qualitative Risk Assessment
Use of a set of methods, principles, or rules for assessing risk based on nonnumerical categories or levels.

88
[NIST SP 800-30]
Quantitative Risk Assessment [NIST SP 800-30]
Use of a set of methods, principles, or rules for assessing risks based on the use of numbers where the meanings and proportionality of values are maintained inside and outside the context of the assessment.
Risk 1. Effect of uncertainty on objectives [ISO/IEC 27005:2011, ISO Guide 73, ISO/IEC 27000:2014]
2. Combination of the probability of an event and its consequence [ISO/IEC 27000:2009]
3. A measure of the extent to which an entity is threatened by a potential circumstance or event, and typically a function of: (i) the adverse impacts that would arise if the circumstance or event occurs; and (ii) the likelihood of occurrence. See Information System-Related Security Risk. [NIST SP 800-30]
Risk Analysis [ISO/IEC 27000:2009]
Systematic use of information to identify sources and to estimate risk
Risk Assessment 1. Overall process of risk analysis and risk evaluation [ISO/IEC 27000:2009]
2. overall process of risk identification, risk analysis and risk evaluation [ISO/IEC 27000:2014], [ISO/IEC 27005:2011]
Risk Assessment Methodology [NIST SP 800-30]
A risk assessment process, together with a risk model, assessment approach, and analysis approach.
Risk Criteria [ISO/IEC 27000:2009]
Terms of reference by which the significance of risk is assessed
Risk Estimation [ISO/IEC 27000:2009]
Activity to assign values to the probability and consequences of a risk
Risk Evaluation [ISO/IEC 27000:2009]
Process of comparing the estimated risk against given risk criteria to determine the significance of the risk
Risk Factor [NIST SP 800-30]
A characteristic used in a risk model as an input to determining the level of risk in a risk assessment
Risk Model [NIST SP 800-30]
A key component of a risk assessment methodology (in addition to assessment approach and analysis approach) that defines key terms and assessable risk factors.
Threat 1. Potential cause of an unwanted incident, which may result in harm to a system or organization [ISO/IEC 27000:2014]
2. Any circumstance or event with the potential to adversely impact organizational operations (including mission, functions, image, or reputation), organizational assets, individuals, other organizations, or the Nation through an information system via unauthorized access, destruction, disclosure, or modification of information, and/or denial of service. [NIST SP 800-30]

89
Semi-Quantitative Assessment [NIST SP 800-30]
Use of a set of methods, principles, or rules for assessing risk based on bins, scales, or representative numbers whose values and meanings are not maintained in other contexts.
Version Scanning [NIST SP 800-115]
The process of identifying the service application and application version currently in use.
Vulnerability 1. Weakness of an asset or control that can be exploited by one or more threats [ISO/IEC 27000:2014]
2. Weakness in an information system, system security procedures, internal controls, or implementation that could be exploited by a threat source. [NIST SP 800-30]
Vulnerability Assessment [NIST SP 800-30]
Systematic examination of an information system or product to determine the adequacy of security measures, identify security deficiencies, provide data from which to predict the effectiveness of proposed security measures, and confirm the adequacy of such measures after implementation.
90
Appendix C. Abbreviations
CIA Confidentiality, Integrity, Availability
CVSS Common Vulnerability Scoring System
DREAD Damage, Reproducibility, Exploitability, Affected users, Discoverability
FC FortConsult A/S
FIRST Forum of Incident Response and Security Teams
MS Microsoft Corporation
NIST National Institute of Standards and Technology
NVD NIST National Vulnerability Database
OCTAVE Operationally Critical Threat, Asset, and Vulnerability Evaluation
OWASP Open Web Application Security Project
STRIDE Spoofing identity, Tampering with data, Repudiation, Information disclosure, Denial of service, Elevation of privilege

91
Appendix D. Generalized risk sub-components
Using this table, we can easily answer, for example, the questions if the certain model takes into account the certain risk factor, which is counted by another
model.
MS1 DREAD MS2 DREAD FC DREAD OWASP CVSS v2 CVSS v3 OCTAVE Allegro
Impact (Impact Area)
Business Reputation Asset criticality + Collateral Damage Potential (CDP)
+
Financial + +
Productivity +
Safety / Healh +
Fine / Legal Non-compliance +
User defined Privacy violation +
Technical (and other?)
Confidentiality Da Da + +
Integrity Da Da + +
Availability Da Da + +
Accountability Da Da +
Likelihood Attack Vector R Access Vector + Overall Risk Probability (Low/Neutral/High)
Attack complexity
R Attack complexity
Reproducibility (time)
R R? Attack complexity
Attacker skills E E Skill level
Attacker motivation
Motive

92
ExploitCode Maturity
+ Ease of exploit Exploitability
Remediation Level
Step 5 + +
Report Confidence
+ +
Severity Asset criticality Informal Method Confidentiality Requirement
Confidentiality Requirement
Impact Value Low/Moderate/High
A Repeatable Method
Integrity Requirement
Integrity Requirement
Availability Requirement
Availability Requirement
Target Distribution
Table
Impact category mainly describes the type of impact, while Severity category contain sub-factors which define the extent of impact.

93
Appendix E. The construction of calculation method for risk model’s rating
If somebody prefer a scale starting from 0 to eliminate negative numbers, then he have to build a
calculation table putting a 0 value to the case “High criterion’s priority + Low value”, because it is a kind
of ‘worst case’ for the certain criterion. Then the calculation will be something like that:
Value \ Criteria Minor Medium Prime
Low 16 9 0
Middle 17 21 31
High 18 29 47
Table
But, this calculation table might harder to extend if more (or less) than 3 levels of Criteria importance is
needed, or it can be just not convenient to extend it in the left direction.