information security breaches survey 2015 – full report · pdf fileinformation security...
TRANSCRIPT
2015 INFORMATION SECURITY BREACHES SURVEY Technical Report Survey conducted by
In association with


INFORMATION SECURITY BREACHES SURVEY 2015 | technical report 3
Commissioned by:
The UK Cyber Security Strategy published in November 2011, sets out how the UK will support economic prosperity, protect national security and safeguard the public’s way of life by building a more trusted and resilient digital environment. The National Cyber Security Programme, backed up by £860 million of Gov-ernment investment over 5 years to 2016, supports meet the objectives of the strategy www.gov.uk/government/policies/cyber-security.
Conducted by:PwC helps organisations and individuals create the value they’re looking for. We’re a network of firms in 157 countries with more than 195,000 people who are committed to delivering quality in assurance, tax and advisory services. Find out more and tell us what matters to you by visiting us at www.pwc.com. Our cyber security practice includes more than 150 dedicated specialists in the UK, and more than 1,700 across our international network. Our integrated approach recognises the multi-faceted nature of cyber and information security, and draws on specialists in process improvement, value management, change management, human resources, forensics, risk, and legal. PwC has a world class reputation for its technical expertise and strong cyber security skills in strategy, assessment, design and implementation services.
The PwC team was led by Andrew Miller, Richard Horne and Chris Potter. We’d like to thank all the survey respondents for their contribution to this survey.
In association with:
Infosecurity Europe, celebrating 20 years at the heart of the industry in 2015, is Europe’s number one Information Security event. Featuring over 350 exhibitors, the most diverse range of new products and services, an unrivalled education programme and over 12,000 visitors from every segment of the industry, it is the most important date in the calendar for Information Security professionals across Europe. Organised by Reed Exhibitions, the world’s largest tradeshow organiser, Infosecurity Europe is one of four Infosecurity events around the world with events also running in Belgium, Netherlands and Russia. Infosecurity Europe runs from the 2 June – 4 June 2015, at the Olympia, London. For further information please visit www.infosecurityeurope.com.
Reed Exhibitions is the world’s leading events organizer, with over 500 events in 41 countries. In 2012 Reed brought together seven million active event participants from around the world generating billions of dollars in business. Today Reed events are held throughout the Americas, Europe, the Middle East, Asia Pacific and Africa and organized by 34 fully staffed offices. Reed Exhibitions serves 44 industry sectors with trade and consumer events and is part of the Reed Elsevier Group plc, a world-leading publisher and information provider. www.reedexpo.com.
Information security: The preservation of the confidentiality, integrity and accessibility of information. In addition, other properties such as authenticity, accountability, non-repudiation and reliability can be involved.

4 INFORMATION SECURITY BREACHES SURVEY 2015 | technical report
Ed Vaizey MPMinister for Culture and the Digital Economy
CONTENTS
EXECUTIVE SUMMARY 6-9
1 INCIDENTS AND BREACHES 1.1 Trends in data breach 10 1.2 Types of data breach 11 1.3 Staff use and misuse of systems 13 1.4 Identifying infiltration 16 1.5 Reporting 18
2 COSTS AND CONSEQUENCES 2.1 Where is the investment in cyber security going? 19 2.2 The reputational impact of a breach 20 2.3 The most disruptive incidents 21 2.4 Cost of dealing with security incidents 21 2.5 Responding to security incidents 23
3 ATTITUDES AND TRENDS 3.1 What is driving information security expenditure? 24 3.2 The changing patterns of security expenditure 25 3.3 Where do organisations go for advice and assurance? 26 3.4 Is Cyber insurance properly understood? 28
4 ASSURANCE AND EFFECTIVENESS 4.1 Mobile devices - risk awareness and policy 29 4.2 How effective is security policy? 31
5 APPENDIX 32-48
We live in an inter-connected world that we could not have imagined even two decades ago. While it brings almost limitless opportunities, there are also threats. It is absolutely vital that the applications and connections we use are as secure as possible.
We want the UK to be one of the safest places to do business in cyber space. There are many ways we can achieve this ambition. But we cannot make progress unless we share as much information as possible about the threats we face. So we want to produce reliable information about cyber security breaches and make it publicly available. I welcome the fact that so many organisations across the UK have shared their experiences in this year’s Information Security Breaches Survey, which is a key commitment in the Government’s National Cyber Security Strategy.
As the number and cost of breaches have risen this year, it is encouraging to see the steps some businesses are taking to improve their cyber security. However, there is clearly a lot more Government and industry can do to continue tackling this issue. Last year, the Government launched the Cyber Essentials scheme. Nearly half of businesses surveyed have either already implemented it or plan to do so. If you use these basic technical controls, you can protect yourself against the most common cyber attacks. All businesses and organisations should adopt the scheme as a vital first step – no ifs or buts.
Of course, many businesses and organisations will need to have in place far more controls and procedures to manage the risks they face, and we will continue to work with them to make this happen.
The Government’s ongoing efforts to protect and enhance the UK in cyber space will be informed by the information in this report.

INFORMATION SECURITY BREACHES SURVEY 2015 | technical report 5
Survey approach
This is the latest of the series of Information Security Breaches Surveys, carried out since the early 1990s. PwC carried out the survey, analysed the results and produced the report; InfoSecurity Europe assisted with marketing the survey.
To maximise the response rate and reduce the burden on respondents, this year’s survey questions continued to be divided into two online questionnaires and ‘sticky sessions’ were introduced to help increase the quality of the raw data by reducing incomplete responses and potential duplication. We removed some past questions that were no longer so important and added a few additional questions to reflect current concerns or key topics within cyberspace.
In total, there were 664 respondents. As with any survey of this nature, we would not necessarily expect every respondent to know the answers to every question. For consistency and presentational reasons we have removed the ‘Don’t Knows’ and ‘Not Applicable’. Please note that the analysis methodology is consistent with prior surveys enabling the identification and analysis of trends.
Due to the nature of the survey, the number of responses varies by question. We have included against each figure in the report the number of responses received to the relevant question(s). This provides a good guide to the margin of error from sampling error to apply when extrapolating the results. As with any self-select survey of this nature, extrapolation to the wider population should be treated with caution.
The calculation of the percentages within the report is based only on those organisations who knew the answer to the relevant question(s) and also responded to that question. Therefore, wherever this report refers to “x% of organisations”, this should be interpreted as “x% of organisations who knew the answer to the question and responded to it”.
In what sector was each respondent’s main business activity?
(Based on 664 responses)
Agriculture
Banking
Distribution
Education
Government
Health
Insurance
Manufacturing
Media
Other financial services
Pharmaceutical
Property and construction
Retail
Services
Technology
Telecommunications
Utilities, energy and mining
Other
4.5
19
1
5.4
7.2
3.62.9
19.1
6.92.62.7
1.55.9
0.72.6
3.5
1.5
36.2
0.2
Consultancy andprofessional services
Travel, leisure andentertainment
All values displayed are percentages
How many staff did each respondent employ in the UK?
(Based on 661 responses)
0
20
40
60
80
100%
18%
500 or more employees
250-499 employees
50-249 employees
10-49 employees
Less than 10 employees
ISBS 2015 ISBS 2014
10% 13%
17%20%
49%
9%
43%
7%
14%
For example, where a figure shows “50% of small organisations spent up to £999 cash to recover from their worst security incident of the year” this should be interpreted as “50% of small organisations who disclosed their worst security incident and knew how much cash they had spent to recover from their worst security incident spent up to £999”.
As in the past, we have presented the results for large organisations (more than 250 employees) and small businesses (less than 50 employees) separately. The results for medium sized businesses (50-249 employees) are similar to the results for the small ones unless stated otherwise and we have explained in the text any differences seen. The 2008 and earlier surveys quoted overall statistics based on a weighted average; these were virtually identical to the results for small businesses.
Respondents came from all industry sectors, with a sector breakdown that is consistent with that seen in previous surveys. As in 2014, approximately a third of the respondents were IT professionals, and the remainder were business managers, executives, non-executive directors. This year’s highest response rates were once again from organisations headquartered in London or the South-East of England; these made up roughly half of the respondents.

6 INFORMATION SECURITY BREACHES SURVEY 2015 | technical report
EXECUTIVE SUMMARY
Security breaches levels rise againThere has been an increase in the number of both large and small organisations experiencing breaches, reversing the slight decrease found in last year’s report. 90% of large organisations reported that they had suffered a security breach, up from 81% in 2014.
90% of large organisations
74% of small businesses
had a security breach.
s Up from 81% a year ago.s Up from 60% a year ago.
Small organisations recorded a similar picture, with nearly three-quarters reporting a security breach; this is an increase on the 2014 and 2013 figures.
59% of respondents expect there will be more security incidents in the next year than last.
The majority of UK businesses surveyed, regardless of size, expect that breaches will continue to increase in the next year. The survey found 59% of respondents expected to see more security incidents. Businesses need to ensure their defences keep pace with the threat.
14 for large organisations
4 for small businesses
is the median number of breaches suffered in the last year.
t Down from 16 a year ago.t Down from 6 a year ago.
The median number of breaches suffered in 2015 by large and small organisations has not moved significantly from 2014.
Cost of breaches continue to soarThe average cost of the worst single breach suffered by organisations surveyed has gone up sharply for all sizes of business. For companies employing over 500 people, the ‘starting point’ for breach costs – which includes elements such as business disruption, lost sales, recovery of assets, and fines & compensation - now commences at £1.46 million, up from £600,000 the previous year. The higher-end of the average range also more than doubles and is recorded as now costing £3.14 million (from £1.15 in 2014).
£1.46m - £3.14mis the average cost to a large organisation
£75k - £311kis the average cost to a small business
of its worst security breach of the year.
s Up from £600k - £1.15m a year ago.s Up from £65k - £115k a year ago.
Small businesses do not fare much better – their lower end for security breach costs increase to £75,200 (from £65,000 in 2014) and the higher end has more than doubled this year to £310,800.
Organisations continue to suffer from external attacksWhilst all sizes of organisations continue to experience external attack, there appears to have been a slow change in the character of these attacks amongst those surveyed. Large and small organisations appear to be subject to greater targeting by outsiders, with malicious software impacting nearly three-quarters of large organisations and three-fifths of small organisations. There was a marked increase in small organisations suffering from malicious software, up 36% over last years’ figures.
69% of large organisations
38% of small businesses
were attacked by an unauthorised outsider in the last year.
s Up from 55% a year ago.s Slightly up from 33% a year ago.
Better news for business is that ‘Denial of service’ type attacks have dropped across the board, continuing the trend since 2013 and giving further evidence that outsiders are using more sophisticated methods to affect organisations.

INFORMATION SECURITY BREACHES SURVEY 2015 | technical report 7
30% of large organisations
16% of small businesses
were hit by DoS attacks in the last year.
t Down from 38% a year ago.= The same as 16% a year ago.
The Human FactorStaff-related breaches feature notably in this years’ survey. Three-quarters of large organisations suffered a staff-related breach and nearly one-third of small organisations had a similar occurrence (up from 22% the previous year).
75% of large organisations
31% of small businesses
suffered staff related security breaches in the last year.
s Up from 58% a year ago.s Up from 22% a year ago.
When questioned about the single worst breach suffered, half of all organisations attributed the cause to inadvertent human error.
50% of the worst breaches in the year were caused by inadvertant human error.
s Up from 31% a year ago.
“The Ten Steps” guidance and Cyber Essentials build on previous years progressThe percentage of organisations using the HMG “Ten Steps to Cyber Security” increased from just over one-quarter in 2014 to almost one-third in 2015. Allied to this was an increase in organisations using Government alerts to inform their awareness of threats and similar vulnerabilities.
32% of respondents use the Ten Steps guidance.
s Up from 26% a year ago.
The survey also found that nearly half of all organisations are badged to the HMG Cyber Essentials and Cyber Essentials Plus scheme, are on their way to accreditation or plan to be badged. ISO27001 remains the leading standard for security management.
49% of respondents badged to Cyber Essentials or Cyber Essentials Plus, on their way to accreditation or plan to be badged.
Understanding, communication and effective security awarenessThe organisations surveyed continue to place importance on security awareness training. For large organisations, ongoing security training has increased since the 2013 figure of 58%, up to this year’s figure of 72%; for small organisations, there has been an increase of a similar order of magnitude, up from 48% in 2013 to 63% this year.
72% of large organisations
63% of small businesses
provide ongoing security awareness training to their staff.
s Up from 68% a year ago.s Up from 54% a year ago.
14% of respondents have never briefed their board on security risks.
Furthermore, 21% of organisations have not briefed their board in the last year.

8 INFORMATION SECURITY BREACHES SURVEY 2015 | technical report
33% of large organisations say responsibilty for ensuring data is protected is not clear.
However, 26% of organisations stated that responsibility for ensuring data is protected is very clear.
72% of companies where the security policy was poorly understood had staff related breaches.
There is a slight increase in the percentage of organisations where senior management is viewed as giving information security a ‘high’ or ‘very high’ priority.
82% of respondents report that their senior management place a high or very high priority to security.
s Up from 79% a year ago.
However, in some circumstances, respondents cited that a ‘lack of priority’ from senior management was a contributing factor in their single worst breach.
28% of the worst security breaches were caused partly by senior management giving insufficient priority on security.
s Up from 7% a year ago.
Information security expenditure levelling outThere is a difference in levels of security spending between organisations, based on their relative size. 44% of large organisations increased their information security expenditure, whereas in 2014, it was over half. Looking to the future, 46% of large firms expected Information Security expenditure to increase in the coming year – less than the 2014 prediction.
Small organisations reported a slightly different picture: 44% increased their information security expenditure, which is up from the previous year. However, only 7% of small firms believed that information security expenditure would increase in the coming year - significantly down from the previous year’s expectations.
44% of large organisations
44% of small businesses
increased information security spend in the last year.
t Down from 53% a year ago.s Up from 27% a year ago.
46% of large organisations
7% of small businesses
expect information security spend to increase in the next year.
t Down from 51% a year ago.t Down from 42% a year ago.
The Telecoms sector had a sharp increase – more than doubling the percentage of their IT budget spent on security from 13% in 2014 to 28% in 2015.
Financial Services, Professional Services, and Property and Construction had levels of spending broadly in line with 2014 figures.
The survey uncovered that nearly one third of organisations had not conducted any form of security risk assessment on their enterprise. This reverses the trend of the past two years and questions whether businesses have the skills or experience to perform these to an adequate degree.
32% of respondents in 2015 haven’t carried out any form of security risk assessment.
s Up from 20% a year ago.
60% of respondents are confident they have sufficient security skills to manage their risks next year.
= Similar to 59% a year ago.

INFORMATION SECURITY BREACHES SURVEY 2015 | technical report 9
26% of respondents don’t evaluate how effective their security expenditure is.
t Down from 33% a year ago.
Businesses need to manage the risks associated with new technologyInnovation often brings new risks; there has been an increase in information security breaches caused, or enabled by technology meant to improve productivity and increase collaboration.
13% of large organisations had a security or data breach in the last year relating to social network sites.
= Similar to 12% a year ago.
15% of large organisations had a security or data breach in the last year involving smartphones or tablets.
s Up from 7% a year ago.
7% of respondents had a security or data breach in the last year relating to one of their cloud computing services.
= Similar to 5% a year ago.
3% of worst breaches were due to portable media bypassing defences.
t Down from 10% a year ago.
Organisations are seeking new ways to manage security risksThe difference between the higher levels of uptake of cyber threat intelligence and cyber liability insurance coverage reflects the different rates of maturity across industry of how security risks are managed. Although there appears to be a large drop in insurance coverage, this may be due to a greater understanding of the cover provided by standard business disruption insurance policies in the event of an information security breach.
39% of large organisations
27% of small businesses
have insurance that would cover them in the event of a breach.
t Down from 52% a year ago.t Down from 35% a year ago.
63% of respondents currently invest in or plan to invest in threat intelligence (actively monitor cyber threats to their organisations).
t Slightly down from 69% a year ago.
Key observations of the year1. The number of security breaches has increased, the
scale and cost has nearly doubled. Eleven percent of respondents changed the nature of their business as a result of their worst breach.
2. Not as many organisations increased their spending in information security, and fewer organisations than in previous years expect to spend more in the future.
3. Nearly 9 out of 10 large organisations surveyed now suffer some form of security breach – suggesting that these incidents are now a near certainty. Businesses should ensure they are managing the risk accordingly.
4. Despite the increase in staff awareness training, people are as likely to cause a breach as viruses and other types of malicious software.
5. When looking at drivers for information security expenditure, ‘Protecting customer information’ and ‘Protecting the organisation’s reputation’ account for over half of the responses.
6. The trend in outsourcing certain security functions and the use of ‘Cloud computing and storage’ continue to rise.

10 INFORMATION SECURITY BREACHES SURVEY 2015 | technical report
1 INCIDENTS AND BREACHES1.1 Trends in data breach
There has been an increase for both large and small organisations suffering breaches. Overall, 90% of large organisations and 74% of small organisations reported that they had suffered any form of security breach. This represents a 9% year on year increase for large organisations, and over 20% for smaller businesses.
Furthermore, two-thirds of large organisations reported suffering from non-malicious or accidental breaches – the same level as last year – and one-quarter of small organisations suffered a similar type of incident. Both large and small organisations predicted that there will be more security related incidents in the future.
The percentage of organisations, both How many respondents had any form of security breach in the last year?
(Based on 256 responses)
0 20 40 60 80 100%
74%
60%
81%ISBS 2014
ISBS 201590%
Large organisations
Small businesses
large and small, who have reported having a security incident has risen this year, most noticeably for small organisations, and an overwhelming majority expect that the trend will continue upwards. In fact, nearly 9 out of 10 large organisations now suffer security breaches. This underlines the importance of making sure basic controls are in place, such as following the HM Government’s “Ten Steps to Cyber Security” or implementing the Cyber Essentials scheme. Increased cyber awareness across all sizes of organisation allied to better detection of malicious
software and infiltration, may help to explain why organisations are reporting a higher number of breaches in 2015.
In the last year, how many respondents had...
(Based on 177 responses for large and 76 responses for small)
0 20 40 60 80 100%
81%
60%
71%
75%
66%
50%
66%
25%
A malicious security incident
A serious incident
ISBS 2015 - large organisations
ISBS 2014 - large organisations
ISBS 2015 - small businesses
ISBS 2014 - small businesses
What do respondents expect in the future regarding number of incidents?
(Based on 141 responses)
ISBS 2015 - large organisations
ISBS 2014 - large organisations
ISBS 2013 - large organisations
ISBS 2012 - large organisations
ISBS 2015- small businesses
ISBS 2014 - small businesses
Fewer incidents next year More incidents next year
ISBS 2013 - small businesses
14% 51%
8% 67%
19% 48%
46%12%
67%12%
40%5%
9% 63%
–% 0 +%
ISBS 2012 - small businesses
5% 38%
INFORMATION SECURITY BREACHES SURVEY 2015 | technical report 11
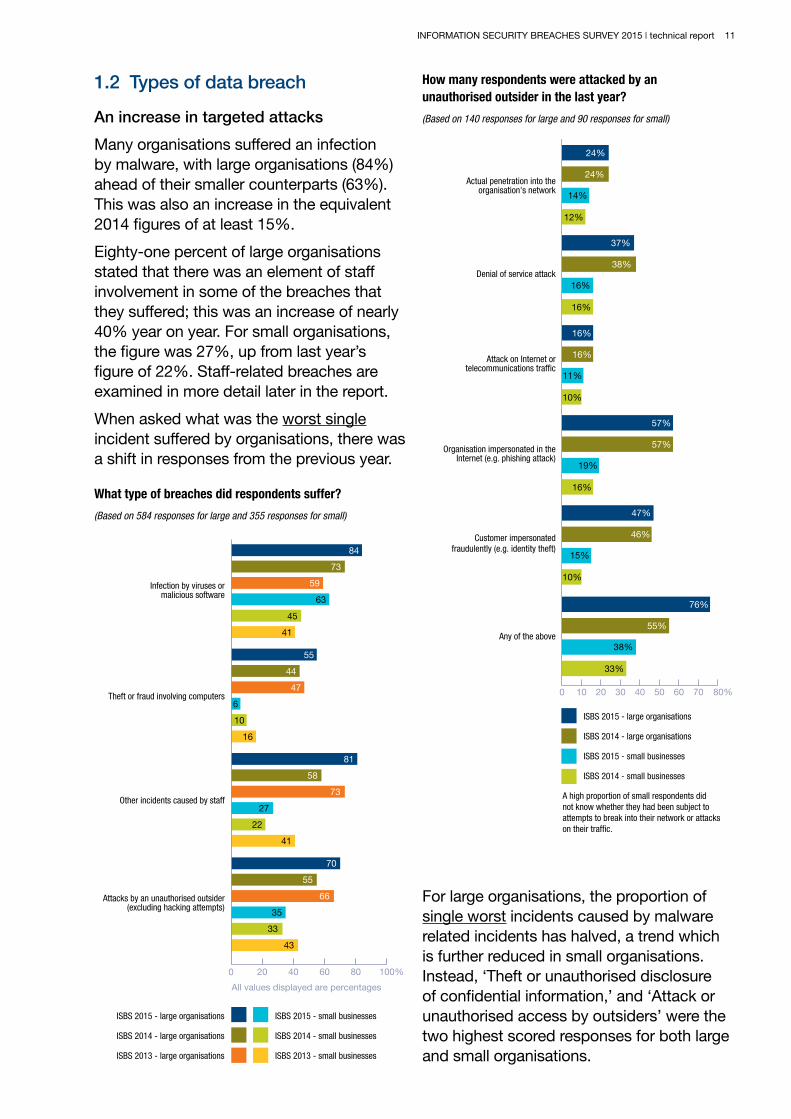
1.2 Types of data breach
An increase in targeted attacks
Many organisations suffered an infection by malware, with large organisations (84%) ahead of their smaller counterparts (63%). This was also an increase in the equivalent 2014 figures of at least 15%.
Eighty-one percent of large organisations stated that there was an element of staff involvement in some of the breaches that they suffered; this was an increase of nearly 40% year on year. For small organisations, the figure was 27%, up from last year’s figure of 22%. Staff-related breaches are examined in more detail later in the report.
When asked what was the worst single incident suffered by organisations, there was a shift in responses from the previous year.
What type of breaches did respondents suffer?
(Based on 584 responses for large and 355 responses for small)
0 20 40 60 80 100%
ISBS 2015 - large organisations
ISBS 2014 - large organisations
ISBS 2013 - large organisations
45
55
44
47
41
84
59
63
73
Infection by viruses ormalicious software
Theft or fraud involving computers
Other incidents caused by staff
Attacks by an unauthorised outsider(excluding hacking attempts)
ISBS 2015 - small businesses
ISBS 2014 - small businesses
ISBS 2013 - small businesses
6
16
81
58
10
73
22
41
70
27
55
35
33
43
66
All values displayed are percentages
How many respondents were attacked by an unauthorised outsider in the last year?
(Based on 140 responses for large and 90 responses for small)
0 10 20 30 40 50 60 70 80%
24%
24%Actual penetration into the
organisation's network
Denial of service attack
Attack on Internet ortelecommunications traffic
Organisation impersonated in theInternet (e.g. phishing attack)
Customer impersonatedfraudulently (e.g. identity theft)
Any of the above
A high proportion of small respondents didnot know whether they had been subject toattempts to break into their network or attackson their traffic.
14%
12%
37%
38%
16%
16%
16%
16%
11%
10%
57%
57%
19%
16%
47%
46%
15%
10%
76%
55%
38%
33%
ISBS 2015 - large organisations
ISBS 2014 - large organisations
ISBS 2015 - small businesses
ISBS 2014 - small businesses
For large organisations, the proportion of single worst incidents caused by malware related incidents has halved, a trend which is further reduced in small organisations. Instead, ‘Theft or unauthorised disclosure of confidential information,’ and ‘Attack or unauthorised access by outsiders’ were the two highest scored responses for both large and small organisations.

12 INFORMATION SECURITY BREACHES SURVEY 2015 | technical report
Considering all breaches, there was a noticeable 38% year on year increase of unauthorised outsider attacks on large organisations, which included activities such as penetration of networks, denial of service, phishing and identity theft. Overall, three-quarters of large organisations suffered from this type of attack in 2015, up from just over half the previous year.
The small organisations surveyed also experienced an increase in these types of attacks but not yet at same level as their larger counterparts; 38% of small organisations suffered unauthorised outsider attacks, up from 33% in 2014. This could reflect either their reduced scale and visibility to attackers or because they do not have the same capability to detect attacks
The survey also found that the frequency of penetration into an organisation’s network had increased year on year. In 2014, a single instance of network penetration was reported by 54% of those who responded; this year, the single instance figure had dropped to just 20% whereas those experiencing penetration
How many incidents did affected organisations have in the last year?
(Based on 368 responses)
0 20 40 60 80 100%
32 35
Actual penetration into theorganisation's network
Denial of service attack
Attack on Internet ortelecommunications traffic
Organisation impersonated in theInternet (e.g. phishing attack)
3 3 313
57 25 6 6
42 36 13 15 2
10
27 42 9 12 32 5
20 47 22 15
Customer impersonated fraudulently(e.g. identity theft)
4 4
15
All values displayed are percentages
One only
A few times
Roughly one a month
Roughly one a week
Roughly one a day
Several a day
Hundreds a day
‘a few times’ throughout the year had nearly doubled to 47%.
In contrast, frequent large and unsophisticated attacks seem to be declining amongst those surveyed. The percentage of organisations suffering daily and hourly attacks of this nature has either dropped or remained static. For example, when asked about attacks on internet or telecommunication traffic, 57% of organisations reported suffering a single instance. Asked the same question about instances of Denial of Service (DoS) attacks, two thirds of organisations responded that it had happened ‘only once’ or ‘less than a few times.’
These results point to some changing trends in the type of breaches that are affecting businesses. Firstly, malicious software continues to disrupt business but there is a trend away from them being the main cause of the single worst incident.
Secondly, the nature of the most serious incidents is changing to become more targeted; small businesses should not presume that they will escape targeted attacks. All businesses should ensure they understand their information assets and manage the risk to them accordingly.
Network and DoS attacks still happen and organisations need to be prepared, but the frequency has dropped by about a half. At the same time, the success attackers are having in penetrating networks is increasing, providing the evidence that breaches are becoming more targeted and less opportunistic.
A large London based insurance firm suffered reputational damage as a result of a third party breach in which customers’ data was stolen. The contract with the supplier stipulated certain controls which turned out not to be in place.

INFORMATION SECURITY BREACHES SURVEY 2015 | technical report 13
What was the worst security incident faced by respondents?
(Based on 28 responses for large and 10 responses for small)
0 5 10 15 20 25 30 35 40%
Infection by virus or malicious software
Staff misuse of the internet or email
Infringement of laws or regulations
Physical theft of computer equipment
4%
18%
40%
20%
32%
7%Systems failure or data corruption
Theft or unauthorised disclosureof confidential information
Compromise of internal systems with subsequent remote access
Attack or unauthorisedaccess by outsiders
Fraud or theft using computer systems
10%
0%
11%
10%
0%
0%
0%
0%4%
20%
4%
11%
ISBS 2015 - large organisations
ISBS 2015 - small businesses
A small consultancy and professional services firm with UK operations had its VoIP (network based voice communication) servers compromised as a result of a brute force attack. Passwords were obtained and the attackers then made a significant amount of international calls at no cost. Following the incident, top management placed a very high priority on information security and invested in new technical controls, a managed security service and outsourcing to obtain the required skills.
A large organisation based in the east of England had two separate but linked malware attacks within six months of each other. This was as a result of using an unpatched application component (self-contained units of code which integrate with other systems) provided by a third party. Following the attack the firm changed its ways of working with suppliers to ensure that all application components were identified and patched to protect them from malicious exploitation of known vulnerabilities; the incident was also logged with ActionFraud. Having secure configuration features is one of the activities in the HM Government’s “Ten Steps to Cyber Security;” by applying updates and patching systems, organisations can help ensure they are protected against the latest versions of malware in circulation.
1.3 Staff use and misuse of systems
As noted above, 81% of large organisations stated that there was an element of staff involvement in some of the breaches they suffered.
The types of incidents reported by large organisations included:
• Unauthorised access to systems or data (for example, using someone else’s ID) – 65% in 2015, up from 57% in 2014;
• Breach of data protection laws or regulations – 57% in 2015, up from 45% in 2014; and
• Loss or leakage of confidential information – 66% in 2015, up from 55% in 2014.
Twenty-seven percent of small organisations suffered an incident caused by staff.

14 INFORMATION SECURITY BREACHES SURVEY 2015 | technical report
Examining the types of incident suffered, there was broadly an increase in every type of incident – the highest reported incident type being ‘Loss or leakage of confidential information’ at 17%.
People are the main vulnerabilities to a secure enterprise. Respondents believe that inadvertent human error (48%), lack of staff awareness (33%) and weaknesses in vetting individuals (17%), were all contributing factors in causing the single worst breach that organisations suffered.
Furthermore, 28% of respondents reported that the worst security breach was partly caused by senior management giving insufficient priority to security within their organisation.
What type of staff related incidents did respondents suffer?
(Based on 148 responses for large and 90 responses for small)
0 20 40 60 80 100%
45%
35%
33%
55%
14%
4%
81%
27%
66%
17%
58%
22%
9%
Unauthorised access to systems or data(e.g. using someone else's ID)
Breach of data protectionlaws or regulations
Misuse of confidential information
Loss or leakage of confidentialinformation
Any of the above
8%
57%
9%
65%
57%
11%
9%
ISBS 2015 - large organisations
ISBS 2014 - large organisations
ISBS 2015 - small businesses
ISBS 2014 - small businesses
What was the origin (threat actor / source) of the breach?
(Based on 39 responses)
0 5 10 15 20 25 30%
26%
18%
23%
5%
0%
5%
0%
0%
3%
3%
0%3rd Party Supplier - Intentional
3rd Party Supplier - Accidental
Organised Crime
Internal (employees / contractors)Accidental
Internal (employees / contractors)Intentional
Natural (flood, fire, lightening)
Competitors
Activists
Nation-state intelligence services
Malware authors
Non-professional hackers
Other
10%
In light of this, organisations should consider whether enough attention and investment is being directed at these issues. Section 2.1 examines where the spending is going in relation to security controls.
Deliberate or accidental breaches?
Delving a little deeper into the statistics reveals that inadvertent human error caused half of the single worst security breaches for all respondents in 2015. This was a marked increase of over 60% year on year, and continues the trend since 2013 where accidental or inadvertent action by individuals was the main cause for the single worst breach.
In contrast to the high level of accidental loss, deliberate misuse of systems by internal sources – employees and contractors – accounted for 18% of the single worst security breaches for all sizes of organisation.
Again looking at the single worst breach suffered in 2015, human factors – accidental and deliberate, inside an organisation and within the supply chain – account for over half (21 cases out of the 39 recorded) of all sources of a breach. This is over twice that of ‘Organised crime’ which was reported as being responsible for 23% of incidents (9 out of the 39 recorded).

INFORMATION SECURITY BREACHES SURVEY 2015 | technical report 15
Which of the following factors contributed to the incident occuring?
(Based on 42 responses)
0 10 20 30 40 50 60 70 80%
ISBS 2014
Insufficient priority placed onsecurity by senior management
Weaknesses in vetting people
Inadvertent human error
Deliberate misuse of systems by staff
Lack of staff awareness of security risks
Lack of staff awareness oflegal/regulatory requirements
Poorly designed processes
Failure to follow a defined process
Weaknesses in someone else's security
Poorly designed technical configuration
Failure to keep technicalconfiguration up to date
Failure of technical security controlto mitigate effectively
External attack specifically targetedat your organisation
Indiscriminate external attack
Portable media bypassed defences
Politically motivated as a consequenceof policies/clients etc
Other
None of the above
ISBS 2015
6722
179
4832
1720
3332
1416
2629
2922
1422
1433
1922
12New for 2015
1722
79
210
2New for 2015
510
2New for 2015
All values displayed are percentages
Whilst the internet and email has revolutionised how people communicate in the workplace, the rise of technology designed to improve collaboration, productivity and innovation has been matched by a rise of employee-related breaches affecting organisations.
Regardless of the motivation of an insider – be it a deliberate act of theft or designed to embarrass an organisation; or if the breach was inadvertent due to a lack of internal controls – the threat from ‘insiders’ has not diminished across the UK. Neither is this isolated to one type of breach, as “virus infection,” “theft” and “unauthorised
access” – all very different types of information breach – increased for all sizes of organisation from 2014 to 2015.
One approach by organisations has been to invest in staff training, which now sees 90% of large organisations and 78% of small businesses having this on induction, with 72% of large organisations and 63% of small businesses having ongoing awareness and education programmes. These figures are also an increase on the 2014 level, indicating that organisations are trying to address the vulnerability.
Given the levels of staff-related breaches, it is clear that training is important but organisations should consider how effective their current offering is if the number of these incidents continue to increase. A number of government supported resources are available, including the Open University Cyber Security online education course, as well as a number of certified training courses backed by CESG (Communications-Electronics Security Group).
Boards and senior management should consider whether they are taking sufficient steps to ensure a culture of security in their organisation at a time when internal, accidental factors remain the largest cause of information security breaches. Organisations should examine how effective their training really is – whether it is mandatory, interactive, tested and engaging; or if it is optional and suffers from low take up.
90%of large organisations had a security breach (up from 81% a year ago)
16 INFORMATION SECURITY BREACHES SURVEY 2015 | technical report
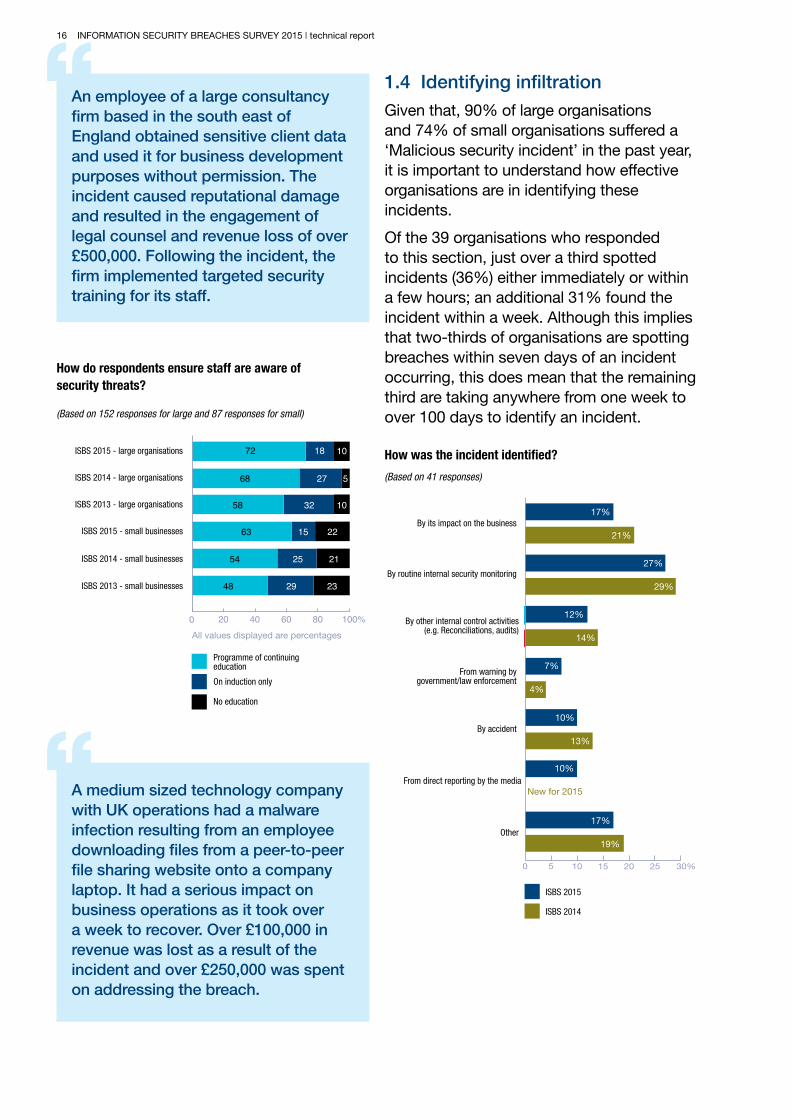
An employee of a large consultancy firm based in the south east of England obtained sensitive client data and used it for business development purposes without permission. The incident caused reputational damage and resulted in the engagement of legal counsel and revenue loss of over £500,000. Following the incident, the firm implemented targeted security training for its staff.
How do respondents ensure staff are aware of security threats?
(Based on 152 responses for large and 87 responses for small)
0 20 40 60 80 100%
54
Programme of continuingeducation
ISBS 2015 - small businesses
ISBS 2014 - small businesses 25
ISBS 2014 - large organisations
ISBS 2015 - large organisations
68 27
On induction only
No education
5
21
58 32 10ISBS 2013 - large organisations
63 15
72 18 10
22
All values displayed are percentages
48ISBS 2013 - small businesses 29 23
A medium sized technology company with UK operations had a malware infection resulting from an employee downloading files from a peer-to-peer file sharing website onto a company laptop. It had a serious impact on business operations as it took over a week to recover. Over £100,000 in revenue was lost as a result of the incident and over £250,000 was spent on addressing the breach.
1.4 Identifying infiltration
Given that, 90% of large organisations and 74% of small organisations suffered a ‘Malicious security incident’ in the past year, it is important to understand how effective organisations are in identifying these incidents.
Of the 39 organisations who responded to this section, just over a third spotted incidents (36%) either immediately or within a few hours; an additional 31% found the incident within a week. Although this implies that two-thirds of organisations are spotting breaches within seven days of an incident occurring, this does mean that the remaining third are taking anywhere from one week to over 100 days to identify an incident.
How was the incident identified?
(Based on 41 responses)
0 5 10 15 20 25 30%
ISBS 2014
By its impact on the business
By routine internal security monitoring
By other internal control activities(e.g. Reconciliations, audits)
From warning by government/law enforcement
By accident
Other
From direct reporting by the media
ISBS 2015
17%
21%
27%
29%
12%
14%
7%
4%
10%
13%
10%
17%
19%
New for 2015

INFORMATION SECURITY BREACHES SURVEY 2015 | technical report 17
How long was it between the breach occurring and it being identified as a breach?
(Based on 39 responses)
0 5 10 15 20 25 30%
ISBS 2014
Immediate
Within a few hours
Within a day
Within a week
Within a month
Within 100 days
Organisation identified and dealt with risk before a breach occurred
Longer than 100 days
ISBS 2015
18%
14%
18%
29%
10%
21%
21%
14%
18%
6%
8%
1%
8%
New for 2015
New for 2015
0%
There appears to be four ‘waves’ to spotting an incident – either it is identified immediately, between a day and a week, within a month or longer than one month. Three out of 39 organisations took longer than 100 days to identify an incident; in some cases only finding a breach when there was a change in processes or infrastructure.
Of course, these figures only relate to breaches which have been discovered; many more will persist undetected. Recent stories in the press highlight that many firms are only aware of a data breach if confidential details are posted on social media, and indicates that the time to infiltrate an organisation is measured in days, whereas the time to detect is measured in months.
Traditionally, internal security monitoring and good patch management were relied upon to provide a high level of protection for the enterprise. The survey reports that only 27% of incidents are detected through routine security monitoring and failure to keep patched contributed to 12% of breaches, as far as respondents were aware. It is clear that maintaining patch levels to guarantee enterprise security can no longer be relied upon; whilst important, it should not be the sole method of control, but be one in an array of measures.
How was the incident identified?
(based on 41 responses)
0 5 10 15 20 25 30%
ISBS 2014
By its impact on the business
By routine internal security monitoring
By other internal control activities(e.g. Reconciliations, audits)
From warning by government/law enforcement
By accident
Other
From direct reporting by the media
ISBS 2015
17%
21%
27%
29%
12%
14%
7%
4%
10%
13%
10%
17%
19%
New for 2015
Police were informed after a member of staff of a large government organisation misused their position to obtain data. It took the organisation a few months to identify the breach. This had a serious impact on the organisation even though the incident was only made known internally.
18 INFORMATION SECURITY BREACHES SURVEY 2015 | technical report
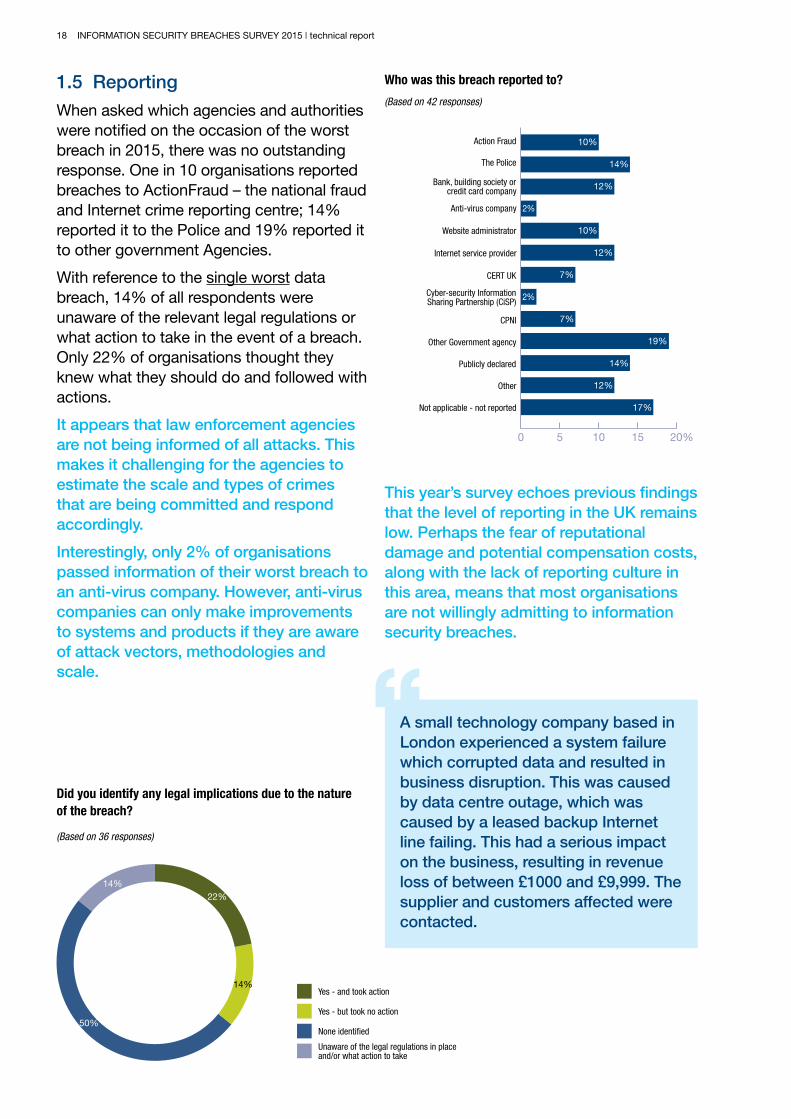
1.5 Reporting
When asked which agencies and authorities were notified on the occasion of the worst breach in 2015, there was no outstanding response. One in 10 organisations reported breaches to ActionFraud – the national fraud and Internet crime reporting centre; 14% reported it to the Police and 19% reported it to other government Agencies.
With reference to the single worst data breach, 14% of all respondents were unaware of the relevant legal regulations or what action to take in the event of a breach. Only 22% of organisations thought they knew what they should do and followed with actions.
It appears that law enforcement agencies are not being informed of all attacks. This makes it challenging for the agencies to estimate the scale and types of crimes that are being committed and respond accordingly.
Interestingly, only 2% of organisations passed information of their worst breach to an anti-virus company. However, anti-virus companies can only make improvements to systems and products if they are aware of attack vectors, methodologies and scale.
Did you identify any legal implications due to the nature of the breach?
(Based on 36 responses)
Yes - and took action
Yes - but took no action
None identified
Unaware of the legal regulations in place and/or what action to take
14%22%
14%
50%
Who was this breach reported to?
(Based on 42 responses)
0 5 10 15 20%
10%
12%
10%
12%
7%
7%
19%
14%
12%
17%
2%
2%
Action Fraud
Anti-virus company
Website administrator
Internet service provider
The Police
Bank, building society orcredit card company
Cyber-security InformationSharing Partnership (CiSP)
Other Government agency
CPNI
CERT UK
Publicly declared
Other
Not applicable - not reported
14%
This year’s survey echoes previous findings that the level of reporting in the UK remains low. Perhaps the fear of reputational damage and potential compensation costs, along with the lack of reporting culture in this area, means that most organisations are not willingly admitting to information security breaches.
A small technology company based in London experienced a system failure which corrupted data and resulted in business disruption. This was caused by data centre outage, which was caused by a leased backup Internet line failing. This had a serious impact on the business, resulting in revenue loss of between £1000 and £9,999. The supplier and customers affected were contacted.

INFORMATION SECURITY BREACHES SURVEY 2015 | technical report 19
A large charity based in the south west of England suffered reputational damage when its customers’ credit card data were compromised and used on a third party system. It took the charity over a week to restore operations to normal and it spent between £10,000 and £49,999 responding to the incident. The charity involved the Payment Card Industry (PCI) Forensic Investigator and the bank.
2 COSTS AND CONSEQUENCES
2.1 Where is the investment in cyber security going?
As the result of a breach, over 60% of organisations undertook at least one action to try to ensure there would not be a repeat. One-third of respondents decided to invest in technical controls, one-quarter (26%) invested in the training of staff, while just under a quarter (24%) decided to outsource some of their security through a managed service, reflecting the growth in the outsourcing sector.
As a consequence of the incident, have you changed your investment in cyber security?
(Based on 38 responses)
0 5 10 15 20 25 30 35 40%
16%
34%
24%
16%
3%
8%
39%
Recruiting more skilled people
Investing in training for staff
Investing in new technical controls
Co-sourcing to obtain required skills
Investing in managed security service
Investing in the development ofinternal security operations centre
Outsourcing to obtain required skills
No Change
26%
The survey also established that 39% of organisations had not changed their investment in cyber security despite suffering from an incident.
What type of breaches did respondents suffer?
(Based on 584 responses for large and 355 responses for small)
0 20 40 60 80 100%
ISBS 2015 - large organisations
ISBS 2014 - large organisations
ISBS 2013 - large organisations
45
55
44
47
41
84
59
63
73
Infection by viruses ormalicious software
Theft or fraud involving computers
Other incidents caused by staff
Attacks by an unauthorised outsider(excluding hacking attempts)
ISBS 2015 - small businesses
ISBS 2014 - small businesses
ISBS 2013 - small businesses
6
16
81
58
10
73
22
41
70
27
55
35
33
43
66
All values displayed are percentages
As the findings above show, breaches are increasingly due to people within an organisation – often inadvertently. Whilst technical controls have their place, organisations should take the opportunity to question the balance between their investment in technical controls and measures to address the human factors present in Information Security breaches. The increasing involvement of internal security experts (explored in more detail below) may help senior management and boards direct spending appropriately.

20 INFORMATION SECURITY BREACHES SURVEY 2015 | technical report
Controls still have their place
The number of virus and malware infections suffered by small organisations dropped by a noticeable 40% from last year, indicating that the small organisations surveyed are becoming more serious about their package of defences against these types of attack. It certainly appears that small organisations have improved their virus and malware defences, and further explains the increase in the proportion of serious breaches being targeted, as opposed to blanket infections.
2.2 The reputational impact of a breach
When asked what made a particular incident ‘the worst’, 16 out of the 39 organisations who responded cited that it was the damage to their reputation which had the greatest impact. This is an increasing trend, up from 30% of respondents in 2014 to 41% this year.
The figures from the survey also identified that 35% of large organisations stated that their most serious incident had resulted in ‘extensive adverse’ or ‘some adverse’ media coverage, an increase in both categories over the combined level of 18% in 2014.
Equivalent statistics for small organisations show that 13% of them stated that their most serious incident had resulted in some adverse media coverage – also an increase over last year’s reported 4%.
What made this incident the worst of the year?
(Based on 39 responses)
Reputational damage
Other
Business disruption
Cost to investigate and fix
Value of lost assets
23%29%
10%12%
ISBS 2014 ISBS 2015
15%
21%10%
8%
41%30%
Radical changes caused by social media, a more demanding general public and increasing social activism have created a new dynamic where organisations are becoming increasingly worried about how they are perceived. This has transformed how organisations operate and communicate.
The increase in the media coverage of breaches may also reflect increased awareness of the cyber threat in the general population.
To what extent did the worst incident damage the reputation of the business?
(Based on 23 responses for large and 8 responses for small)
0 20 40 60 80 100%
32 5011
2482
No media coverage but somecustomer complaints
ISBS 2013 - large organisations
ISBS 2015 - small businesses
ISBS 2014 - small businesses 17 79
7
Some adverse media coverage
Only known about internally
Extensive adverse media coverageover a prolonged period
ISBS 2013 - small businesses 195
4
ISBS 2015 - large organisations
ISBS 2014 - large organisations
431717 22
751313
All values displayed are percentages
A large government organisation based in the south of England had a sensitive data disclosure breach due to human error following the amendment of a report by a member of staff. This had a serious impact on the organisation resulting in reputational damage. The 400 clients affected were notified via email or post.

INFORMATION SECURITY BREACHES SURVEY 2015 | technical report 21
A large telecommunications organisation’s corporate website was taken offline for a short period of time. This meant customers were unable to access their accounts and the organisation was unable to sell their products and services online. This impacted business operations and their reputation.
2.3 The most disruptive incidents
The survey found that four of the 36 organisations who responded, were still suffering either ‘serious’ or ‘very serious’ disruption a month after their worst single incident occurred. On a more positive note, 16% of organisations encountered a similar level of ‘serious’ or ‘very serious disruption’ for less than a day, implying that business resilience procedures stood up well in these circumstances. Section 2.5 examines responses to incidents in more detail.
A large financial services company based in the south east of England suffered an attack which compromised their website with malicious code making it unusable. There were no contingency plans in place. The breach had a serious impact on business operations as it took between a week and a month to restore them to normal.
How much disruption to the business did the worst security incident cause?
(Based on 36 responses)
Very serious disruption
Serious disruption
Insignificant disruption
None
Minor disruption19%
Less thana day
Between aday anda week
Between aweek anda month
More thana month
8% 3% 3% 6%
8% 3% 8% 6%
3% 11% 6% 3%
3% 6% 3% 3%
2.4 Cost of dealing with security incidents
Every year, the survey seeks to understand the cost of dealing with security incidents, taking into account the activities which organisations must perform to operate securely once more. In 2015, the response rate to this set of questions was low, perhaps indicating a reluctance to share further details of their worst single breach, or else not having the in-depth knowledge to explain how the costs were accumulated
From the information provided, the survey did find that the total cost of dealing with incidents continues to increase. Looking at the single worst breach suffered, the costs to large organisations range from just under £1.5 million (£1,455,000) to £3.14 million. For small organisations, the range starts at £75,200 to £310,800. These figures account for activities such as business disruption, days spent responding to an incident, loss of business, regulatory fines and loss of assets.
Using past surveys as a foundation, these numbers continue the upward trend seen since 2012. The cost of dealing with the single worst incidents for large and small organisations being reported as follows:
(Based on 75 responses for large and 47 responses for small)
ISBS 2015large organisations
Business disruption
Time spent respondingto incident
Regulatory finesand compensation
payments
£40,000 - £225,000over 2 - 12 days
ISBS 2015small businesses
Direct cash spentresponding to incident
Total cost of worstincident on average
£800,000 - £2,100,000over 4 - 11 days
£3,000 - £10,00013-24 man-days
£10,000 - £30,00040-80 man-days
£25,000 - £45,000 £120,000 - £170,000
£150 - £300 £70,000 - £100,000
£275,000 - £375,000£6,500 - £14,000
£75,200 - £310,800 £1,455,000 - £3,140,000
2012 comparative £15,000 - £30,000 £110,000 - £250,000
Damage to reputation £80,000 - £310,000£3,000 - £16,000
Lost assets(including lost
intellectual property)
2010 comparative £27,500 - £55,000 £280,000 - £690,000
£250 - £500 £100,000 - £155,000
Lost business
2014 comparative £65,000 - £115,000 £600,000 - £1,150,000
2013 comparative £35,000 - £65,000 £450,000 - £850,000

22 INFORMATION SECURITY BREACHES SURVEY 2015 | technical report
To gain further insight how breaches are affecting organisations, the survey explored the individual activities and categories which made up the total cost.
The survey did find the largest component of the total amount was ‘Business disruption’, which cost small organisations in the range of £40,000 to £225,000, and larger organisations a minimum of £800,000 and extended as far as £2.1 million.
The costs involved in ‘Lost assets and lost intellectual property’ made up the second largest category, despite the challenges in valuing intellectual property. For large organisations, the average costs range from £275,000 to £375,000; and small organisations £6,500 and £14,000.
The survey also identified that nearly one in 10 large organisations spent more than £500,000 on regulatory fines and compensation payments, whereas no small organisations reported spending more than £999 on this outlay.
Confidential information worth more than £500,000 was stolen by a staff member of IT from a large utilities business. This seriously affected business operations and resulted in reputational damage. It took between a week and a month to restore business operations, cost £100,000 to £249,999 to respond to the incident and also resulted in revenue loss of between £100,000 to £249,999.
Turning to the ‘Lost business’ category, small organisations seem to be disproportionately affected by their single worst breach. For these organisations, the estimated loss ranged from £25,000 to £45,000; whereas the upper limit for large organisations was £170,000 – still a significant amount but much less than the cost of a ‘Business disruption’. One possible
reason for this could be that even though large organisations suffer loss of business in the event of a breach, their continuity and resilience procedures are sufficiently more mature to enable the business to continue to fulfil new orders and sales. Small organisations on the other hand may not have the same resilience, meaning that any breach is more likely to impact sales and be more visible to customers than compared to larger organisations.
The costs on large and small organisations due to security incidents continue to increase year on year – and it’s not just the loss of potential sales which are impacting organisations.
One third of the large organisations who responded to the question reported that they spent more than £500,000 in the recovery of lost assets and intellectual property. Eleven percent of organisations changed the nature of business carried out following the worst single incident – the same percentage as in 2014. Given this, it remains unclear the role recovery costs and loss of intellectual property play in the remediation of the worst breach and subsequent decision to change the nature of the business carried out.
Due to a missed patch update, a large financial services firm with UK operations suffered a website breach which resulted in the attacker being able to take control of particular systems. As a consequence of the breach, not only did the firm suffer reputational damage, but it lost more than £500,000 in revenue and spent between £250,000 and £499,999 responding to the incident. It took more than a month to restore its operations back to normal.

INFORMATION SECURITY BREACHES SURVEY 2015 | technical report 23
2.5 Responding to security incidents
The survey examined the types of incidents that organisations plan for, and assesses the effectiveness of the planning.
The survey found only two scenarios where contingency plans proved to be effective for more than 50% of the respondents – ‘Compromise of internal systems with subsequent remote access’, and ‘Systems failure or data corruption’. For the other scenarios tested in the survey, which included ‘Attacks of websites or gateways’, ‘Infection by malicious software’, and ‘Staff misuse of the internet’ – the survey recorded that plans were not in place or not effective for the majority of respondents.
The survey asked what other measures respondents put in place following the single worst breach. Half of all organisations invested in more security training, broadly in line with the 2014 figure of 54%. Thirteen percent of organisations conducted additional vetting of staff or contractors, an increase from last year’s figure of 9%, indicating a realisation that staff are usually at the centre of an information security breach.
What type of security incidents do organisations plan for; and how effective are these contingency plans?
(Based on 35 responses)
0 10 20 30 40 50 60 70 80%
Contingency plan in placeand was effective
40%
33% 11%50%
0%
0%
Attack on website orInternet gateway
Breach of laws/regulations
Infection by virus andmalicious software
Compromise of internal systems with subsequent remote access
Physical theft of computerequipment
Staff misuse of theInternet or email
Systems failure or data corruption
Theft or unauthorised disclosureof confidential data
Fraud or theft usingcomputer systems
Contingency plan in placebut was not effective
20%
33% 33%
67%
60% 40%
38% 50%
What steps did large organisations take after their worst security breach of the year?
(Based on 38 responses)
0 10 20 30 40 50%
50%
11%
13%
47%
39%
29%
21%
32%
18%
Additional staff training
Additional vetting of staff or contractors
Changed nature of business carried out
Changes to policies and procedures
Changes to backup andcontingency plans
Changes to configurationof existing systems
Deployment of new systems
Disciplinary action
Increased monitoring ofthird parties’ security
Formalised post-incident review
13%
Thirty-nine percent of organisations made a change to their policies and procedures after they suffered their worst security breach – a noticeable decrease from 46% in 2014. This indicates that businesses increasingly understand that policies on their own are not an effective tool to stopping information security breaches and should be accompanied with a series of other tools and activities to protect the organisation.
The survey found that just one-third of organisations conducted a formal post-incident review following the single worst breach. It is concerning that two-thirds of organisations have not taken the time to assess what happened, understand the causes and implement measures which would prevent breaches from recurring. Failure to perform a review and learn the lessons will most likely increase the chance of a recurrence.
32%of respondents carried out a formalised post-incident review.

24 INFORMATION SECURITY BREACHES SURVEY 2015 | technical report
3 ATTITUDES AND TRENDS
3.1 What is driving information security expenditure?
For the second year running, ‘Protecting customer information’ is the single largest driver for information security expenditure with 34% of respondents selecting this response. This represents a 9% year on year increase from the 2014 survey, indicating the priority this is taking in organisations.
The second highest driver was ‘Protecting the organisation’s reputation’ at 21%. This is a significant increase from last year, with a 50% year on year increase.
Combining both expenditure drivers, they account for over half (55%) of all the responses to this question. ‘Efficiency improvements’, ‘Maintaining intellectual property’ and ‘Complying with laws and regulations’ all scored 10% or lower.
Recent data breaches demonstrate that disclosure of customer and personal information can have implications on share prices and personal careers. For those organisations who suffered a breach in the past year, 41% felt that the greatest impact suffered was to their reputation – nearly twice as high as the next largest impact, which was to actual business operations (23%).
What made this incident the worst of the year?
(Based on 39 responses)
Reputational damage
Other
Business disruption
Cost to investigate and fix
Value of lost assets
23%29%
10%12%
ISBS 2014 ISBS 2015
15%
21%10%
8%
41%30%
Looking at the other drivers of expenditure which all scored lower than the responses above, namely ‘Business continuity in a disaster situation’, ‘Complying with laws and regulations’ and ‘Improving efficiency/cost reduction’, all fell in 2015 compared to the previous year. Whilst these remain important issues for organisations, it seems that the public’s reaction to poor management of customer data is now the main concern of budget holders and is driving spending accordingly.
What is the main driver for information security expenditure?
(Based on 310 responses)
0 5 10 15 20 25 30 35%
2%
Suffered a serioussecurity breach
11%
34%
1%
21%0%
1%
2%
10%
1%
10%
Protecting customer information
Protecting the organisation’sreputation
Business continuity ina disaster situation
Protecting other assets(e.g. cash) from theft
Complying with laws/regulations
Enabling business opportunities
Improving efficiency/cost reduction
Preventing downtimeand outages
Maintaining data integrity
Government cyber securityinitiatives
Protecting intellectual property
5%
2%
A large government organisation in the north west of England suffered a sensitive data disclosure breach when a member of staff accidentally sent sensitive information to the wrong e-mail address. This had a serious impact on the organisation and resulted in reputational damage.

INFORMATION SECURITY BREACHES SURVEY 2015 | technical report 25
Inappropriate staff behaviour at a large financial services firm led to unauthorised disclosure of confidential information. It took between a week and a month to restore the business back to normal. Following the breach, the firm conducted additional staff training to address the security issues identified.
3.2 The changing patterns of security expenditure
Levels of expenditure
The survey found a difference in levels of security spending between the respondents. Forty-four percent of large organisations increased their information security expenditure; whereas in 2014, 53% of firms increased expenditure.
Looking to the future, 46% of large firms expected information security expenditure to increase in the coming year, which is lower than the last year’s figure of 51%.
Small organisations reported a different outlook: 44% increased their information security expenditure, up from 2014 (27%). Only 7% of small organisations expected information security expenditure to increase in the coming year, which is significantly down from the previous year’s 42%.
How is information security expenditure changing?
(Based on 241 responses)
Decreasing
49%7%
0% 44%
46%4%
–% 0 +%
Increasing
44%6%
Large organisationsIn the last year
In the last year
Expected next year
Small businesses
Expected next year
Outsourcing expenditure
The survey also found that levels of outsourcing to external providers continue to rise. Business processes; such as corporate email, corporate website maintenance, finance and accounting, and payroll processing have all increased over the last two years. However, there was a marked decrease in the outsourcing of ‘Payment processing’ (down 70% year on year) and a shorter fall in the percentage of firms outsourcing their sales and marketing function.
Use of outsourced cloud data storage has increased from one-in-five in 2013, to nearly one-in-three this year.
As use of cloud storage and cloud computing resources, such as desktop environments and productivity tools continues to rise, organisations should consider whether current policies, procedures, technology and training are updated in line with its use. Security standards for ‘the cloud’ are maturing, so all organisations should explore what needs to be implemented to ensure that they have the appropriate levels of controls in place.
Given the dramatic increase in costs to organisations suffering a breach, as explored in Section 2, it is notable there has not been a similar increase in security expenditure. Similarly, there is a question as to why the slight increase in investment has not hampered the frequency or cost of incidents.
Are the days of ever increasing security spending at an end? With the rates of information security expenditure slowing, do organisations now understand their risk appetite and having covered their regulatory and legal requirements, are they now taking a more risk based approach to their spending?

26 INFORMATION SECURITY BREACHES SURVEY 2015 | technical report
Which business processes have respondents outsourced to external providers over the Internet?
(Based on 319 responses)
0 20 40 60 80 100%
55%
34%
14%
30%
14%
20%
Your corporate website
Your corporate email
Payments processing
Payroll processing
Sales and/or marketing
13%
27%
30%
Customer transactions processing
Finance and accounting
Office tools (e.g. word processing,presentations etc.)
Data storage (e.g. on the cloud)
54%
35%
29%
22%
19%
14%
12%
9%
80%Any of the above
28%
81%
2015
2014
3.3 Where do organisations go for advice and assurance?
The percentage of organisations using the HM Government’s Ten Steps to Cyber Security guidance increased from just over a quarter (26%) in 2014 to almost one third (32%) in 2015. There was also an 11% year on year increase in organisations using government alerts to inform their awareness of threats and similar vulnerabilities.
The survey also reports that nearly half (49%) of organisations are either badged to the HM Government’s Cyber Essentials and Cyber Essentials Plus schemes, are on their way to accreditation or plan to be badged in the next year.
There was also an 11% year on year increase in organisations using other recognised advisory bodies - such as the Information Security Forum, (ISC)², and the Institute for Information Security Professionals, for threat evaluation source material. In contrast there has been a reduction (from 48% in 2014 to 30% in 2015) in organisations taking threat evaluation advice from security product vendors.
What information do you use to help you evaluate the security threats that your organisation faces?
(Based on 313 responses)
0 10 20 30 40 50 60 70 80%
53%64%
59%
46%
64%
Discussions with senior management
Guidance from security bodies(e.g. ISF, IISP, ISC2)
News reports in the media
Cyber-security InformationSharing Partnership (CISP)
2015
2014
50%
51%
53%
48%
46%
30%48%
52%
51%
49%
36%
27%
8%
Views of internal security experts
External security consultants
Alerts from Government /threat Intelligence services
Advice from security product vendors
Industry Groups (’chatham house’rules type meeting)
Other
The percentage of organisations which have implemented ISO 27001 – the international standard for Information Security Management Systems – has not changed in any great degree since 2013. However, ISO 27001 remains something which the respondents value, particularly in trying to gain assurance over their supply chain. Forty percent of organisations ensure that a provider of services has ISO

INFORMATION SECURITY BREACHES SURVEY 2015 | technical report 27
27001 certification when contracting for services. This is a year on year rise of over 20% compared to 2014, indicating that the Standard is increasingly recognised as one method of measuring the level of information security management and maturity in the supply chain.
What steps have respondents that use externally hosted services taken to obtain comfort over the external provider’s security?
(Based on 273 responses)
0 10 20 30 40 50 60 70 80%
Obtained rights to auditthe provider’s security
Obtained a service auditor’s report(e.g. SAS 70, ISAE 3402, AAF)
on the provider’s controls
Ensured the provider is certifiedas ISO27001 compliant
Ensured all dataheld is encrypted
31%
30%
26%
26%
41%
25%
18%
25%Carried out penetration testing tocheck the provider’s security
Have a contingency plan in casethe provider ceases operation or
respondent wishes to exit
Required the provider to follow therespondent’s security standards
(ISO2700x, Cyber Essentials)
Get reports from provider onsecurity breaches that might
affect respondent’s data
Ensured contract includedprovisions for security
25%
34%
31%
40%
41%
39%
33%
63%
51%
13%
2015
2014
There are three main themes to come out of these set of statistics. The first concerns the role of government in driving information security awareness, setting standards and the tone nationally. The 23% year on year increase in organisations using the Ten Steps to Cyber Security is noticeable and supports the view that clear, accessible and independent guidance is valued by organisations, and suggests that organisations are referring to the government for a common set of cyber security processes and procedures.
Secondly, internal security experts are now more likely to be involved, with 64% of organisations reporting that these individuals would be consulted for threat evaluation – a figure up by 8% over last year.
How many respondents implemented ISO 27001?
(Based on 142 responses for large and 83 responses for small)
ISBS 2015 - large organisations
ISBS 2014 - large organisations
ISBS 2013 - large organisations
0 20 40 60 80 100%
34% 44%
ISBS 2015 - small businesses
ISBS 2014 - small businesses
ISBS 2013 - small businesses
8%
18% 21% 42%
18% 21%18%
7%31%
19%
45%
14%
25% 47% 8%
22% 18% 41%19%
19%
Completely
Partially
No but plan to
No and not plan to
Lastly, the growth in the use of ISO 270001 in the supply chain indicates that the Standard is increasingly recognised as one method of measuring the level of information security management in and maturity of the supply chain; we may see increasing adoption levels for the Standard due to this trend.
Has your organisation implemented Cyber Essentials and Cyber Essentials plus?
(Based on 256 responses)
0 10 20 30 40 50 60%
3%
23%
3%
14%
51%
3%
No, but plan to
Cyber Essentials fullyimplemented but not badged
Partially implemented
No, and not planned
Cyber Essentials Plus fullyimplemented but not badged
Yes - badged for Cyber Essentials
Yes - badged for Cyber Essentials plus
5%

28 INFORMATION SECURITY BREACHES SURVEY 2015 | technical report
Which standards and good practice guides do you ensure your suppliers comply with?
(Based on 304 responses)
0 10 20 30 40 50 60%
31
13
51
37
5
19
9
4
A recognised standardsuch as ISO 27001
Government-related requirements
Payment card Industry (PCI)
Independent service auditor’s report(e.g. ISAE 3402)
None
Other
Cyber Essentials Plus
Cyber Essentials
All values displayed are percentages
A large educational organisation in the south east of England suffered the potential loss of unprotected IP as a result of a successful spear-phishing attack by international attackers. It took more than a month to restore business operations back to normal. Although overall this had a minor impact on business operations, the cost to investigate and resolve the incident made it the organisation’s worst breach of the year. The organisation was made aware of this breach by a government organisation.
Do you have insurance which would cover you in the event of a breach?
(Based on 212 responses)
Yes - to prevent cost - cyber specific insurance
Yes - to prevent cost - included in other insurance
Yes - following a breach - cyber specific insurance
Yes - following a breach - included in other insurance
No - but intend to purchase in the next 12 months
No - was not aware it existed
No - do not have the budget
No - it is not a priority
4%
13%
8%
13%
8%12%
13%
29%
3.4 Is Cyber insurance properly understood?
One third of the survey respondents believe that they have insurance which would cover them in the event of an information security breach; 39% of large organisations and 27% of smaller organisations. These numbers are lower in 2015 than last year, when the respective percentages were 52% and 35%.
For the organisations who claimed to have coverage, the majority believe that their existing insurance policies would cover their costs in the event of a breach, with a corresponding minority stating that they had purchased a specific Cyber insurance policy.
Of the organisations which have not purchased insurance, 12% were intending to purchase a policy in the next year, 47% felt that it was not a priority and 19% were not even aware of the existence of such coverage.
There has been a notable drop in the percentage of organisations who have claimed to have cover. Cyber liability insurance cover has been available in the market for around 10 years, and is mostly used as a risk transfer mechanism in countries that have mandatory data breach notification laws. As such notification is not mandatory in the UK, it is understandable that the uptake level is not as high as other territories, such as the United States, where the vast majority of states have mandatory notification of some form.
That said, the impending revision of EU Data Protection Regulation is expected to include mandatory notification of breaches

INFORMATION SECURITY BREACHES SURVEY 2015 | technical report 29
of personal data, and this may well be the catalyst to change the cyber liability insurance landscape in the UK.
A medium sized transportation company based in the south west of England had a repeat incident where the phone system was hacked and a series of international premium rate calls were made. As this happened over a weekend the company did not identify the breach until the following Monday morning. As a result of the breach, all premium and international calls were barred from the system. This hindered staff communication to Europe leading to lost revenue of between £1000 and £10,000, making the breach the company’s worst. The company was not aware that insurance existed that would cover them in an event of a breach.
One view of the decline in both large and small organisations reporting having insurance is that, having reviewed their policy details, these organisations have discovered that they are not as well covered as previously thought or that insurers have taken steps to exclude cyber liability from general insurance policies. In a nascent market, the terms and coverage of insurance policies vary tremendously; in turn, due to understandable caution, this may be preventing a larger uptake of policies than would otherwise be expected. This slow growth may be compounded by a lack of historical data, which makes it harder for insurers to price cyber risk accurately.
The 2015 joint HM Government and Marsh report ‘UK Cyber Security: The Role of Insurance in Managing and Mitigating the Risk’ found that businesses are overestimating the extent to which their existing insurance provides cover for cyber
risk, reinforcing this analysis. The report also highlights the role that insurance can play as part of a company’s wider risk management approach.
39% of large organisations
27% of small businesses
have insurance that would cover them in the event of a breach.
t Down from 52% a year ago.t Down from 35% a year ago.
4 ASSURANCE AND EFFECTIVENESS
4.1 Mobile devices – risk awareness and policy
This year’s survey reports that 15% of organisations suffered from a breach caused by use of a smartphone or tablet device, more than doubling last year’s figure of 7%.
The survey also identified that organisations are starting to use a series of measures to address the management of these devices. Roughly half of all large organisations have either defined a strategy for mobile usage (52%), are protecting corporate emails (48%) or are using something for the remote management of devices (49%). Furthermore, 70% of large organisations have issued a policy to cover how these devices should be used.
15%of large organisations had a security or data breach in the last year involving smartphones or tablets.
3%of worst breaches were due to portable media bypassing defences.

30 INFORMATION SECURITY BREACHES SURVEY 2015 | technical report
Equivalent statistics for small organisations show they have further to go, with 38% defining a strategy, 27% protecting corporate email and 14% using remote device management; only 37% have issued a security policy covering smart phone and tablet use.
What steps have respondents taken to mitigate the risks associated with staff using smartphones or tablets?
(Based on 138 responses for large and 93 responses for small)
0 10 20 30 40 50 60 70 80%
4547
3444
2425
5265
3841
7075
3743
4141
3935
4858
2738
4241
1629
4964
1432
75
1821
Do not allow such devicesto remotely connect to the
organisation’s systems
Allow only corporate devicesto remotely connect to the
organisation’s systems
Define a security strategyfor mobile devices
Issued a policy onmobile computing
Trained staff on the threatsassociated with mobile devices
Protected corporate emailand calendars
Implemented strong encryption
Implemented mobile devicemanagement (to manage
devices remotely over the air)
No steps taken
All values displayed are percentages
ISBS 2015 - large organisations
ISBS 2014 - large organisations
ISBS 2015 - small businesses
ISBS 2014 - small businesses
For many years, organisations have understood the information security risks of smartphone use, but the benefits and the cost savings of ‘Bring Your Own Device’ (BYOD) have outweighed the security concerns for most. This is demonstrated by the fact that only 4% of both large and small organisations put a complete ban on mobile devices connecting to their corporate networks. Furthermore, there is a marked decline in the percentage of firms who only allow corporate devices to connect to the network (from 44% in 2014 to 34% in 2015).
Evidence from the survey demonstrates that organisations are beginning to manage the risks presented by these devices, but we must not be complacent: one in five small organisations (18%) still have not taken any steps with the use of smartphones or tablets, even though the number of breaches through mobile devices more than doubled. HM Government has issued guidance on Bring Your Own Device, which may help firms minimise the risk while maximising the business benefits.
32%of respondents haven’t carried out any form of security risk assessment.
60%of respondents are confident they have sufficient security skills to manage their risks next year.
26%of respondents don’t evaluate how effective their security expenditure is.

INFORMATION SECURITY BREACHES SURVEY 2015 | technical report 31
4.2 How effective is security policy?
The Information Security Breaches Survey indicates that 98% of large organisations and 60% of small organisations have a documented information security policy; these figures remain consistent with the previous year. In addition, 46% of all respondents have a formal cyber security policy in place (no comparable figure for 2014).
Having a policy does not mean that an organisation is completely protected against breaches. Of all the organisations where security policy was poorly understood, 72% experienced a staff-related breach, a slight increase on the previous year’s figure of 70%.
Fifty-six percent of organisations where security policy is understood still had a breach; this is concerning but is approximately a third lower than those organisations where security policy was not clear. As a further point, there is a noticeable year on year increase of 37% of staff-related breaches in organisations where security policy was meant to be understood.
8% of IT budget is spent on average on security.
t Down from 10% a year ago.
What cyber security governance and risk management arrangements do you have in place?
(Based on 308 responses)
0 10 20 30 40 50 60%
31%
44%
Cyber security risks are included onDirectorate / Departmental risk registers
Cyber security risks are promoted intothe Enterprise risk register
Cyber security risks included withinthe Internal Audit plan
39%
Other
CISO in place
Board member with responsibiltyfor Cyber risks
33%
44%
Security risk assessment carried outin the last year
Formal cyber security policy in place
59%
59%
46%
44% of large organisations
44% of small businesses
increased information security spend in the last year.
t Down from 53% a year ago.s Up from 27% a year ago.
49%of respondents badged Cyber Essentials or Cyber Essentials Plus, on their way to accreditation or plan to be badged.
Whilst having a policy is important in setting out an organisation’s objectives in information and cyber security, there are clear benefits in making sure that it is understood and implemented accordingly.
As a final point, it is notable that there has been a lack of progress amongst small organisations in developing information security policies. Since 2012, there has been little change in the percentage of small organisations who have formally documented an information security policy but the trend in those organisations suffering a breach has increased over this same time.
A large London based travel firm had its control systems infected with malicious software. It required a large amount of work and took over a month to recover from the incident, resulting in significant costs to the business. Consequently, the company made changes to their policy and procedures to overcome the security issue identified.

32 INFORMATION SECURITY BREACHES SURVEY 2015 | technical report
5 APPENDIX
How many staff did each respondent employ in the UK?
Figure 1 (based on 661 responses)
0
20
40
60
80
100%
18%
500 or more employees
250-499 employees
50-249 employees
10-49 employees
Less than 10 employees
ISBS 2015 ISBS 2014
10% 13%
17%20%
49%
9%
43%
7%
14%
In what sector was each respondent’s main business activity?
Figure 2 (based on 664 responses)
Agriculture
Banking
Distribution
Education
Government
Health
Insurance
Manufacturing
Media
Other financial services
Pharmaceutical
Property and construction
Retail
Services
Technology
Telecommunications
Utilities, energy and mining
Other
4.5
19
1
5.4
7.2
3.62.9
19.1
6.92.62.7
1.55.9
0.72.6
3.5
1.5
36.2
0.2
Consultancy andprofessional services
Travel, leisure andentertainment
All values displayed are percentages
How high a priority is information security to top management or director groups?
Figure 3 (based on 314 responses for large and 200 responses for small)
ISBS 2012 - large organisations
ISBS 2015 - small businesses
0 20 40 60 80 100%
15
ISBS 2014 - small businesses
ISBS 2012 - small businesses
ISBS 2014 - large organisations
ISBS 2013 - large organisations
ISBS 2015 - large organisations
ISBS 2013 - small businesses
5 31
1
2 47
Not a priority
Low priority
Neither high nor low priority
High priority
Very high priority
1
1
1
1
2
185 3145
5 2741
4 3046
9
7
2 5534
15 4636
3 3845
4 4336
2
All values displayed are percentages

INFORMATION SECURITY BREACHES SURVEY 2015 | technical report 33
What is the main driver for information security expenditure?
Figure 4 (based on 310 responses)
0 5 10 15 20 25 30 35%
2%
Suffered a serioussecurity breach
11%
34%
1%
21%0%
1%
2%
10%
1%
10%
Protecting customer information
Protecting the organisation’sreputation
Business continuity ina disaster situation
Protecting other assets(e.g. cash) from theft
Complying with laws/regulations
Enabling business opportunities
Improving efficiency/cost reduction
Preventing downtimeand outages
Maintaining data integrity
Government cyber securityinitiatives
Protecting intellectual property
5%
2%
How many respondents carry out security risk assessments?
Figure 5 (based on 166 responses for large and 90 responses for small)
0 20 40 60 80 100%
85%
69%
ISBS 2013 - large organisations
ISBS 2015 - small businesses
ISBS 2014 - small businesses
41%
ISBS 2013 - small businesses 60%
ISBS 2015 - large organisations
ISBS 2014 - large organisations
74%
86%
How are cyber security risks identified and assured?
Figure 5.1 (based on 317 responses)
0 10 20 30 40 50 60 70 80%
40
64
Business as usual healthchecks
Ad-hoc healthchecks / reviews
Information / Cyber securityrisk assessment
46
Other 4
Internal Audit
Outsourced managed security provider
61
24
All values displayed are percentages
What cyber security governance and risk management arrangements do you have in place?
Figure 5.2 (based on 308 responses)
0 10 20 30 40 50 60%
31%
44%
Cyber security risks are included onDirectorate / Departmental risk registers
Cyber security risks are promoted intothe Enterprise risk register
Cyber security risks included withinthe Internal Audit plan
39%
Other
CISO in place
Board member with responsibiltyfor Cyber risks
33%
44%
Security risk assessment carried outin the last year
Formal cyber security policy in place
59%
59%
46%
How is information classified within your organisation and is it consistently applied?
Figure 5.3 (based on 309 responses)
0 5 10 15 20 25 30 35%
16%
11%
Document management policies existsand consistently applied
Document management policies existsbut not consistently applied
No meaningful differentiation betweendifferent information types
22%
Not applicable as informationis not classified
10%
Data classification scheme existsand consistently applied
Data classification scheme existsbut not consistently applied
33%
33%
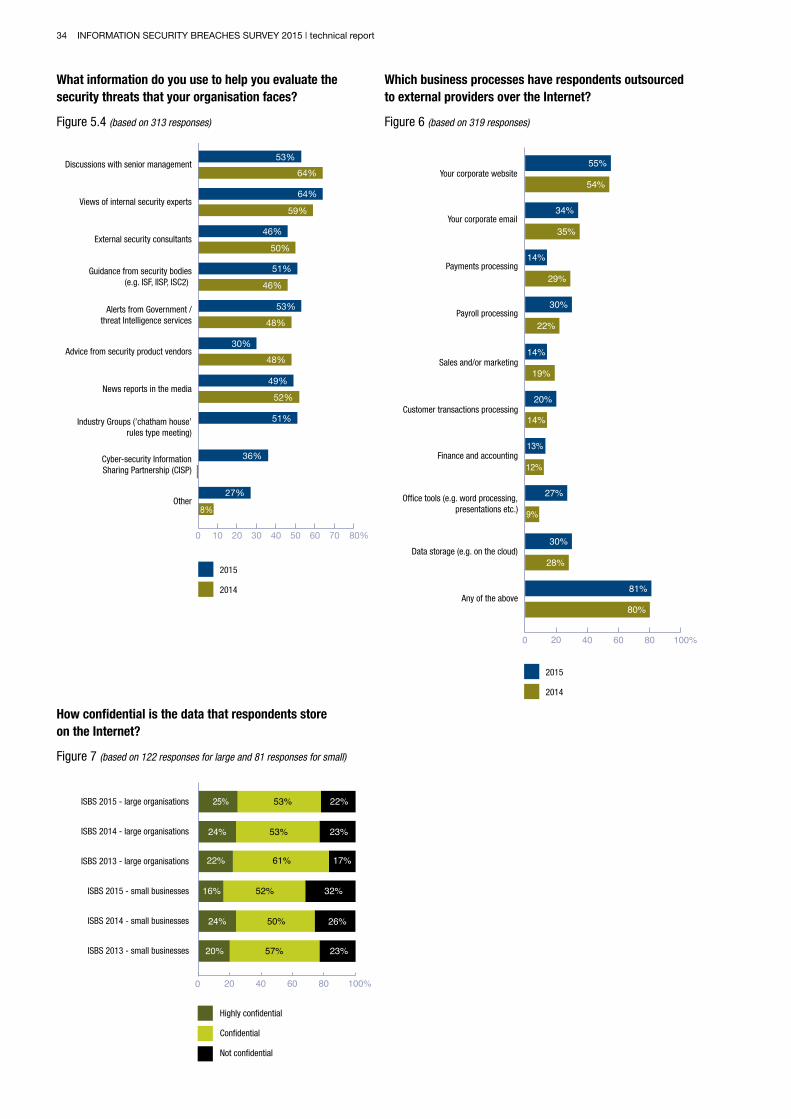
34 INFORMATION SECURITY BREACHES SURVEY 2015 | technical report
What information do you use to help you evaluate the security threats that your organisation faces?
Figure 5.4 (based on 313 responses)
0 10 20 30 40 50 60 70 80%
53%64%
59%
46%
64%
Discussions with senior management
Guidance from security bodies(e.g. ISF, IISP, ISC2)
News reports in the media
Cyber-security InformationSharing Partnership (CISP)
2015
2014
50%
51%
53%
48%
46%
30%48%
52%
51%
49%
36%
27%
8%
Views of internal security experts
External security consultants
Alerts from Government /threat Intelligence services
Advice from security product vendors
Industry Groups (’chatham house’rules type meeting)
Other
How confidential is the data that respondents store on the Internet?
Figure 7 (based on 122 responses for large and 81 responses for small)
0 20 40 60 80 100%
23%24%
22%
50%
53%
20%
24%
22%53%25%
52%16% 32%
26%
61%
57%
17%
23%
ISBS 2013 - large organisations
ISBS 2015 - small businesses
ISBS 2014 - small businesses
ISBS 2013 - small businesses
ISBS 2015 - large organisations
ISBS 2014 - large organisations
Highly confidential
Confidential
Not confidential
Which business processes have respondents outsourced to external providers over the Internet?
Figure 6 (based on 319 responses)
0 20 40 60 80 100%
55%
34%
14%
30%
14%
20%
Your corporate website
Your corporate email
Payments processing
Payroll processing
Sales and/or marketing
13%
27%
30%
Customer transactions processing
Finance and accounting
Office tools (e.g. word processing,presentations etc.)
Data storage (e.g. on the cloud)
54%
35%
29%
22%
19%
14%
12%
9%
80%Any of the above
28%
81%
2015
2014

INFORMATION SECURITY BREACHES SURVEY 2015 | technical report 35
How important is the use of social networking sites to the organisation?
Figure 8 (based on 135 responses for large and 90 responses for small)
0 20 40 60 80 100%
40%16%
11%ISBS 2013 - large organisations
ISBS 2015 - small businesses
ISBS 2014 - small businesses 31%
44%
Very important
Quite important
Not important
ISBS 2013 - small businesses 11%
11%
ISBS 2015 - large organisations
ISBS 2014 - large organisations
44%44%12%
28%12% 60%
58%
36%
36%
53%
53%
How many respondents have a formally documented information security policy?
Figure 9 (based on 153 responses for large and 87 responses for small)
0 20 40 60 80 100%
60%
54%
60%
99%
98%
ISBS 2013 - small businesses
ISBS 2015 - small businesses
ISBS 2014 - small businesses
ISBS 2013 - large organisations
ISBS 2014 - large organisations
ISBS 2015 - large organisations
98%
How do respondents ensure staff are aware of security threats?
Figure 10 (based on 152 responses for large and 87 responses for small)
0 20 40 60 80 100%
54
Programme of continuingeducation
ISBS 2015 - small businesses
ISBS 2014 - small businesses 25
ISBS 2014 - large organisations
ISBS 2015 - large organisations
68 27
On induction only
No education
5
21
58 32 10ISBS 2013 - large organisations
63 15
72 18 10
22
All values displayed are percentages
48ISBS 2013 - small businesses 29 23
How many respondents implemented ISO 27001?
Figure 11 (based on 142 responses for large and 83 responses for small)
ISBS 2015 - large organisations
ISBS 2014 - large organisations
ISBS 2013 - large organisations
0 20 40 60 80 100%
34% 44%
ISBS 2015 - small businesses
ISBS 2014 - small businesses
ISBS 2013 - small businesses
8%
18% 21% 42%
18% 21%18%
7%31%
19%
45%
14%
25% 47% 8%
22% 18% 41%19%
19%
Completely
Partially
No but plan to
No and not plan to
Has your organisation implemented Cyber Essentials and Cyber Essentials plus?
Figure 11.1 (based on 256 responses)
0 10 20 30 40 50 60%
3%
23%
3%
14%
51%
3%
No, but plan to
Cyber Essentials fullyimplemented but not badged
Partially implemented
No, and not planned
Cyber Essentials Plus fullyimplemented but not badged
Yes - badged for Cyber Essentials
Yes - badged for Cyber Essentials plus
5%
How is information security expenditure changing?
Figure 12 (based on 241 responses)
Decreasing
49%7%
0% 44%
46%4%
–% 0 +%
Increasing
44%6%
Large organisationsIn the last year
In the last year
Expected next year
Small businesses
Expected next year

36 INFORMATION SECURITY BREACHES SURVEY 2015 | technical report
What percentage of IT budget was spent on information security, if any?
Figure 13 (based on 205 responses for large and 172 responses for small)
0 20 40 60 80 100%
35
3 25
14
None
1% or less
Between 2% and 5%
Between 6% and 10%
Between 11% and 25%
More than 25%
26
12 25 20
816
32810 25 1411
ISBS 2015 - large organisations
ISBS 2015 - small businesses
ISBS 2014 - small businesses
ISBS 2013 - small businesses
15
ISBS 2014 - large organisations 0 1816 34 22 10
ISBS 2013 - large organisations
6 2612 24 27 5
2
1
2422 35 13 4
All values displayed are percentages
Which sectors spend most on security?
Figure 14 (based on 241 responses)
0 5 10 15 20 25 30%
Retail and distribution
28%
15%
12%
6%
4%
9%
7%
4%
3%
7%
7%
2%
2%
Telecommunications
Other
Technology
Utilities, energy and mining
Financial Services
Property and Construction
Services
Government
Travel, Leisure and Entertainment
Health
Education
Manufacturing
How do respondents measure the effectiveness of their security expenditure?
Figure 15 (based on 128 responses for large and 86 responses for small)
Measuring trend in securityincidents/costs
Measuring staff awareness
Benchmarking againstother organisations
Return on investment(ROI) calculations
Monitoring level ofregulatory compliance
Do not formally evaluatethe effectiveness of
information security spend
Feedback from management
Other formalised process
2015 - large organisations
2015 - small businesses
0 10 20 30 40 50 60%
34
22
23
31
10
9
42
26
21
24
52
34
2
24
3
41
Table top exercise
Active technical testing suchas penetration testing and
cyber attack simulation
50
26
17
10
All values displayed are percentages

INFORMATION SECURITY BREACHES SURVEY 2015 | technical report 37
What steps have respondents that use externally hosted services taken to obtain comfort over the external provider’s security?
Figure 16 (based on 273 responses)
0 10 20 30 40 50 60 70 80%
Obtained rights to auditthe provider’s security
Obtained a service auditor’s report(e.g. SAS 70, ISAE 3402, AAF)
on the provider’s controls
Ensured the provider is certifiedas ISO27001 compliant
Ensured all dataheld is encrypted
31%
30%
26%
26%
41%
25%
18%
25%Carried out penetration testing tocheck the provider’s security
Have a contingency plan in casethe provider ceases operation or
respondent wishes to exit
Required the provider to follow therespondent’s security standards
(ISO2700x, Cyber Essentials)
Get reports from provider onsecurity breaches that might
affect respondent’s data
Ensured contract includedprovisions for security
25%
34%
31%
40%
41%
39%
33%
63%
51%
13%
2015
2014
Do you have a formal incident management process?
Figure 16.2 (based on 293 responses)
32%
32%
19%
No
Yes, including incident identification, response and recovery
Yes, including incident identification, response, recovery,root cause analysis and continuous improvement
Yes, including incident identification, response, recovery androot cause analysis17%
Which standards and good practice guides do you ensure your suppliers comply with?
Figure 16.1 (based on 304 responses)
0 10 20 30 40 50 60%
31
13
51
37
5
19
9
4
A recognised standardsuch as ISO 27001
Government-related requirements
Payment card Industry (PCI)
Independent service auditor’s report(e.g. ISAE 3402)
None
Other
Cyber Essentials Plus
Cyber Essentials
All values displayed are percentages

38 INFORMATION SECURITY BREACHES SURVEY 2015 | technical report
How do respondents prevent staff misuse of the web and social networking sites?
Figure 17 (based on 147 responses for large and 98 responses for small)
0 20 40 60 80 100%
Block access to inappropriate websitesnot including social networking sites
Block access to inappropriate websites(through blocking software)
ISBS 2015 - large organisations
ISBS 2014 - large organisations
ISBS 2015 - small businesses
ISBS 2014 - small businesses
Via a whitelist
Via a blacklist
Block access to inappropriate websitesincluding social networking sites
New for 2015
New for 2015
New for 2015
New for 2015
14
22
45
37
32
62
90
77
17
31
48
40
3
18
15
33
All values displayed are percentages
What steps have respondents taken to mitigate the risks associated with staff using smartphones or tablets?
Figure 18 (based on 138 responses for large and 93 responses for small)
0 10 20 30 40 50 60 70 80%
4547
3444
2425
5265
3841
7075
3743
4141
3935
4858
2738
4241
1629
4964
1432
75
1821
Do not allow such devicesto remotely connect to the
organisation’s systems
Allow only corporate devicesto remotely connect to the
organisation’s systems
Define a security strategyfor mobile devices
Issued a policy onmobile computing
Trained staff on the threatsassociated with mobile devices
Protected corporate emailand calendars
Implemented strong encryption
Implemented mobile devicemanagement (to manage
devices remotely over the air)
No steps taken
All values displayed are percentages
ISBS 2015 - large organisations
ISBS 2014 - large organisations
ISBS 2015 - small businesses
ISBS 2014 - small businesses

INFORMATION SECURITY BREACHES SURVEY 2015 | technical report 39
What type of security controls do you use to manage the risks of BYOD?
Figure 18.1 (based on 304 responses)
0 10 20 30 40 50 60
9
37
19
4
13
10
5
51Protect data-in-transit- virtual private network
31
0
Protect data-at-rest(encryption)
Authentication - User to device
Authentication- User/Device to service
Authentication by password
Restrict access to approvedApps only (whitelisting)
Data Loss Prevention (DLP)
Data segregation - corporate andpersonal data is separated
Malicious code detectionand prevention
Patching
Security policy enforcementand regular updates
Event collection forenterprise analysis
Incident response for BYOD
Remote Track and Wipe
User awareness of BYOD risks
Other
Do not permit use of personaldevices for business
0
0
0
0
0
0
0
All values displayed are percentages
In the last year, how many respondents had...
Figure 19 (based on 177 responses for large and 76 responses for small)
0 20 40 60 80 100%
81%
60%
71%
75%
66%
50%
66%
25%
A malicious security incident
A serious incident
ISBS 2015 - large organisations
ISBS 2014 - large organisations
ISBS 2015 - small businesses
ISBS 2014 - small businesses
How many respondents had any form of security breach in the last year?
Figure 20 (based on 256 responses)
0 20 40 60 80 100%
74%
60%
81%ISBS 2014
ISBS 201590%
Large organisations
Small businesses
What do respondents expect in the future regarding number of incidents?
Figure 21 (based on 141 responses)
ISBS 2015 - large organisations
ISBS 2014 - large organisations
ISBS 2013 - large organisations
ISBS 2012 - large organisations
ISBS 2015- small businesses
ISBS 2014 - small businesses
Fewer incidents next year More incidents next year
ISBS 2013 - small businesses
14% 51%
8% 67%
19% 48%
46%12%
67%12%
40%5%
9% 63%
–% 0 +%
ISBS 2012 - small businesses
5% 38%

40 INFORMATION SECURITY BREACHES SURVEY 2015 | technical report
What type of breaches did respondents suffer?
Figure 22 (based on 584 responses for large and 355 responses for small)
0 20 40 60 80 100%
ISBS 2015 - large organisations
ISBS 2014 - large organisations
ISBS 2013 - large organisations
45
55
44
47
41
84
59
63
73
Infection by viruses ormalicious software
Theft or fraud involving computers
Other incidents caused by staff
Attacks by an unauthorised outsider(excluding hacking attempts)
ISBS 2015 - small businesses
ISBS 2014 - small businesses
ISBS 2013 - small businesses
6
16
81
58
10
73
22
41
70
27
55
35
33
43
66
All values displayed are percentages
What is the median number of breaches suffered by the affected companies in the last year?
Figure 23 (based on 316 responses)
Small businesses
Infection by viruses orother malicious software
Other incidents causedby staff
Large organisations
Theft or fraud involvingcomputers
Attacks by anunauthorised outsider
(excluding hacking attempts)
Any security incidents
3(5)
2(3)
2(3)
2(1)
2(3)
3(5)
6(11)
14(16)
4(6)
Equivalent comparative statistics from ISBS 2014 are shown in brackets
6(6)
What was the worst security incident faced by respondents?
Figure 24 (based on 28 responses for large and 10 responses for small)
0 5 10 15 20 25 30 35 40%
Infection by virus or malicious software
Staff misuse of the internet or email
Infringement of laws or regulations
Physical theft of computer equipment
4%
18%
40%
20%
32%
7%Systems failure or data corruption
Theft or unauthorised disclosureof confidential information
Compromise of internal systems with subsequent remote access
Attack or unauthorisedaccess by outsiders
Fraud or theft using computer systems
10%
0%
11%
10%
0%
0%
0%
0%4%
20%
4%
11%
ISBS 2015 - large organisations
ISBS 2015 - small businesses

INFORMATION SECURITY BREACHES SURVEY 2015 | technical report 41
How was the incident identified?
Figure 24.1 (based on 41 responses)
0 5 10 15 20 25 30%
ISBS 2014
By its impact on the business
By routine internal security monitoring
By other internal control activities(e.g. Reconciliations, audits)
From warning by government/law enforcement
By accident
Other
From direct reporting by the media
ISBS 2015
17%
21%
27%
29%
12%
14%
7%
4%
10%
13%
10%
17%
19%
New for 2015
How long was it between the breach occurring and it being identified as a breach?
Figure 24.2 (based on 39 responses)
0 5 10 15 20 25 30%
ISBS 2014
Immediate
Within a few hours
Within a day
Within a week
Within a month
Within 100 days
Organisation identified and dealt with risk before a breach occurred
Longer than 100 days
ISBS 2015
18%
14%
18%
29%
10%
21%
21%
14%
18%
6%
8%
1%
8%
New for 2015
New for 2015
0%

42 INFORMATION SECURITY BREACHES SURVEY 2015 | technical report
Which of the following factors contributed to the incident occuring?
Figure 24.3 (based on 42 responses)
0 10 20 30 40 50 60 70 80%
ISBS 2014
Insufficient priority placed onsecurity by senior management
Weaknesses in vetting people
Inadvertent human error
Deliberate misuse of systems by staff
Lack of staff awareness of security risks
Lack of staff awareness oflegal/regulatory requirements
Poorly designed processes
Failure to follow a defined process
Weaknesses in someone else's security
Poorly designed technical configuration
Failure to keep technicalconfiguration up to date
Failure of technical security controlto mitigate effectively
External attack specifically targetedat your organisation
Indiscriminate external attack
Portable media bypassed defences
Politically motivated as a consequenceof policies/clients etc
Other
None of the above
ISBS 2015
6722
179
4832
1720
3332
1416
2629
2922
1422
1433
1922
12New for 2015
1722
79
210
2New for 2015
510
2New for 2015
All values displayed are percentages
What made this incident the worst of the year?
Figure 24.4 (based on 39 responses)
Reputational damage
Other
Business disruption
Cost to investigate and fix
Value of lost assets
23%29%
10%12%
ISBS 2014 ISBS 2015
15%
21%10%
8%
41%30%
Who was this breach reported to?
Figure 24.5 (based on 42 responses)
0 5 10 15 20%
10%
12%
10%
12%
7%
7%
19%
14%
12%
17%
2%
2%
Action Fraud
Anti-virus company
Website administrator
Internet service provider
The Police
Bank, building society orcredit card company
Cyber-security InformationSharing Partnership (CiSP)
Other Government agency
CPNI
CERT UK
Publicly declared
Other
Not applicable - not reported
14%
What was the origin (threat actor / source) of the breach?
Figure 24.6 (based on 39 responses)
0 5 10 15 20 25 30%
26%
18%
23%
5%
0%
5%
0%
0%
3%
3%
0%3rd Party Supplier - Intentional
3rd Party Supplier - Accidental
Organised Crime
Internal (employees / contractors)Accidental
Internal (employees / contractors)Intentional
Natural (flood, fire, lightening)
Competitors
Activists
Nation-state intelligence services
Malware authors
Non-professional hackers
Other
10%

INFORMATION SECURITY BREACHES SURVEY 2015 | technical report 43
How many malicious software infections did the affected organisations suffer in the last year?
Figure 25 (based on 232 responses)
0 20 40 60 80 100%
ISBS 2014 - large organisations
ISBS 2015 - small businesses
ISBS 2013 - small businesses
ISBS 2014 - small businesses
ISBS 2015 - large organisations
ISBS 2013 - large organisations
10 41 8 10 77
49%
1
1
113 48 12 11 114
23 54 10 6 25 0
16 35 3 3 22 0
49 41 5 1 31 0
25 61 8 23 0
One only
A few
Roughly one a month
Roughly one a week
Roughly one a day
Several a day
Hundreds of times every day
All values displayed are percentages
How many systems failures or data corruptions deliberately caused by staff did the affected organisation suffer in the last year?
Figure 26 (based on 22 responses)
0 20 40 60 80 100%
One only
A few times
Roughly one a month
Sabotage by staff of systems or data
Once a day
Several a day
Roughly one a week
Hundreds of times a day
1850 14 14 5 0 0
All values displayed are percentages
What type of theft or fraud did respondents suffer?
Figure 27 (based on 513 responses for large and 351 responses for small)
0 5 10 15 20 25 30 35 40%
20
1
2
32
4
ISBS 2015 - large organisations
ISBS 2014 - large organisations
ISBS 2015 - small businesses
ISBS 2014 - small businesses
Staff used systems tocommit theft or fraud
Staff stole computer equipment
Outsider stole computer equipment
Outsider stole intellectual property
35
4
16
38
5
38
2
16
4
19
2
All values displayed are percentages
How many thefts or frauds did the affected organisations have last year?
Figure 28 (based on 189 responses)
0 20 40 60 80 100%
50% 22%
49% 35%
41% 44%
48% 31%
Staff used systems to committheft or fraud
Staff stole computer equipment
Outsider stole computer equipment
Outsider stole confidential dataor intellectual property
13%
8 5
8
37
39% 3
22
5 2
10
All values displayed are percentages
One only
A few times
Roughly one a month
Roughly one a week
Roughly one a day
Several times a day
Hundreds of times a day

44 INFORMATION SECURITY BREACHES SURVEY 2015 | technical report
How many respondents have staff related incidents?
Figure 29 (based on 166 responses for large and 90 responses for small)
0 10 20 30 40 50 60 70 80%
63%
24%
72%
24%ISBS 2015 - small businesses
ISBS 2014 - small businesses
ISBS 2015 - large organisations
ISBS 2014 - large organisations
What type of staff related incidents did respondents suffer?
Figure 30 (based on 148 responses for large and 90 responses for small)
0 20 40 60 80 100%
45%
35%
33%
55%
14%
4%
81%
27%
66%
17%
58%
22%
9%
Unauthorised access to systems or data(e.g. using someone else's ID)
Breach of data protectionlaws or regulations
Misuse of confidential information
Loss or leakage of confidentialinformation
Any of the above
8%
57%
9%
65%
57%
11%
9%
ISBS 2015 - large organisations
ISBS 2014 - large organisations
ISBS 2015 - small businesses
ISBS 2014 - small businesses
How frequent did the affected organisation have staff related incidents in the last year?
Figure 31 (based on 424 responses)
0 20 40 60 80 100%
21 51
24 49
31 53
One only
A few times
Roughly one a month
Roughly one a week
Roughly one a day
Several a day
Hundreds a day
Unauthorised access to systems ordata (e.g. using someone else's ID)
Breach of data protectionlaws or regulations
Misuse of confidential information
16
Loss or leakage of confidentialinformation
18
6
9
32 48 2
414
23
4
0
0
14
3 22 0
01
All values displayed are percentages
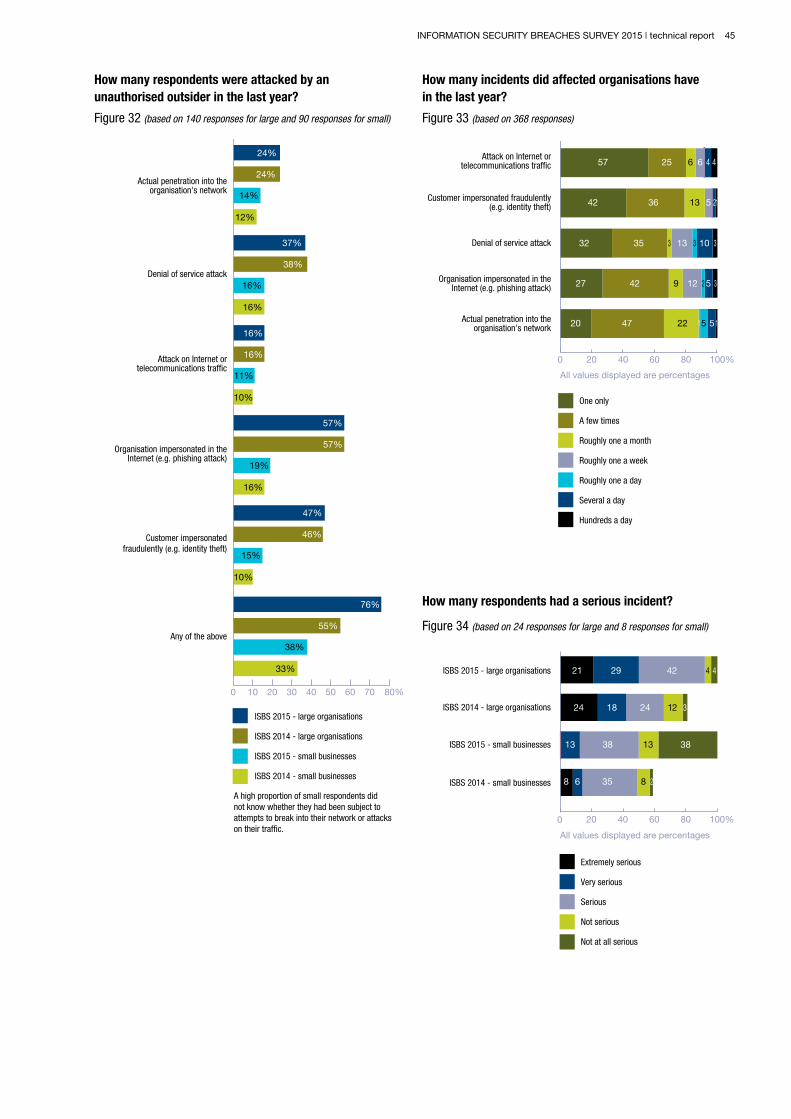
INFORMATION SECURITY BREACHES SURVEY 2015 | technical report 45
How many respondents were attacked by an unauthorised outsider in the last year?
Figure 32 (based on 140 responses for large and 90 responses for small)
0 10 20 30 40 50 60 70 80%
24%
24%Actual penetration into the
organisation's network
Denial of service attack
Attack on Internet ortelecommunications traffic
Organisation impersonated in theInternet (e.g. phishing attack)
Customer impersonatedfraudulently (e.g. identity theft)
Any of the above
A high proportion of small respondents didnot know whether they had been subject toattempts to break into their network or attackson their traffic.
14%
12%
37%
38%
16%
16%
16%
16%
11%
10%
57%
57%
19%
16%
47%
46%
15%
10%
76%
55%
38%
33%
ISBS 2015 - large organisations
ISBS 2014 - large organisations
ISBS 2015 - small businesses
ISBS 2014 - small businesses
How many incidents did affected organisations have in the last year?
Figure 33 (based on 368 responses)
0 20 40 60 80 100%
32 35
Actual penetration into theorganisation's network
Denial of service attack
Attack on Internet ortelecommunications traffic
Organisation impersonated in theInternet (e.g. phishing attack)
3 3 313
57 25 6 6
42 36 13 15 2
10
27 42 9 12 32 5
20 47 22 15
Customer impersonated fraudulently(e.g. identity theft)
4 4
15
All values displayed are percentages
One only
A few times
Roughly one a month
Roughly one a week
Roughly one a day
Several a day
Hundreds a day
How many respondents had a serious incident?
Figure 34 (based on 24 responses for large and 8 responses for small)
Extremely serious
Very serious
Serious
Not serious
Not at all serious
ISBS 2015 - large organisations
0 20 40 60 80 100%
21 29
ISBS 2014 - large organisations
ISBS 2015 - small businesses
ISBS 2014 - small businesses
42
13 1338 38
4 4
24 18 24
8 6 35 8 2
12 3
All values displayed are percentages

46 INFORMATION SECURITY BREACHES SURVEY 2015 | technical report
How much disruption to the business did the worst security incident cause?
Figure 35 (based on 36 responses)
Very serious disruption
Serious disruption
Insignificant disruption
None
Minor disruption19%
Less thana day
Between aday anda week
Between aweek anda month
More thana month
8% 3% 3% 6%
8% 3% 8% 6%
3% 11% 6% 3%
3% 6% 3% 3%
Which incidents were most disruptive to business?
Figure 36 (based on 28 responses)
Minor
Serious
Very serious
Breach of law/regulations
Fraud or theft using computer systems
Infection by malicious software
0 20 40 60 80 100%
33%
Physical theft of computer equipment
Theft or unauthorised disclosure ofconfidential data
19%
40% 20%
47%
100%
Attack on website or Internet gateway
Staff misuse of the Internet or email
33% 33%33%
33%
0%
0%
63% 13%13%
How much cash was lost or spent dealing with the worst security incident of the year?
Figure 37 (based on 52 responses for large and 31 responses for small)
0 20 40 60 80 100%
£1 - £999
£1,000 - £9,999
£10,000 - £49,999
£50,000 - £99,999
£100,000 - £249,999
£250,000 - £499,999
More than £500,000
29 186 6 12 612
11111111
13 7 13
ISBS 2015 - large organisations
ISBS 2015 - small businesses
Regulatory fines andcompensation payments
Lost assets (including lostintellectual property)
Cash spent to recover and remediate
Lost business
Regulatory fines andcompensation payments
Lost assets (including lostintellectual property)
Cash spent to recover and remediate
Lost business 7 7 713
918
33
131325
29
13 2525
50
All values displayed are percentages
To what extent did the worst incident damage the reputation of the business?
Figure 38 (based on 23 responses for large and 8 responses for small)
0 20 40 60 80 100%
32 5011
2482
No media coverage but somecustomer complaints
ISBS 2013 - large organisations
ISBS 2015 - small businesses
ISBS 2014 - small businesses 17 79
7
Some adverse media coverage
Only known about internally
Extensive adverse media coverageover a prolonged period
ISBS 2013 - small businesses 195
4
ISBS 2015 - large organisations
ISBS 2014 - large organisations
431717 22
751313
All values displayed are percentages
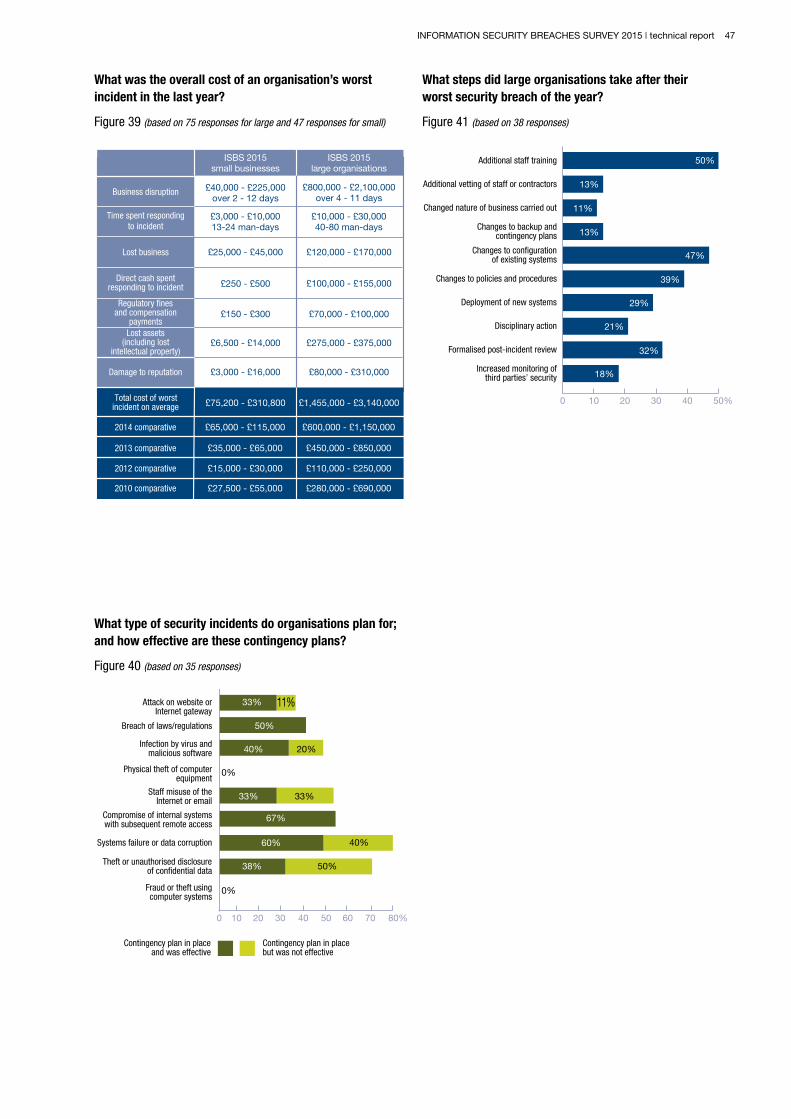
INFORMATION SECURITY BREACHES SURVEY 2015 | technical report 47
What was the overall cost of an organisation’s worst incident in the last year?
Figure 39 (based on 75 responses for large and 47 responses for small)
ISBS 2015large organisations
Business disruption
Time spent respondingto incident
Regulatory finesand compensation
payments
£40,000 - £225,000over 2 - 12 days
ISBS 2015small businesses
Direct cash spentresponding to incident
Total cost of worstincident on average
£800,000 - £2,100,000over 4 - 11 days
£3,000 - £10,00013-24 man-days
£10,000 - £30,00040-80 man-days
£25,000 - £45,000 £120,000 - £170,000
£150 - £300 £70,000 - £100,000
£275,000 - £375,000£6,500 - £14,000
£75,200 - £310,800 £1,455,000 - £3,140,000
2012 comparative £15,000 - £30,000 £110,000 - £250,000
Damage to reputation £80,000 - £310,000£3,000 - £16,000
Lost assets(including lost
intellectual property)
2010 comparative £27,500 - £55,000 £280,000 - £690,000
£250 - £500 £100,000 - £155,000
Lost business
2014 comparative £65,000 - £115,000 £600,000 - £1,150,000
2013 comparative £35,000 - £65,000 £450,000 - £850,000
What type of security incidents do organisations plan for; and how effective are these contingency plans?
Figure 40 (based on 35 responses)
0 10 20 30 40 50 60 70 80%
Contingency plan in placeand was effective
40%
33% 11%50%
0%
0%
Attack on website orInternet gateway
Breach of laws/regulations
Infection by virus andmalicious software
Compromise of internal systems with subsequent remote access
Physical theft of computerequipment
Staff misuse of theInternet or email
Systems failure or data corruption
Theft or unauthorised disclosureof confidential data
Fraud or theft usingcomputer systems
Contingency plan in placebut was not effective
20%
33% 33%
67%
60% 40%
38% 50%
What steps did large organisations take after their worst security breach of the year?
Figure 41 (based on 38 responses)
0 10 20 30 40 50%
50%
11%
13%
47%
39%
29%
21%
32%
18%
Additional staff training
Additional vetting of staff or contractors
Changed nature of business carried out
Changes to policies and procedures
Changes to backup andcontingency plans
Changes to configurationof existing systems
Deployment of new systems
Disciplinary action
Increased monitoring ofthird parties’ security
Formalised post-incident review
13%
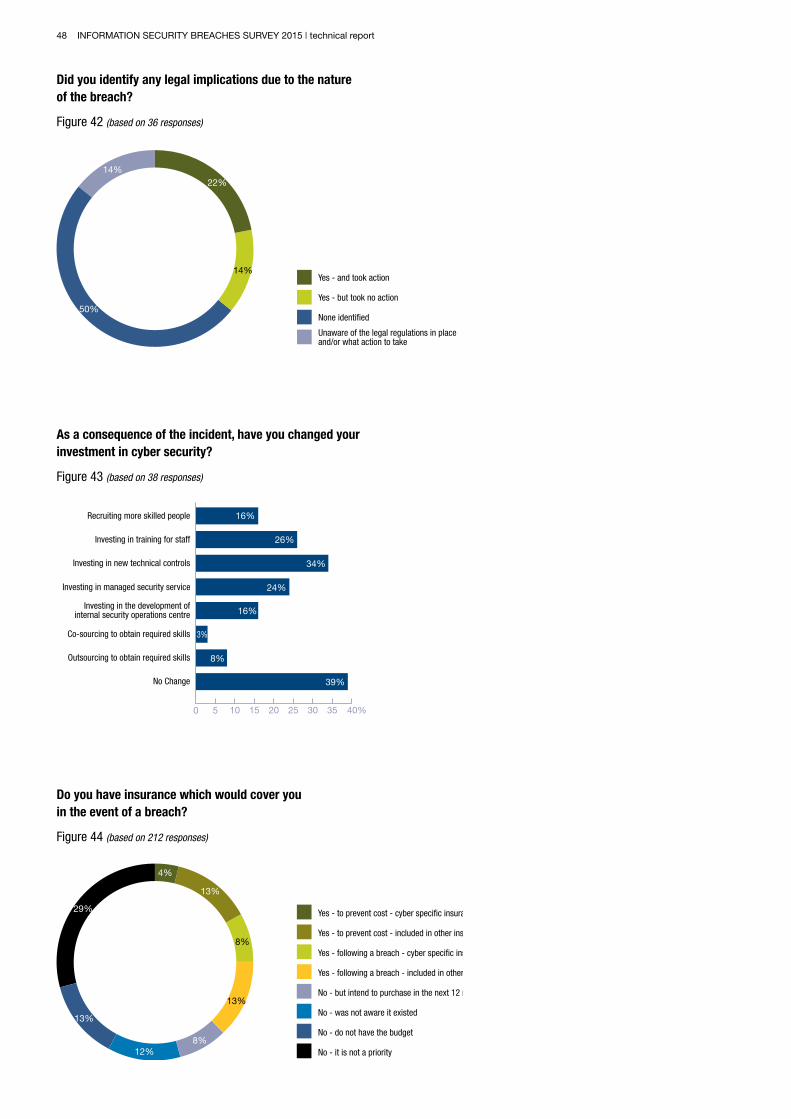
48 INFORMATION SECURITY BREACHES SURVEY 2015 | technical report
Did you identify any legal implications due to the nature of the breach?
Figure 42 (based on 36 responses)
Yes - and took action
Yes - but took no action
None identified
Unaware of the legal regulations in place and/or what action to take
14%22%
14%
50%
As a consequence of the incident, have you changed your investment in cyber security?
Figure 43 (based on 38 responses)
0 5 10 15 20 25 30 35 40%
16%
34%
24%
16%
3%
8%
39%
Recruiting more skilled people
Investing in training for staff
Investing in new technical controls
Co-sourcing to obtain required skills
Investing in managed security service
Investing in the development ofinternal security operations centre
Outsourcing to obtain required skills
No Change
26%
Do you have insurance which would cover you in the event of a breach?
Figure 44 (based on 212 responses)
Yes - to prevent cost - cyber specific insurance
Yes - to prevent cost - included in other insurance
Yes - following a breach - cyber specific insurance
Yes - following a breach - included in other insurance
No - but intend to purchase in the next 12 months
No - was not aware it existed
No - do not have the budget
No - it is not a priority
4%
13%
8%
13%
8%12%
13%
29%

INFORMATION SECURITY BREACHES SURVEY 2015 | technical report 49
INDEPENDENT REVIEWER INFORMATION
We’d like to thank all the independent reviewers who ensured the survey was targeted at the most important security issues and the results were fairly interpreted.
The Association of the British Pharmaceutical Industry (ABPI) is a trade association which represents the innovative research-based biopharmaceutical companies, large, medium and small, leading an exciting new era of biosciences in the UK.
Our industry is a major contributor to the economy of the UK, bringing life-saving and life-enhancing medicines to patients. Our members supply 90 per cent of all medicines used by the NHS, and are researching and developing over two-thirds of the current medicines pipeline, ensuring that the UK remains at the forefront of helping patients prevent and overcome diseases.
The ABPI is recognised by government as the industry body negotiating on behalf of the branded pharmaceutical industry for statutory consultation requirements including the pricing scheme for medicines in the UK.
For further information please go to www.abpi.org.uk.
ICAEW is a world leading professional membership organisation that promotes, develops and supports over 144,000 chartered accountants worldwide. ICAEW’s IT Faculty provides products and services to help its members make the best possible use of IT. It also represents chartered accountants’ IT-related interests and expertise, contributes to IT-related public affairs and helps those in business to keep up to date with IT issues and developments. For more information about the IT Faculty please visit www.icaew.com/itfac.
The Institution of Engineering and Technology (IET) The IET is a world leading professional organisation sharing and advancing knowledge to promote science, engineering and technology across the world. The IET has more than 160,000 members worldwide in 127 countries and is a professional home for life for engineers and technicians, and a trusted source of essential engineering intelligence. For further information, please visit www.theiet.org.
The BBA is the leading trade association for the UK banking sector with more than 230 member banks headquartered in over 50 countries with operations in 180 jurisdictions worldwide. Eighty per cent of global systemically important banks are members of the BBA. As the representative of the world’s largest international banking cluster the BBA is the voice of UK banking.
Our network also includes over 80 of the world’s leading financial and professional services organisations. Our members manage more than £7 trillion in UK banking assets, employ nearly half a million individuals nationally, contribute over £60 billion to the UK economy each year and lend over £150 billion to UK businesses.
BCS, The Chartered Institute for IT, promotes wider social and economic progress through the advancement of information technology science and practice. We serve over 75,000 members and bring practitioners, academics, government and industry together to share knowledge, shape public policy, promote new thinking, inform the design of new curricula and inform the public. We also deliver professional development tools for practitioners and employees and as a leading IT qualification body, we offer a range of widely recognised qualifications. More information is available at www.bcs.org.
CREST is a not-for-profit organisation that represents the technical information security industry, primarily penetration testing, cyber security incident response and security architecture services.
CREST offers public and private sector organisations an assurance that the technical security advisors they appoint are competent, qualified and professional with current knowledge. It also ensures that the CREST member companies they engage with have the appropriate processes and controls in place to perform the services for which they have been appointed and protect sensitive client-based information. www.crest-approved.org.
ISACA, is an international, non-profit, global association, that engages in the development, adoption and use of globally accepted, industry-leading knowledge and practices for information systems. ISACA has more than 100,000 members worldwide and has been in existence since 1969. The London Chapter, was established in 1981, other UK Chapters now include Northern England, Central England, Winchester and Scotland, and there is also an Ireland Chapter. The London Chapter has over 2,500 members who come from a wide cross-section of business including the accountancy and information systems professions, central and local government, the banking, manufacturing and service sectors and academia. See www.isaca.org.uk.
(ISC)² is the largest not-for-profit membership body of certified information security professionals worldwide, with over 89,000 members worldwide, including 14,000 in the EMEA. Globally recognised as the Gold Standard, (ISC)² issues the CISSP and related concentrations, CSSLP, CAP, and SSCP credentials to qualifying candidates.
More information is available at www.isc2.org.
ORIC is the leading operational risk consortium for the (re)insurance and asset management sector globally. Founded in 2005, to advance operational risk management and measurement, ORIC facilitates the anonymised and confidential exchange of operational risk data between member firms, providing a diverse, high quality pool of qualitative and quantitative information on relevant operational risk exposures. As well as providing operational risk data, ORIC provides industry benchmarks, undertakes leading edge research, sets trusted standards for operational risk and provides a forum for members to exchange ideas and best practice. ORIC has over 30 members with accelerating growth. www.abioric.com.
Founded in 1989, the Information Security Forum (ISF) is an independent, not-for-profit association of leading organisations from around the world. It is dedicated to investigating, clarifying and resolving key issues in cyber, information security and risk management and developing best practice methodologies, processes and solutions that meet the business needs of its Members. ISF Members benefit from harnessing and sharing in-depth knowledge and practical experience drawn from within their organisations and developed through an extensive research and work program. The ISF provides a confidential forum and framework, which ensures that Members adopt leading-edge information security strategies and solutions. And by working together, Members avoid the major expenditure required to reach the same goals on their own. Further information about ISF research and membership is available from www.securityforum.org.
Cyber Security Challenge UK is a not for profit company that identifies, inspires and informs people with a talent for Cyber Security, and brings them together with leading organisations to raise awareness of learning opportunities and careers.


© Crown copyright 2015
You may re-use this information (not including logos and cover image) free of charge in any format or medium, under the terms of the Open Government Licence. Visit www.nationalarchives.gov.uk/doc/open-government-licence, write to the Information Policy Team, The National Archives, Kew, London TW9 4DU, or email: [email protected].
This publication is available from www.gov.uk/bis
Any enquiries regarding this publication should be sent to:
Department for Business, Innovation and Skills1 Victoria StreetLondon SW1H 0ETTel: 020 7215 5000
If you require this publication in an alternative format, email [email protected], or call 020 7215 5000.
URN BIS/15/302