information propagation and network evolution on … propagation and network evolution on the web...
TRANSCRIPT

Information Propagation and Network Evolution on
the Web
Jure Leskovec, Mary McGlohon, Christos Faloutsos ∗
Natalie Glance †, Matthew Hurst ‡
1 Introduction
Using data gathered from blogs, this work seeks to understand the structureand formation of social networks, and the patterns of information propa-gation through these networks. Blogs have become an important mediumof communication and information on the World Wide Web. Due to theiraccessible and timely nature, they are also an intuitive source for data in-volving the formation of social networks and the spread of information andideas. By studying link patterns of existing entities and new arrivals to ablog network, we can infer the way in which social networks are formed.And, by examining linking patterns from one blog post to another, we caninfer the way information spreads through a social network over the Web.
We seek to discover how information propagates through an existingnetwork. Do trees representing the flow of information maintain certainstructural properties? Does traffic in the blog network exhibit bursty and/orperiodic behavior? After a topic becomes popular, how does interest die off– linearly, or exponentially? What models best exhibit such behavior?
We would also like to gain an understanding of how different entities inthe social network function with regard to the propagation of information.Do some blogs act as hubs of information, often starting cascades of informa-tion to flow? Do certain subnetworks have different patterns of informationpropagation?
∗School of Computer Science, Carnegie Mellon University, Pittsburgh, PA, USA†Google, Pittsburgh, PA, USA‡Microsoft Live Labs, Bellevue, WA, US
1

1.1 Summary of findings and contributions
We note several temporal and topological observations in a blog network.Temporally, we note periodic behavior in traffic, and demonstrate that, sur-prisingly, post popularity drops off with a power law. Most topologicalnetwork characteristics follow power laws: in-degree, out-degree, cascadesize, and size of particular cascade shapes. We also produce a simple epi-demiological model which captures most of the topological characteristics.
Delving further into the network entities, we use PCA to show that postsbelonging to the same blog cluster into certain network behaviors, and thatblogs in the same genre tend to cluster together based on their participationin different cascade shapes. In one specific case, we show that conservativeblogs have more tree-like structures, while humorous blogs behave more like“stars”.
2 Related Work
2.1 Blogs and social networks
Much work on modeling link behavior in large-scale on-line data has beendone in the blog domain [1, 2, 22]. The authors note that, while informationpropagates between blogs, examples of genuine cascading behavior appearedrelatively rare. This may, however, be due in part to the Web-crawling andtext analysis techniques used to infer relationships among posts [2, 15]. Ourwork here differs in a way that we concentrate solely on the propagation oflinks, and do not infer additional links from text of the post, which gives usmore accurate information.
There are several potential models to capture the structure of the blogo-sphere in particular, and of social networks in general. Work on informationdiffusion based on topics [15] showed that for some topics, their popularityremains constant in time (“chatter”) while for other topics the popularity ismore volatile (“spikes”). Authors in [22] analyze community-level behavioras inferred from blog-rolls – permanent links between “friend” blogs. Au-thors extended this work in [23] to analysis of several topological propertiesof link graphs in communities, finding that much behavior was characterizedby “stars”. Analysis based on thresholding as well as alternative probabilis-tic models of node activation is considered in the context of finding the mostinfluential nodes in a network [18], and for viral marketing [26]. Such ana-lytical work posits a known network, and uses the model to find the mostinfluential nodes.
2

A number of generative models have been proposed for social networks ingeneral [14, 19, 21, 33] Fitting static statistical models has also proved suc-cessful. They may be fit directly to the data, and parameters are estimated.A well-known class is exponential random graph, or p∗, models. Based onFrank and Strauss’ Markov graphs [12], p∗ models are models defined bycertain statistics of a graph, such as transitivity (if a is a friend of b andc of b, c is a friend of a), or triangles. The model places binary values onpotential links, and parameters are then fit to empirical data. They may beused to define complicated dependency patterns [28].
2.2 Information cascades
Information cascades are phenomena in which an action or idea becomeswidely adopted due to the influence of others, typically, neighbors in somenetwork [5, 13, 14]. Cascades on random graphs using a threshold modelhave been theoretically analyzed [32]. Empirical analysis of the topologi-cal patterns of cascades in the context of a large product recommendationnetwork is in [25] and [24].
As Carley addresses in [6], the diffusion of information and influencethrough a social network is greatly affected by the topology of the network.For this reason, it is important to address topological structure before study-ing cascades, which we will do in this work.
2.3 Virus propagation models in epidemiology
The study of epidemics offers powerful models for analyzing the spread ofviruses. Our topic propagation model is based on the SIS (Susceptible-Infected-Susceptible) model of epidemics [3]. This is models flu-like viruses,where an entity begin as “susceptible”, may become “infected” and infec-tious, and then heals to become susceptible again. A key parameter is theinfection probability β, that is, the probability of a disease transmission ina single contact. Of high interest is the epidemic threshold, that is, the crit-ical value of β, above which the virus will spread and create an epidemic,as opposed to becoming extinct. There is a huge literature on the studyof epidemics on full cliques, homogeneous graphs, infinite graphs (see [16]for a survey), with recent studies on power-law networks [10] and arbitrarynetworks [31].
There have also been applications of these models in the domain of com-puter viruses. For example, Chen and Carley propose using state models
3

similar to SIR for modeling countermeasure propagation, in order to com-pete with virus propagation [7].
2.4 Self-similarity and heavy-tailed distributions
Self-similarity is often a result of heavy-tailed dynamics. Human interactionsmay be modeled with networks, and attributes of these networks often followpower law distributions [11]. Such distributions have a PDF (probabilitydensity function) of the form p(x) ∝ xγ , where p(x) is the probability toencounter value x and γ is the exponent of the power law. In log-log scales,such a PDF gives a straight line with slope γ. For γ < −1, we can showthat the Complementary Cumulative Distribution Function (CCDF) is alsoa power law with slope γ + 1, and so is the rank-frequency plot pioneeredby Zipf [34], with slope 1/(1 + γ). For γ = −2 we have the standardZipf distribution, and for other values of γ we have the generalized Zipfdistribution.
Fitting heavy-tailed distributions is done in different ways. The methodused in this work is done by taking histogram data, then taking the logarithmf both axes, and fitting a least-squares regression line to the log-log data. AnR2 coefficient greater than 0.95 suggests the data may be well-approximatedwith a power law distribution. Sometimes the tail is truncated, in this casebecause of artifacts of the data. One may also fit the empirical distribution,instead of the histogram data, with least-squares regression.
There are statistical methods of determining exactly which heavy-taileddistribution (if any) by which data are best approximated, such as maximumlikelihood, and the Komolgorov-Smirnov test in Bayesian model selection.Detail of these methods may be found in work by Clauset, Shalizi, andNewman [8] and by Stouffer, Malmgren, and Amaral [29].
3 Preliminaries
In this section we introduce terminology and concepts regarding blog net-works and information cascades.
3.1 Blogs and Cascades
Blogs (weblogs) are web sites that are updated on a regular basis. Blogshave the advantage of being easy to access and update, and have come toserve a variety of purposes. Often times individuals use them for onlinediaries and social networking; other times news sites have blogs for timely
4

B1 B2
B4B3
B1 B2
B4B3
11
2
1 3
1
a
b c
de
(a) Blogosphere (b) Blog network (c) Post network
Figure 1: The model of the blogosphere (a). Squares represent blogs andcircles blog-posts. Each post belongs to a blog, and can contain hyper-links to other posts and resources on the web. We create two networks:a weighted blog network (b) and a post network (c). Nodes a, b, c, d arecascade initiators, and node e is a connector.
stories. Blogs are composed of posts that typically have room for commentsby readers – this gives rise to discussion and opinion forums that are notpossible in the mass media. Also, blogs and posts typically link each other, aswell as other resources on the Web. Thus, blogs have become an importantmeans of transmitting information. The influence of blogs was particularlyrelevant in the 2004 U.S. election, as they became sources for campaignfundraising as well as an important supplement to the mainstream media[1]. Understanding the ways in which information is transmitted amongblogs is important to developing concepts of present-day communication.
We model two graph structures emergent from links in the blogosphere,which we call the Blog network and the Post network. Figure 1 illustratesthese structures. Blogosphere is composed of blogs, which are further com-posed of posts. Posts then contain links to other posts and resources on theweb.
From Blogosphere (a), we obtain the Blog network (b) by collapsing alllinks between blog posts into directed edges between blogs. A blog-to-blogedge is weighted with the total number of links where a post in source blogpoints to a post in destination blog. From the Blog network we can infer asocial network structure, under the assumption that blogs that are “friends”link each other often.
In contrast, to obtain the Post network (c), we ignore the posts’ parentblogs and focus on the link structure. Associated with each post is the dateof the post, so we label the edges in Post network with the date difference∆ > 0 between the source and the destination posts. Let tu and tv denotepost times of posts u and v, where u links to v, then the link time ∆ = tu−tv.
5

d
e
b c
e
a
Figure 2: Cascades extracted from Figure 1. Cascades represent the flow ofinformation through nodes in the network. To extract a cascade we beginwith an initiator with no out-links to other posts, then add nodes with edgeslinking to the initiator, and subsequently nodes that link to any other nodesin the cascade.
From the Post network, we extract information cascades, which are in-duced subgraphs by edges representing the flow of information. A cascade(also known as conversation tree) has a single starting post called the cascadeinitiator with no out-links to other posts (e.g. nodes a, b, c, d in Figure 1(c)).Posts then join the cascade by linking to the initiator, and subsequently newposts join by linking to members within the cascade. Figure 2 gives a listof cascades extracted from Post network in Figure 1(c). Since a link pointsfrom the follow-up post to the existing (older) post, influence propagatesfollowing the reverse direction of the edges.
We define a non-trivial cascade to be a cascade containing at least twoposts. Therefore, a trivial cascade is an isolated post. Figure 2 shows all non-trivial cascades in Figure 1(c), but not the two trivial cascades. Cascadesform two main shapes, which we refer to as stars and chains. A star occurswhen a single center post is linked by several other posts, but the links donot propagate further. This produces a wide, shallow tree. Conversely, achain occurs when a root is linked by a single post, which in turn is linkedby another post. This creates a deep tree that has little breadth. As we willlater see most cascades are somewhere between these two extreme points.
3.2 Principal component analysis
Given many vectors in D-dimensional space, how can visualize them, whenthe dimensionality D is high? This is exactly where principal componentanalysis (PCA) helps. PCA will find the optimal 2-dimensional plane toproject the data points, maintaining the pair-wise distances as best as pos-sible. PCA is even more powerful than that: it can give us a sorted list ofdirections (“principal components”) on which we can project. See [17] or[20] for more details.
6
0
10000
20000
30000
40000
50000
60000
0 10 20 30 40 50 60 70 80 90
Num
ber
of p
osts
Time [1 day]
Aug 1
Jul 4
Sept 29
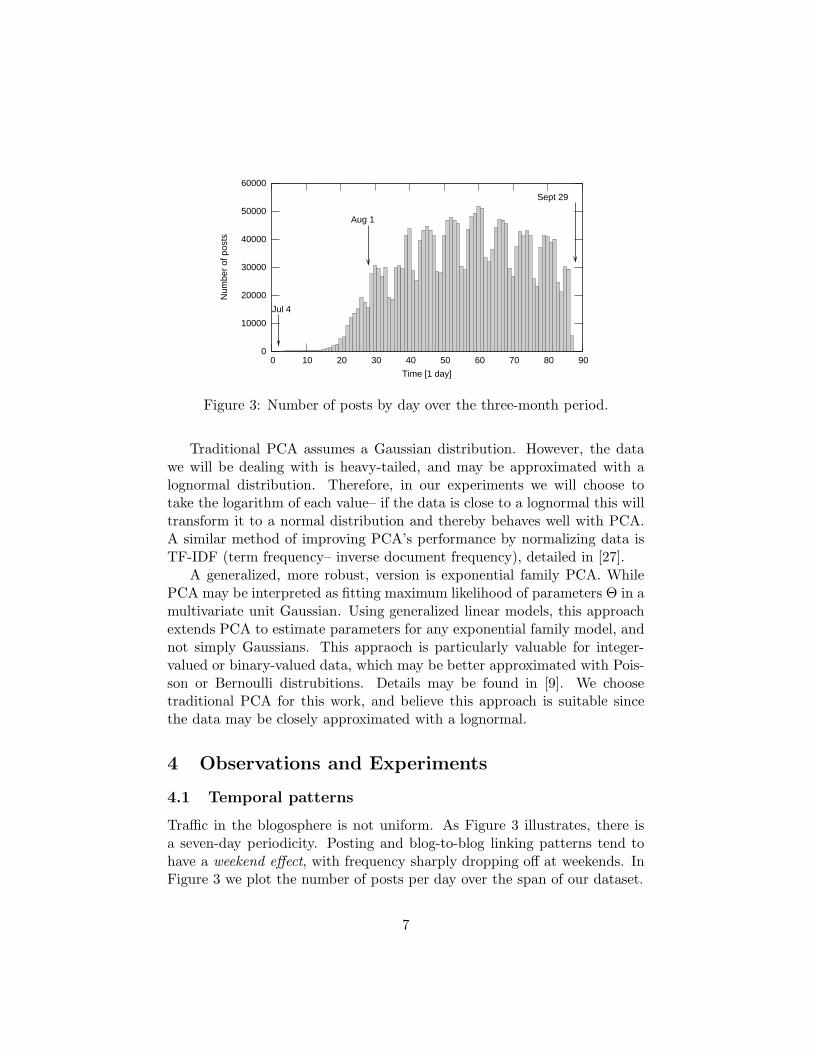
Figure 3: Number of posts by day over the three-month period.
Traditional PCA assumes a Gaussian distribution. However, the datawe will be dealing with is heavy-tailed, and may be approximated with alognormal distribution. Therefore, in our experiments we will choose totake the logarithm of each value– if the data is close to a lognormal this willtransform it to a normal distribution and thereby behaves well with PCA.A similar method of improving PCA’s performance by normalizing data isTF-IDF (term frequency– inverse document frequency), detailed in [27].
A generalized, more robust, version is exponential family PCA. WhilePCA may be interpreted as fitting maximum likelihood of parameters Θ in amultivariate unit Gaussian. Using generalized linear models, this approachextends PCA to estimate parameters for any exponential family model, andnot simply Gaussians. This appraoch is particularly valuable for integer-valued or binary-valued data, which may be better approximated with Pois-son or Bernoulli distrubitions. Details may be found in [9]. We choosetraditional PCA for this work, and believe this approach is suitable sincethe data may be closely approximated with a lognormal.
4 Observations and Experiments
4.1 Temporal patterns
Traffic in the blogosphere is not uniform. As Figure 3 illustrates, there isa seven-day periodicity. Posting and blog-to-blog linking patterns tend tohave a weekend effect, with frequency sharply dropping off at weekends. InFigure 3 we plot the number of posts per day over the span of our dataset.
7

100
101
102
101
102
103
104
105
106
Num
ber
of in
−lin
ks
Days after post
Posts
= 541905.74 x−1.60 R2=1.00
100
101
102
100
101
102
103
104
105
Num
ber
of in
−lin
ks
Days after post
Posts
= 60853.80 x−1.46 R2=0.99
All posts Only Monday posts
Figure 4: Number of in-links vs. the days after the post in log-linear scale,after removing the day-of-the week effects. Power law fits to the data, basedon reasonable lookahead of 30 days, produce exponents −1.6 and −1.46.
Next, we examine how a post’s popularity grows and declines over time.We collect all in-links to a post and plot the number of links occurring aftereach day following the post. This creates a curve that indicates the rise andfall of popularity. By aggregating over a large set of posts we obtain a moregeneral pattern.
However, the weekend effect creates abnormalities in the plots we mustaccount for. We smooth the in-link plots by applying a weighting parameterto the plots separated by day of week. For each delay ∆ on the horizontalaxis, we estimate the corresponding day of week d, and we prorate the countfor ∆ by dividing it by l(d), where l(d) is the percent of blog links occurringon day of week d. This simulates a popularity drop-off that might occur ifposting and linking behavior were uniform throughout the week.
We fit the power-law distribution with a cut-off in the tail (bottom row).We fit on 30 days of data, as most posts in the graph have complete in-linkpatterns for the 30 days following publication. We performed the fittingover all posts and for all days of the week separately, and found a stablepower-law exponent of around −1.5, which is exactly the value predicted bythe model where the bursty nature of human behavior is a consequence of adecision based queuing process [4] – when individuals execute tasks based onsome perceived priority, the timing of the tasks is heavy tailed, with mosttasks being rapidly executed, whereas a few experience very long waitingtimes.
8

100
101
102
103
104
100 101 102 103 104
Cou
nt
Blog in-degree
5.7e3 x-1.7 R2:0.92
100
101
102
103
104
100 101 102 103
Cou
nt
Blog out-degree
Figure 5: Blog network in- and out-degree distributions.
100
101
102
103
104
100 101 102 103 104
Cou
nt
Posts per Blog
x=40
3e6 x-2.2 R2:0.92
100
101
102
103
104
105
100 101 102 103
Cou
nt
Number of blog-to-blog links
1e5 x-2.73, R2:0.95
Figure 6: Distribution of the number of posts per blog (a); Distribution ofthe number of blog-to-blog links, i.e. the distribution over the Blog networkedge weights (b).
4.2 Blog network and Post network topology
The first graph we consider topologically is the Blog network. As illustratedin Figure 1(c), every node represents a blog and there is a weighted directededge between blogs u and v, where the weight of the edge corresponds to thenumber of posts from blog u linking to posts at blog v. Connectivity-wise,half of the blogs belong to the largest connected component and the otherhalf are isolated blogs.
We show the in- and out-degree distribution in Figure 5. Notice bothfollow a heavy-tailed distribution. The number of posts per blog, as shownin Figure 6(a), also follows a heavy-tailed distribution. The deficit of blogswith low number of posts and the knee at around 40 posts per blog canbe explained by the fact that we are using a dataset biased towards active
9

100
101
102
103
104
105
100 101 102 103 104
Cou
nt
Post in-degree
5e4 x-2.15 R2:0.95
100
101
102
103
104
105
106
100 101 102 103
Cou
nt
Post out-degree
1e5 x-2.95 R2:0.98
Figure 7: Post network in- and out-degree distribution.
G2 G3 G4 G5 G6 G7 G8 G9 G10 G11
Figure 8: Common cascade shapes ordered by frequency. Cascade with labelGr has the frequency rank r.
blogs. However, our sample still maintains the power law in the number ofblog-to-blog links as shown in 6(b).
In contrast to Blog network the Post network is very sparsely connected.98% of the posts are isolated, and the largest connected component accountsfor 106, 000 nodes, while the second largest has only 153 nodes. Figure 7shows the in- and out-degree distributions of the Post network which, notsurprisingly, follow a power law.
4.3 Information propagation through cascades
We are especially interested in how information propagates, and this phe-nomenon is illustrated by cascades. Given the Post network we extracted allinformation cascades using the following procedure. We found all cascadeinitiator nodes, i.e. nodes that have zero out-degree, and started followingtheir in-links. This process gives us a directed acyclic graph with a singleroot node. To obtain the examples of the common shapes and count theirfrequency we used algorithms described in [25]. We find a total of 2, 092, 418cascades.
We give examples of common Post network cascade shapes in Figure 8.A node represents a post and the influence flows from the top to the bot-
10

101
102
103
104
105
106
100 101 102
Cou
nt
Cascade node out-degree
1.6e5 x -1.96 R2:0.92
100
101
102
103
10410
0
101
102
103
104
105
k (post in−degree at level L)
N(k
≥ x
)
L=1, γ=−1.37L=3, γ=−1.35L=5, γ=−1.23L=7, γ=−1.26L=10, γ=−1.34
(a) Out-degree (b) In-degree at level L
Figure 9: Out-degree distribution over all cascades extracted from the Postnetwork (a), and the in-degree distribution at level L of the cascade (b).Note all distributions are heavy tailed and the in-degree distribution is re-markably stable over the levels.
tom. Cascades tend to be wide and not too deep– stars and shallow burstycascades are the most common type of cascades.
We next examine the general cascade behavior by measuring and charac-terizing the properties of real cascades. First, we observe the degree distri-butions of the cascades. This means that from the Post network we extractall the cascades and measure the overall degree distribution. Essentially wework with a bag of cascades, where we treat a cascade as separate discon-nected sub-graph in a large network. Similar to other networks, in- andout-degree distribution of the bag of cascades follow power laws with expo-nents of -2.2 and -1.92, respectively (Figure 9). Further examination showedthat the in-degree exponent is stable and does not change much given levelL in the cascade (a node is at level L if it is L hops away from the cascadeinitiator). This means that posts still attract attention (get linked) even ifthey are somewhat late in the cascade and appear towards the bottom of it.
We next ask: what distribution do cascade sizes follow? Does the proba-bility of observing a cascade on n nodes decreases exponentially with n? Weexamine the Cascade Size Distributions over the bag of cascades extractedfrom the Post network. We consider three different distributions: a distribu-tion over all cascade sizes, and separate size distributions of star and chaincascades. We chose stars and chains since they are well defined and giventhe number of nodes in the cascade, there is no ambiguity in the topologyof a star or a chain.
Figure 10 gives the Cascade Size Distribution plots. Notice all follow a
11

100
101
102
103
104
105
100 101 102 103 104
Cou
nt
Cascade size (number of nodes)
3e4 x-1.97 R2:0.93
100
101
102
103
104
100 101 102 103
Cou
nt
Size of a star (number of nodes)
1.8e6 x-3.14 R2:0.98
100
101
102
103
104
105
100 101 102
Cou
nt
Size of a chain (number of nodes)
2e+7 x-8.6 R2:0.99
(a) All cascades (b) Star cascade (c) Chain cascade
Figure 10: Size distribution over all cascades (a), only stars (b), and chains(c). They all follow heavy tailed distributions with increasingly steeperslopes.
heavy-tailed distribution, with slopes ≈ −2 overall (Figure 10(a)). So theprobability of observing a cascade on n nodes follows a Zipf distribution:p(n) ∝ n−2. Stars have the power-law exponent ≈ −3.1 (Figure 10(b)), andchains are small and rare and decay with exponent ≈ −8.5 (Fig. 10(c)).
4.4 Cascade generation model
We present a conceptual model for generating information cascades thatproduces cascade graphs matching several properties of real cascades. Ourmodel is intuitive and requires only a single parameter that correspondsto how interesting (easy spreading) are the conversations in general on theblogosphere.
Intuitively, cascades are generated by the following principle. A post isposted at some blog, other bloggers read the post, some create new posts,and link the source post. This process continues and creates a cascade. Onecan think of cascades being a graph created by the spread of the virus overthe Blog network. This means that the initial post corresponds to infectinga blog. As the cascade unveils, the virus (information) spreads over thenetwork and leaves a trail. To model this process we use a single parameterβ that measures how infectious are the posts on the blogosphere. Our modelis very similar to the SIS (susceptible – infected – susceptible) model fromthe epidemiology [16].
Next, we describe the model. Each blog is in one of two states: infectedor susceptible. If a blog is in the infected state this means that the bloggerjust posted a post, and the blog now has a chance to spread its influence.Only blogs in the susceptible (not infected) state can get infected. When ablog successfully infects another blog, a new node is added to the cascade,
12

and an edge is created between the node and the source of infection. Thesource immediately recovers, i.e. a node remains in the infected state onlyfor one time step. This gives the model ability to infect a blog multipletimes, which corresponds to multiple posts from the blog participating inthe same cascade.
More precisely, a single cascade of the Cascade generation model is gen-erated by the following process.
(i) Uniformly at random pick blog u in the Blog network as a startingpoint of the cascade, set its state to infected, and add a new node uto the cascade graph.
(ii) Blog u that is now in infected state, infects each of its uninfecteddirected neighbors in the Blog network independently with probabilityβ. Let {v1, . . . , vn} denote the set of infected neighbors.
(iii) Add new nodes {v1, . . . , vn} to the cascade and link them to node uin the cascade.
(iv) Set state of node u to not infected. Continue recursively with step (ii)until no nodes are infected.
We make a few observations about the proposed model. First, note thatthe blog immediately recovers and thus can get infected multiple times.Every time a blog gets infected a new node is added to the cascade. Thisaccounts for multiple posts from the blog participating in the same cascade.Second, we note that in this version of the model we do not try to accountfor topics or model the influence of particular blogs. We assume that allblogs and all conversations have the same value of the parameter β. Third,the process as describe above generates cascades that are trees. This is notbig limitation since we observed that most of the cascades are trees or tree-like. In the spirit of our notion of cascade we assume that cascades have asingle starting point, and do not model for the collisions of the cascades.
4.4.1 Validation of the model
We validate our model by extensive numerical simulations. We comparethe obtained cascades towards the real cascades extracted from the Postnetwork. We find that the model matches the cascade size and degree dis-tributions.
We use the real Blog network over which we propagate the cascades.Using the Cascade generation model we also generate the same number of
13

Figure 11: Top 10 most frequent cascades as generated by the Cascadegeneration model. Notice similar shapes and frequency ranks as in Figure 8.
cascades as we found in Post network (≈ 2 million). We tried several valuesof β parameter, and at the end decided to use β = 0.025. This means thatthe probability of cascade spreading from the infected to an uninfected blogis 2.5%. We simulated our model 10 times, each time with a different randomseed, and report the average. We believe that since there was little variancein the behavior of the Cascade generation model 10 runs was sufficient.
First, we show the top 10 most frequent cascades (ordered by frequencyrank) as generated by the Cascade generation model in Figure 11. Com-paring them to most frequent cascades from Figure 8 we notice that top7 cascades are matched exactly (with an exception of ranks of G4 and G5
swapped), and rest of cascades can also be found in real data.Next, we show the results on matching the cascade size and degree dis-
tributions in Figure 12. We plot the true distributions of the cascades ex-tracted from the Post network with dots, and the results of our model areplotted with a dashed line. We compare four properties of cascades: (a)overall cascade size distribution, (b) size distribution of chain cascades, (c)size distribution of stars, and (d) in-degree distribution over all cascades.
Notice a very good agreement between the reality and simulated cas-cades in all plots. The distribution over of cascade sizes is matched best.Chains and stars are slightly under-represented, especially in the tail of thedistribution where the variance is high. The in-degree distribution is alsomatched nicely, with an exception of a spike that can be attributed to a setof outlier blogs all with in-degree 52. Note that cascades generated by theCascade generation model are all trees, and thus the out-degree for everynode is 1.
It is worth noting that exponential random graphs would be anotheroption for fitting and choosing a parameter β. We would go about this bytaking statistics of the number of triangles, stars, and paths in the real dataand comparing it to simulated data. Since cascades are very sparse it maybe difficult due to the small number of larger structures and comparativelylarge number of isolated posts, but is a wortwhile direction for future work.
14

100
101
102
103
104
105
106
107
100 101 102 103 104
Cou
nt
Cascade size (number of nodes)
DataModel
100
101
102
103
104
105
100 101 102
Cou
nt
Chain size (number of nodes)
DataModel
(a) All cascades (b) Chain cascades
100
101
102
103
104
100 101 102 103
Cou
nt
Size of star (Number of nodes)
DataModel
100
101
102
103
104
105
100 101 102 103 104
Cou
nt
Cascade node in-degree
DataModel
(c) Star cascades (d) In-degree distribution
Figure 12: Comparison of the true data and the model. We plotted thedistribution of the true cascades with circles and the estimate of our modelwith dashed line. Notice remarkable agreement between the data and theprediction of our simple model.
4.5 Network Entities
Finally, we would like to gain an understanding of how different entities inthe social network function with regard to the propagation of information.
4.5.1 Clustering blogs by Cascade Shapes
Our first experiments involved performing PCA on a large, sparse matrixwhere rows represented blogs and columns represented different types ofcascades. Each entry was a count, and in order to reduce the variance, wetook the log of each count. Our dataset consisted of 44, 791 blogs with 8, 965cascade types.
It was of interest to impose social networks upon the blogs, based onwhat topics the blogs tended to focus on. We hand-classified a sample ofthe blogs in the data by topic, and found that we acould often separatecommunities based on this analysis. For the purposes of visualization we
15

(a) First vs. second PC (b) Second vs. third PC
Figure 13: Principal components for blogs by CascadeType labeled bytopic. PC’s were generated by analyzing a matrix of blogs by counts ofcascade types. Note that there is a clear separation between conservativeblogs (represented by red crosses), and humorous blogs (represented withby circles), both on axes of the first and second PC (a), and on axes of thesecond and third PC (b). Ovals indicate the main clusters
chose to focus on two of the larger communities, politically conservativeblogs and “humorous” blogs (such as blogs for different web-comics andhumorists). Figure 13(a) shows these blogs plotted on the first two principalcomponents, and Figure 13(b) shows them plotted on the second and thirdprincipal components. Ovals are drawn around the main clusters. We noticea distinct separation between the conservative community and the humorcommunity; this means that the two communities engage in very differentconversation patterns.
Upon closer analysis, we find this is the case because conservative blogstend to form deep, chainlike graphs whereas the humorous blogs form stars.Some similar observations may be made for other communities; we usedthese two because they were the most distinct. This result shows that blogcommunities tend to follow different linking patterns. We believe that bylooking at a blog’s cascade types that one can better make inferences aboutwhat community a blog might belong to.
Furthermore, The number of trivial cascades that a blog participatesin–that is, its number of solitary posts with no in- or out-links, may be akey indicator of its community. Removing the trivial cascades caused theclusters to become less clear, which indicates that these trivial cascades stillplay a significant role in the inferences one can make about that blog.
16

4.5.2 Clustering posts based on features
We next sought to find how posts themselves behave. In order to do this, weperformed PCA on a 6-column matrix. Each row represented a post, whilethe columns were as follows:
• Number of inlinks
• Number of outlinks
• Conversation mass upwards
• Conversation mass downwards
• Depth upwards
• Depth downwards
There were 6, 666, 188 posts in the dataset. When we ran PCA, we foundthat the major two components that determined the blog’s place in this spacewere conversation mass upwards and downwards. Therefore, we also plottedthe posts on the two axes of conversation mass upwards and conversationmass downwards (See Figure 14. To illustrate, we have plotted all posts, withspecial markers for two distinct popular blogs, Dlisted 1 and MichelleMalkin2. We have circled the main clusters in the plots. Notice that while Dlistedand MichelleMalkin points overlap, their clusters are centered differently.The mean and variance of these clusters can serve as another viewpoint intothe profile of a blog.
Thus, we observe that Posts within a blog tend to take on commonnetwork characteristics, which may serve as another means of classification.Individual posting patterns may serve as another way of clustering blogs,because different blogs maintain different posting patterns.
5 Discussion
Our finding that the the popularity of posts drops off with a power law dis-tribution is interesting since intuition might lead one to believe that peoplewould “forget” a post topic in an exponential pattern. However, since link-ing patterns are based on the behaviors of individuals over several instances,much like other real-world patterns that follow power laws such as trafficto Web pages and scientists’ response times to letters [30], it is reasonable
1dlisted.blogspot.com, a celebrity gossip blog.
2www.MichelleMalkin.com, a politically conservative blog.
17

(a) All posts (b) MichelleMalkin (c) Dlisted
Figure 14: Conversation mass for posts, an aspect of PostFeatures6. Thetop figure shows the Dlisted and MichelleMalkin clusters superimposed overpoints for all posts. The next two show the clusters separately, superimposedon all blog points for reference. Ovals are drawn around the main clusters.Note that while there is overlap between posts features of two blogs, theyhave different centers. This tells us that different blogs maintain differentmeans and variances in conversation masses
to believe that a high number of individuals link posts quickly, and laterlinkers fall off with a heavy-tailed pattern.
Our findings have potential applications in many areas. One could arguethat the conversation mass metric, defined as the total number of posts inall conversation trees below the point in which the blogger contributed,summed over all conversation trees in which the blogger appears, is a betterproxy for measuring influence. This metric captures the mass of the totalconversation generated by a blogger, while number of in-links captures onlydirect responses to the blogger’s posts.
For example, we found that BoingBoing, which a very popular blog aboutamusing things, is engaged in many cascades. Actually, 85% of all Boing-Boing posts were cascade initiators. The cascades generally did not spreadvery far but were wide (e.g., G10 and G14 in Fig. 8). On the other hand53% of posts from a political blog MichelleMalkin were cascade initiators.But the cascade here were deeper and generally larger (e.g., G117 in Fig. 8)than those of BoingBoing.
The methods chosen for clustering were decided mainly for simplicity, asthe main goal was to present ideas for some blog characterization. For Cas-
cadeType and PostFeatures6 we ran PCA after taking the log counts.There are other methods available for reducing variance, however, we choselog for the sake of simplicity. It may be of interest to use different forms ofTF-IDF, a method often used in text mining. A description of TF-IDF is
18

provided in [27].We have analyzed many characteristics of blogs, based on conversation pat-terns, post features, and post patterns over time. From this basis, given ablog, we can infer a number of things about that blog based on these metrics.
6 Conclusion
We analyzed one of the largest available collections of blog information,trying to find how blogs behave and how information propagates throughthe blogosphere. We studied two structures, the “Blog network” and the“Post network”. Our findings are summarized as follows:
Temporal Patterns: The decline of a post’s popularity follows a powerlaw, rather than an exponential dropoff as might be expected. The slope is≈-1.5, the slope predicted by a very recent theory of heavy tails in humanbehavior [30].
Topological Patterns: Almost any metric we examined follows a powerlaw: size of cascades, size of blogs, in- and out-degrees. Finally, stars andchains are basic components of cascades, with stars being more common.Most cascades are tree-like.
Generative model: Our idea is to reverse-engineer the underlying so-cial network of blog-owners, and to treat the influence propagation betweenblog-posts as a flu-like virus, that is, the SIS model in epidemiology. De-spite its simplicity, our model generates cascades that match very well thereal cascades with respect to in-degree distribution, cascade size distribu-tion, and popular cascade shapes. The model achieved this accuracy with aconstant infectiousness value of β and by weighting the closeness of linkedblogs equivalently, even if they are linked multiple times.
Characterizing blogs: We have also made several observations on whatsort of features best characterize blogs in a network. We made some ob-servations about cascade types. First, we note that the cascade types thatblogs participate may suggest to which community it belongs (‘humor’, ‘con-servative’, etc.) . Second, the number of trivial (singleton) cascades that ablog uses is a major indicator of cascade type. We can characterize blogsbased on their general network characteristics, and observed that blogs tendto have posts that cluster together with respect to post features.
Future work abounds, because the blogosphere is an extremely richdataset, with multiple facets. Future research could try to include the con-tent of the posts, to help us find even more accurate patterns of influencepropagation. Another direction is to spot anomalies and link-spam attempts,
19

by noticing deviations from our patterns.
References
[1] L. A. Adamic and N. Glance. The political blogosphere and the 2004U.S. election: divided they blog. In LinkKDD ’05: Proceedings of the3rd International Workshop on Link Discovery, pages 36–43, 2005.
[2] E. Adar and L. A. Adamic. Tracking information epidemics inblogspace. In WI ’05: Proceedings of the 2005 IEEE/WIC/ACM Inter-national Conference on Web Intelligence, pages 207–214, Washington,DC, USA, 2005. IEEE Computer Society.
[3] N. Bailey. The Mathematical Theory of Infectious Diseases and itsApplications. Griffin, London, 1975.
[4] A.-L. Barabasi. The origin of bursts and heavy tails in human dynamics.Nature, 435:207, 2005.
[5] S. Bikhchandani, D. Hirshleifer, and I. Welch. A theory of fads, fash-ion, custom, and cultural change in informational cascades. Journal ofPolitical Economy, 100(5):992–1026, October 1992.
[6] K. M. Carley. On the evolution of social and organizational networks.Research in the Sociology of Organizations, 16(Special issue on Net-works In and Around Organ):3–30, 1999.
[7] L.-C. Chen and K. M. Carley. The impact of countermeasure propa-gation on the prevalence of computer viruses. IEEE Transactions onSystems, Man, and Cybernetics, Part B, 34(2):823–833, 2004.
[8] A. Clauset, C. R. Shalizi, and M. E. J. Newman. Power-law distribu-tions in empirical data, 2007.
[9] M. Collins, S. Dasgupta, and R. E. Schapire. A generalization of princi-pal components analysis to the exponential family. In T. G. Dietterich,S. Becker, and Z. Ghahramani, editors, Advances in Neural InformationProcessing Systems 14, Cambridge, MA, 2002. MIT Press.
[10] V. M. Equiluz and K. Klemm. Epidemic threshold in structured scale-free networks. arXiv:cond-mat/02055439, May 21 2002.
20

[11] M. Faloutsos, P. Faloutsos, and C. Faloutsos. On power-law relation-ships of the Internet topology. SIGCOMM, pages 251–262, Aug-Sept.1999.
[12] O. Frank and D. Strauss. Markov graphs. Journal of the AmericanStatistical Association, 81(395):832–842, 1986.
[13] J. Goldenberg, B. Libai, and E. Muller. Talk of the network: A complexsystems look at the underlying process of word-of-mouth. MarketingLetters, 2001.
[14] M. Granovetter. Threshold models of collective behavior. Am. Journalof Sociology, 83(6):1420–1443, 1978.
[15] D. Gruhl, R. Guha, D. Liben-Nowell, and A. Tomkins. Informationdiffusion through blogspace. In WWW ’04, 2004.
[16] H. W. Hethcote. The mathematics of infectious diseases. SIAMRev., 42(4):599–653, 2000. http://www.math.rutgers.edu/ leen-heer/hethcote.pdf.
[17] I. Jolliffe. Principal Component Analysis. Springer Verlag, 1986.
[18] D. Kempe, J. Kleinberg, and E. Tardos. Maximizing the spread ofinfluence through a social network. In KDD ’03, 2003.
[19] J. M. Kleinberg, R. Kumar, P. Raghavan, S. Rajagopalan, and A. S.Tomkins. The Web as a graph: Measurements, models and methods.Lecture Notes in Computer Science, 1627:1–17, 1999.
[20] F. Korn, H. Jagadish, and C. Faloutsos. Efficiently supporting ad hocqueries in large datasets of time sequences. ACM SIGMOD, pages 289–300, May 13-15 1997.
[21] P. Krapivsky and S. Redner. Network growth by copying. PhysicalReview E, 71:036118, 2005.
[22] R. Kumar, J. Novak, P. Raghavan, and A. Tomkins. On the burstyevolution of blogspace. In WWW ’03: Proceedings of the 12th interna-tional conference on World Wide Web, pages 568–576, New York, NY,USA, 2003. ACM Press.
[23] R. Kumar, J. Novak, and A. Tomkins. Structure and evolution ofonline social networks. In KDD ’06: Proceedings of the 12th ACM
21

SIGKDD International Conference on Knowedge Discover and DataMining, pages 611–617, New York, 2006.
[24] J. Leskovec, L. A. Adamic, and B. A. Huberman. The dynamics ofviral marketing. In EC ’06: Proceedings of the 7th ACM Conferenceon Electronic Commerce, pages 228–237, New York, NY, USA, 2006.ACM Press.
[25] J. Leskovec, A. Singh, and J. Kleinberg. Patterns of influence in arecommendation network. In Pacific-Asia Conference on KnowledgeDiscovery and Data Mining (PAKDD), 2006.
[26] M. Richardson and P. Domingos. Mining knowledge-sharing sites forviral marketing, 2002.
[27] G. Salton and C. Buckley. Term weighting approaches in automatictext retrieval. Technical report, Cornell University, Ithaca, NY, USA,1987.
[28] T. A. Snijders, P. E. Pattison, G. L. Robins, and M. S. Handcock.New specifications for exponential random graph models. SociologicalMethodology, 36(1):99–153, December 2006.
[29] D. B. Stouffer, R. D. Malmgren, and L. A. N. Amaral. Log-normalstatistics in e-mail communication patterns, 2006.
[30] A. Vazquez, J. G. Oliveira, Z. Dezso, K. I. Goh, I. Kondor, and A. L.Barabasi. Modeling bursts and heavy tails in human dynamics. PhysicalReview E, 73:036127, 2006.
[31] Y. Wang, D. Chakrabarti, C. Wang, and C. Faloutsos. Epidemic spread-ing in real networks: An eigenvalue viewpoint. In SRDS, pages 25–34,2003.
[32] D. J. Watts. A simple model of global cascades on random net-works. In Proceedings of the National Academy of Sciences of theUnited States of America, volume 99, pages 5766–5771, April 30 2002.http://www.jstor.org/view/00278424/sp020038/02x3936j/0.
[33] D. J. Watts and S. H. Strogatz. Collective dynamics of ’small world’networks, chapter 4.2, pages 301–303. Princeton University Press, 2006.
[34] G. Zipf. Human Behavior and Principle of Least Effort: An Introduc-tion to Human Ecology. Addison Wesley, Cambridge, Massachusetts,1949.
22

Acknowledgments
This material is based upon work supported by the National Science Foun-dation under Grants No. IIS-0209107, SENSOR-0329549, EF-0331657, IIS-0326322, IIS-0534205, and also by the Pennsylvania Infrastructure Technol-ogy Alliance (PITA). Additional funding was provided by a generous giftfrom Hewlett-Packard. Mary McGlohon was partially supported by a Na-tional Science Foundation Graduate Research Fellowship.
23