information extraction and knowledge discovery … extraction and knowledge discovery from...
TRANSCRIPT
Information extraction and knowledge discoveryfrom high-dimensional and high-volume complex
data sets through precision manifold learningErzsebet Merenyi∗, William H. Farrand†, Robert H. Brown‡, Thomas Villmann§, Colin Fyfe¶
∗Department of Electrical and Computer Engineering, Rice University, Houston, TexasEmail: [email protected]
†Space Science Institute, Boulder, ColoradoEmail: [email protected]
‡Lunar and Planetary Laboratory, University of Arizona, Tucson, ArizonaEmail: [email protected]
§Institute for Psychotherapy and Psychosomatic Medicine, Computational Intelligence GroupUniversity of Leipzig, Leipzig, Germany
Email: [email protected]¶Applied Computational Intelligence Research Unit (ACIRU)
School of Computing, University of Paisley, Paisley, Scotland, UKEmail: [email protected]
Abstract—Finding critical information in large and complexdata volumes is a challenge increasingly posed by real systemssuch as NASA’s space and Earth science missions. Many of thesereal systems are also desired to operate highly autonomously,using extracted information directly, for decisions, or for collabo-rations among missions. One example of this would be spacecraftor rover navigation based on scientific findings from continuouslycollected data, through on-board computation. This underlinesthe importance of the quality of information extraction: it must beintelligent enough to produce critical details; reliable; robust; andfast. The most interesting and powerful data, collected in spaceand Earth science missions as well as in many other areas arecharacterized by high dimension, high volume, and complicatedinternal relationships among the variables that are recorded forthe purpose of capturing the structure of the data. However,while precise extraction of the data sructure facilitates the bestpossible knowledge discovery, few methods exist that measureup to the complexity of such data. We focus on three of thequality aspects of information extraction listed above: intelligentdata understanding, reliability, and robustness, through precisionmanifold learning, and point out the benefits for autonomousoprations.
Index Terms—Intelligent data understanding; Data mining;On-board decision support; Manifold learning; Self-OrganizingMaps; High-dimensional data.
I. BACKGROUND AND MOTIVATION
Extraction of critical information from continuously col-lected data such as in mission scenarios, is imperative for asystem’s decision making and subsequent response. The mostinteresting and powerful data, collected in space and Earthscience missions as well as in other areas such as biomedicaland clinical research, security and fraud monitoring, are char-acterized by high dimension, high volume, and complicatedinternal relationships among the variables that are recorded forthe purpose of capturing meaningful information that can be
transformed to knowledge. Hyperspectral imagery from Earthand space science projects; combination of measurements frommultiple sensors; stacked time series of genetic microarrays;and homeland scurity data bases are examples.
Many real systems needing identification of key infor-mation in large and complicated data sets are also desiredto operate in a highly autonomous fashion, using extractedinformation and discovered, distilled knowledge directly fordecision making, for collaborations among missions includingground components, or for alerts. Some example scenariosare a) unmanned spacecraft operations or rover navigation,seeking to return data of high scientific value from planetarymissions; b) on-ground large remote sensing archives thatmust be processed for discoveries or for finding particularknown phenomena; c) (near-)real time oprations of spacecraftor reconaissance vehicles in battlefields, or high-throughputmedical and security screening.
The quality of the information extraction is extremelyimportant for the full exploitation of such data for effectivedecision support. The need for advanced data exploitationcapablities is further stressed by the interest in autonomousand/or (near-)real time operations. However, few existingmethods have the power to deal with the class of data describedabove.
At the same time when many aspects of on-board com-putation for autonomous navigation, including hazard avoid-ance, pointing precision, high performance, reliability, faulttolerance, etc., are already a reality [1], as stated by [2], “...the most exciting mission opportunities will not be realizedwithout on-board intelligence ...”, “... robotic explorers maypass by innumerable scientifically interesting sites, but without

the requisite intelligence to recognize them as such, they aresimply bypassed and never seen by planetary scientists.” TheMER rovers, for example, did not have on-board processingof science data with sufficient intelligent understanding torecognize a rare mineralogy or other scientifically relevantsurface features, thus could not have made an autonomousdecision to stop and examine it. Today’s orbiters do nothave this capability either, or even just the capability to alertto an interesting event and send the related data (or dataproduct) to Earth with high priority, for preferential humanevaluation and intervention. Since we already live in the eraof high-performance, reliable, miniaturized and radiation hard-ened computing facilities, suitable for autonomous on-boardoperations [2], the withholding factor is primarily the lackof sufficiently intelligent and sophisicated data understandingmethods with demonstrated reliability and robustness.
The interest to improve this situation is expressed by exist-ing projects to develop automated analysis systems for scien-tific data, within NASA sponsored research. Recent examplesinclude ADaM (Algorithm Development and Mining system,http://datamining.itsc.uah.edu/adam/index.html) and EVE (En-VironMent for on-board processing, http://eve.itsc.uah.edu)[3], [4] and spectral pattern recognition algorithms for min-eral detection by Gilmore et al. [5], Gazis and Roush [6],and Ramsey et al. [7]. While these works make significantcontributions toward on-board processing of scientific data(see a summary in [8]) they also illustrate that the difficultiesof the pattern recognition tasks involved are great and canforce limited applications. Systems developed to recognize onespecific surface feature from a selected subset of the availabledata (for lack of capabilities to deal with multiple featuresfrom all available data), will not recognize other importantspecies. Systems using conventional algorithms may not beable to extract detailed enough knowledge from complex, high-dimensional data, and may miss important events.
II. INTELLIGENT DATA UNDERSTANDING WITH HYPEREYE
The above underline the extreme importance of the capa-bility to fully exploit a given data set, and the quality ofthe extracted information. To enable the best possible dataexploitation and knowledge generation, an autonomous dataunderstanding subsystem (envisioned as part of a spacecraft,rover, or ground-based archival system) must have the follow-ing properties:
1) It must be intelligent enough to deliver high qualityinformation / knowledge, characterized by
a) high level and precision of useful detail;b) repeatability and reliability;c) self-assessment of quality, and feedback to the
knowledge extraction engines to improve perfor-mance.
This requires precise learning of the structure of theacquired, often very high-dimensional, data manifold,finding all (often a large number of) natural clustersincluding rare ones, and categorizing them into known
and unknown classes. It is desirable that the system canperform both unsupervised clustering for novelty de-tection, and supervised classification for known classesof interest, simultaneously. For clustering, the abilityof faithful delineation of all clusters, regardless of thedistribution of their size, density, shape, etc., capturingof fine intricate structure in the data, is critical. Forsupervised classification, precise discrimination amongmany classes with potentially subtle differences betweentheir feature vectors, is imperative.
2) A data understanding subsystem must also be capableof continuous learning and adaptation to new situations,since in a space exploration scenario (as well as in manyothers) data are acquired continuously;
3) It must be fast (real or near-real time).
These concepts are represented in HyperEye, our manifoldlearning environment.
A. HyperEye as a manifold learning subsystem
HyperEye is a collection of neural and other related al-gorithms for coordinated “precision” mining of complicatedand high-dimensional data spaces, envisioned to support au-tonomous decision making or alerting as outlined in Figure 1.It is designed for both the discovery of all clusters, includingrare or novel, surprising features in multi- and hyperspectralimages, as well as for general surface cover mapping of allrelevant spectral species. This focus is highly motivated sincevirtually every planetary mission and Earth-orbiting satellitecarries spectral imagers now, in recognition of the fact thatthe extremely rich data imaging spectrometers provide enablediscrimination among almost all surface materials. HyperEyealgorithms, however, are equally applicable to many othertypes of “stacked vector” data, including fused disparate data.
In this paper we concentrate on the detail and quality of theextracted information, as stipulated in points 1) and 2) above.
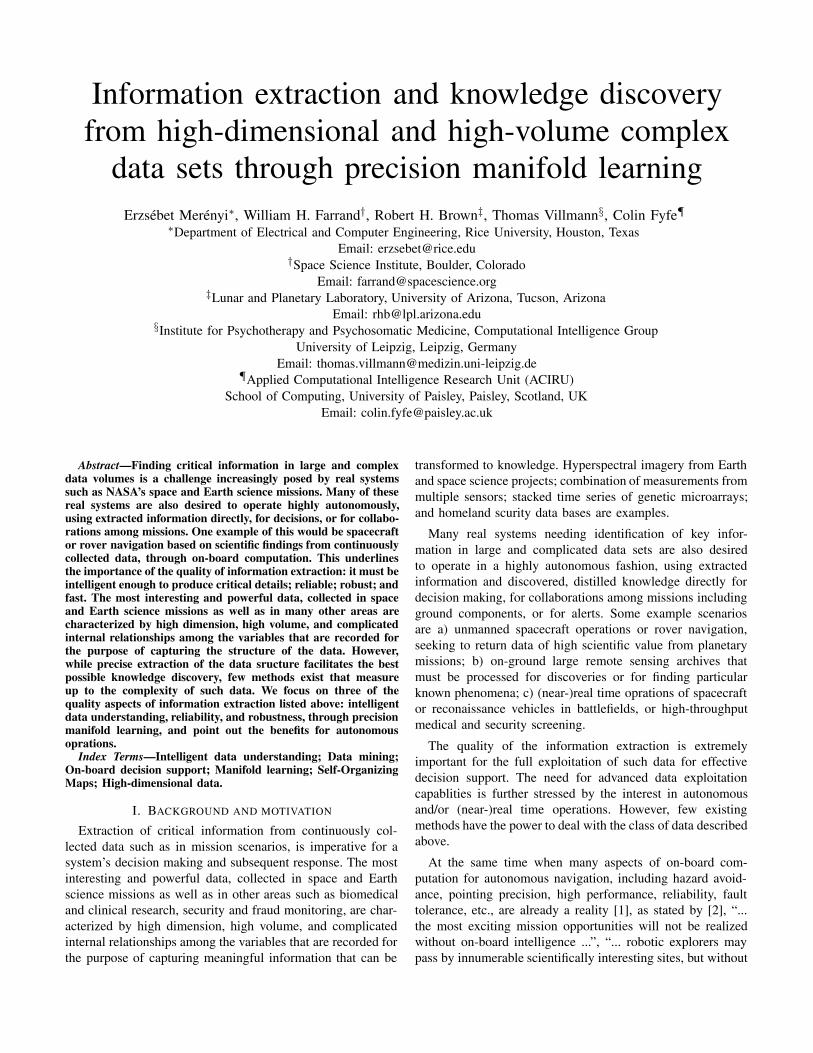
In Figure 1, left, the HyperEye Intelligent Data Understand-ing (IDU) subsytem is envisioned embedded in a spacecraft orrover system, processing data acquired by sensor subsystem(s)from the environment. In this example scenario, the sensorsubsystem is a hyperspectral imager, and the environment is aplanetary surface. HyperEye has simultaneous unsupervisedclustering and supervised classification capabilities at theheart of which are sophisticated non-standard neural learningprocesses, discussed in the next Section. On this level ofoperation, the important point is that the IDU subsystem cangenerate alerts from both unsupervised clustering (upon de-tection of novel signatures) and from supervised classification(upon finding known interesting species). How the alerts areused and handled should be defined within the embeddingsystem (navigation control, for example).
The top level details of the HyperEye IDU subsystemare shown in Figure 1, right: the Artificial Neural Network(ANN) algorithmic core, the main types of data products, andcommunication of extracted knowledge, in various forms andon various levels of detail, to on-board decision making and/or
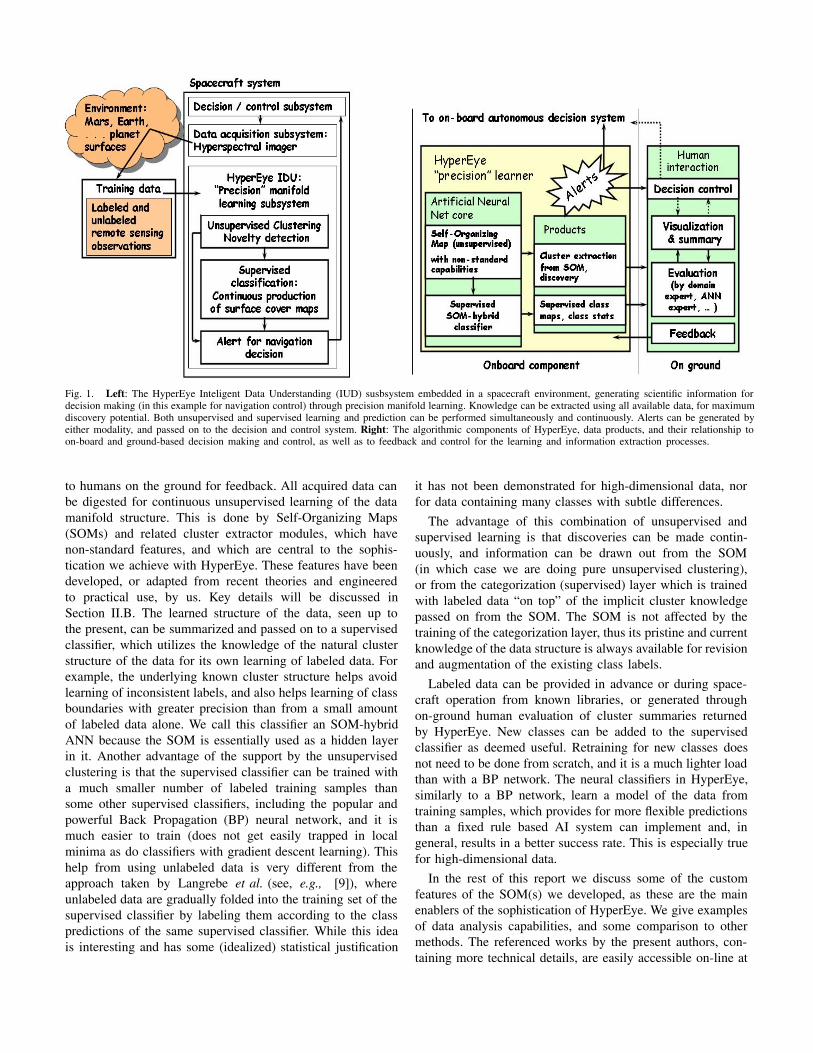
Fig. 1. Left: The HyperEye Inteligent Data Understanding (IUD) susbsystem embedded in a spacecraft environment, generating scientific information fordecision making (in this example for navigation control) through precision manifold learning. Knowledge can be extracted using all available data, for maximumdiscovery potential. Both unsupervised and supervised learning and prediction can be performed simultaneously and continuously. Alerts can be generated byeither modality, and passed on to the decision and control system. Right: The algorithmic components of HyperEye, data products, and their relationship toon-board and ground-based decision making and control, as well as to feedback and control for the learning and information extraction processes.
to humans on the ground for feedback. All acquired data canbe digested for continuous unsupervised learning of the datamanifold structure. This is done by Self-Organizing Maps(SOMs) and related cluster extractor modules, which havenon-standard features, and which are central to the sophis-tication we achieve with HyperEye. These features have beendeveloped, or adapted from recent theories and engineeredto practical use, by us. Key details will be discussed inSection II.B. The learned structure of the data, seen up tothe present, can be summarized and passed on to a supervisedclassifier, which utilizes the knowledge of the natural clusterstructure of the data for its own learning of labeled data. Forexample, the underlying known cluster structure helps avoidlearning of inconsistent labels, and also helps learning of classboundaries with greater precision than from a small amountof labeled data alone. We call this classifier an SOM-hybridANN because the SOM is essentially used as a hidden layerin it. Another advantage of the support by the unsupervisedclustering is that the supervised classifier can be trained witha much smaller number of labeled training samples thansome other supervised classifiers, including the popular andpowerful Back Propagation (BP) neural network, and it ismuch easier to train (does not get easily trapped in localminima as do classifiers with gradient descent learning). Thishelp from using unlabeled data is very different from theapproach taken by Langrebe et al. (see, e.g., [9]), whereunlabeled data are gradually folded into the training set of thesupervised classifier by labeling them according to the classpredictions of the same supervised classifier. While this ideais interesting and has some (idealized) statistical justification
it has not been demonstrated for high-dimensional data, norfor data containing many classes with subtle differences.
The advantage of this combination of unsupervised andsupervised learning is that discoveries can be made contin-uously, and information can be drawn out from the SOM(in which case we are doing pure unsupervised clustering),or from the categorization (supervised) layer which is trainedwith labeled data “on top” of the implicit cluster knowledgepassed on from the SOM. The SOM is not affected by thetraining of the categorization layer, thus its pristine and currentknowledge of the data structure is always available for revisionand augmentation of the existing class labels.
Labeled data can be provided in advance or during space-craft operation from known libraries, or generated throughon-ground human evaluation of cluster summaries returnedby HyperEye. New classes can be added to the supervisedclassifier as deemed useful. Retraining for new classes doesnot need to be done from scratch, and it is a much lighter loadthan with a BP network. The neural classifiers in HyperEye,similarly to a BP network, learn a model of the data fromtraining samples, which provides for more flexible predictionsthan a fixed rule based AI system can implement and, ingeneral, results in a better success rate. This is especially truefor high-dimensional data.
In the rest of this report we discuss some of the customfeatures of the SOM(s) we developed, as these are the mainenablers of the sophistication of HyperEye. We give examplesof data analysis capabilities, and some comparison to othermethods. The referenced works by the present authors, con-taining more technical details, are easily accessible on-line at
http://www.ece.rice.edu/∼erzsebet/publist-Merenyi.pdf .
B. Custom features of HyperEye manifold learning
The foundation of HyperEye precision data mining is self-organized manifold learning. Self-Organizing Maps (SOMs)are intended to mimic the information processing of thecerebral cortex, where stimuli percieved from the environmentare organized in a 2-dimensional surface, for very fast and veryprecise pattern retrieval and recognition. The basic version ofthe heuristic SOM algorithm, as invented by Kohonen [10],is the following. Let V denote the dV -dimensional input datamanifold, and A be the rigid, dA-dimensional, SOM grid ofProcessing Elements (PEs, or neurons), where dA is usually 1or 2. PEs are indexed by their dA-dimensional grid locations r.Each PE r ∈ A has a weight vector wr attached to it, which isa quantization prototype, initially with random elements. TheSOM learning performs an adaptive vector quantization (VQ)by cycling through these steps many times: for any v ∈ Vinput a winner PE s is selected by
s = argminr
||v − wr|| (1)
and then the weights are adapted according to
∆wr = εhrs(v − wr) (2)
The neighborhood function hrs defines the extent to whichweights are updated, as a function of the grid distance of PEr from s. hrs is often a Gaussian function centered over thewinner, but the neighborhood can be defined many differentways [10]. In equation (2) the learning rate ε is globallydefined, i.e., it is the same for all PEs for a given time stepand its value is independent of any local properties of the map.
This quantization differs from other VQ algorithms in twoways. It produces an optimal placement of the prototypes indata space for best approximation of the density distributionof the data. In addition, the prototypes become ordered on theSOM grid in a topology preserving fashion: prototypes thatrepresent data points close to one another in data space will beclose to each other in the SOM grid, and conversely, prototypesclose in the SOM grid will represent similar data vectors. (Thisassumes that no topology violations occur during learning. Wewill briefly discuss below some research related to the recogni-tion and remediation of topology violations in SOM learning.)This is a very powerful feature, allowing the detection ofcontiguous groups of similar prototypes in the SOM grid,which collectively represent clusters of similar data. Clusterboundaries can be identified based on the (dis)similarities(typically Euclidean distances) of the prototypes vectors (notthe distances of their SOM grid locations!). SOM clusteringdoes not require an initial guess of the number of clusters(unlike many clustering algorithms), nor does it require anyparticular initial definition of the quantization prototypes.
Many successful applications of SOMs have been reportedin the last 20 years. The original Kohonen SOM (KSOM),however, was found suboptimal for high-dimensional data
with complicated structures. We mention two interesting issueshere.
Given an SOM with a fixed size, and K natural clustersin the data (where K is unknown prior to SOM learning),the “real estate” (the number of SOM prototypes) that can bededicated to the representation of each data cluster is limited.In principle, if the SOM places the prototypes optimally,the pdf of the data should be reproduced most faithfullyand all clusters (small or large) should have an areal rep-resentation proportional to their size. Theoretical analysesrevealed, however, that the KSOM inherently “warps” the gridrepresentation: instead of a linear relationship between the pdfof the data, P , and the distribution of the SOM prototypes indata space, Q, which is expressed by
Q(w) = cP (w)α (3)
where α = 1, it realizes a functional relationship whereα = 2/3 in eq (3) [11]. The effect of this can be the lossof some clusters when the real estate is tight. For high-volume, complicated data this is always a concern, since thecomputational cost increases nonlinearly with the size of a2- (or higher-)dimensional SOM grid. We use a newer SOMvariant called conscience algorithm [12], which effects α = 1by a heuristics [13]. An additional benefit of the “conscience”is that one needs only to use an SOM grid neighborhood of aradius of 1 for weight updates in eq (2). This results in lightercomputational load and faster learning. We also adapted a newtheory to effect a magnification of SOM representation areasfor rare events, without having to know whether rare clustersexist in a data set. This is done by forcing an α < 0 valuein eq (3), and it enhances the detectability of low-frequencydata. This theory was originally proven for a rather restrictedclass of data. We demonstrated an extended applicabilitythrough carefully designed simulations [13]. An example ofthis capability is the detection of very rare materials at theMars Pathfinder landing site, as explained in Figure 2. Fulldetails can be found in [14] and in [15].
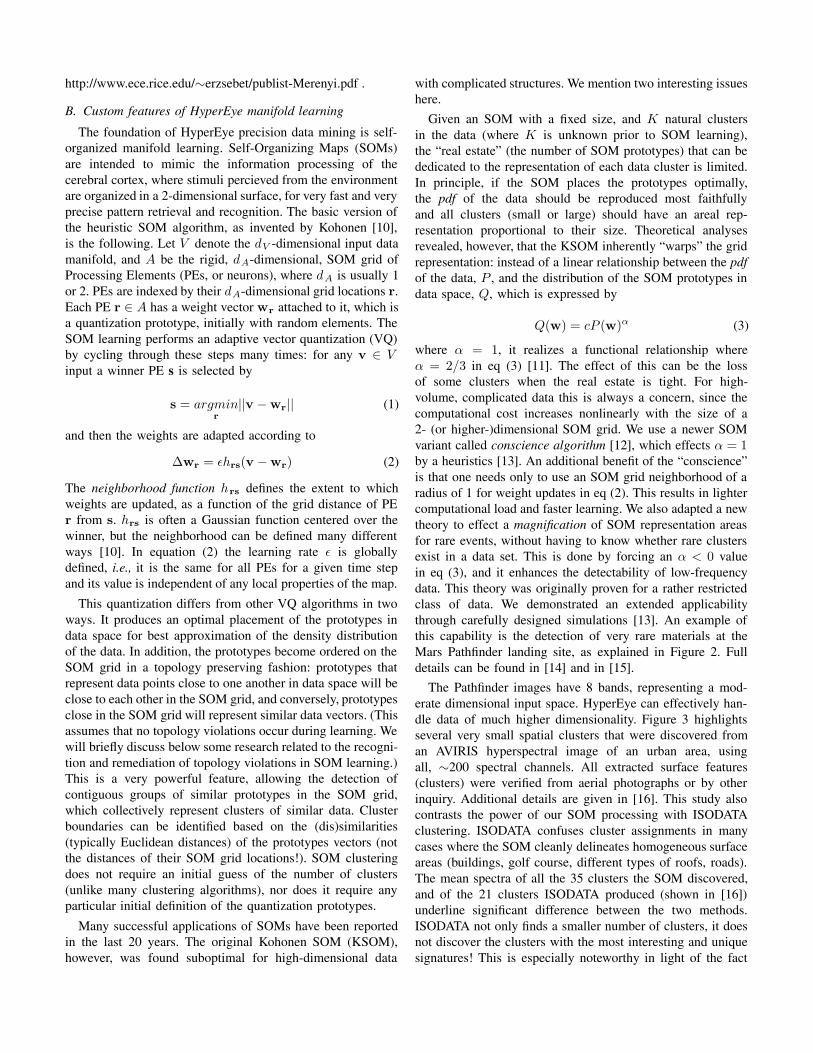
The Pathfinder images have 8 bands, representing a mod-erate dimensional input space. HyperEye can effectively han-dle data of much higher dimensionality. Figure 3 highlightsseveral very small spatial clusters that were discovered froman AVIRIS hyperspectral image of an urban area, usingall, ∼200 spectral channels. All extracted surface features(clusters) were verified from aerial photographs or by otherinquiry. Additional details are given in [16]. This study alsocontrasts the power of our SOM processing with ISODATAclustering. ISODATA confuses cluster assignments in manycases where the SOM cleanly delineates homogeneous surfaceareas (buildings, golf course, different types of roofs, roads).The mean spectra of all the 35 clusters the SOM discovered,and of the 21 clusters ISODATA produced (shown in [16])underline significant difference between the two methods.ISODATA not only finds a smaller number of clusters, it doesnot discover the clusters with the most interesting and uniquesignatures! This is especially noteworthy in light of the fact

Fig. 2. Left: Rare surface materials on Mars mapped with HyperEye precision manifold learning from SuperPan octant S0184 (left eye) collected by theImager for Mars Pathfinder. In this (unsupervised) cluster map, the indicated tiny areas contain a relatively pristine, undifferentiated material termed “blackrock” by scientists. This material has a deep 1-µm absorption (olivine or pyroxene) and has been found in very low abundance at the Pathfinder landing site.Our clustering not only found black rock, but split it into the two subspecies shown in the insets by pale green and hot pink colors. (Please note that both ofthese colors are unique but to see that among 28 different colors clearly one needs to display the original cluster maps on a high-quality computer screen.)This distinction is justified by the mean spectral shapes of these subclusters (shown in [14]): one has a deeper band centered at 1 µm, the other seems tohave its band center beyond 1 µm thus indicating different (undifferentiated) mineralogies. Details can be found in [14]. Note also that a large number ofother surface materials have simultaneously been delineated (28 species). Such comprehensive mapping from the Mars Pathfinder data was not done beforeour work because of the challenges posed by the data. Right: Linear mixture model of the same S0184 SuperPan octant. Both black rock occurrences areoutlined in the same green color, with no further distinction. The variety of surface materials is also much less pronounced that in the SOM cluster map.
that in a lower-dimensional (8-band) image of the same urbanenvironment ISODATA produced a cluster map remarkablysimilar to that produced by an SOM [16]. (The ISODATA mapwas not quite as detailed as the SOM map but the clusterseither matched or were superclusters of those in the SOMclustering, without confusion.) It is an indication of our generalexperience with SOMs, that the advantages of SOM-basedmethods over conventional ones become more pronouncedwith increasing data dimensionality and complexity.
Another important issue we discuss is the extraction ofclusters from a learned SOM. By computing the (data space)distances between prototype vectors that are adjacent in theSOM grid and visualizing these distances over the grid cells(U-matrix representation [17]), it seems fairly straightforwardto delineate cluster boundaries, and in many cases it is so. Forhigh-dimensional data with many natural clusters, especiallywith widely varying cluster statistics (variable size, density,shapes) and non-linear separability, the detection of clusterboundaries becomes more complicated (e.g., [18]). The repre-sentation of cluster (dis)similarities based solely on the weight(prototype) distances in data space (such as in e.g., [17], [19])is no longer sufficient for detailed and confident detectionof clusters. This problem generated considerable research inrecent years, partly because the challenge is intriguing froma manifold learning point of view, but just as importantlybecause full automation of cluster extraction from SOMs canonly be done (in general, for data of high complexity) by
overcoming this problem. The problem is worth the effortbecause the SOM, as shown in the above examples (wherewe used semi-automated, visualization based approaches toextract clusters) does acquire detailed and accurate knowledgeabout a complicated manifold, in contrast to many otherclustering methods including ISODATA. Our challenge is todecipher the SOM’s knowledge, and to automate the clusterextraction for autonomous applications.
The structure of a manifold, once quantization prototypesare determined and Voronoi tessellation performed with thegiven prototypes, can be described (on the prototype level)by the so-called Delaunay triangulation, which is a graphobtained by connecting the centroids of neighboring Voronoicells [20]. (This underlines the importance of the optimalplacement of the prototypes.) The binary Delaunay graphcan thus help discover connected and unconnected parts of amanifold (i.e., clusters). With simple data structures this workswell. With increased data complexity and noise it becomesvery important to portray how strongly various parts of the dataspace are connected. Because of its binary nature the Delaunaygraph will indicate connections caused by a few outliers orby noise between otherwise well separated clusters! Someresearch started to target this issue recently, to represent theconnectivity relations in a manifold in order to more preciselydelineate clusters. These works, however, are either limitedto situations where the SOM prototypes outnumber the datavectors [21], or to data spaces with low dimensions [22], [23].
Fig. 3. Details of cluster maps, for a subsection of Ocean City, Maryland, produced from an AVIRIS image using all remaining, ∼190, bands after removalof irrecoverably corrupted bands due to atmospheric attenuation. The spatial resolution is approximately 4 m/pixel. Left color panel: 35 SOM clusters, withcorresponding color codes at the top. The label ”bg” indicates unclustered pixels. The image contains part of Ocean City, surrounded by sea water (light grey,S) with board walks extending into the water, small harbors, roads and paved plazas (dark blue and dark grey hues I, J, Z), a large open parking lot at theright (dark grey and mauve colors, i and h), beach sand (ocher, e), vegetation (green colors), and buildings with various roof materials (red (A), hot pink(D), light blue (E), yellow-green (a), T, U, and more). Right color panel: ISODATA clusters, with labels and color codes shown at the bottom. ISODATAleaves no pixels unclustered. Clusters and their colors are different from the SOM map. (ISODATA produced a maximum of 21 clusters even when it wasallowed a considerably larger number of clusters.) In both figures, arrows point to the exact same locations. The labels in the white circles in each figure aregiven according to the label scheme of the respective clustering and indicate the cluster(s) assigned to the spatial feature the arrow points at in the SOM map.The full clustering can be seen in [16]. Here we make a few selected comparisons. ISODATA confuses clusters in spatial entities where the SOM assignshomogeneous labels. An example of this is the class D in the SOM map, pointing to a building (shown in the aerial photo inset at the top left), with a roofthat has prominent iron oxide absorptions. ISODATA assigns this building into three different clusters, none of which have signatures with resemblance toiron oxides. (Signatures are not shown here but the full sets are displayed in [16].) Another example is a semi-U shaped building (also seen in the top rightinset) with the label “a” in the SOM map, which has a very distinct spectral signature. Yet ISODATA fails to delineate it, confusing four different clustersin the footprint of this building. None of the signatures of those four clusters (I,S,J,H in the ISODATA map) has any similarity to the true spectra at thislocation. Finally, we point out two tiny spatial clusters: “j” (cherry color), and U (lilac) in the SOM map. “j” is a 6-pixel feature, only occurring here andat one location within the other image segment we analyzed (not shown here). In both cases, this turned out to be a water tower, as identified from aerialphotographs (inset at top right). U points to a sharply delineated 3-pixel feature, with spectral signatures very different from surrounding pixels. This featurewas identified as a coast guard lookout tower from a local map. ISODATA did not discover any of these, or other interesting rare spatial features in spite oftheir distinctive spectral signatures. These and other interesting cases are discussed in detail in [16].
Clearly, neither approach is sufficient for our goals. We aredeveloping a novel knowledge representation that expressesthe manifold connectivity strengths, for any data dimension,by showing local data densities overlain on the SOM grid, asillustrated in Figure 4 [24]. The connectivity strength betweenany pair of prototypes is defined as the number of times oneof them is the closest matching prototype to a data point andthe other is the second closest matching prototype. The use ofthis concept has shown advantages over existing schemes formoderate-dimensional data sets, and is under further testingand development for high-dimensional data. This knowledge
representation will lend itself to automation in contrast to the“modified U-matrix” we currently use for extracting clusterssemi-automatically from visualizations of prototype distances.While the latter — as the examples show — is successfulin producing sophisticated details, it would be very hard toautomate the human interaction involved.
We stipulated reliability and self-assessment of informationextraction quality as essential characteristics of an IntelligentData Understanding system. While it is fairly straighforward toset quality measures for supervised classifications, such mea-

Fig. 4. Left: Delineation of clusters in a learned SOM grid by U-matrix representation. The SOM in this case has a hexagonal grid, and the data set learnedis in the shape of a 2-dimensional “clown”, artificially created to contain clusters of various sizes, shapes and densities (eyes, nose, mouth, body, with threesubclusters in the left eye). Along with the hexagonal SOM of the learned prototypes it was provided to us by [18]. A U-matrix computed and overlain onthis SOM outlines the main cluster structure by the high (dark) fences, as seen from the various segments annotated with the names of the respective partsof the “clown”. This analysis is shown in detail in [18]. Right: Connectivity graph (a Delaunay graph with weighted edges instead of binary connections),explained in the text, computed from the same SOM prototypes as the ones on the left, and draped over the same SOM grid. Each line segment connecting twoprototypes is drawn with a width proportional to the “connectivity strength” (local data density) between those prototypes. This representation thus providesa better resolved picture of the relative connectedness of various parts of the manifold. For example, the nose and the right eye obviously form submanifoldsstrongly connected inside but clearly disconnected from each other (white gaps). Dramatic improvement over the U-matrix is shown in the left eye, wherethe three known subclusters are easily detected. In contrast, the U-matrix representation on the right hides these substructures.
sures are harder to define, but just as important, for unsuper-vised clustering. To assess the goodness of a clustering withoutexternal knowledge (ground truth) is especially important inautonomous environments. The quality of a clustering can bemeasured, in principle, by assessing how well it matches thenatural partitions of a data set. This can provide feedbackfor an iterative clustering method, to keep improving theclustering until the quality indicator no longer increases. Forthis purpose, many cluster validity indices have been proposed(see, e.g., [25], [26] and references therein). They measure towhat extent it is true that all data vectors within any cluster arecloser to each other than to any data vector in any other cluster.In our experience, however, existing indices often misjudgecomplicated clusterings. This is caused by the metrics they usefor within-cluster scatter and for between-clusters separation,which are the main components commonly combined in allvalidity indices. For example, the popular Davies-Bouldinindex [25] employs centroid distances for separation measure,which results in favoring spherical clusters. Some indices [27]use data densities, alone or in addition to distances, to betterassess clusters of various sizes and shapes. We found a numberof widely accepted indices inadequate for assessing our clustermaps, and we are developing new indices designed to providemore faithful measures by taking into account the connectivityrelations (as expressed by our connectivity graph) among high-dimensional clusters of widely variable statistics [26].
Cluster identification from an SOM only works well ifthe SOM learning was truly topology preserving: that pro-totypes that are neighbors in data space (centroids of adjacentVoronoi cells) end up at adjacent grid locations in the SOM.
(For exact definitions of neighboring protoypes and topologypreservation, see [20], [31].) Topology violating mapping cancause “twisted” SOMs, in which clusters will not be detectedcorrectly. It is therefore important (especially for expensiveruns with large data sets and in automated regime) to monitorthe topology violations during learning and apply a remedy.There are many interesting aspects of such monitoring and re-mediation, involving the development of appropriate measuresfor topology violations. These are based on the expectationthat in a topology preserving map a prototype is neighboronly to those prototypes (Voronoi centroids) in data space,which are in adjacent grid cells in the SOM, and vica versa.Depending on dimensionality mismatch between data spaceand SOM and noisiness of the data, this expectation will beviolated to various degrees. For example, in a 2-dimensionalrectangular SOM grid each prototype has eight grid neighbors,whereas a prototype can have more than eight neighbors ina high-dimensional or very noisy data space. The extent ofa topology violation manifests in the grid distance (foldinglength) of two prototypes that are Voronoi neighbors, and inthe strength of their connectivity. For example, in Figure 4, theprototype labeled O1 is connected to the “body” with a blueline through almost the entire SOM grid. (From the figure itis not obvious that this is not a sequence of connecting shortline segments but we know it from the connectivity data.)However, this connection is caused by a single outlier datapoint (hence the thin line), therefore we can dismiss it as a non-important violation. A strong connection (thick line segment)with a large folding length would, in contrast, indicate animportant violation. One way to examine violations (beside

Fig. 5. Computation and representation of topology violations, for monitoring the correctness of SOM learning. Left: Top: Violations in an 15 x 15 SOMthat learned a low-noise synthetic data set containing eight known clusters. The cluster labels known to us (but not known to the SOM) are superimposed ascolor coded regions. The black “gaps” contain prototypes whose Voronoi cells are empty, indicating discontinuities in the data space. Violating connectionsbetween any two prototypes are indicated by a black line segment with circles at the ends. Here, only the extent (the folding length) is shown for the violatingconnections, the severity of the violation (the connectivity strength) is not visualized, to avoid obscuring the structural details. Bottom: A summary measure,the Differential Topographic Function [28] reveals the distribution of violations as a function of the folding length. In this case, the longest extent of anyviolation is eight, which coincides with the diameter of the largest cluster. So if clusters are extracted at this stage of the learning and it is seen that allviolations remain within the clusters one can conclude that for clustering purposes the SOM learning is sufficiently mature. Even though the violations withinclusters can disappear with more learning, that will not change the cluster boundaries, and therefore computational power would be wasted. If our goal ispdf matching, then this level of topology violation is not acceptable, and learning should be contnued until all violations have a folding legth of one. Right:Top: Violating connections of strength greater than a threshold of 15 (mean plus 1 std of all connection strengths), in a 40 x 40 SOM that was learned with a194-band AVIRIS image comprising approximately 250,000 data vectors. This data set is more noisy than the synthetic data used in the example at left. Thehigh dimensionality and noise produce many violations, at every folding length (bottom plot). The number of violations decreases with increasing foldinglength, and this trend should continue with more learning. The violations with strengths exceeding the threshold, seen here, are not overwhelming consideringthe size of the data set, and in relation to the clusters extracted at this stage (after 300,000 learning steps). Many violating connections “profile” the onionskin structure of the clusters at the bottom part of the SOM, and some others, at the upper right clusters (pale colors), mostly extend to neighboring clustersonly as these clusters are members of a slowly varying series of spectral species. In spite of obvious flaws, which indicate that more learning should be done,this clustering is already in a remarkable agreement with the known spatial distribution of materials in the input image (shown in [29], [30].
what is illustrated through Figure 4, and is further elaboratedon in [24]), is the Differential Topographic Function [28],developed from the Topographic Function [31]. While weillustrate it through visualization in Figure 5, visualizationis not needed for effective utilization and therefore this canbe applied in automatic monitoring. For example, quantitativesummaries of the inter- and within-cluster violations (shownin Figure 5) report on the state of the SOM and a temporaldevelopment of these summaries (improving or worseningtrend) provide feedback on the learning. Depending on theextent, severity and history of the violations, the learning mayneed to be restarted with different parameters; or a changein learning parameters is necessary to accelerate a slowlyimproving trend; or the learning may need a new start witha larger SOM. There are other, more sophisticated (and more
expensive) remediations that can be applied if warranted [32].
After these details that show how much effort goes into theprecision engineering of SOMs and what capabilities result, wegive an example of a many-class supervised classification from∼200-band AVIRIS imagery. The geologic area is CataractCanyon (in the Grand Canyon), where a landslide hazard studywas undertaken as part of a NASA Solid Earth and NaturalHazards Program grant project (PI Victor Baker, U Arizona).The primary purpose of our classification was to map layersin canyon walls with various clay mineralogies as it had beenhypothesized that different clays contribute differently to thedebris-flooding potential of hill slopes. We show, in Figure 6,the resulting class map, and spectral signatures of 15 of the 28surface cover classes that were mapped. (Readers interested inmore specifics including relevant geologic details are referred
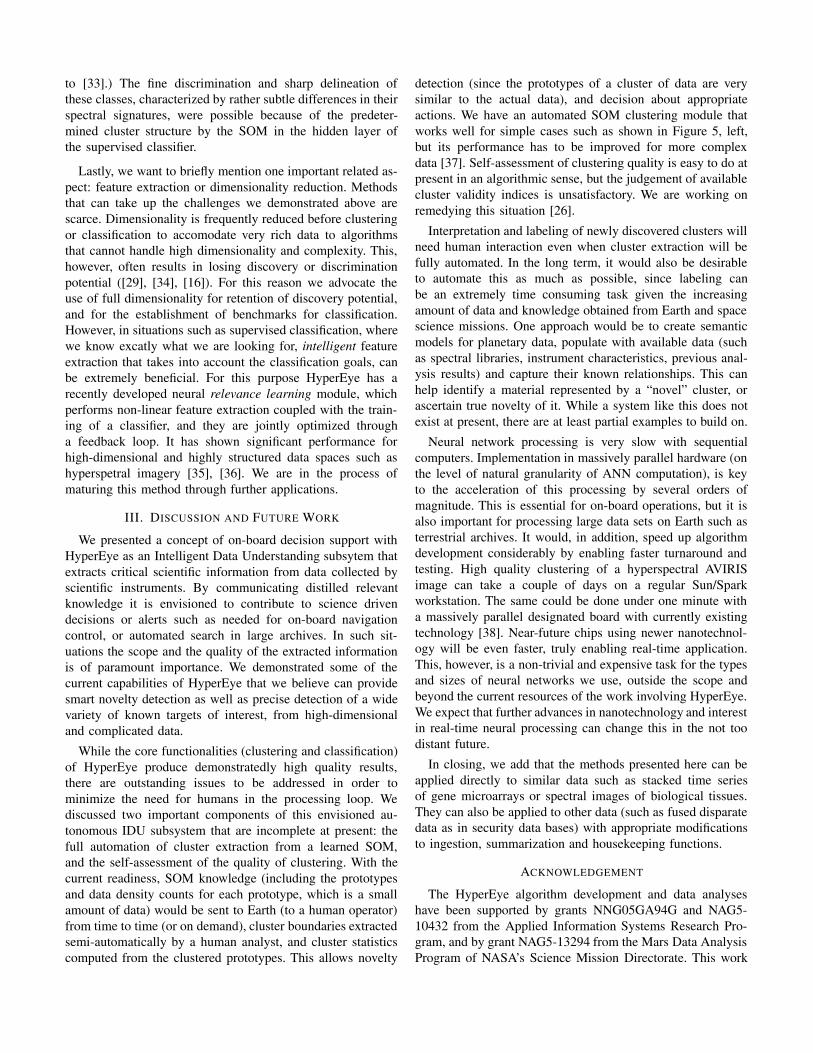
to [33].) The fine discrimination and sharp delineation ofthese classes, characterized by rather subtle differences in theirspectral signatures, were possible because of the predeter-mined cluster structure by the SOM in the hidden layer ofthe supervised classifier.
Lastly, we want to briefly mention one important related as-pect: feature extraction or dimensionality reduction. Methodsthat can take up the challenges we demonstrated above arescarce. Dimensionality is frequently reduced before clusteringor classification to accomodate very rich data to algorithmsthat cannot handle high dimensionality and complexity. This,however, often results in losing discovery or discriminationpotential ([29], [34], [16]). For this reason we advocate theuse of full dimensionality for retention of discovery potential,and for the establishment of benchmarks for classification.However, in situations such as supervised classification, wherewe know excatly what we are looking for, intelligent featureextraction that takes into account the classification goals, canbe extremely beneficial. For this purpose HyperEye has arecently developed neural relevance learning module, whichperforms non-linear feature extraction coupled with the train-ing of a classifier, and they are jointly optimized througha feedback loop. It has shown significant performance forhigh-dimensional and highly structured data spaces such ashyperspetral imagery [35], [36]. We are in the process ofmaturing this method through further applications.
III. DISCUSSION AND FUTURE WORK
We presented a concept of on-board decision support withHyperEye as an Intelligent Data Understanding subsytem thatextracts critical scientific information from data collected byscientific instruments. By communicating distilled relevantknowledge it is envisioned to contribute to science drivendecisions or alerts such as needed for on-board navigationcontrol, or automated search in large archives. In such sit-uations the scope and the quality of the extracted informationis of paramount importance. We demonstrated some of thecurrent capabilities of HyperEye that we believe can providesmart novelty detection as well as precise detection of a widevariety of known targets of interest, from high-dimensionaland complicated data.
While the core functionalities (clustering and classification)of HyperEye produce demonstratedly high quality results,there are outstanding issues to be addressed in order tominimize the need for humans in the processing loop. Wediscussed two important components of this envisioned au-tonomous IDU subsystem that are incomplete at present: thefull automation of cluster extraction from a learned SOM,and the self-assessment of the quality of clustering. With thecurrent readiness, SOM knowledge (including the prototypesand data density counts for each prototype, which is a smallamount of data) would be sent to Earth (to a human operator)from time to time (or on demand), cluster boundaries extractedsemi-automatically by a human analyst, and cluster statisticscomputed from the clustered prototypes. This allows novelty
detection (since the prototypes of a cluster of data are verysimilar to the actual data), and decision about appropriateactions. We have an automated SOM clustering module thatworks well for simple cases such as shown in Figure 5, left,but its performance has to be improved for more complexdata [37]. Self-assessment of clustering quality is easy to do atpresent in an algorithmic sense, but the judgement of availablecluster validity indices is unsatisfactory. We are working onremedying this situation [26].
Interpretation and labeling of newly discovered clusters willneed human interaction even when cluster extraction will befully automated. In the long term, it would also be desirableto automate this as much as possible, since labeling canbe an extremely time consuming task given the increasingamount of data and knowledge obtained from Earth and spacescience missions. One approach would be to create semanticmodels for planetary data, populate with available data (suchas spectral libraries, instrument characteristics, previous anal-ysis results) and capture their known relationships. This canhelp identify a material represented by a “novel” cluster, orascertain true novelty of it. While a system like this does notexist at present, there are at least partial examples to build on.
Neural network processing is very slow with sequentialcomputers. Implementation in massively parallel hardware (onthe level of natural granularity of ANN computation), is keyto the acceleration of this processing by several orders ofmagnitude. This is essential for on-board operations, but it isalso important for processing large data sets on Earth such asterrestrial archives. It would, in addition, speed up algorithmdevelopment considerably by enabling faster turnaround andtesting. High quality clustering of a hyperspectral AVIRISimage can take a couple of days on a regular Sun/Sparkworkstation. The same could be done under one minute witha massively parallel designated board with currently existingtechnology [38]. Near-future chips using newer nanotechnol-ogy will be even faster, truly enabling real-time application.This, however, is a non-trivial and expensive task for the typesand sizes of neural networks we use, outside the scope andbeyond the current resources of the work involving HyperEye.We expect that further advances in nanotechnology and interestin real-time neural processing can change this in the not toodistant future.
In closing, we add that the methods presented here can beapplied directly to similar data such as stacked time seriesof gene microarrays or spectral images of biological tissues.They can also be applied to other data (such as fused disparatedata as in security data bases) with appropriate modificationsto ingestion, summarization and housekeeping functions.
ACKNOWLEDGEMENT
The HyperEye algorithm development and data analyseshave been supported by grants NNG05GA94G and NAG5-10432 from the Applied Information Systems Research Pro-gram, and by grant NAG5-13294 from the Mars Data AnalysisProgram of NASA’s Science Mission Directorate. This work
Fig. 6. Left: Supervised class map of 28 surface cover types in Cataract Canyon (part of Grand Canyon), Utah, from a 196-band AVIRIS hyperspectralimage, using all bands remaining after removing bands with irrecoverable signals due to atmospheric attenuation. Of special interest are a series of layeredgeologic formations of the Grand Canyon, shown in various colors (blue, turqoise, yellow, yellow-green, orange, and others to the right of the blue classes),running down verticaly in the middle of the class map, and then continuing with displacements. Bottom: Some of the corresponding physical layers in theGrand Canyon. Right: Mean spectra of training sets (blue), and of the predicted classes (red) for 15 of the classes seen on the map at left. The graphs arevertically offset for viewing convenience. The standard deviation of the training classes are shown by vertical bars for each spectral channel. The red meanspectra of the predicted classes are, in most cases, virtually indistinguishable from the training means, indicating tight classification. These spectra represent asituation where precise discrimination of many species was needed, with subtle but meaningful differences in their signatures. Details of this geologic mapping(including the names of the layers, illegible here) are described in [33].
involves contributions by graduate students Kadim Tasdemirand Lily Zhang (Rice University) and by former graduatestudents Abha Jain and Major Michael Mendenhall, as well assoftware development by former staff member Philip Tracadasand undegraduate ECE major Allen Geer. It also reflects muchappreciated stimulation and collaborations by space and Earthscience collaborators. HyperEye software development utilizesKhoros [39] and NeuralWare, Inc. [40] libraries.
REFERENCES
[1] E.W. Tunstel, A.M. Howard, and T. Huntsberger, “Robotics challengesfor space and planetary robot systems,” in Intelligence for SpaceRobotics, A.M. Howard and E.W. Tunstel, Eds., TSI Press Series, pp.3–20. TSI Press, 2006.
[2] R. Some, “Space computing challenges and future directions,” inIntelligence for Space Robotics, A.M. Howard and E.W. Tunstel, Eds.,TSI Press Series, pp. 21–42. TSI Press, 2006.
[3] S.J. Graves, “Creating a data mining environment for geosciences,”in Proc. 34th Symposium on the Interface of Computing Scienceand Statistics, Montreal, Canada, 17–20 April 2002, vol.http://www.interfacesymposia.org/interface/I02/I2002Proceedings/GravesSara/GravesSara.presentation.ppt.
[4] J. Rushing, R. Ramachandran, U. Nair, S. Graves, R. Welch, and H. Lin,“ADaM: a data mining toolkit for scientists and engineers,” Computersand Geosciences, vol. 31, pp. 607–618, 2005.
[5] M.S. Gilmore, M.D. Merrill, R. Casta no, B. Bornstein, and J. Green-wood, “Effect of Mars analogue dust deposition on the automateddetection of calcite in visible/near-infrared spectra,” Icarus, vol. 172,pp. 641–646, 2004.
[6] P.R. Gazis and T. Roush, “Autonomous identification of carbonatesusing near-ir reflectance spectra during the february 1999 marsokhodfield tests,” J. Geophys. Res., vol. 106, no. E4, pp. 7765–7773, April25 2001.
[7] Joseph Ramsey, Paul Gazis, Ted Roush, Peter Spirtes, and ClarkGlymour, “Automated remote sensing with near infrared reflectancespectra: Carbonate recognition.,” Data Min. Knowl. Discov., vol. 6, no.3, pp. 277–293, 2002.
[8] E. Merenyi, L. Zhang, and K Tasdemir, “Min(d)ing the small details:discovery of critical knowledge through precision manifold learning andapplication to on-board decision support.,” in Proc. IEEE Intl Conferenceon Systems of Systems Engineering (IEEE SoSE 2007), San Antonio, TX,April 16–18 2007, IEEE.
[9] Q. Jackson and D.A. Landgrebe, “An adaptive classifier design forhigh-dimensional data analysis with a limited training data set,” IEEETransactions on Geoscience and Remote Sensing, vol. 39, no. 12, pp.2664–2679, December 2001.
[10] T. Kohonen, Self-Organizing Maps, Springer-Verlag, Berlin HeidelbergNew York, 1997.
[11] H. Ritter, “Asymptotic level density for a class of vector quantizationprocesses,” IEEE Trans. on Neural Networks, vol. 2, pp. 173–175, 1991.
[12] D. DeSieno, “Adding a conscience to competitive learning,” inProc. Int’l Conference on Neural Networks (ICNN), July 1988, New
York, 1988, vol. I, pp. I–117–124.[13] E. Merenyi, A. Jain, and T. Villmann, “Explicit magnification control
of self-organizing maps for “forbidden” data,” IEEE Trans. on NeuralNetworks, vol. 18, no. 3, pp. 786–797, May 2007.
[14] E. Merenyi, W.H. Farrand, and P. Tracadas, “Mapping surface materialson Mars from Mars Pathfinder spectral images with HYPEREYE.,” inProc. International Conference on Information Technology (ITCC 2004),Las Vegas, Nevada, 2004, pp. 607–614, IEEE.
[15] E. Merenyi, A. Jain, and W.H. Farrand, “Applications of SOM magni-fication to data mining,” WSEAS Trans. on Systems, vol. 3, no. 5, pp.2122–2128, 2004.
[16] E. Merenyi, B. Csato, and K. Tasdemir, “Knowledge discovery in urbanenvironments from fused multi-dimensional imagery,” in Proc. IEEEGRSS/ISPRS Joint Workshop on Remote Sensing and Data Fusion overUrban Areas (URBAN 2007)., P. Gamba and M. Crawford, Eds., Paris,France, 11–13 April 2007, IEEE Catalog number 07EX1577.
[17] A. Ultsch, “Self-organizing neural networks for visualization andclassification.,” in Information and Classification — Concepts, Methodsand Applications, R. Klar O. Opitz, B. Lausen, Ed., pp. 307–313.Springer Verlag, Berlin, 1993.
[18] J. Vesanto and E. Alhoniemi, “Clustering of the self-organizing map,”IEEE Transactions on Neural Networks, vol. 11, no. 3, pp. 586–600,May 2000.
[19] M.A. Kraaijveld, J. Mao, and A.K. Jain, “A nonlinear projection methodbased on Kohonen’s topology preserving maps,” IEEE Trans. on NeuralNetworks, vol. 6, no. 3, pp. 548–559, 1995.
[20] Th. Martinetz and K. Schulten, “Topology representing networks,”Neural Networks, vol. 7(3), pp. 507–522, 1994.
[21] G. Polzlbauer, A. Rauber, and M. Dittenbach, “Advanced visualizationtechniques for self-organizing maps with graph-based methods,” in Proc.Intl. Symp. on Neural Networks (ISSN05), 2005, pp. 75–80.
[22] M. Aupetit, “Visualizing the trustworthiness of a projection,” inProc. 14th European Symposium on Artificial Neural Networks,ESANN’2006, Bruges, Belgium, Bruges, Belgium, 26-28 April 2006,pp. 271–276.
[23] M. Aupetit and T. Catz, “High-dimensional labeled data analysis withtopology representing graphs,” Neurocomputing, vol. 63, pp. 139–169,2005.
[24] K. Tasdemir and E. Merenyi, “Data topology visualization for the Self-Organizing Map,” in Proc. 14th European Symposium on ArtificialNeural Networks, ESANN’2006, Bruges, Belgium, Bruges, Belgium, 26-28 April 2006, pp. 125–130.
[25] J.C. Bezdek and N.R. Pal, “Some new indexes of cluster validity,” IEEETrans. System, Man and Cybernetics, Part-B, vol. 28, no. 3, pp. 301–315,1998.
[26] K. Tasdemir and E. Merenyi, “A new cluster validity index for prototypebased clustering algorithms based on inter- and intra-cluster density,” inProc. Int’l Joint Conf. on Neural Networks (IJCNN 2007), Orlando,Florida, USA, August 12–17 2007.
[27] M. Halkidi and M. Vazirgiannis, “Clustering validity assessment usingmulti representatives,” in Proc. of SETN Conference, Thessaloniki,Greece, April, 2002.
[28] L. Zhang and E. Merenyi, “Weighted differential topographic function:A refinement of the topographic function,” in Proc. 14th EuropeanSymposium on Artificial Neural Networks (ESANN’2006), Brussels,Belgium, 2006, pp. 13–18, D facto publications.
[29] E. Merenyi, “Precision mining of high-dimensional patterns with self-organizing maps: Interpretation of hyperspectral images.,” in Quo VadisComputational Intelligence: New Trends and Approaches in Computa-tional Intelligence (Studies in Fuzziness and Soft Computing, Vol 54, P.Sincak and J. Vascak Eds.). 2000, Physica Verlag.
[30] T. Villmann, E. Merenyi, and B. Hammer, “Neural maps in remotesensing image analysis,” Neural Networks, vol. 16, pp. 389–403, 2003.
[31] Th. Villmann, R. Der, M. Herrmann, and Th. Martinetz, “TopologyPreservation in Self–Organizing Feature Maps: Exact Definition andMeasurement,” IEEE Transactions on Neural Networks, vol. 8, no. 2,pp. 256–266, 1997.
[32] H.-U. Bauer and Th. Villmann, “Growing a Hypercubical Output Spacein a Self–Organizing Feature Map,” IEEE Transactions on NeuralNetworks, vol. 8, no. 2, pp. 218–226, 1997.
[33] L.Rudd and E. Merenyi, “Assessing debris-flow potential by using avirisimagery to map surface materials and stratigraphy in cataract canyon,Utah,” in Proc. 14th AVIRIS Earth Science and Applications Workshop,R.O. Green, Ed., Pasadena, CA, May 24–27 2005.
[34] J. A. Benediktsson J. R. Sveinsson and et al., “Classification of very-high-dimensional data with geological applications,” in Proc. MACEurope 91, Lenggries, Germany, 1994, pp. 13–18.
[35] M.J. Mendenhall and E. Merenyi, “Generalized relevance learningvector quantization for classification driven feature extraction fromhyperspectral data,” in Proc. ASPRS 2006 Annual Conference andTechnology Exhibition, Reno, Nevada, May 5–8 2006, p. 8.
[36] M.J. Mendenhall and E. Merenyi, “Relevance-based feature extractionfor hyperspectral images,” IEEE Trans. on Neural Networks, underreview, 2007.
[37] K. Tasdemir and E. Merenyi, “Considering topology in the clusteringof Self-Organizing Maps,” in Proc. 5th Workshop on Self-OrganizingMaps (WSOM 2005), Paris, France, September 5–8 2005, pp. 439–446.
[38] M. Porrmann, U. Witkowski, and U. Ruckert, “Implementation ofself-organizing feature maps in reconfigurable hardware,” in FPGAImplementations of Neural Networks, A. Omondi and J. Rajapakse, Eds.Springer-Verlag, 2005.
[39] J. Rasure and M. Young, “An open environment for image processingsoftware development,” in Proceedings of the SPIE/IS&T Symposium inElectronic Imaging, Pasadena, CA, February 14 1992, vol. 1659.
[40] Inc. NeuralWare, Neural Computing, NeuralWorks ProfessionalII/PLUS, 1993.