information architecture for intelligent decision support
TRANSCRIPT

Information Architecture for Intelligent Decision Support in Intensive Medicine
SANTOS, M.F.
1, PORTELA, F.
1, VILAS-BOAS, M.
1, MACHADO, J.
2, ABELHA, A.
2, NEVES, J.
2
1Departamento de Sistemas de Informação
2Departamento de Informática
Universidade do Minho
Guimarães
PORTUGAL 1{mfs,cfp,mvb}@dsi.uminho.pt;
2{jmac,abelha,jneves}@di.uminho.pt
SILVA, A., RUA, F.
Serviço de Cuidados Intensivos
Hospital de Santo António
Porto
PORTUGAL
[email protected], [email protected]
Abstract: - Daily, a great amount of data that is gathered in intensive care units, which makes intensive
medicine a very attractive field for applying knowledge discovery in databases. Previously unknown
knowledge can be extracted from that data in order to create prediction and decision models. The challenge is
to perform those tasks in real-time, in order to assist the doctors in the decision making process. Furthermore,
the models should be continuously assessed and optimized, if necessary, to maintain a certain accuracy.
In this paper we propose an information architecture to support an adjustment to the INTCare system, an
intelligent decision support system for intensive medicine. We focus on the automatization of data acquisition
avoiding human intervention, describing its steps and some requirements.
Key-Words: - Real-time data acquisition, knowledge discovery in databases, intensive care, INTCare,
intelligent decision support systems, information models.
1 Introduction Intensive care units (ICU’s) are a particular
environment where a great amount of data related
to the patients’ condition is daily produced and
collected. Physiological variables such as heart
rate, blood pressure, temperature, ventilation and
brain activity are constantly monitored on-line [1].
Due to the complex condition of critical patients
and the huge amount of data, it can be hard for
physicians to decide about the best procedure to
provide them the best health care possible. The
human factor can lead to errors in the decision
making process, while not all the knowable
parameters are always taken into account;
frequently, there is not enough time to analyze the
situation because of stressful circumstances;
furthermore, it is not possible to continuously
analyze and memorize all the data [2] .
Rapid interpretation of physiological time-series
data and accurate assessment of patient state are
crucial to patient monitoring in critical care. The
data analysis allows to support decision making
through prediction and decision models.
Algorithms that use artificial intelligence
techniques have the potential to help achieve these
tasks, but their development requires well-
annotated patient data [3, 4].
We are developing a real-time and situated
intelligent decision support system, called
INTCare1, whose main goal is to improve the
health care, allowing the physicians to take a pro-
active attitude in the patients’ best interest [5, 6].
INTCare is capable of predicting organ failure
probability, the outcome of the patient for the next-
day, as well as the best suited treatment to apply.
To achieve this, it includes models induced by
means of Data Mining techniques [5], [7-10]. Due
to the new fine-grained time response requirements,
is very useful to have models to predict values for
the next hour, which means that the system should
be adapted to real-time data.
1 The INTCare project is financially supported by FTC
(PTDC/EIA/72819/2006).
WSEAS TRANSACTIONS on COMPUTERSM. F. Santos, F. Portela, M. Vilas-Boas, J. Machado, A. Abelha, J. Neves, A. Silva, F. Rua
ISSN: 1109-2750 810 Issue 5, Volume 8, May 2009

This paper relates to the information
architecture needed to support those necessities and
is organized as follows. Section 2 presents
background concepts and some related work.
Section 3 defines some requirements for the
INTCare system and section 4 presents our
proposal for the information architecture.
There is some discussion in section 5 and
section 6 concludes this paper and points for future
work.
2 Background and related work
2.1 Intelligent decision support systems According to Turban [11], a Decision Support
System (DSS) is an interactive, flexible and
adaptable information system, developed to support
a problem solution and to improve the decision
making. These systems usually use artificial
intelligence techniques and are based on prediction
and decision models that analyze a vast amount of
variables to answer a question.
The decision making process can be divided in
five phases: Intelligence, design, choice,
implementation and monitoring [11]. Usually it is
used in the development of rule based DSS [12].
However, these DSS are not adaptable to the
environment in which they operate. To address this
fault, Michalewicz [13] introduced the concept of
adaptive business intelligence. The main difference
between this and the regular decision support
systems is that it includes optimization that enables
adaptability. An Adaptive Business Intelligent
(ABI) system can be defined as “the discipline of
using prediction and optimization techniques to
build self-learning ‘decisioning’ systems. ABI
systems include elements of data mining, predictive
modeling, forecasting, optimization, and
adaptability, and are used to make better
decisions.” [13].
As it is known, predictive models’ performance
tends to degrade over time, so it is advantageous to
include model re-evaluating on a regular basis so as
to identify loss of accuracy [7] and enable their
optimization.
There is a particular type of DSS, the real-time
decision support systems. Ideally, the later includes
adaptive behavior, supporting the decision making
in real time.
To achieve real-time DSS, there is a need for a
continuous data monitoring and acquisition
systems. It should also be able to update the models
in real time without human intervention [5]. In
medicine, most systems only use data monitoring to
support its activities.
2.2 Knowledge Discovery from Databases Knowledge Discovery from Databases (KDD) is
one of the approaches used in BI. According to
Negash [14], BI systems combine data gathering,
data storage, and knowledge management with
analytical tools to present complex and competitive
information to planners and decision makers. KDD
is an interactive and nontrivial process of extracting
implicit and previously unknown and potentially
useful and understandable information from data
[15].
The KDD process is divided in 5 steps:
Selection, pre-processing, transformation, data
mining, interpretation/evaluation [16]. This process
starts with raw data and ends with knowledge.
The automation of the knowledge acquisition
process is desirable and it is achieved by using
methods of several areas of expertise, like machine
learning [8]. The knowledge acquisition takes
advantage of KDD techniques, simplifying the
process of decision support [7].
Knowledge discovery is a priority, constantly
demanding for new, better suited efforts. Systems
or tools capable of dealing with the steadily
growing amount of data presented by information
system, are in order [17].
2.3 Intensive medicine Intensive medicine can be defined as a
multidisciplinary field of the medical sciences that
deals with prevention, diagnosis and treatment of
acute situations potentially reversible, in patients
with failure of one or more vital functions [18].
These can be grouped into six organic systems:
Liver, respiratory, cardiovascular, coagulation,
central nervous and renal [19].
Intensive care units (ICU) are hospital services
whose main goal is to provide health care to
patients in critical situations and whose survival
depends on the intensive care [20], [21]. In the
ICU, the patients vital signs are continuously
monitored and its vital functions can be supported
by medication or mechanical devices, until the
patient is able to do it autonomously [20].
Clinical intervention is based on the degree of
severity scores that allow the evaluation of the
patient’s condition according to a predefined set of
values [22].
The assessment of these severity scores are based
on several medical data acquired from bedside
monitors, clinical analysis and clinical records.
WSEAS TRANSACTIONS on COMPUTERSM. F. Santos, F. Portela, M. Vilas-Boas, J. Machado, A. Abelha, J. Neves, A. Silva, F. Rua
ISSN: 1109-2750 811 Issue 5, Volume 8, May 2009

2.4 INTCare system
INTCare is an intelligent decision support system
for intensive medicine that is being developed in
the ICU of the Hospital Santo António in Porto,
Portugal. It makes use of intelligent agents [5] that
are capable of autonomous actions in order to meet
its goals [6], [23].
In Fig. 1 we can see the conceptual design of the
INTCare system, which is divided into four
subsystems [5] : data entry, knowledge
management, inference and interface.
The data entry sub-system is responsible for the
activities related to data acquisition that will gather
all required data into a data warehouse. The later
will be used by the agents in charge of the
knowledge maintenance.
Fig. 1 – INTCare System
A data acquisition sub-system was added and it
is responsible for the data gathering that will feed
the data entry sub-system (mainly, the data
warehouse).
The knowledge management sub-system
maintains the prediction models used by the
inference sub-system, assessing and updating the
models when necessary. At last, the interface sub-
system is the responsible for the interaction
between the doctors and the system [5].
This system will predict, in real-time, organ
failure and mortality assessment and, according to
these predictions, it will suggest therapeutic
treatment. In this paper we will focus on the Data
Acquisition module, because now we are using
real-time data acquisition, which has three different
types of data sources and therefore, some changes
need to be made.
3 Information requirements
In order to model information for KDD processing,
there are some requirements that should be met:
Online Learning - The system must to act
online, i.e., the models should be induced using
online data in opposition of an offline approach,
where the data is gathered and after processed;
Real-Time - The system must to act in real-
time, the data acquisition and storing must be in
made immediately after the events. By other hand,
the decisions must be taken whenever an event occurs;
Adaptability - The system needs to have the
capacity to, automatically, optimize the models
with the new data. This information is obtained
from the analysis of the results archived;
Data mining models - The success of IDSS
depends, among others, on the acuity of the data
mining models, i.e., the models of prediction must
be reliable. Those models make it possible to
predict events and avert some clinical
complications to the patients;
Decision models - The achievement of the best
solutions depends heavily on the decision models
created. Those are based in factors like
differentiation and decision that are applied on
prediction models and can help the doctors to
choose the better solution on the decision making
process;
Optimization – The data mining models need
to be optimized over time. With this, the models are
in continuous training so that increasingly accurate
and reliable solutions are returned, improving the
models acuity;
Intelligent agents - This type of agents makes
the system work through autonomous actions that
execute some essential tasks. Those tasks support
some modules of system: Data Acquisition,
Knowledge Management, Inference and Interface.
The flexibility and efficiency of this kind of system
emerges from the agents and their interaction [6].
The features described above conducted to
following requirements:
R1 - Fault tolerance capacities;
R2 - Processing to remove null and noisy data;
R3 - Continuous data acquisition process;
R4 - Time restrictions for the data acquisition
and storage;
R5 - Online learning mode;
R6 - Digital data archive in order to promote the
dematerialization of paper based processes (e.g.,
nursing records);
WSEAS TRANSACTIONS on COMPUTERSM. F. Santos, F. Portela, M. Vilas-Boas, J. Machado, A. Abelha, J. Neves, A. Silva, F. Rua
ISSN: 1109-2750 812 Issue 5, Volume 8, May 2009
R7 - Database extension to accommodate the
new data structures;
R8 - Correct usage of the equipment that
collects the vital signs.
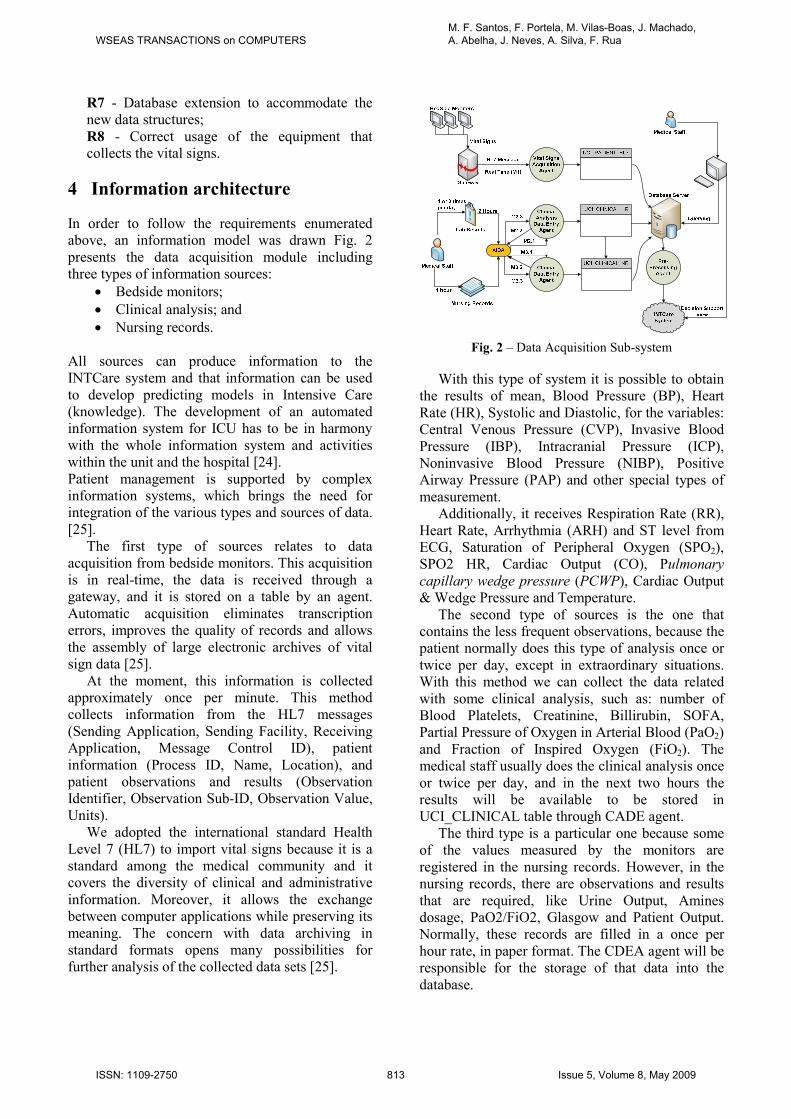
4 Information architecture
In order to follow the requirements enumerated
above, an information model was drawn Fig. 2
presents the data acquisition module including
three types of information sources:
• Bedside monitors;
• Clinical analysis; and
• Nursing records.
All sources can produce information to the
INTCare system and that information can be used
to develop predicting models in Intensive Care
(knowledge). The development of an automated
information system for ICU has to be in harmony
with the whole information system and activities
within the unit and the hospital [24].
Patient management is supported by complex
information systems, which brings the need for
integration of the various types and sources of data.
[25].
The first type of sources relates to data
acquisition from bedside monitors. This acquisition
is in real-time, the data is received through a
gateway, and it is stored on a table by an agent.
Automatic acquisition eliminates transcription
errors, improves the quality of records and allows
the assembly of large electronic archives of vital
sign data [25].
At the moment, this information is collected
approximately once per minute. This method
collects information from the HL7 messages
(Sending Application, Sending Facility, Receiving
Application, Message Control ID), patient
information (Process ID, Name, Location), and
patient observations and results (Observation
Identifier, Observation Sub-ID, Observation Value,
Units).
We adopted the international standard Health
Level 7 (HL7) to import vital signs because it is a
standard among the medical community and it
covers the diversity of clinical and administrative
information. Moreover, it allows the exchange
between computer applications while preserving its
meaning. The concern with data archiving in
standard formats opens many possibilities for
further analysis of the collected data sets [25].
Fig. 2 – Data Acquisition Sub-system
With this type of system it is possible to obtain
the results of mean, Blood Pressure (BP), Heart
Rate (HR), Systolic and Diastolic, for the variables:
Central Venous Pressure (CVP), Invasive Blood
Pressure (IBP), Intracranial Pressure (ICP),
Noninvasive Blood Pressure (NIBP), Positive
Airway Pressure (PAP) and other special types of
measurement.
Additionally, it receives Respiration Rate (RR),
Heart Rate, Arrhythmia (ARH) and ST level from
ECG, Saturation of Peripheral Oxygen (SPO2),
SPO2 HR, Cardiac Output (CO), Pulmonary
capillary wedge pressure (PCWP), Cardiac Output
& Wedge Pressure and Temperature.
The second type of sources is the one that
contains the less frequent observations, because the
patient normally does this type of analysis once or
twice per day, except in extraordinary situations.
With this method we can collect the data related
with some clinical analysis, such as: number of
Blood Platelets, Creatinine, Billirubin, SOFA,
Partial Pressure of Oxygen in Arterial Blood (PaO2)
and Fraction of Inspired Oxygen (FiO2). The
medical staff usually does the clinical analysis once
or twice per day, and in the next two hours the
results will be available to be stored in
UCI_CLINICAL table through CADE agent.
The third type is a particular one because some
of the values measured by the monitors are
registered in the nursing records. However, in the
nursing records, there are observations and results
that are required, like Urine Output, Amines
dosage, PaO2/FiO2, Glasgow and Patient Output.
Normally, these records are filled in a once per
hour rate, in paper format. The CDEA agent will be
responsible for the storage of that data into the
database.
WSEAS TRANSACTIONS on COMPUTERSM. F. Santos, F. Portela, M. Vilas-Boas, J. Machado, A. Abelha, J. Neves, A. Silva, F. Rua
ISSN: 1109-2750 813 Issue 5, Volume 8, May 2009

Next, the tables contained in the database are
defined in terms of their attributes:
UCI_PATIENT_HL7 ⊆ {Monitored Data}
UCI_CLINICAL_LR ⊆ {Creatinine, Billirubin,
Blood Platelets, PaO2,
FiO2, SOFA}
UCI_CLINICAL_NR ⊆ {PaO2, FiO2, Glasgow, Urine Output, Amines,
Patient Output}
UCI_DATABASE ∪ {UCI_PATIENTES_HL7,
UCI_CLINICAL_LR,
UCI_CLINICAL_NR}
In
Fig. 2 we can also see the processes after data
acquisition. When the data is acquired, it is stored
into the database in individual tables.
Next, this data is consolidated for the medical
staff to query the database through a platform
accessed by intranet and export the data to other
programs (e.g., MS Excel) or formats (e.g., ASCII).
The data is available in raw, i.e., processing
issues haven’t been addressed; the users can see
data as it was received and create some statistics. In
the further steps of the system, this data (raw data)
will be transformed using the pre-processing agent.
The way of work of this agent needed to be
reformulated as it will be explained in the next
section. At the end of the pre-processing process,
data will be sent to a data warehouse in the
knowledge management sub-system and it will be
prepared to be used in the data mining tools and
prediction models.
4.1 Data Acquisition Agents INTCare system should be rewritten in order to
incorporate the new requirements. A set of new
agents has been conceived. These agents will be in
charge of the tasks associated to the data
acquisition. Formally, INTCare can be defined as a
tuple:
Ξ ≡ < CINTCare
, ∆INTCare
, agat
, avsa, a
cade,
aada,
app
, acde
, adm,
apf,
ami,
adr,
apd,
asc,
aint,
aic>
The new agents are explained in the following
lines.
Gateway (agat) is responsible to capture the vital
signal data from bedside monitors. This data is
packed into HL7 messages and sent to the Vital
Signs Acquisition Agent;
Vital Signs Acquisition (avsa) is an AIDA
process that parses the HL7 messages, extracts
information blocks and stores them in the database
tables: UCI_PATIENT_HL7.
The HL7 message starts with the header “MSH”
and it is separated with “|” and “^”. This agent
needs to split the message into individual data
information. The data is verified and, if the
information is correct, the agent performs the next
steps. For the PID, PV1, OBR and OBX variables,
it reads the information from the gateway splits the
hl7 message and gets the required data to database.
For optimization purpose, if more than one
message is received within one minute, an
algorithm is applied so that only one message per
minute is stored in the database. Due to the high
number of null values, it was necessary to perform
some optimization. The reason for this high rate is
that the system can look for the values of
physiological parameters more than once per
minute. When this happens the gateway may get
more than one message in the same minute. Some
of these messages will have null values for the
parameters that had been correctly collected in the
previous time.
The solution found was to create an algorithm to
gather all the values read in the same minute and
for the same parameter and calculate the
correspondent average. If it receives more than one
value, it will store the average; if it can't collect any
value in this minute, the field stays as a blank
(null). Otherwise, it stores the single value
collected. In conclusion, when the number of
messages received per minute is greater than 1, it
calculates the average of each one of the variables
and inserts them into the database as a single
record:
WSEAS TRANSACTIONS on COMPUTERSM. F. Santos, F. Portela, M. Vilas-Boas, J. Machado, A. Abelha, J. Neves, A. Silva, F. Rua
ISSN: 1109-2750 814 Issue 5, Volume 8, May 2009

MSG_Data_Average algorithm
If count(msg_per_min)>1 Then
avg(msg_obx_result)
Insert into database (avg_msg_obx_result)
Else
Insert into database (msg_obx_result)
With this algorithm the number of nulls present
in the tables is reduced in 52% (from 60% to 8%).
Clinical Analysis Data Entry (acade) is
responsible for capturing the clinical data from the
lab results that are done in the hospital;
Clinical Data Entry (acde) is responsible for
capturing the clinical data from the medical and
nursing staff [6], especially from nursing records;
AIDA (aada) is an agency to archive and to
disseminate medical exams and results. This
agency will supply the lab results and nursing
records through the clinical analysis data entry
agent and clinical data entry agents [26].
Pre-Processing (app) agent is responsible for the
correct linking of all the values in order to create a
valid (even if limited in scope) medical record for
the patient [6] . This agent is in charge of solving
some data acquisition problems.
Before data is consolidated in the data
warehouse, the agent verifies the data in order to
remove null values and correct the values that are
out of range. It proceeds with the copy of the values
received from bedside monitors, electronic nurse
records and lab results, examines them and derives
new fields. This agent analyzes all values acquired
and only puts in the data warehouse the values that
are acceptable and minimally correct.
4.2 Agents’ messaging The system has various agents responsible for the
necessary tasks related to the data acquisition
process.
The avsa
agent processes the monitored data.
When the gateway receives the vital signs from the
monitors, sends an HL7 message (M1) to the vital
signs acquisition agent.
Next, we can see an example of a HL7 message:
MSH|^~\&|DHV |h2|h3|h4|||ORU^R01|h1|P|2.3.1
PID|1||d1||d2
PV1|1|U|v1
OBR|1|||DHV|||r1|
OBX|x2|NM|x3^x4^^^x5||x6|x7|||||R||||x1^ v1||
Table 1 presents the meaning of each variable
involved in the exchange of messages between the
agents’ agat and avsa.
Table 1 - HL7 message variables
h1 Version ID
h2 Sending Facility
h3 Receiving Application
h4 Receiving Facility
d1 Patient ID (Internal ID)
d2 Patient Name
v1 Assigned Patient Location
r1 Observation Date/Time
x1 Producer's ID
x2 Value Type
x3 Observation Identifier (cod)
x4 Observation Identifier (cod2)
x5 Observation Identifier (descp)
x6 Observation Value
x7 Units
The aada agent exchanges messages with the acad
agent. When the aada agent receives lab results, it
sends a message (M2.1) notifying that new data is
available. The acad agent reads the message and
sends one (M2.2) with the requested variables
(Table 2, column 4). Finally, the aada agent sends
the message (M2.3) with the required data.
When the nursing records are filled in, aada
agent sends a message (M3.1) to the acde agent
informing about the new data (Table 2, column 2).
Acde agent sends a message to the aada agent with
the requested data and aada agent sends back a
message with the required data.
Table 2 - Clinical Variables
Fig. 3 – Sequence diagram of the
messagessummarizes the agents’ messaging process
described above.
e1 Urine Output c1 Billirubin
e2 Glasgow c2 Creatinine
e3 Amines c3 Blood Platelets
e4 SOFA
WSEAS TRANSACTIONS on COMPUTERSM. F. Santos, F. Portela, M. Vilas-Boas, J. Machado, A. Abelha, J. Neves, A. Silva, F. Rua
ISSN: 1109-2750 815 Issue 5, Volume 8, May 2009

Fig. 3 – Sequence diagram of the messages
4.3 - Bedside monitoring data acquisition Out of the three data acquisition sources, only
the bedside monitoring is working at the moment
and in testing phase.
In this phase we analyzed all the physiological
variables provided by the bedside monitoring
devices and chose four parameters routinely
monitored in UCI (HR, SpO2, BP Mean and CVP).
In the Table 3 we can see the number of null
and out of normality range (medical values)
records that were stored in the database. Along the
90 days (from 1st January to 31
st March) we
acquired some data which can be characterized in
the following way:
• Number of Patients: 37 patients (22 males,
15 females);
• Patients per day (average): 3,76;
• Age (average): 56 years
• Database records: ~ 250 thousands;
• Acquisition time (average): Once per
minute;
• Number of hours acquired: 1412 hours in
68 days.
The data refers only to continuous days of
monitoring, i.e., for a patient stay, if the gateway
failed (and no data was collected for one day, for
instance), we do not consider that case.
By analyzing Table 3, we can verify that CVP
has the worst values, 58% of values are either null
or out of range. This result must be taken into
serious account because although automatic data
entry has the advantage of being fast and free of
transcription errors (manually recording and
charting data is a time-consuming and inflexible
task) we must assure that it is also accurate [27].
Appropriate decisions can be made if clinical
information is accurate, comprehensive,
ambiguous and accessible [25]. Reliable
measurements are a prerequisite to fulfill the
expectations of complete, accurate and legible data
[28].Hence, we are creating the means to
automatically clean and consolidate the acquired
values into a data warehouse. The results of the
other values are mostly normal, however, now, we
need to find the reasons for those who aren’t and
find some solutions in order to ensure data quality.
Figures 4 to 7 provide a closer look into each of
the variables analyzed.
The Heart Rate histogram (Fig. 4) shows a good
distribution of the values, although there are some
values that are extremely out of the normal range
(e.g., 0 or 250).
The SPO2 histogram (Fig. 5) presents the
majority of values in the small and correct range,
however there is an interesting number of values
below then 10.
In the Blood Pressure histogram (Fig. 6) the
situation is similar to the previous one, i.e., we
have more than 95% values in normal range [60-
140], but the system collects values between -39
and 350.
As discussed earlier, the CVP (Fig. 7) provided
lower quality values [28], which vary between -40
and 360, whereas the normal range should be much
smaller [2-12] (Figure 6). Normally, values greater
than 30 are atypical, however, 6% of the values
collected are higher than this. Moreover, there are
values below -4 and an unsatisfactory number of
nulls. Concluding, the abnormal values collected
and presented in the four histograms seek for
attention in order to be minimized.
Poor data quality adversely affects both human
and computer decision making [29], so developing
a decision support system in real-time requires that
this import issue is overcome.
Table 3 – Quantification of null and out of range
values for four physiological variables.
WSEAS TRANSACTIONS on COMPUTERSM. F. Santos, F. Portela, M. Vilas-Boas, J. Machado, A. Abelha, J. Neves, A. Silva, F. Rua
ISSN: 1109-2750 816 Issue 5, Volume 8, May 2009

For a better understanding of the amount of null
values or values outside the range, we present
another histogram (Fig. 8) that shows the total (per
hour) of values out of normality in the intensive
care unit.
By analyzing the last histogram (Fig. 8), we can
verify that the hours on which occurs the largest
number of "bad values" are on 10 a.m. and 5 p.m. .
At the moment, we can’t precise which are the
reasons, but we are studying some possibilities that
we found when talking with the nursing staff.
5 Discussion
The INTCare system has been redesigned taking
into account its new challenges. Some requirements
have already been met, while others are being
tested and/or implemented, as discussed below:
R1 – A local repository has been configured to
work as a buffer in order to avoid information
loss;
R2 – The method implemented in MSG_Data_
Average Algorithm reduces in 75% the size of
the table maintaining the accuracy of the
monitored data;
R3 – The Gateway gathers the monitored data in a
continuous mode;
R4 – The processing times of monitored data and
response times for decision support have been
evaluated being values in acceptable levels;
R5 – Real-time data is assured for online learning
in order to evaluate and optimize the data
mining models;
R6 – We are currently developing an electronic
nursing record. Our concern is to make its
filling as much automatic as possible. Some
parameters that are written in the paper-based
version are already being stored digitally
elsewhere, so we are studying the best approach
to include them in the electronic nursing record,
avoiding unnecessary replication of data. At this
Fig. 4 - Distribution of values of the HR variable
Fig. 5 - Distribution of values of the SPO2 variable
Fig. 6 - Distribution of values of the BP variable.
Fig. 7 - Distribution of values of the CVP variable.
Fig. 8 - Total of values “out of range” and “nulls”
WSEAS TRANSACTIONS on COMPUTERSM. F. Santos, F. Portela, M. Vilas-Boas, J. Machado, A. Abelha, J. Neves, A. Silva, F. Rua
ISSN: 1109-2750 817 Issue 5, Volume 8, May 2009

point we must have a close interaction with the
medical and nursing staff.
The dematerialization of processes requires
great care in the design of suitable interfaces for
consulting and analyzing data. Physicians must
have readily accessible data in formats that
conform to their visualization paradigms.
Moreover, health care professionals have to
trust the systems that support the clinical data
records [25].
R7 – In development;
R8 – Commitment of the medical staff.
6 Conclusions and further work
This paper presented the information model
necessary to adapt the system INTCare – Intelligent
Decision Support System for Intensive Medicine -
to real-time and online data acquisition and
processing requirements. The new approach
implements all the data acquisition steps in an
automatic and continuous way and it is being tested
in a real-world environment in the ICU of Hospital
Santo António, in Oporto, Portugal. The solution
encompassed the deployment of a gateway, a set of
agents and data structures in order to give response
to a set of requirements (R1 to R8). A discussion
about how the solution met the requirements has
been included.
Further work includes the dematerialization of
paper based processes (e.g., nursing records) and
database extension in order to accommodate the
new data structures (R6 and R7 requirements). For
data cleaning (noise reduction) purposes, we must
first understand the causes of incorrect values of
some physiological parameters received by the
gateway, such as PVC, which has the highest rate
of incorrect and null values.
We found some possible causes but those need to
be proven before assuming their relevance.
References:
[1] M. Mahmoud, "Real-time data acquisition system for monitoring patients in Intensive Care Unit (ICU)," Multisensor, Multisource
Information Fusion: Architectures,
Algorithms, and Applications 2003, vol. 5099, pp. 320-326, 2003.
[2] M. Pereira, et al., "Computer aided monitoring system of intensive care unit patients," WSEAS Transactions on
Information Science and Applications, vol. 4, pp. 78-84, 2007.
[3] Z. Ying, et al., "Real-Time Evaluation of Patient Monitoring Algorithms for Critical Care at the Bedside," in Engineering in
Medicine and Biology Society, 2007. EMBS
2007. 29th Annual International
Conference of the IEEE, 2007, pp. 2783-2786.
[4] K. Morik, "Data analysis and knowledge validation in intensive care monitoring," 2003.
[5] M. F. Santos, et al., "Intelligent decision support in Intensive Care Medicine," in 2nd International Conference on
Knowledge Engineering and Decision
Support, Lisbon, Portugal, 2006, pp. 401-405.
[6] P. Gago, et al., "INTCare: a knowledge discovery based intelligent decision support system for intensive care medicine," Journal of Decision Systems,
2006. [7] P. Gago and M. F. Santos, "Towards an
Intelligent Decision Support System for Intensive Care Units," presented at the 18th European Conference on Artificial Intelligence, Greece, 2008.
[8] P. Gago, et al., "Adaptive decision support for intensive care," in 13th Portuguese
Conference on Artificial Intelligence, Guimaraes, PORTUGAL, 2007, pp. 415-425.
[9] Á. Silva, et al., "Organ failure prediction based on clinical adverse events: a cluster model approach," 3th International Conference on Artificial Intelligence and Applications, 2003.
[10] Á. Silva, et al., "Multiple organ failure
diagnosis using adverse events and neural networks," in 6 th International Conference
on Enterprise Information Systems, 2004, pp. 401-408.
[11] E. Turban, et al., Decision Support Systems
and Intelligent Systems, 7 ed.: Prentice Hall, 2005.
[12] D. Arnott and G. Pervan, "A critical analysis of decision support systems research," in Conference on Decision Support Systems, Prato, ITALY, 2004, pp. 67-87.
[13] Z. Michalewicz, et al., Adaptive Business
Intelligence: Springer, 2007.
WSEAS TRANSACTIONS on COMPUTERSM. F. Santos, F. Portela, M. Vilas-Boas, J. Machado, A. Abelha, J. Neves, A. Silva, F. Rua
ISSN: 1109-2750 818 Issue 5, Volume 8, May 2009

[14] S. Negash and P. Gray, "Business Intelligence," Communications of the
Association for Information Systems, vol. 13, pp. 177-195, 2004.
[15] W. J. Frawley, et al., "Knowledge Discovery in Databases: An Overview," AI Magazine,
vol. 13, pp. 57-70, 1992. [16] U. M. Fayyad, et al., "From data mining to
knowledge discovery: an overview," 1996. [17] A. Lourenco and O. Belo, "Promoting
agent-based knowledge discovery in medical intensive care units," WSEAS
Transactions on Computers, vol. 2, pp. 403-408, 2003.
[18] Á. Silva, "Modelos de Inteligência Artificial na análise da monitorização de eventos clínicos adversos, Disfunção/Falência de órgãos e prognóstico do doente critico," Doutoramento, Ciências Médicas, Universidade do Porto, Porto, 2007.
[19] J. B. Hall, et al., Principles of Critical Care: McGraw-Hill's AccessMedicine, 2005.
[20] J. Ramon, et al., "Mining data from intensive care patients," Advanced
Engineering Informatics, vol. 21, pp. 243-256, 2007.
[21] S. M. Rao and S. T., "Organization of intensive care unit and predicting outcome of critical illness," Indian J. Anaesth, vol. 47 (5), pp. 328-337, 2003.
[22] J. Pereira, "Modelos de data mining para multi-previsão: Aplicação à medicina
intensiva," Mestrado, Universidade do Minho, Guimarães, 2004.
[23] N. R. Jennings, "On agent-based software engineering," Artificial Intelligence, vol. 117, pp. 277-296, 2000.
[24] S. Kalli, et al., "Inform: Conceptual modelling of intensive care information systems," Journal of Clinical Monitoring
and Computing, vol. 9, pp. 85-94, 1993. [25] T. Fonseca, et al., "Vital Signs in Intensive
Care: Automatic Acquisition and Consolidation into Electronic Patient Records," Journal of Medical Systems, vol. 33, p. 11, 2009.
[26] A. Abelha, et al., "Health data management in the medical arena," WSEAS-Transactions-on-Computers, 2004.
[27] S. Cunningham, et al., "Comparison of nurse and computer charting of physiological variables in an intensive care unit," Journal of Clinical Monitoring and
Computing, vol. 13, pp. 235-241, 1996. [28] W. Friesdorf, et al., "Data quality of
bedside monitoring in an intensive care unit," Journal of Clinical Monitoring and
Computing, vol. 11, pp. 123-128, 1995. [29] D. K. Vawdrey, et al., "Assessing data
quality in manual entry of ventilator settings," Journal of the American Medical
Informatics Association, vol. 14, pp. 295-303, 2007.
WSEAS TRANSACTIONS on COMPUTERSM. F. Santos, F. Portela, M. Vilas-Boas, J. Machado, A. Abelha, J. Neves, A. Silva, F. Rua
ISSN: 1109-2750 819 Issue 5, Volume 8, May 2009