informal workers across europeftp.iza.org/dp5871.pdf · informal workers across europe: ... and a...
TRANSCRIPT

DI
SC
US
SI
ON
P
AP
ER
S
ER
IE
S
Forschungsinstitut zur Zukunft der ArbeitInstitute for the Study of Labor
Informal Workers Across Europe: Evidence from 30 Countries
IZA DP No. 5871
July 2011
Mihails Hazans

Informal Workers across Europe:
Evidence from 30 Countries
Mihails Hazans University of Latvia
and IZA
Discussion Paper No. 5871 July 2011
IZA
P.O. Box 7240 53072 Bonn
Germany
Phone: +49-228-3894-0 Fax: +49-228-3894-180
E-mail: [email protected]
Any opinions expressed here are those of the author(s) and not those of IZA. Research published in this series may include views on policy, but the institute itself takes no institutional policy positions. The Institute for the Study of Labor (IZA) in Bonn is a local and virtual international research center and a place of communication between science, politics and business. IZA is an independent nonprofit organization supported by Deutsche Post Foundation. The center is associated with the University of Bonn and offers a stimulating research environment through its international network, workshops and conferences, data service, project support, research visits and doctoral program. IZA engages in (i) original and internationally competitive research in all fields of labor economics, (ii) development of policy concepts, and (iii) dissemination of research results and concepts to the interested public. IZA Discussion Papers often represent preliminary work and are circulated to encourage discussion. Citation of such a paper should account for its provisional character. A revised version may be available directly from the author.

IZA Discussion Paper No. 5871 July 2011
ABSTRACT
Informal Workers across Europe: Evidence from 30 Countries*
The European Social Survey data are used to analyze informal employment at the main job in 30 countries. Overall, informality decreases from South to West to East to North. However, dependent work without contract is more prevalent in Eastern Europe than in the West, except for Ireland, the UK and Austria. Between 2004 and 2009, no cases found when unemployment and dependent informality rates in a country went up together, suggesting that work without contract is pro-cyclical in Europe. Dependent informality rate is inversely related to skills (measured by either schooling or occupation). The low-educated, the young (especially students), the elderly, and persons with disabilities are more likely to work informally, other things equal. In Southern and Western Europe, immigrants from CEE and FSU feature the highest dependent informality rate, whilst in Eastern Europe this group is second after minorities without immigrant background. In Eastern, Southern and part of Western Europe, immigrants not covered by EU free mobility provisions are more likely to work without contracts than otherwise similar natives. We provide evidence that exclusion and discrimination play important role in pushing employees into informality, whilst this seems not to be the case for informal self-employed. Both on average and after controlling for a rich set of individual characteristics, informal employees in all parts of Europe are having the largest financial difficulties among all categories of employed population (yet they fare much better than the unemployed and discouraged), whilst informal self-employed are at least as well off as formal employees. JEL Classification: J21, J24, J61, J71, O17, O52 Keywords: informal employment, human capital, discrimination, minorities, immigrants Corresponding author: Mihails Hazans Faculty of Economics and Management University of Latvia Aspazijas Blvd 5 Riga LV-1050 Latvia E-mail: [email protected]
* This paper is based on a background study (Hazans 2011a) for In from the Shadow: Integrating Europe’s Informal Labor, a World Bank regional report on the informal sector in Central, Southern Europe and the Baltic countries (Task number P112988). The paper has greatly benefited from discussions with and suggestions by Truman Packard. I thank Alexander Tarvid for excellent research assistance. I thank Hartmut Lehmann, Jan Rutkowski, Indhira Santos and participants of IZA/World Bank Workshop Institutions and Informal Employment in Emerging and Transition Economies (Bonn, June 2011) for useful comments and suggestions. The usual disclaimer applies.

IZA Discussion Paper No. 5871 July 2011
NON-TECHNICAL SUMMARY The European Social Survey data covering 30 countries for the period between 2004 and 2009 are used to look at workers whose main job is informal: employees without contracts, own-account workers (except engineers, doctors, teachers, lawyers and other professionals), employers with five or less employees, and those helping in family business. On average, one out of six employed persons in Europe has been holding an informal main job during the surveys conducted in 2008-2009. This informality rate was about 11% in Nordic countries, 15% in the East, 16% in the West and 28% in the South. Among employees, the highest proportions of workers without contracts are found in Cyprus (nearly half), Israel and Greece (one third), Ireland (more than a quarter), the United Kingdom (12%), Portugal (11%), Ukraine, Slovenia, Bulgaria and Russia (9% to 7%), Romania, Spain and Poland (6%). In addition, during the growth period of 2005-2007, significant informality rates were found in Austria (10%), Denmark (9%), Latvia (7% to 9%) and Lithuania (7%), according to ESS and other data. Between 2004 and 2009, no cases found when the rates of unemployment and dependent work without contract in a country went up together. In all parts of Europe, the share of employees without contracts is inversely related to skills (measured by either schooling or occupation). The low-educated, the young (especially students), the elderly, and persons with disabilities are more likely to work informally, other things equal. In Southern and Western Europe, employees from Central and Eastern Europe and former Soviet Union feature the highest informality rate, whilst in Eastern Europe this role belongs to ethnic minorities without immigrant background. In Eastern, Southern and part of Western Europe, immigrants not covered by EU free mobility provisions are more likely to work without contracts than otherwise similar natives. We provide evidence that exclusion and discrimination play important role in pushing employees into informality, whilst this seems not to be the case for informal self-employed. Both on average and after controlling for a rich set of individual characteristics, informal employees in all parts of Europe are having the largest financial difficulties among all categories of employed population (yet they fare much better than the unemployed and discouraged), whilst informal self-employed are at least as well off as formal employees.
2
Introduction
Paid work without legal contract is a phenomenon closely related to such fields of economic and
social studies as shadow economy, tax evasion, trust in and efficiency of institutions, labor demand
and labor supply, self-employment, worker mobility, labor market flexibility, social exclusion, social
security, and many others. Understanding determinants of the size of informal workforce is thus
important both for policy making and for design of institutional reforms. Yet research in this field,
especially in European context, has been limited due to lack of comparable data.
In this paper we compare the prevalence of informal employment in 30 European countries
using data from the European Social Survey (2004-2009), further referred to as ESS. Our analysis
excludes under-declared work (envelope wages) and does not distinguish declared and undeclared
output. In other words, we focus on dependent workers without contracts, as well as on self-employed
(a further classification of self-employed into ‘formal’ and ‘informal’ will be suggested below).
We address the following questions:
• How strongly do European countries, as well as Northern, Western, Eastern and Southern
Europe1 differ from each other in terms of levels of informal employment observed in the first
decade of the 21st century? Does a stable ranking emerge?
• How does prevalence of work without contract among wage earners depend on their human
capital and other characteristics? In particular, how do minorities, first and second generation
immigrants compare to native workers?
• Is informal wage employment found only in small establishments in selected sectors, or is it
more common?
• How are the levels of informal employment related to the economic cycle? In particular, how
did they respond to the current crisis?
• Does a typical informal worker come from a poorer household than his/her counterpart who
has an employment contract? What about informal self-employed?
• What are the main determinants of informal employment at the individual level? Do these
determinants differ across country groups?
ESS data have some features important for the analysis of informality which are, to our best
knowledge, not available in other multi-country datasets (in particular, in EU LFS). First, ESS
questionnaires for rounds 2, 3, and 4 (implemented in years 2004-2005, 2006-2007, and 2008-2009,
respectively) allow users to identify employees working without a contract. By contrast, LFS data
(both the anonymised data sets disseminated by Eurostat and, for most countries, also the original
datasets) allow users only to distinguish between permanent and temporary contracts, while answer
1 We will sometimes refer to these geographical areas as to „European regions”. Otherwise (i.e. when „European” is not added) „regions” stand for within-country regions.

3
‘no contract’ is not offered to respondents (like it was in round 1 of ESS)2. Comparison of ESS data of
rounds 2-4 with those of round 1 suggests strongly that if the answer ‘no contract’ is not included, the
proportion of employees who do not answer the question about type of contract (or choose answer
“Don’t know”) cannot, in general, be used as a proxy for proportion of informally employed
dependent workers (see Table A2 in the Annex).
Second, in ESS data, a distinction can be made between self-employed persons with and
without employees, and in the former case the number of employees is reported as well. This is
important because in many studies which use data without direct information on contract, employees
are ‘assigned’ to informal sector if they work in enterprises with 5 or fewer workers. It would then
make sense to apply the same criterion to employers, i.e. to consider an employer with 5 or fewer
employees to be working in informal sector. However, LFS and most other internationally comparable
datasets provide, at best, only information on “number of persons working in the local unit” of
respondent’s main job; in case of employers this of course cannot be considered as a proxy for the
total number of employees working for him.
Third, ESS data are available not only for all EU countries, but also for Norway, Switzerland, Russia,
Ukraine, and Israel (for various data-related reasons our analysis omits Luxembourg, Malta, Turkey,
and Croatia).
The contribution of the paper to the literature on informal employment is three-fold. First, we
use direct survey evidence (rather than proxies) to provide a multi-country longitudinal analysis of the
levels, dynamics and profile of dependent employment without contract, as well as informal self-
employment, in Europe. Importance of using direct evidence is highlighted in Henley et al. (2006),
who find that “definitions of informality based on occupation and employer size seem the most
arbitrary in practice”, and in Perry et al. (2007), who report (based on a survey conducted in 9
countries in Latin America) that “large firms… have a significant number of employees without social
security contributions”. On the other hand, we are able to draw the line between informal and formal
self-employment more accurately than most other studies (which often consider all self-employed
informal).3 Importantly, for 25 countries, our analysis includes the early stage of the economic crisis of
2008-2010: field work of the round 4 of the ESS has been completely or mostly performed in 2008/q4
for 14 countries, and in 2009 for 11 countries in our sample. We provide evidence that exclusion, lack
2 Moreover, in cases when the original questionnaire includes the „no contract” option, Eurostat groups these responses together with „temporary”, making it very difficult to distinguish informally employed from who is legally employed fixed-term workers. 3 ILO (2002) states that „the self-employed ...include high-end professionals and employers of registered enterprises, who are not considered to be informally employed. These categories are assumed to be small worldwide...”. We consider a self-employed person belonging to formal sector if he/she either works in a professional occupation (like lawyer, doctor, consultant, etc.) or has more than five employees. This approach is similar to the one found in Henley et al. (2006) and consistent with the ILO (2003) guidelines requiring that “The enterprise of informal employers must fulfill one or both of the following criteria: size of unit below a specified level of employment, and non-registration of the enterprise or its employees”. We show further (see Table 3) that in Eastern Europe formal self-employed account for about 2% or labor force, whilst in the rest of Europe this proportion is 3% and thus cannot be claimed negligible.

4
of human capital and discrimination play important role in pushing employees into informality, whilst
this seems not to be the case for informal self-employed.
Second, we show that both on average and after controlling for a rich set of individual
characteristics, informal employees in all parts of Europe are having the largest financial difficulties
among all categories of employed population (yet they fare much better than the unemployed and
discouraged), whilst informal self-employed are at least as well off as formal employees.
Third, we present analysis of determinants of work without a contract among employees,
highlighting the role of educational attainment, age and immigrant background. The results also
suggest a substantial within-country regional variation in informality across Europe, except for Nordic
countries, Hungary, Romania and Slovenia.
The rest of the paper is organized as follows. Section 1 briefly outlines the predictions of search
and matching labor market model (Pissarides 2000) with regards to workers’ sorting between formal
and informal jobs. Section 2 describes prevalence and dynamics of informal employment in Europe.
Section 3 compares profiles of informal and formal employees, as well as informal self-employed in
terms of exclusion factors, such as long-term unemployment experience and perceived discrimination.
Section 4 household income (Section 3.3). Section 5 presents econometric analysis of individual level
determinants of work without contract among employees4. Section 6 concludes. Annex provides
additional material related to measurement issues (including comparisons with other sources).
1 Theoretical framework
The literature provides several models describing the behavior or workers and firms, as well as
the role of institutions and other macro factors in an economy with formal and informal sector5 in
presence of labor market frictions Boeri and Garibaldi (2005); Boeri et al. (2011), De Paula and
Scheinkman (2011), Basu et al. (2011) and Johasson (2011) among others assumed workers to differ
just in one parameter (skill or labor market productivity); they predict that informal jobs are occupied
by relatively low skilled workers. Our approach here is closer to that of Bosch and Maloney (2010),
where workers have several attributes affecting their comparative advantage in one of the sectors, as
well as search intensity. Our focus is on workers, whilst macro factors and institutions are considered
exogenous6. Compared to Bosch and Maloney (2010), we provide a more detailed and structured
description of workers’ attributes and derive specific predictions with respect to determinants of
informality.
4 See Hazans (2011b) for a more general analysis of determinants of labor market status, including employment formality. 5 Unemployment is considered either as an option within each of the two sectors or as a „third sector”. 6 See Hazans (2011c) for a more general approach. In a general equilibrium framework, Boeri and Garibaldi (2005) derive effects of some institutions; Basu et al. (2011) derive an ‘optimal’ minimum wage level.

5
Following Bosch and Maloney (2010), we do not explicitly model firms’ behavior, treating
demand for formal and informal labor as exogenous (yet allowing for regional heterogeneity).
However, in the context of search and frictions model, we assume that firms try to minimize
recruitment costs; thus, to fill an informal job they target individuals belonging to specific groups
known to known to be over-represented in the informal sector and/or to have difficulties in the formal
labor market; in addition they might use networks of their existing informal employees. This way,
“informal” social capital increases individual’s chances to receive an informal job offer. Likewise,
“formal” social capital raises chances to receive a formal job offer.
At a given moment of time, utility of an individual i (from region R) from choosing any of
available labor market states s (formal and informal dependent employment, formal and informal self-
employment, unemployment and inactivity) is given by
Uis = us(Vi) + δRs + εis, Vi = xiβs + zγs, (1)
where V is the expected present value of the best of the vacancies (including the present job if any)
available for the agent in the state s, βs and γs are state-specific returns to [vectors of] individual
characteristics xi and macro factors z, us are given utility functions, and δRs , εis are region and
individual level random errors. In the random utility maximization framework (McFadden, 1981), an
agent chooses the state in which Uis is maximal. Formal dependent work might not be available to the
most low-skilled workers, because formality is costly to the firms, and it does not pay to employ a
low-productivity worker formally. This and other basic features of informal and formal jobs, along
with the targeted recruitment process outlined above, suggest the following list of main individual
determinants of informal (rather than formal) dependent employment (conditional on being an
employee)7:
(i) low skills (as measured by educational attainment, occupation, experience, etc.) and/or low
unobserved productivity;
(ii) strong preference for flexible working time and/or substantial volatility of desired working hours
over the course of the year;
(iii) low value placed on job security;
(iv) large endowment of social capital relevant for the informal sector (belonging to a group or groups
which is known to be over-represented in the informal sector and/or to have difficulties in the formal
labor market: ethnic or linguistic minority, first or second generation immigrants, students, pensioners,
persons with disabilities);
(v) low level of tax morale and/or trust in state institutions.
Apart from the standard prediction that informal workers are likely to be less skilled, it follows
that the age-informality profile is likely to be U-shaped. Indeed, younger and older workers are
usually less productive than middle-aged ones and less prepared for a stable fulltime work; the young
ones, especially students, and those in retirement age are also less concerned about job stability.
Students and persons with disabilities, also are more likely than others to receive informal job offers 7 See Hazans (2011b) for econometric analysis of agents’ sorting across all six labor market states.

6
(and, plausibly, to be less productive) than other workers, so we expect these groups to feature higher
informality rates, other things equal.
Minorities, workers with immigrant background, as well as workers in less developed regions,
are more likely to hold informal jobs because of large informal social capital which, in addition, might
interact with low trust in institutions and in some cases with productivity problems caused by
insufficient language skills.
With respect to gender and family status, the predictions are ambiguous because those whose
family status suggests a strong preference towards flexible working time, are also likely to place high
value on job security and be more risk averse in general.
2 Prevalence and dynamics of informal employment in Europe, 2004-2009
In this section we use the ESS data to compare prevalence of informal employment (in the main
job) across 30 European countries and years 2004 to 2009. For 25 countries we will also show (in
Table A3) that ESS-based results for 2004-2006 are well in line with the results of the Fourth
European Working Conditions Survey (EWCS) conducted in 2005/Q4 (see European Foundation for
the Improvement of Living and Working Conditions, 2007); it is worth noting that ESS and EWCS
have been coordinated by different research teams, and the fieldwork providers for the two studies
have been also different in all but three countries. For few countries, we will also provide comparisons
with other studies which give information on work without contract.
2.1 Measuring informal employment
Although international guidelines for a statistical definition of informal employment have been
developed by ILO (see ILO, 2002; ILO, 2003; Hussmanns, 2004), the literature suggests a variety of
approaches to identifying informal working relationships using, ‘legalistic’, ‘de facto’, or ‘productive’
definitions (see e.g. Henley et al., 2006; Perry et al., 2007; Bernabè, 2008; OECD, 2009; Pfau-
Effinger, 2009). Legalistic definitions refer (in the simplest cases) to social security contributions or to
employment status (self-employment vs. dependent employment) and, in the latter case, to
employment contract. De facto (‘in law or in practice’) definitions take into account various situations
when labor regulations are not applied, not enforced, or not complied with for any reason. Productive
definitions rely on characteristics of the employer and/or the employed, e.g. size of establishment or
occupation of a self-employed person. Combinations of these approaches are common; the ILO
guidelines distinguish nine categories (cells) within informal employment (see ILO, 2003 or
Hussmanns, 2004 for details).
One can further distinguish informal employment at the main or secondary job. Moreover, the
concept of informal employment overlaps with the concept of under-declared work (also known as

7
‘envelope wages’ or ‘quasi-formal employment’, see Riedmann and Fischer, 2008; Williams and
Renooy, 2008; Williams, 2009)8. Arguably, such quasi-formal employment falls into ILO (2003)
definition of “informal employment outside the informal sector”; however, ILO (2003) asserts that
“for purposes of analysis and policy-making, it may be useful to disaggregate the different types of
informal jobs”, and work without a contract is clearly a category which deserves to be analyzed
separately. Hereafter, as far as employees are concerned, we apply the term ‘informal employment’
only to work without a contract.
To identify informal employees, different surveys use either direct questions about employment
contract/‘labor card’/‘tax book’ or indirect questions (e.g. about social security contributions, paid
annual leave or sick leave), see e.g. Hussmanns (2004), Henley et al. (2006), Perry et al. (2007),
Bernabè (2008). Although, as shown by Henley et al. (2006), different definitions of informal
employment may lead to substantially different results and “may imply very different conceptual
understandings of informality”, exact definitions applied in particular studies are often dictated by data
availability. To give an example, Bernabè (2008) suggests a classification of informal employment,
but operational definitions based on available household surveys for seven CIS countries appear to be
far from identical. For cross-country studies, ability to apply a comparable operational definition is
crucial. This study fills an apparent gap in the literature in this respect for Europe.
Details of our suggested classification of the employed population by ‘formality’ of
employment are given in Table 1. The ESS questionnaire does not ask details on work activities other
than main job, hence informal employment outside main job is beyond the scope of this study. Hence,
our estimates of informality rates are quite conservative. Formal employment includes anybody
holding an employment contract (including family workers with a contract).
Employers with more than five employees, as well as the self-employed without workers who
work as professionals (i.e. those belonging to ISCO main group 2) are considered formally self-
employed. The “five workers threshold” is a natural extension of the approach used in the literature
when classifying the “formality” of employees based on data without information on contract type. On
the other hand, professionals are more often operating legally with some kind of license and pay taxes
from at least some part of their income; unreported part of their income, if any, if not relevant for our
classification – as are ‘envelope wage’ payments received by legally employed workers. Other self-
employed persons (i.e. all non-professional self-employed operating solely, as well as employers with
5 or fewer workers) are considered informally self-employed. Thus, all employers, including those
working as professionals, are treated according to the firm-size criterion9.
8 There are also broader, activity-based, concepts of undeclared work and shadow economy activities (Pedersen, 2003; Djankov et al., 2003; Hanousek and Palda, 2003; Schneider, 2005; Williams and Renooy, 2008; Williams, 2009; Feld and Schneider, 2010; Schneider et al. 2010) which are not considered in this paper. 9 An alternative approach would be to classify all employers working as professionals as formally self-employed, disregarding the number of employees. In both cases some classification errors are inevitable. As a robustness check, informality rates have been recalculated under this alternative definition. Country rankings are not affected on total informality and not significantly affected on informal self employment. The decline in the share of informal self employed in the extended labor force in most cases is well below 1 percentage point, except for Italy, Germany, Switzerland and Cyprus where it is between 1.0 and 1.3 points (from a base above 10%). In

8
Persons working without a contract for own family’s business (family workers) form a separate
(small) category. These persons belong rather to informal than to formal employment (ILO, 2003), but
being residual earners from profits they are different from both the formal employees and the self-
employed. Finally, employees without a contract (or those uncertain of their contract) are informally
employed, i.e. belong to informal dependent employment.
Note that there are some differences across countries in the legal requirements on employment
contracts for dependent workers (see Table A1 in the Annex). In Eastern European countries (except
Hungary and Poland), in Nordic countries (except Finland), as well as in Switzerland, Italy and
Greece, a written employment contract is always required. In most of these countries the contract must
be signed in advance or immediately after starting work; in Russia and Ukraine – within 3 days; and in
Greece – within 2 months.
By contrast, in most of the Western Europe, as well as in Hungary, Poland, and Portugal, having
a written contract is considered good practice but is required either only for “atypical” (apprenticeship;
fixed-term; seasonal; part-time; replacement, etc.) employment, as in Austria, Belgium, France and
Portugal, or, the other way around, only for contracts of indefinite duration (Hungary and Cyprus), or
is not generally required (Poland, Finland, Germany, the Netherlands, Ireland and the UK)10. In all
these cases a contract as such is required but it might be oral (in Finland – also electronic); moreover,
the employee must be given written terms of employment (ToE) signed by the employer (the
mandatory content of ToE is specified in the law).
From employee perspective, this latter document is as good as a contract – and it is fair to
assume that an employee with an oral contract and a written ToE will not choose the answer “No
contract” in the questionnaire (it is important to emphasize that ESS questionnaire asks about a
contract as such rather than about a written contract). On the other hand, workers with oral contracts
who were not given written ToE might well respond as if they work without a contract, but their
situation is in fact closer to informal than to formal employment. In other words, there are reasons to
believe that, most of the time, the ESS contract question indeed identifies informal employees even in
the countries where a written contract can be replaced by written ToE. Like with the written contracts,
some countries request that ToE are issued in advance or immediately after starting work, whilst
others allow for this some time: Finland, the Netherlands and Cyprus - 1 month; the UK and Ireland –
2 months. In fact, during this period the employee might be considered employed informally, and the
possibility to postpone signing of ToE as such is likely to increase informality (in case of inspection,
the employer might say that the employee in question started to work less than a month or two ago).
Whether or not this likelihood will materialize depends on other factors – institutions and social norms
(including tax morale). As we will see later, four of six countries where signing the contract or ToE
relative terms, the decline is below 3% for 12 countries, between 4% and 6% for another 12 countries, 7% to 9% for 3 countries, and between 10% and 14% for Germany, Switzerland and Romania. 10 In Spain, a written contract is required if either party requests it (even during the course of employment relationship), as well as for “atypical” employment.

9
can be postponed substantially (Greece, Cyprus, the UK and Ireland) feature very high dependent
informality rates, whilst it is not the case for Finland and the Netherlands.
In the literature, survey-based prevalence of informal employment has been presented as a
percentage of (i) working-age population; (ii) labor force; (iii) total (or non-agricultural) employment;
(iv) salaried workers. The choice of base depends on the definition of informality, on the information
available in the survey, and on the purpose of the study. The first approach is used in studies focusing
on transitions between sectors and labor market states (e.g. Bosch et al. (2007), Bosch and Maloney
(2010), Nikolova et al. (2010)), as well in cases when data come from surveys where questions on
shadow activities refer to a much longer period (e.g. 12 months) than the ones used in ILO definitions
of employment (e.g. Riedmann and Fischer, 2008; Williams and Renooy, 2008). Loayza et al. (2009:
Figure 1) apply (ii) and (iii), whilst Perry et al. (2007: Figure 2) use all four approaches. The third
approach is used also by ILO (2002) and Feld and Schneider (2010: Table 1411). Given that
unemployment and ‘discouragement’ are alternatives to formal or informal employment that are
shaped by the same policies and economic circumstances, we argue that the labor force extended to
include discouraged workers is a more reasonable base for measuring the size of informal
employment, especially for the purposes of international comparisons.
To allow comparability with other studies, in Table 2 we present various measures of
prevalence of informal employment in Southern, Eastern, Western, and Northern Europe. As we are
mostly interested in comparisons between countries and in the effects of institutions, most of our
results are either based on within-countries calculations or derived assuming that a respondent from
any country is equally likely to be surveyed (i.e. countries are not weighted by population size); in
Table 2, however, we present both equally-weighted and population-weighted estimates for the four
above mentioned geographical areas, as well as for Europe as a whole. Equally-weighted estimates
(means shown in Table 2 and medians found e.g. in Figure 2) refer to prevalence of informal
employment in ‘an average country’ in a country group; in this case the size of country’s population
does not affect the estimate – Belgium has the same weight as Germany. Population-weighted
estimates refer to the share of informal employment in the adult population (or labor force, or total
employment) of European regions. Such estimates are of interest on their own, but being dominated by
large countries they are less useful for policy analysis.
2.2 Informal employment in Eastern, Western, Northern and Southern Europe
It appears that informality is most prevalent in the South and least prevalent in the Nordic
countries, whilst the difference between the West and the East is, on aggregate, surprisingly small,
especially as far as population-weighted estimates are concerned. According to population-weighted
estimates based on respondents’ status during the survey (Table 2, panel A, left), the proportion of
11 Feld and Schneider (2010) express the estimated full-time equivalent shadow labor force as percentage of ‘official labor force’, but the figures suggest that by labor force they mean employed population.

10
employees without a contract among all employees in 2008-2009 varies from 2.7% in the Nordic
countries to 9.5% in the Southern Europe, whilst it is just above 5% in the West and in the East alike;
when those who did not respond to the question regarding the contract are treated as not having a
contract (which is a plausible assumption), the prevalence of work without a contract becomes higher
in the East (6.7%) than in the West (5.5%), whilst it does not change much in the North and in the
South. Equally-weighted estimates are substantially higher than the population-weighted ones for the
South and for the West, disregarding the treatment of non-response. This is due to very high
proportions of employees without contracts in a few relatively small countries: Cyprus (almost half),
Greece and Israel (about one third), Ireland (close to one fifth), and Austria (one tenth); see Table 3 for
details.
Total informal employment (i.e., employees without contracts, non-professional self-employed
operating solely, employers with 5 or less employees, and family workers) accounts for about 10% of
extended labor force in the Northern Europe, about 14% in the West and in the East, and about 25% in
the South; equally-weighted averages are again higher for the South and for the West (Table 2, panel
A, right). The overall population-weighted average for the 30 countries covered is 15.7%, and equally-
weighted average is 17.4%. Hence one out of six labor force members (and about one out of ten adult
residents) in Europe has been working informally during the surveys conducted in 2008-2009. See
Table 2 for more details.
Informal employment is often irregular or seasonal. During the periods of employment, shadow
workers might become hard-to-reach by the surveyors if they work long hours or work far away from
their residence. This is why, in principle, estimates based on engagement in informal work during the
last 12 months (rather than during the survey week) are more reliable. In the case of ESS such an
approach also helps to address the potential seasonality issue (the season of the field work varies by
country, see Table 3). ESS data provide detailed information about the last job (if any) of respondents
who are currently non-employed, so that those who were employed informally can be identified
according to definitions in Table 1.
Unfortunately, it is not possible to apply the 12 months reference period exactly, because for
each respondent we know the month of the interview but only the year of the last job. We have dealt
with this as follows: respondents interviewed between September and December (respectively,
between January and August) have been classified as ‘recently employed informally’ if they last
worked (informally) within the same year (respectively, within the same or the previous year). In most
countries, the core period of field work was between September and March, so that in 21 out of 30
countries the average reference period deviated from 12 by no more than 2 months; in 6 countries it
was about 15 months, and only in Latvia and the Czech R. it was close to 18 months. Moreover, for
each of the four European regions the average is close to 12 months: 11 months for the North, 11.6
months for the West, 12.6 months for the South, and 14.6 months for the East.
Based on these reference periods, the estimated size of currently non-employed population
engaged in informal employment during the 12 months preceding the 2008-2009 round of the ESS is

11
3.5% of current extended labor force, ranging from 1.5% in the Nordic countries to 3% in the West to
4% in the East; for Southern Europe, the population-weighted estimate is 3.6%, but the equally-
weighted one reaches 5.5% (Table 2, panel B, left). Note that the vast majority of these cases concerns
dependent employment without a contract (rather than self-employment). When these estimates are
added to the estimates of informal employment during the survey, the overall population-weighted
(respectively, un-weighted) average estimate of population recently engaged in informal employment
for the 30 countries covered is 19.2% (respectively, 21.3%) of the current extended labor force, or
11.4% (respectively, 12.8%) of the population aged 15+. The informality ranking of the four
European regions remains unchanged: the highest prevalence of informal employment is found in the
South (more than one quarter of extended labor force); in the West and in the East this proportion is
one sixth, whilst in the Nordic countries it is between one ninth and one eighths (Table 2, panel B,
right). Note these are lower bound estimates, because respondents employed during the survey were
not asked about their past activities.
Figure A1 (in the Annex), based on the results of rounds 2 to 4 of ESS, amended with
(comparable and available for all EU members) results from the Fourth European Working Conditions
Survey (2005/Q4), summarizes main findings on the prevalence of informal employment in the four
European regions for the whole period between 2004 and 2009 (like in all Figures hereafter, countries
in Figure A1 are not weighted by population size). Overall size of informal employment decreases
from the South to West to East to North, but the median prevalence of dependent informal
employment is higher in the East than in the West. For each of these country groups, the median
(across space and time) level of informal self-employment is higher than that of informal dependent
employment. The East and the North are much more homogeneous in terms of informal employment
than the West and the South.
2.3 Country level estimates
Table 3 presents breakdown of extended labor force by proximity to formal employment for
each of 30 European countries as of 2008-2009 (data for Austria and Italy refer to 2007 and 2006,
respectively), along with the LFS-based unemployment rate for the respective period of field work,
and the estimate of the non-employed population which was recently informally employed. Figure 1,
derived from Table 3, features current total informal employment and its two components, workers
without contracts and informal self-employed, measured as proportions of extended labor force; on top
of this, recent informal employment of currently non-employed population is shown in the same units.
Adding the ‘recent’ component significantly increases the estimated level of informality for a number
of countries (see Figure 1 for details), but leaves the ranking basically intact. In the following
discussion we refer to the current levels of informal employment, unless stated otherwise.

12
01020304050
Per
cent
South East West NorthCYGR IL IT PT ES PLUA SI BGCZSKRUROEEHULV LT IE UKATCHNLDEBEFR NODK FI SE
Labor force extended to include discouraged workersAustrian data refer to 2007; Italian data refer to 2006Due to data limitations, shares of non-employed who were recently informally employedare not perfectly comparable across countries. Average 'recent' period varies as follows:10-15 months in the South and in the West, 11-18 months in the East, 10-11 months in the NorthSource: Calculation with ESS data
2008-2009Share of Extended Labor Force Employed Informally
Non-employed who recently were informal employeesNon-employed who recently were informal self-employedInformal employeesInformal self-employed
Figure 1 Selected European countries by share of extended labor force employed
informally, 2008-2009 Notes: Informal self-employment includes all non-professional self-employed operating solely, as well as employers with 5 or fewer workers. Informal employees are those working without a contract (or those uncertain of their contract). Extended labor force includes persons which, during the reference week, were either employed or unemployed and willing to work. The latter category includes both those unemployed who were actively looking a job and those who were not actively looking for a job. See Tables 1 and 3 for details. Source: Calculation with ESS data.
All Southern European countries appear to be heavily informal, with 37% to 53% of economically
active and marginally attached population working informally in Israel, Greece, and Cyprus; in Spain,
Italy and Portugal this proportion is between 19% and 22%12. These six countries together with Ireland
(33%), the UK and Poland (22% each), and Austria (20%) constitute the ‘highly informal” part of
working Europe.
On the other extreme is Lithuania with estimated 6.4% of extended labor force working
informally, followed by Latvia, Sweden, and Hungary with 8.0% to 9.4%; Estonia, France, and
Belgium feature just slightly higher level of informality around 10%13. In other countries covered by
the study (Finland, Denmark, Norway, Germany, Netherlands, Switzerland, Romania, Russia,
12 Actual level of informality in the South might be even higher, as seasonal immigrant workers (e.g. fruit-pickers) are mostly not covered by ESS surveys. This remark applies also to France, Germany, Ireland and UK. 13 Recall that our analysis is restricted to the form of employment relationship, while envelope wages (or quasi-formal employment, see Williams, 2009) are not considered; Lithuania, Latvia, Hungary, and Estonia are among the countries with relatively high prevalence of envelope wages, see Riedmann & Fischer (2008), Williams and Renooy (2008).

13
Slovakia, Czech R., Bulgaria, Slovenia, and Ukraine) 11% to 14% of the extended labor force are
working informally.
Classifying the Baltic countries and Hungary as low-informality countries based on data
referring to the time of crisis, which was much deeper in these countries than elsewhere in the EU,
should be taken with care. Indeed, Latvia was among the top ten countries regarding informal
dependent employment in 2007, whilst Lithuania was just outside the top 10 in terms of both
dependent and total informal employment in 2005 (see Table A3). By contrast, informality rate has
been always low in Hungary and, according to most estimates, in Estonia.
As a robustness check, in Table A3 we compare ESS-based proportions of employees working
without contracts and proportions of all informally employed persons in total employment for 2004 -
2006 with similar indicators calculated from the Fourth European Working Conditions Survey14
conducted in 2005/Q4. Cyprus, Greece and Ireland, with very high rates, occupy the top three
positions in informality ranking by each of the two criteria in both surveys. Top ten countries by the
total prevalence of informal employment are also the same for both surveys; the list repeats the one
given above for 2008-2009, excluding Israel (not represented in EWCS) and adding Bulgaria15. With
regards to work without a contract, nine out of top ten countries are the same in both surveys.
Moreover, for most countries the EWCS-2005 total informality rate is very close either to both ESS-
2004 and ESS-2006 rates or at least to one of them. Situation with the dependent informality rates is
broadly similar. The exceptions in both cases include Slovenia, Norway and the Netherlands.
The coherent findings from ESS and EWCS raise concerns about the quality of field work
performed in the countries of Southern Europe, as well as UK, Ireland and Poland for the Special
Eurobarometer Survey on Undeclared Work in the European Union (Riedmann and Fischer (2008), -
according to this survey, even after adding together positive responses and non-response, the level of
informal employment in these countries is significantly lower that it follows from the ESS data
(detailed comparisons are available on request).
When recent informal employment is accounted for, the largest increases in the informality level
are found in countries where it was already high. As the result, the total level of informal employment
is [at least] around 50% in Ireland, Israel, Greece, and Cyprus, around 25% in Austria, the UK,
Poland, Portugal, and Italy, and close to 20% in Spain, Ukraine, Slovenia, and Bulgaria. Most of the
other European countries feature informality level from 14 to 16%, whilst it is 11% to 13% in France,
Hungary, Finland, Belgium, and Denmark, and just 9% in Sweden and Lithuania.
In terms of relative size of dependent and self-employed informal workforce, three groups of
countries emerge:
14 The difference between the two surveys in handling the contract question is minor: EWCS provides answer options „A temporary employment agency contract”, „An apprenticeship or other training scheme” and „Other” (which we of course do not treat as informal); on average these account for 3.2% of all responses, although this proportion varies between 4% and 6% in six countries and between 6% and 8% in the Czech R. and Greece. 15 Romania is missing from the ESS results on 2004-2006 and hence is excluded from the EWCS top ten for this comparison.

14
(i) In Cyprus, Israel, and Ireland both groups are large, but employees without contracts
dominate the informal sector (even despite seasonal migrant workers are likely to be not
covered, see footnote 12);
(ii) In Russia, Ukraine, Bulgaria, Romania, Slovenia, Latvia, the United Kingdom, and
Austria the two groups are of comparable size;
(iii) In remaining countries (i.e., Portugal, Spain, and Italy; the four Central European
countries; Estonia and Lithuania; the Nordic countries; as well as Switzerland,
Netherlands, Germany, France, and Belgium) the informal sector is dominated by the self-
employed.
The latter finding calls for a closer look, given that, according to anecdotal evidence, in
countries with more restrictive Employment Protection Legislation a large share of self-employed are
hired as „self-employed service providers” and doing work that is in every way identical to a formal
dependent worker’s. However, even if this is the case, in a survey such workers might describe their
status as „an employee without a contract” or even as „an employee with a contract” (the contract
being not an employment one though). Fortunately, ESS data allow to distinguish between ‘true self-
employed’ and ‘quasi-self-employed’, using the question „Are you allowed to decide how daily work
is organized?" (self-assessment, where 0 means „I have no influence”, and 10 means „I have complete
control”). The data do not support the hypothesis that a substantial proportion of ESS respondents
which classify themselves as informal self-employed are in fact employees. Their median self-
assessed autonomy is 10 in all countries but Portugal, where it is 9, and mean self-assessed autonomy
in all countries is well above that of formal employees. Figure 2 shows that the same is true also for
the 25th percentile of the autonomy variable, thus excluding the possibility that even a quarter of
informal self-employed are in fact dependent workers.
Allowed to decide how daily work is organised (self-assessment, p25)
0123456789
10
RO UA CZ RU HU PL SK BG LT EE LV SI SE DK FI NO GR IT PT ES IL CY IE NL AT CH DE BE FR UK
East North South West
poin
ts in
0-1
0 sc
ale
Employees with contracts Informal self-employed Employees without contracts
Figure 2 Worker autonomy: Informal self-employed vs. formal and informal employees.
2004-2009 Notes: The Figure displays the 25th percentile of the self-assessed autonomy for each of the three groups.
Source: Calculation with ESS data

15
An important finding from Table 3 and Figure 1 is that median country in the East features a
substantially higher proportion of employees without contracts than median country in the West. In
fact, in 5 out of 8 Western European countries (and in 7 out of 12 countries when the Nordic countries
are added) workers without contracts account to less than 3% of extended labor force, while among 12
Eastern European countries this is the case only for four countries, and the median is about 4%. This
provides at least some support to an ‘intuitive’ belief that there ‘should’ be more informality in the
East.
2.4 Dependent informality rates by worker and job characteristic
Table 4 reports, for each of the four European regions and for Europe as a whole, proportion of
informal employees among all employees (the dependent informality rate), broken down by gender,
age, educational attainment, origin, occupation, size of establishment, and economic activity. The
estimates refer to 2008-2009 and are non-weighted averages of country-specific estimates. Apart from
the South as a whole, Table 4 includes a separate column for Spain, Portugal, and Greece16. It appears
that in Southern Europe prevalence of work without contract is higher among females (23% vs. 19%
among males), whilst elsewhere the difference is fairly small (larger differences exist at the country
level though). Plausibly, this has to do with the fact that the share of hospitality, personal and
household services (sectors which are female-dominated and feature high informality rates) in
dependent employment is higher in the South than elsewhere.
In all parts of Europe, the lowest dependent informality rate is found among tertiary-educated
workers, whilst the highest rate is found among medium-educated in the South and among low-
educated elsewhere. Overall average is 14.5% for low-educated workers, 8.4% for medium-educated,
and 5.7% for those with higher education. Likewise, the smallest proportion of workers without
contract (5% on average, ranging from 1% in the North to 17% in the South) is found among those
holding highly-skilled non-manual occupation, whilst the highest informality rate is associated with
elementary occupations (17% on average, from 8% to 10% in the North and East, to 15% in the West
to 30% in the South). For other occupations, the overall informality rate is about 10%, ranging from
4% in the North to 6% in the East to 9% in the West to 21% in the South. To sum up, dependent
informality rate is inversely related to skills (measured in terms of either schooling or occupation).
These findings are in line with theoretical expectations outlined in Section 1 (see also Perry et al.,
2007: pp. 6, 9; Pfau-Effinger, 2009: Table 1, among others): motivation to go informal is strongest for
low-skilled, low-productive workers both on the supply side (as their alternative in the formal sector is
not much better) and on the demand side (small firms find it too costly to hire formally low-productive
workers), as well as with empirical findings from Latin America (e.g. Henley et al., 2006: Table 5) and
Italy (Boeri and Garibaldi, 2005: Table 2).
16 Recall that for Italy the latest available data refer to 2006, whilst two other Southern countries in our data, Cyprus and Israel, are small.

16
The age-informality profile is U-shaped: The informality rate is 17% among the youth, 7% for
the prime age workers, 9% for the 55-64 year olds, and 16% among those in retirement age. In the
West and (to a smaller extent) in the South, the dependent informality rate among the retirees is higher
than among the young workers, whilst it is the other way around in Eastern Europe and in the Nordic
countries (see Table 4 for details). Again, both supply and demand side explanations are readily
available. On the demand side, both the young and the elderly are likely to be among the least
demanding jobseekers, acknowledging their below-average productivity (and, in case of the young,
facing above-average unemployment rates). In addition, both groups are interested in flexible work
schedule which is often easier to achieve via informal employment. Young workers are likely to be
less concerned with and/or less informed about social security and more willing to trade it for higher
in-hand payments. For those seeking their first job, informal employment might be the most
straightforward way to gaining some work experience, thus facilitating school-to-work transition. In
countries with a strong apprenticeship culture (like Germany, Austria, France, and the UK), informal
apprenticeships might be seen as a natural complement to the formal apprenticeship system17.
On the supply side, the low productivity factor works in the same way as in the case of low-
educated workers. In addition, both the young and the elderly feature above-average quit rates, thus
making firms worry about firing costs if these workers were to be hired formally. Higher informality
among the elderly in the West and in the South might have to do with higher firing costs for older
workers, a feature which is less pronounced or weakly enforced in the East (Muravyev, 2010).
One out of five students-employees works without a contract. Except for Southern Europe,
informality among students is significantly higher than among the youth in general. In Southern and
Northern Europe, informality rate substantially is well above its average level among employees
affected by disability or chronic illness. These findings are consistent with the “informal” social
capital story outlined in Section 1.
There is a large body of literature providing robust evidence that ethnic and language minorities
face various forms of labor market disadvantages in European labor markets; see Kahanec and Zaiceva
(2009) and Kahanec, Zaiceva and Zimmermann (2010) for overview; Kahanec and Zimmermann
(eds.) (2011) for country studies. Ambrosini (2001) and Flaquer and Escobedo (2009) refer to the
availability of a high number of immigrants without work permits as one of the reasons for relatively
high share of undeclared work in Southern European countries. Say (2011) asserts that „Immigrants...
may be less aware of employment protection regulations and less likely to claim their rights, which
may create a gap between the costs for employers of hiring a native relative to hiring an immigrant”
and finds that negative effect of a strict EPL on employment and hiring rates is less pronounced for
immigrants than for natives. The same argument, however, suggests that immigrants are more likely to
accept informal jobs. Table 4 supports this hypothesis, but to a different extent depending on the
country group.
17 I thank Truman Packard for this remark.

17
In the South, one finds a classic divide: the dependent informality rate is 16% among native
majority population, whilst it varies between 24% and 37% in all other groups: local born ethnic or
linguistic minorities, second generation immigrants, as well as first generation immigrants (the highest
rate is found among immigrants from CEE and former Soviet Union; in Spain, Portugal and Greece
this rate exceeds 50%). In Eastern Europe, the picture is broadly similar: local born minorities feature
the highest dependent informality rate of about 11%, followed by second generation immigrants and
immigrants from CEE and former Soviet Union with 7%, whilst this rate is just 4% among the natives.
Moreover, in Eastern Europe, as well as in Spain, Portugal, and Israel, ethnic and linguistic minorities
are more likely to work informally also after controlling for a variety of characteristics (Table 9).
In Western Europe, the only minority group with above-average proportion of non-contracted
employees consists of immigrants from CEE and former Soviet Union: 12% of employees of this
origin works without contracts, whilst for the natives this rate is 7%. In the Nordic countries no clear
pattern emerge, probably because the sub-sample of informal immigrant employees is too small.
Table 4 also compares informality rates of immigrants depending on whether they do have an
“automatic” working right due to nationality (based on country- and year-specific rules on free
movement of labor within EU). The differences by legal status are smaller than those by geographic
origin. Somewhat surprisingly, informality rates are slightly higher among immigrants covered by the
“free movement of labor” provisions in all parts of Europe except the South. It appears that in other
parts of Europe persons not covered by the provisions are either not likely to work as non-contracted
employees or they are not captured by the ESS surveys. On the other hand, persons covered by the
provisions are more likely to move without a job in hand, and hence more likely to end up with an
informal job. The situation is strikingly different in Spain, Portugal, and Greece, where informality
rate among non-covered immigrants is twice as big as among covered ones (33.7% vs. 16.5%). After
controlling for individual characteristics and industry of employment, non-covered immigrants in
Southern and Eastern Europe are more likely to work informally than natives and, in the South, also
than covered immigrants (Table 9).
As expected, informality sharply declines with the size of establishment. Estimated across all 30
countries proportion of non-contracted employees is 16% in establishments with less than 10 workers,
8% in units with 10 to 24 workers, 5.5% in units with 25 to 99 workers, and 4% in those with 100 or
more workers. Interestingly, in the South, the informality level seems to stabilize for establishments
with 25 or more workers (see Table 4 for details). Plausibly, high concentration of informality in small
firms has to do with the fact that they are less monitored; on the other hand, as Perry et al. (2007)
argue, formality can be seen as an input in the production process for which small firms have little
need. On the other hand, it is worth noting that informality rates in medium and even large
establishments are far from being negligible. Similar findings for Latin America are reported by Perry
et al. (2007: Figure 6.1).
The following five economic activities feature highest dependent informality rates: hotels and
restaurants (20%), personal and household services (18%), construction (14%), agriculture (13%), and

18
trade18 (11%). The first four activities in this list are also found among the top five in each of the four
European regions (see Table 4 for details). This is consistent with previous research on undeclared
work (Riedmann and Fischer, 2008: p.23; Williams and Renooy, 2008: p. 9-10; Pedersen, 2003:
Figure 4.2) which has revealed construction, household and personal services, trade, and hospitality as
the most popular activities among informal workers, as well as the ones with the highest proportions
of all workers involved in undeclared work. Yet the same studies suggest that countries and European
regions might substantially differ from each other in terms of sectoral distribution of undeclared work.
For instance, Williams and Renooy (2008) report that construction activities account for only 3% of
undeclared work in Southern Europe, whilst in the Nordic countries this proportion is 27%.
However, ESS-based results, reported in Table 6 by categories similar to the ones used in
Williams and Renooy (2008), suggest a much smaller geographical variation in sectoral distribution of
informal work; in particular, the share of construction is about 10% in the South and 13% in the
North.19 On the other hand, within European regions we find substantial differences between
undeclared employees and informal self-employed. In particular, the former are much more
concentrated in education and health-related services, as well as in industry, whilst the latter – in
agriculture, and (in Eastern and Southern Europe) also in trade, auto repair, and hospitality sector.
2.5 The dynamics of informal employment
We conclude this section with a brief overview of the dynamics of informal employment. Table
5 presents changes (in % points) in estimated prevalence of informal employment and unemployment
in the extended labor force of European countries between ESS rounds: round 4 (2008-2009), round 3
(2006-2007), and round 2 (2004-2005). In most cases the changes in both dependent and own-account
informal employment are statistically insignificant and small. Between rounds 2 and 3, there have
been significant increases in the share of employees without contracts in Portugal (3.6 points),
Denmark (2.7 points), Estonia (2.0 points), and Spain (1.0 points). In Portugal and Estonia this has
been accompanied by a comparable decrease in the share of informal self-employment, whilst the
latter went up as well in Denmark and Spain. A significant decrease in total informal employment
between rounds 2 and 3 is found only in the UK (3.3 points) and Slovenia (2.6 points).
The changes between rounds 3 and 4 are of course of special interest because in all countries
most of the round 4 field work was during the early stage of crisis (2008/q4 or 2009). From a
theoretical perspective, the effect of the recession on informal dependent employment is ambiguous.
On the supply side, the workers are likely to be more willing to accept informal employment. On the
18 Including repair of motor vehicles. 19 The differences in findings between ESS and Eurobarometer survey is likely to be driven by various factors. ESS does not cover secondary jobs; moreover, employed respondents are not asked about their past activities, while the Eurobarometer questions refer to the last 12 months. The seasonal factor might play a role, too: most of the ESS field work has been conducted during autumn and winter months, while it was in the summer for the Eurobarometer. On the other hand, ESS samples are much larger, and, as mentioned above, the quality of ESS field work in the Southern Europe, as well as in Ireland and UK seems to be better.

19
demand side, there is likely to be much less work left out for outsiders, as private sector employees
across Europe have seen substantial working time reductions, and both the firms and the households
do not have money for irregular (not urgent) tasks. While firms do have strong incentives to reduce
costs via tax avoidance, they might prefer paying envelope wages to workers already on the payroll to
using unregistered workers. Yet there is an incentive to conduct as much repair and construction as
possible while informal labor is cheap, and this is likely to have a positive effect on informal self-
employment. For a more detailed discussion of relationship between informality and economic cycle
we refer to Perry et al. (2007), Bosch and Maloney (2010) and Nikolovova et al. (2010), who have
analyzed workers’ transitions between formal and informal jobs, and Bajada and Schneider (2009),
Schneider et al. (2010) and Hazans (2011c) who have studied the effect of economic growth (among
other macro factors) on the size of informal economy and prevalence of informal employment.
Inspection of Table 5 reveals that in countries where a significant change in informal dependent
employment has occurred between 2006-2007 and 2008-2009, this change was negative: 6.9 points in
Ireland, 5.4 points in Cyprus, 3.9 points in Denmark, 2.4 points in Bulgaria and Latvia, 1.7 points in
Netherlands; the only exception was Slovenia with a significant increase by 2.7 points. On the other
hand, informal self-employment increased significantly in Poland, Estonia, and Netherlands, whilst in
Portugal, Ukraine, Slovenia, Czech R., Slovakia, the UK, and France a (statistically insignificant)
increase by 1 to 2 percentage points has been registered; a substantial (by 2 points) decline in the
prevalence of informal self-employment is found only in Norway and Switzerland.
Figure 3 which refers to 2004-2009 (and thus covers both growth and recession episodes)
suggests a negative association between the change in dependent informality rate and the change in the
rate of joblessness within extended labor force. First, the whole scatter diagram is consistent with a
downward sloping curve (summarizing both within-countries and between-countries variation in the
two indicators). Second, almost all segments connecting the points corresponding to the same country
are downward sloping, suggesting that within countries unemployment and informality tend to move
in opposite directions (the UK, Hungary, and the Netherlands seem to violate this pattern). Finally, 47
out of 48 observations lie outside the positive quadrant – in other words, there are virtually no cases
when the rate of dependent informality and unemployment go up simultaneously. This does not
necessarily contradict to the ‘safety net story’ of displaced workers switching to self-employment
(Harris and Todaro, 1970).

20
CYGR
PTES
PL
UA
SI
BG
CZ
SK
RU
EE
HU
LV
IE
UK AT
CHNLDEBE
FR
NODK
FISE
RO
LT-5
05
10C
hang
e in
rate
of u
nem
ploy
men
t and
dis
cour
agem
ent,
% p
oint
s
-6 -4 -2 0 2 4Change in informality rate, % points
Informality rate excludes self-employedConnected points correspond to the same country, with the country label at the earlier pointMissing ESS data of round 2 (BG, LV, RO and FR) or round 3 (CZ, LT) replacedwith informality rate from the Fourth European Working Condition Survey (2005/Q4)Single points, for countries observed only twice, show 2007 vs. 2005 (AT),2008 vs. 2006 (CY and RU), 2008 vs. 2005 (RO), 2009 vs. 2005 (GR and LT)Base: Labor Force Extended to Include Discouraged Workers
ESS rounds 3 (2006-2007) vs. 2 (2004-2005); 4 (2008-2009) vs. 3(2006-200Within-country changes in unemployment and informality rates
Figure 3 Change in unemployment and discouragement vs. change in informality rate
Source: Calculation with ESS, EWCS and EU LFS data
3 Exclusion factors
In this section we compare informal and formal workers in terms of factors which could
potentially exclude a worker from the formal sector: long-term unemployment experience and
perceived discrimination20, thus contributing to the “exit vs. exclusion” literature about prevailing
reasons for working informally (see Maloney, 1999; Maloney, 2004; Djankov et al., 2003; Hanousek
and Palda, 2003; Perry et al. 2007, Williams and Renooy, 2008; Loayza, Servén and Sugawara, 2009;
Pfau-Effinger, 2009; Williams, 2009; Schneider, Buehn and Montenegro, 2010). Although
heterogeneous nature of self-employment is now well understood in principle, the empirical base in
European context remains scarce.
Long-term unemployment experience. Prevalence of long-term unemployment experience among
informal employees is much higher than among their formal counterparts (or among informal self-
employed) in most countries (see Figure 4; exceptions include Hungary, Slovakia, Czech R., Norway,
Greece, and Cyprus). In 14 countries one tenth to one fifth of shadow employees have been
unemployed for more than 12 months during their life, while in Latvia, Belgium, Bulgaria,
Netherlands, UK, Portugal, and Italy this proportion ranges from one quarter to one third. This suggest 20 Key characteristics of informal and formal workers are compared in Hazans (2011a: Section 3.1).

21
that substantial part of the informal wage earners have been forced into informal sector by being
rejected in the formal sector.
0
5
10
15
20
25
30
35
40
BG LV UA RO EE SI RU HU SK PL CZ FI SE DK NO IT PT ES IL GR CY UK NL BE DE FR AT IE CH
East North South West
% w
ith lo
ngte
rm u
nem
ploy
men
t exp
erie
nce
Employees with contracts Employees without contracts Informal self-employed
Figure 4 Long-term unemployment experience of formal and informal workers, by country. 2004-2009
Note: The sample size of employees without contracts is less than 30 for IT, SE and FI; between 50 and 90 for CZ, RO, SK, HU, EE, BE, FR, DE and CH; between 100 and 745 for other countries.
Source: Calculation with ESS data.
Perceived discrimination. Figure 5 shows the percentage of formally employed workers,
informally employed and informally self-employed who report belonging to a group that suffers from
discrimination. The ESS question is phrased “Would you describe yourself as being a member of a
group that is discriminated against in this country?”, and specifies discrimination on the grounds of
race, nationality, religion, language, ethnicity, age, gender, sexuality and disability. Responses indicate
that in most countries a significantly higher share of informal employees consider themselves to be
part of a group that faces discrimination than is observed among formal employees and (with
exception of Russia) informal self-employed. These differences appear especially large in Spain,
Greece and Finland. These findings support the hypothesis that exclusion or poverty escape motive
plays an important role in the way how employees end up working without a contract.
Table 7 provides evidence that within European regions the differences in perceived discrimination
between informal and formal employees are statistically significant (at the country level the relevant
sub-samples are too small).

22
0
5
10
15
20
25
LV BG RU SI EE SK PL CZ HU RO UA FI SE NO DK ES GR IL PT CY IT FR UK DE NL BE CH AT IE
East North South West
% b
elon
ging
to a
dis
crim
inat
ed g
roup
Employees with contracts Informal self-employed Employees without contracts
Figure 5 Perceived discrimination among formal and informal workers, by country. 2004-2009
Note: See Note to Figure 4. Source: Calculation with ESS data
4 Are informal workers poorer than the formal ones?
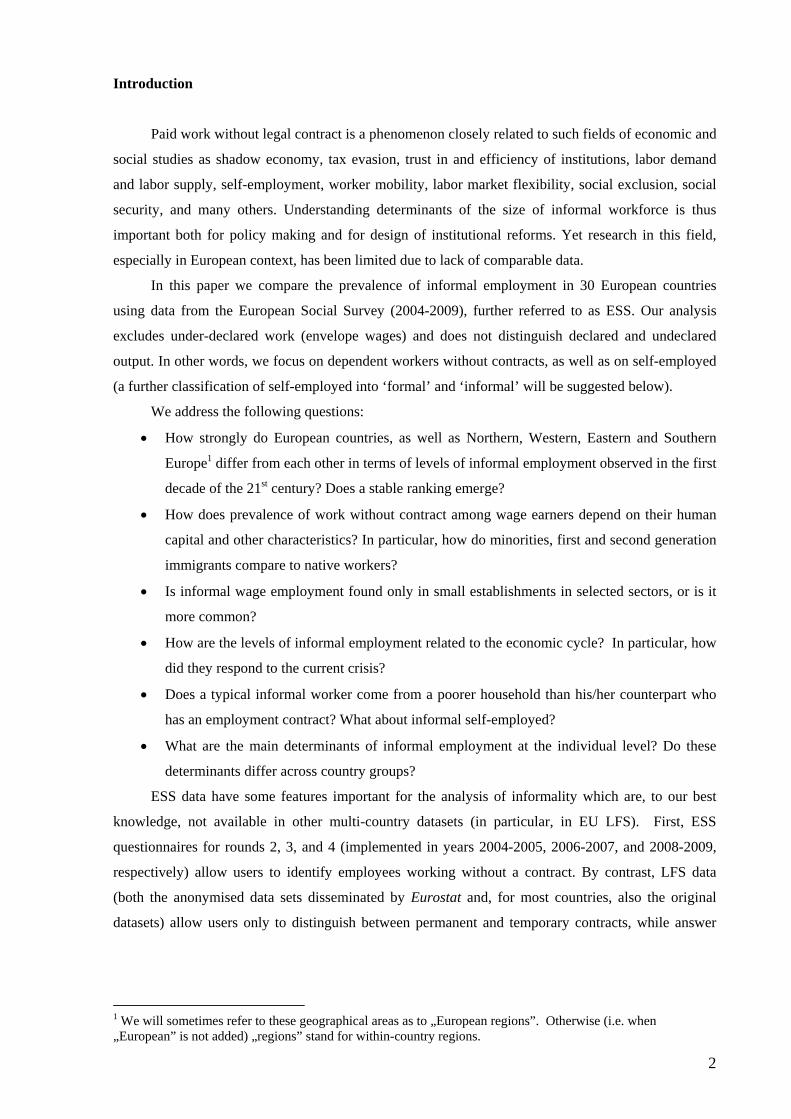
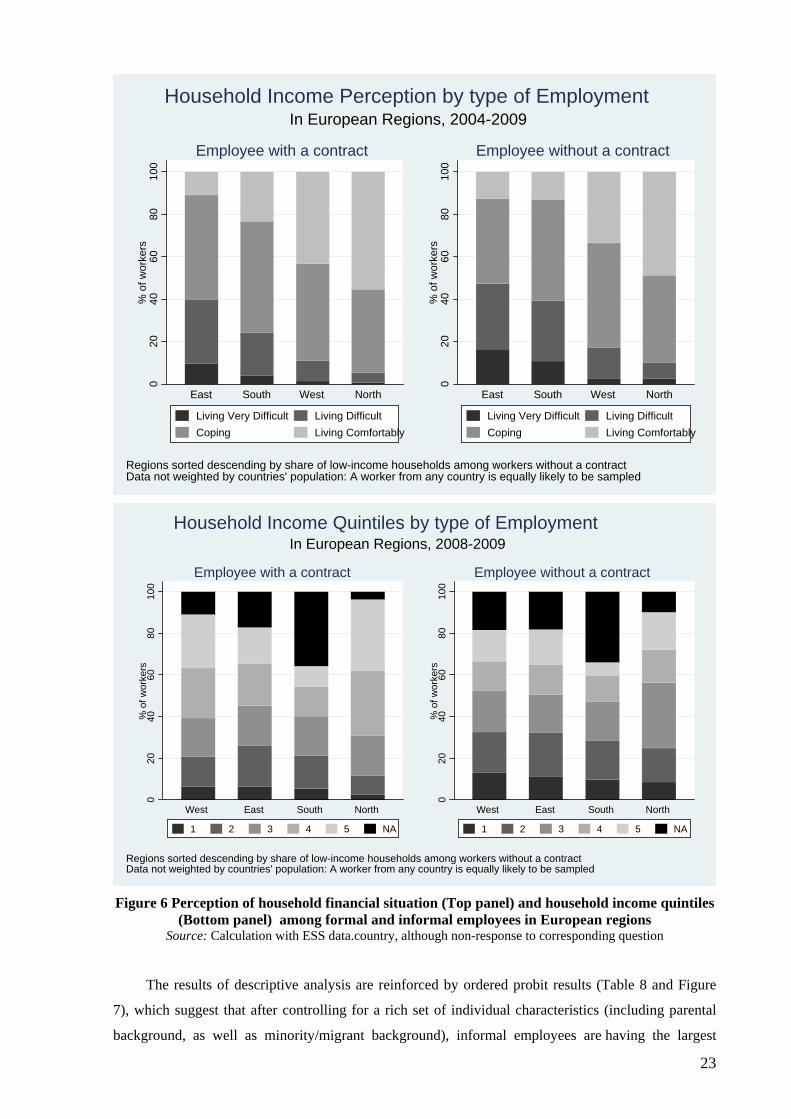
Figure 6 (top panel) compares perception of household financial situation by formal and informal
employees. In both the Eastern and Southern Europe, the proportion of those seeing their situation as
‘very difficult’ is much higher among non-contracted workers: 19% vs. 10% in the East and 11% vs.
4% in the South21. The situation is similar when respondents describing their situation as ‘difficult’ or
‘very difficult’ are taken together: This category accounts for 53% of informal employees and just
41% of formal employees in the East, whilst corresponding figures for the South are 39% vs. 24%. By
contrast, in Western Europe and especially in the Nordic countries, distributions of formal and
informal employees among four household income perception categories are rather similar.
The data mentioned above refer to the period between 2004 and 2009. For 2008-2009, round 4 of
ESS provides also information on household income decile group within the (unlike the question on
income perception) was quite substantial. Figure 6 (bottom panel) summarizes this information (in
quintile rather than decile form) by European region, separately for contracted and non-contracted
employees. In Eastern and Western Europe, 11% and 13%, respectively, of non-contracted employees
and just 6.5% of contracted employees live in the bottom quintile households. In Southern Europe
these proportions are 9.9% vs. 5.4%, whilst in Northern Europe – 8.6% vs. 2.5%. In other words,
while informal workers disproportionally suffer from absolute poverty only in the East and in the
South, the incidence of relative poverty among informal workers in much larger than among their
formal counterparts in all parts of Europe.
21 These (rounded) figures are obtained after excluding non-response which for the question at hand was quite small. Recall that countries are not weighted by population size.
23
020
4060
8010
0%
of w
orke
rs
East South West North
Employee with a contract
Living Very Difficult Living DifficultCoping Living Comfortably
020
4060
8010
0%
of w
orke
rs
East South West North
Employee without a contract
Living Very Difficult Living DifficultCoping Living Comfortably
Regions sorted descending by share of low-income households among workers without a contractData not weighted by countries' population: A worker from any country is equally likely to be sampled
In European Regions, 2004-2009Household Income Perception by type of Employment
020
4060
8010
0%
of w
orke
rs
West East South North
Employee with a contract
1 2 3 4 5 NA
020
4060
8010
0%
of w
orke
rs
West East South North
Employee without a contract
1 2 3 4 5 NA
Regions sorted descending by share of low-income households among workers without a contractData not weighted by countries' population: A worker from any country is equally likely to be sampled
In European Regions, 2008-2009Household Income Quintiles by type of Employment
Figure 6 Perception of household financial situation (Top panel) and household income quintiles
(Bottom panel) among formal and informal employees in European regions Source: Calculation with ESS data.country, although non-response to corresponding question
The results of descriptive analysis are reinforced by ordered probit results (Table 8 and Figure
7), which suggest that after controlling for a rich set of individual characteristics (including parental
background, as well as minority/migrant background), informal employees are having the largest

24
financial difficulties among all categories of employed population (yet they fare much better than the
unemployed and discouraged).
The situation of informal self-employed varies by country group: in the UK, Ireland, Austria
and Netherlands, they are as well off as formal employees; in France, Belgium, Germany, and
Switzerland, as well as in the Nordic countries and in Southern Europe, they are better off than
otherwise similar formal employees, but not by much; and in Eastern Europe they are substantially
better off22.
-12-10-8-6-4-202468
Wes
t-1
Wes
t-2
Eas
t
Sou
th
Nor
th
Wes
t-1
Wes
t-2
Eas
t
Sou
th
Nor
th
Informal dependent employees Informal self-employed
% p
oint
s ComfortableCopingDifficultVery difficult
Figure 7 Impact of employment status on perceived household financial situation
(ordered probit marginal effects vs. formal employees) Source: Calculation with ESS data (based on model reported in Table 8).
Note that these results are not subject to selection bias because non-response to the question
on self-assessment of household’s financial situation is quite small, and non-employed population is
included in the sample. Yet we cannot claim that the relationship is causal because the same
unobserved factors can influence propensity to work informally and propensity to experience financial
hardship, although presence of parental background controls mitigates this problem.
Our findings are qualitatively similar to those by Perry et al. (2007: Chapter 3) on Latin America:
in Argentina, informal salaried workers have substantially higher income-poverty and self-rated
poverty rates than formal salaried workers; in Dominican Republic, the same is true for income-
poverty and dissatisfaction with employee benefits (but not for self-rated poverty and dissatisfaction
with earnings); and in Colombia, for dissatisfaction with both earnings and employee benefits.
Moreover, earnings of informal employees are, on average, by more than 40% lower than those of
formal workers in Bolivia and Dominican Republic and by more than 60% in Argentina. These
earnings and welfare gaps remain significant after controlling for worker characteristics in some cases
22 In this analysis, we do not account for coordinated labor supply decisions within household. This awaits a separate study (there are, however, some data limitations).

25
but become insignificant in others. In most cases, welfare and/or earnings disadvantage of informal
self-employed is either smaller or absent (or disappears after controlling for characteristics).
5 Determinants of work without a contract
In this section, to test empirically the predictions of the model outlined in Section 1, we present
the results of econometric analysis of individual determinants of work without a contract among
employees, ignoring the effects of selection into dependent employment. Thus, we are modeling the
“choice” between formal and informal dependent employment, once the worker has, for the given
period, chosen paid work over self-employment or non-employment. Note that the potential selection
bias is mitigated by presence of parental background controls which proxy for unobserved ability.
The results are presented in Table 9 separately for seven country groups which appear to be
homogenous with respect to the main effects23:
(i) East-1: Poland, the Czech R, Slovakia, Estonia, Latvia, Lithuania, Russia, Ukraine, and
Bulgaria;
(ii) East-2: Hungary, Romania and Slovenia;
(iii) North: Sweden, Norway, Finland and Denmark;
(iv) West-1: the Western European countries with high informality level (Ireland, UK,
Austria), joined by the Netherlands, where the direction of the main effects appears to be
largely similar to the ones found in the other three countries, and the legal requirements on
employee contracts are similar to those in the UK and Ireland (see Table A1 in the
Annex);
(v) West-2: Germany, Switzerland, France, and Belgium, which feature broadly similar level
and structure of informal employment (let aside being German and/or French-speaking);
(vi) South-1: Spain, Portugal and Israel;
(vii) South-2: Italy, Greece and Cyprus.
The models are mixed-effects logits (see Train, 2003; Greene, 2008: pp. 851-852) with country
and year fixed effects (capturing the macro factors) and region-level random effects, capturing region-
specific differences in economic development and/or in social norms. Here “regions” are NUTS level
1 for Germany, France, the UK and Spain; NUTS level 3 for the Baltic countries, the Netherlands,
Bulgaria and Slovenia; and NUTS level 2 for remaining countries, except for Russia (10 federal
regions) and Ukraine (26 “oblast’s” surrounding largest cities).
Except for Nordic countries, Hungary, Romania and Slovenia, we have found a substantial
within-country regional variation in informality: estimated standard deviations of the random effects
are significant at 1% level in East-1, West-1, South-1 and South-2, and significant at 5% level in
23 Single-country models have been estimated and compared as a preliminary stage of analysis.

26
West-2; the [conservative] LR tests comparing estimated models with the ones without random effects
are also highly significant in East-1, West-1, South-1 and South-2, and significant at 11% level in
West-2.
For East-2 and North, where informality differences across regions are not large enough, we
present models where region-level random effects are integrated over the sample, i.e. population-
averaged models estimated by the Generalized Estimating Equations (GEE) method (see Liang and
Zeger 1986)24.
The results are consistent with the predictions of the model outlined in Section 1, as well as with
the descriptive statistics discussed in Sections 2 and 3. In all country groups, the propensity to work
without a contract is inversely related to education level, although the patterns and the strength of this
effect varies by country group. Students are much more likely to work informally than otherwise
similar other workers. In four out of seven country groups, the same holds also for workers with a
disability or a chronic illness. Even after controlling for being a student, the age-informality profile is
U-shaped, with the minimum ranging between 37 and 48 years, depending on country group. The only
exception is the South-1 group (Spain, Portugal, and Israel), where the minimum is at 21 years of age
among non-students (and at 27 years if being a student is not controlled for). Recall that both the
young and the elderly, as well as persons with permanent health problems, apart from lower-than-
average productivity, are likely to have a source of non-labor income, to be less concerned with the
job security, to have rather volatile preferred number of hours worked, and to place a high value on
flexible work schedule. Moreover, the students, the pensioners and the disabled, by the group
belonging, are likely to have large informal social capital and are more likely than others to receive
informal job offers.
After accounting for the sector of employment, the gender effect varies by country group
(plausibly, reflecting the differences in informality traditions across countries). In Eastern Europe
(except Romania and Slovenia), female workers are less likely to be informal than otherwise similar
male workers; in Nordic countries this is true only for non-single females. In Belgium and France, we
have not found a significant gender effect, whilst in the rest of Western Europe, as well as in Southern
Europe female workers are more likely to work without a contract than their male counterparts (in
Greece, Cyprus and Italy this applies only to childless females).
In Eastern Europe, as well as in Israel, workers with either ethnic minority or immigrant
background have a significantly higher propensity to work without a contract than otherwise similar
native workers25. In Eastern Europe, this effect is less pronounced for those with only one parent being
immigrant, as well as for immigrants from EU countries. In Spain and Portugal, all immigrants, both
from EU and non-EU countries, face a substantially higher risk of informality than native workers (the
24 For the other five country groups, the marginal effects from population-averaged logit estimates are similar to the ones presented in Table 9. 25 This result does not apply to Hungary, Romania, and Slovenia. However, at least for the former two countries, this might be due to data limitations: It is well documented (see e.g. Kahanec et al., 2010; Kahanec and Zimmermann, 2011), that informal employment is common among Roma population across Eastern Europe. Yet this minority group is severely under-represented in ESS samples for Hungary and Romania.

27
marginal effect is 13 to 15 percentage points); however, this is not the case for second generation
immigrants. In Italy, Greece, and Cyprus we found a significantly higher informality risk only for
immigrants not covered by the free movement of labor provisions (the marginal effect is 21 percentage
point), as well as for „mixed” second generation immigrants (13 percentage points). With regards to
Italy this result should be interpreted carefully because the Italian data cover only year 2006, and the
sub-sample of informal employees is pretty small.
In the UK, Ireland, Austria, and the Netherlands, immigrants not covered by the free movement
of labor provisions constitute the only group among population with immigrant or minority
background featuring a significant informality effect (5.6 percentage points above native workers). It
is worth noting that belonging to this group is clearly an exogenous variable – unlike having an
individual work permit.
Remarkably, in Nordic countries, as well as in Germany, Switzerland, France and Belgium,
none of the minority or immigrant groups, after controlling for other observable characteristics,
features a higher informality rate than the native employees. See, however, Hazans (2011b; 2011c) for
a simultaneous analysis of informal dependent employment, informal self-employment,
unemployment and inactivity.
In Eastern Europe (but not elsewhere), workers who are return migrants are more likely to be
employed informally. This is consistent with the idea that a substantial part (although not necessarily a
majority) of return migrants might be “negatively selected” out of home-country’s labor force, and
their return is an evidence of not being successful abroad as well. It is enough if the proportion of such
low-productivity workers among return migrants would be substantially higher than the informality
rate among stayers, which is about 5% in the Eastern Europe, and such a situation is quite a likely
outcome; Hazans (2008) shows that about 25% of return migrants are negatively selected.
It is worth mentioning that some of the results obtained are similar to those by Jonasson (2011)
who studied determinants of informality in urban labor markets of Brazil using a probit model. This
concerns the negative education effect, the U-shaped age-informality profile, and the positive effects
of being an immigrant (Jonasson controls for a rural-urban immigrant) or disabled.
The results presented in this section change very little when the models control also for
individual satisfaction with the government (measured in 0-10 scale), see Hazans (2011a).
6 Conclusion In this paper we have compared the prevalence of informal employment in 30 European
countries using data from the European Social Survey. Overall size of informal employment decreases
from the South to West to East to North, but the median prevalence of dependent informal
employment is higher in the East than in the West. Yet there is a strong heterogeneity within these
geographical areas. In particular, Western Europe is split into highly informal part (Ireland, the UK,
and Austria) on one hand and the continental part (without Austria), where work without contract is
quite rare, although informal self-employment is more prevalent than in most of Eastern Europe. We

28
have found a substantial within-country regional variation in informality in all countries except for
Nordic countries, Hungary, Romania and Slovenia.
In all parts of Europe, the dependent informality rate is inversely related to skills (measured in
terms of either schooling or occupation). The low-educated, the young (especially students), the
elderly, and persons with permanent health problems are more likely to work informally, other things
equal.
Both in Southern and in Western Europe, the highest dependent informality rate is found
among immigrants from CEE and former Soviet Union, whilst in Eastern Europe this group is second
after local born minorities without immigrant background. In Southern Europe (especially in Spain,
Portugal, and Greece) immigrants not covered by the “free movement of labor” provisions are more
likely to work without contract than both natives and covered immigrants. Both in Eastern and
Southern Europe, as well as in highly informal part of Western Europe, these not covered immigrants
have significantly higher propensity to work without contracts also after controlling for individual
characteristics.
Our findings lend support to theoretical arguments that apart from low productivity,
informality drivers include “informal” social capital, low value placed on job security, and preference
for flexible working time and/or substantial volatility of desired working hours.
We provide evidence that exclusion and discrimination play important role in pushing
employees into informality, whilst this seems not to be the case for informal self-employed. Both on
average and after controlling for a rich set of individual characteristics, informal employees in all parts
of Europe are having the largest financial difficulties among all categories of employed population
(yet they fare much better than the unemployed and discouraged), whilst informal self-employed are at
least as well off as formal employees.
References
Ambrosini, M. (2001). The role of immigrants in the Italian labour market. International Migration,
39 (3): 61–83.
Basu, A.K., N. H. Chau and R. Kahbur (2011). Contractual dualism, market power and informality.
IZA Discussion Paper No. 5845.
Bernabè, S. (2008). Measuring Informal Employment in Transition Countries. University of Leuven,
mimeo
Boeri, T. and P. Garibaldi (2005). Shadow Sorting, in C. Pissarides and J. Frenkel (eds), NBER
Macroeconomics Annual, MIT Press, Cambridge, MA, 2005.
Boeri, T., P. Garibaldi and M. Ribeiro (2011). The lighthouse effect and beyond. Review of
Income and Wealth, 57: S54–S78.
Bosch, M., E. Goni and W. Maloney (2007). The Determinants of Rising Informality in Brazil:
Evidence from Gross Worker Flows. World Bank Policy Research Working Paper No. 4375.

29
Bosch, M., and W. Maloney (2010). Comparative Analysis of Labor Market Dynamics Using Markov
Processes: An Application to Informality. Labour Economics 17(4): 621-631.
De Paula, Á. and J. A. Scheinkman (2011). The informal sector: An equilibrium model and some
empirical evidence from Brazil. Review of Income and Wealth, 57: S8–S26.
Djankov S., I. Lieberman, J. Mukherjee and T. Nenova (2003). Going Informal: Benefits and Costs.
In B. Belev (ed.) “The Informal Economy in the EU Accession Countries: Size, Scope, Trends
and Challenges to the Process of EU Enlargement”. Sofia: CSD: 63-80.
EURES - the European Job Mobility Portal (2011). Living & Working.
http://ec.europa.eu/eures/main.jsp?acro=lw&lang=en&catId=490&parentId=0
European Foundation for the Improvement of Living and Working Conditions (2007). European
Working Conditions Survey, 2005 [computer file]. Colchester, Essex: UK Data Archive
[distributor], May 2007. SN: 5639
European Social Survey (2004-2009). Data files: Round 2 (edition 3.2), Round 3 (edition 3.3), Round
4 (edition 4.0). Norwegian Social Science Data Services.
Feld, L. P. and F. Schneider (2010). Survey on the Shadow Economy and Undeclared Earnings in
OECD Countries. German Economic Review 11(2): 109–149
Fialova, K. and O. Schneider (2011). Labor Institutions and their Impact on Shadow Economies in
Europe. Background paper for “In from the Shadow: Integrating Europe’s Informal Labor”
World Bank, Washington DC, mimeo
Flaquer, L. and A. Escobedo (2009). The metamorphosis of informal work in Spain: family solidarity,
female immigration and development of social rights’. In B. Pfau-Effinger, L. Flaquer and P. H.
Jensen (eds.), Formal and Informal Work in Europe. The Hidden Work Regime. London, New
York: Routledge, pp. 143–62.
Frey, B. S. and H. Weck-Hanneman (1984). The Hidden Economy as an “Unobserved” Variable.
European Economic Review 26(1): 33-53.
Greene, W. H. (2008). Econometric Analysis. 6th ed. Upper Saddle River, NJ: Prentice–Hall.
Hanousek, J. and F. Palda (2003). Why People Evade Taxes in the Czech and Slovak Republics:
A Tale of Twins. In B. Belev (ed.) The Informal Economy in the EU Accession Countries: Size,
Scope, Trends and Challenges to the Process of EU Enlargement. Sofia: CSD: 139-174.
Harris, J. and M. Todaro (1970). Migration, Unemployment, and Development: A Two-
Sector Analysis. American Economic Review, 60(1):126-42.
Hazans, M. (2008). Post-enlargement return migrants’ earnings premium: Evidence from Latvia.
EALE 2008 paper No. 541, 2008. Available at SSRN: http://ssrn.com/abstract=1269728
Hazans, M. (2011a). Informal workers across Europe: Evidence from 30 European countries.
Background paper for “In from the Shadow: Integrating Europe’s Informal Labor”. World
Bank: Washington DC, mimeo: http://www.iza.org/conference_files/InfoETE2011/hazans_m1142.pdf
Hazans, M. (2011b). Determinants of Employment Status and (In)Formality: A nested logit approach
(forthcoming in IZA Discussion Papers).

30
Hazans, M. (2011c). What Explains Prevalence of Informal Employment in European Countries: The
Role of Labor Institutions, Governance, Immigrants, and Growth.
IZA Discussion Paper No. 5872.
Heckman, J., and G. Sedlacek (1985). Heterogeneity, aggregation, and market wage functions: An
empirical model of self-selection in the labor market. Journal of Political Economy 93 (6):
1077–1125.
Henley A., G. R. Arabsheibani and F. G. Carneiro (2006). On Defining and Measuring the Informal
Sector. World Bank Policy Research Working Paper 3866
Hussmanns, R. (2004). Measuring the Informal Economy: From Employment in the Informal Sector to
Informal Employment, ILO Bureau of Statistics Working Paper No. 53.
ILO (2002). Women and Men in the Informal Economy: A Statistical Picture. Geneva: ILO.
ILO (2003): Guidelines concerning a statistical definition of informal employment, in: Seventeenth
International Conference of Labour Statisticians, Report of the Conference; Doc.
ICLS/17/2003/R. Geneva: ILO
Jonasson, E. (2011). Government Effectiveness and Regional Variation in Informal Employment.
http://www.iza.org/conference_files/InfoETE2011/jonasson_e6968.pdf (forthcoming
in Journal of Development Studies).
Kahanec, M. and A. Zaiceva (2009). Labor market outcomes of immigrants and non-citizens in the
EU: An East-West comparison. International Journal of Manpower, 30 (1/2), 97−115.
Kahanec, M., A. Zaiceva and K. F. Zimmermann (2010). Ethnic Minorities in the European Union:
An Overview. IZA Discussion Paper No. 5397.
Kahanec, M. and K. F. Zimmermann (eds) (2011). Ethnic diversity in European labor markets:
Challenges and solutions, Cheltenham: Edward Elgar Publishing (forthcoming).
Liang, K.-Y. and S. L. Zeger (1986). Longitudinal data analysis using generalized linear models.
Biometrika 73 (1): 13–22.
Loayza, N.V., L. Servén and N. Sugawara (2009). Informality in Latin America and the Caribbean.
World Bank Policy Research Working Paper No. 4888.
Maloney, W. (1999). Does Informality Imply Segmentation in Urban Labor Markets? Evidence from
Sectoral Transitions in Mexico. The World Bank Economic Review, 13 (2): 275 – 302.
Maloney, W. F. (2004). Informality revisited. World Development, 32 (7): 1159-1178.
Muravyev, A. (2010). Evolution of Employment Protection Legislation in the USSR, CIS and Baltic
States, 1985-2009, IZA Discussion Paper No. 5365.
Nikolovova, P., F. Pertold and M. Vozar (2010). Informal Economy in the Czech and Slovak
Republics: Microeconometric Analysis of Labor Force Transitions. Background paper for “In
from the Shadow: Integrating Europe’s Informal Labor”. World Bank, Washington DC,
mimeo.
Novinite (2011). 1/5 of Bulgarian Employees Work in Gray Economy.
http://www.novinite.com/view_news.php?id=125106

31
OECD (2009). Is Informal Normal? Towards More and Better Jobs. Paris: OECD.
Packard, T. G. (2000) “Do Workers in Chile Choose Informal Employment? A Dynamic Analysis of
Sector Choice”. Washington D.C.: The World Bank (mimeo).
Pedersen, S. (2003). The Shadow Economy in Germany, Great Britain and Scandinavia:
A Measurement Based on Questionnaire Surveys. Copenhagen: The Rockwool Foundation
Research Unit, Study no. 10.
Perry, G., W. Maloney, O. Arias, P. Fajnzylber, A. Mason and J. Saavedra-Chanduvi (2007).
Informality: Exit and Exclusion. Washington D.C.: The World Bank
Pfau-Effinger, B. (2009). Varieties of Undeclared Work in European Societies. British Journal of
Industrial Relations 47 (1): 79–99
Pissarides, C. (2000). Equilibrium unemployment theory. MIT Press.
Riedmann, A. and G. Fischer (2008). Undeclared work in the European Union. Special Eurobarometer
284: Report.
Schneider, F. (2005). Shadow Economies around the World: What Do We Really Know. European
Journal of Political Economy 21, 598–642.
Schneider F., Buehn A., Montenegro C.E. (2010). Shadow Economies All over the World: New
Estimates for 162 Countries from 1999 to 2007 (Revised Version). World Bank Policy Research
Working Paper No. 5356.
Say, F. (2011), Does employment protection help immigrants? Evidence from European labour
markets. Labour Economics (forthcoming, doi:10.1016/j.labeco.2011.01.006 )
Slonimczyk, F. (2011). The Effect of Taxation on Informal Employment: Evidence from the
Russian Flat Tax Reform. Moscow: Higher School of Economics, mimeo
http://www.iza.org/conference_files/InfoETE2011/slonimczyk_f6969.pdf
Torgler, B. (2007). Tax Compliance and Tax Morale: A Theoretical and Empirical Analysis,
Cheltenham, UK: Edward Elgar
Torgler, B. (2010). Tax Morale, Eastern Europe and European Enlargement. Background paper for In
from the Shadow: Integrating Europe’s Informal Labor, a World Bank regional report on the
informal sector in Central, Southern Europe and the Baltic countries (Task number P112988).
Train, K. (2003). Discrete Choice Methods with Simulations, Cambridge: Cambridge University Press.
Williams, C. C. (2009). Formal and Informal Employment in Europe: Beyond Dualistic
Representations. European Urban and Regional Studies 16(2): 147–159
Williams, C. C. and P. Renooy (2008). Measures to Tackle Undeclared Work in the European Union.
Dublin: European Foundation for the Improvement of Living and Working Conditions.
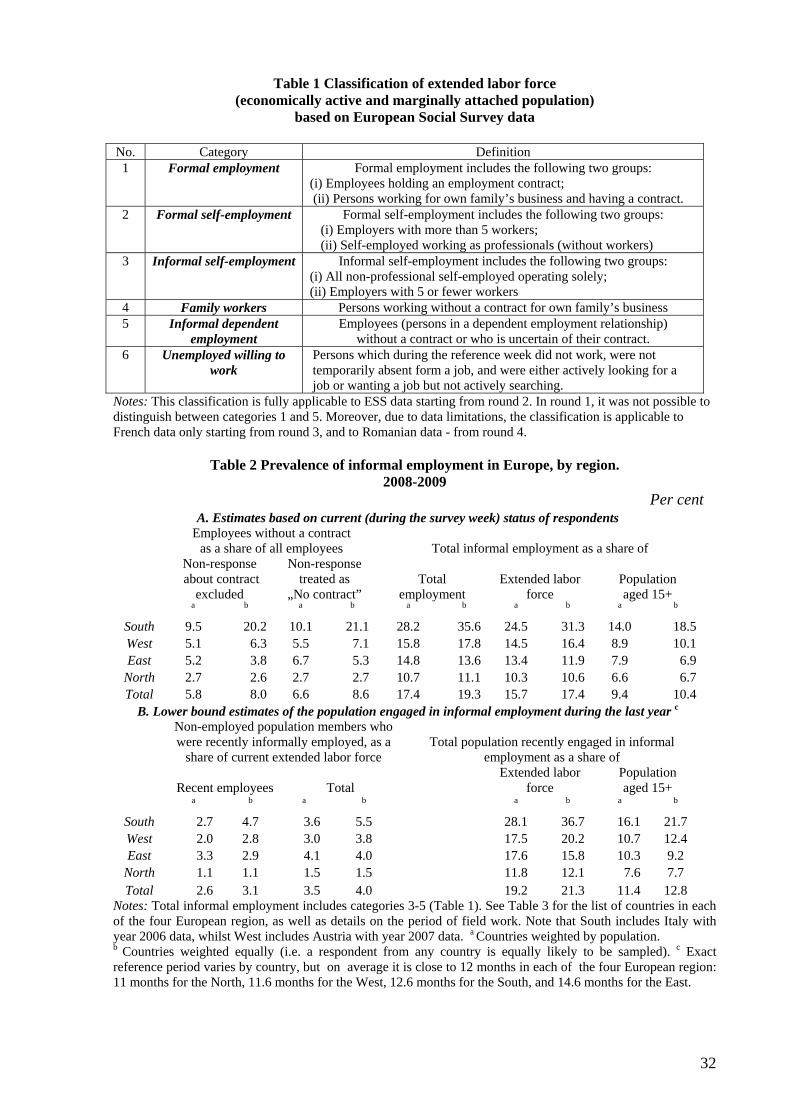
32
Table 1 Classification of extended labor force (economically active and marginally attached population)
based on European Social Survey data
No. Category Definition 1 Formal employment Formal employment includes the following two groups:
(i) Employees holding an employment contract; (ii) Persons working for own family’s business and having a contract.
2 Formal self-employment Formal self-employment includes the following two groups: (i) Employers with more than 5 workers; (ii) Self-employed working as professionals (without workers)
3 Informal self-employment Informal self-employment includes the following two groups: (i) All non-professional self-employed operating solely; (ii) Employers with 5 or fewer workers
4 Family workers Persons working without a contract for own family’s business 5 Informal dependent
employment Employees (persons in a dependent employment relationship)
without a contract or who is uncertain of their contract. 6 Unemployed willing to
work Persons which during the reference week did not work, were not temporarily absent form a job, and were either actively looking for a job or wanting a job but not actively searching.
Notes: This classification is fully applicable to ESS data starting from round 2. In round 1, it was not possible to distinguish between categories 1 and 5. Moreover, due to data limitations, the classification is applicable to French data only starting from round 3, and to Romanian data - from round 4.
Table 2 Prevalence of informal employment in Europe, by region.
2008-2009 Per cent
A. Estimates based on current (during the survey week) status of respondents Employees without a contract
as a share of all employees Total informal employment as a share of Non-response about contract
excluded
Non-response treated as
„No contract” Total
employment Extended labor
force Population aged 15+
a b a b a b a b a b South 9.5 20.2 10.1 21.1 28.2 35.6 24.5 31.3 14.0 18.5 West 5.1 6.3 5.5 7.1 15.8 17.8 14.5 16.4 8.9 10.1 East 5.2 3.8 6.7 5.3 14.8 13.6 13.4 11.9 7.9 6.9
North 2.7 2.6 2.7 2.7 10.7 11.1 10.3 10.6 6.6 6.7 Total 5.8 8.0 6.6 8.6 17.4 19.3 15.7 17.4 9.4 10.4
B. Lower bound estimates of the population engaged in informal employment during the last year c
Non-employed population members who were recently informally employed, as a
share of current extended labor force Total population recently engaged in informal
employment as a share of
Recent employees Total Extended labor
force Population aged 15+
a b a b a b a b South 2.7 4.7 3.6 5.5 28.1 36.7 16.1 21.7 West 2.0 2.8 3.0 3.8 17.5 20.2 10.7 12.4 East 3.3 2.9 4.1 4.0 17.6 15.8 10.3 9.2
North 1.1 1.1 1.5 1.5 11.8 12.1 7.6 7.7 Total 2.6 3.1 3.5 4.0 19.2 21.3 11.4 12.8
Notes: Total informal employment includes categories 3-5 (Table 1). See Table 3 for the list of countries in each of the four European region, as well as details on the period of field work. Note that South includes Italy with year 2006 data, whilst West includes Austria with year 2007 data. a Countries weighted by population. b Countries weighted equally (i.e. a respondent from any country is equally likely to be sampled). c Exact reference period varies by country, but on average it is close to 12 months in each of the four European region: 11 months for the North, 11.6 months for the West, 12.6 months for the South, and 14.6 months for the East.

33
Table 3 Extended labor force by proximity to formal employment. Selected European countries, 2008-2009
% Formal
Employment Informal Employment Unemployed
Willing to Work
Country Core
Period b
Dep
ende
nt
employ
men
t
Self‐
employ
men
t
TOTA
L
Dep
ende
nt
employ
men
t
Self‐
employ
men
t
Family
TOTA
L
Seeking
work
Not seeking
work
TOTA
L LFS‐ba
sed
unem
ploy
men
t rate
Non
‐employ
ed who
recently were
inform
ally employ
ed c
Southern Europe Cyprus 2008/q4 38.8 4.3 43.1 35.2 14.5 3.3 53.0 2.0 1.9 3.9 3.6 3.7 Greece 2009/q3 37.0 2.3 39.3 18.2 26.2 2.3 46.7 8.0 6.0 14.0 9.5 5.7 Israel 2009/q1 46.0 4.4 50.4 25.5 10.7 0.6 36.8 8.6 4.1 12.7 6.8 12.3 Italy a 2006/q1 59.0 3.7 62.7 2.9 19.2 0.3 22.4 9.3 5.5 14.8 7.1 4.1 Portugal 2009/q1 62.9 1.3 64.2 7.6 13.8 1.0 22.4 10.1 3.3 13.4 8.5 2.8 Spain 2008/q4 68.4 2.2 70.6 4.4 13.9 0.5 18.8 7.8 2.9 10.7 13.0 1.3
Eastern Europe Poland 2008/q4 65.9 2.0 67.9 4.1 16.6 0.9 21.6 7.1 3.5 10.6 6.8 4.4 Ukraine 2009/q1 73.9 0.9 74.8 6.9 7.3 0.2 14.4 8.4 2.4 10.8 9.5 5.1 Slovenia 2008/q4 74.4 1.3 75.7 6.2 7.2 0.7 14.1 4.9 5.3 10.2 4.3 5.8 Bulgaria 2009/q1 65.2 1.7 66.9 5.3 6.7 1.2 13.2 13.9 5.9 19.8 6.4 5.0 Czech R. 2009/q2 77.3 2.7 80.0 1.3 10.7 0.5 12.5 4.9 2.5 7.4 6.6 2.7 Slovakia 2008/q4 77.4 2.9 80.3 1.2 11.0 0.0 12.2 6.2 1.3 7.5 9.3 2.2 Russia 2008/q4 78.8 1.5 80.3 6.1 5.4 0.5 12.0 4.4 3.3 7.7 7.4 4.2 Romania 2009/q1 78.0 1.6 79.6 5.1 5.9 0.8 11.8 5.5 3.1 8.6 6.7 2.9 Estonia 2009/q1 78.0 2.2 80.2 3.2 6.3 0.3 9.8 6.8 3.1 9.9 10.3 4.2 Hungary 2009/q1 71.6 1.0 72.6 2.6 6.2 0.6 9.4 12.4 5.6 18.0 9.7 2.4 Latvia 2009/q2 69.4 1.8 71.2 3.7 3.6 0.7 8.0 13.9 6.8 20.7 17.0 5.9 Lithuania 2009/q4 74.2 1.4 75.5 2.2 4.2 0.0 6.4 12.6 5.6 18.1 15.6 3.0
Western Europe Ireland 2009/q4 45.8 2.4 48.2 18.1 13.4 1.5 33.0 13.8 5.0 18.8 12.6 15.1 UK 2008/q4 67.8 2.5 70.3 9.6 11.0 1.1 21.7 6.0 2.0 8.0 6.2 5.2 Austria a 2007/q3 73.7 2.4 76.1 8.5 9.9 1.3 19.7 2.6 1.6 4.2 4.3 3.4 Switzerland 2008/q4 79.1 2.4 81.5 1.9 11.5 0.3 13.7 3.8 0.9 4.7 4.0 1.8 Netherland 2008/q4 79.7 4.3 84.0 2.4 9.1 1.1 12.6 2.1 1.3 3.4 3.1 2.2 Germany 2008/q4 75.4 4.5 79.9 1.6 10.1 0.2 11.9 5.9 2.3 8.2 7.1 2.5 Belgium 2008/q4 74.9 4.2 79.1 1.6 8.4 0.5 10.5 5.4 5.1 10.5 7.2 2.4 France 2008/q4 79.0 1.2 80.2 2.7 7.1 0.5 10.3 7.7 1.8 9.5 8.3 1.0
Northern Europe Norway 2008/q3 82.6 2.6 85.2 4.7 7.2 0.4 12.3 2.0 0.6 2.6 2.5 2.5 Denmark 2008/q4 82.2 2.4 84.6 3.9 7.5 0.1 11.5 2.9 1.0 3.9 3.5 1.9 Finland 2008/q4 80.0 2.9 82.9 0.9 10.1 0.2 11.2 3.7 2.2 5.9 6.2 1.0 Sweden 2008/q4 84.6 2.8 87.4 0.8 7.1 0.3 8.2 3.5 1.1 4.6 6.3 1.2
Notes: a Results are based on round 4 of ESS. Results of round 4 were not available for Italy and Austria; the latest available results are presented instead. b ‘Core period’ is the quarter during which most of the field work has been performed; it is given for the reference only; by contrast, LFS-based unemployment rate has been calculated as weighted average of quarterly unemployment rates for quarters covering the whole field work period. c Due to data limitations (only year but not month of the last job is known for non-employed respondents), the shares of non-employed who were recently informally employed (see the last column) are not perfectly comparable across countries. Average 'recent' period varies as follows: 10-16 months in the South, 11-18 months in the East, 11-15 months in the West, and 10-12 months in the North. Experiments with the data show, however, that changing this period by few months do not change the results significantly.
Source: Calculation with ESS data.

34
Table 4 Informal employees as percentage of all employees, by European region and worker category, 2008-2009 %
South ES, PT, GR East West North Total N obs. Total 21.1 14.2 5.3 7.1 2.7 8.6 26247 Male 19.2 12.8 5.4 7.0 2.6 8.2 12839 Female 22.9 15.6 5.1 7.2 2.7 8.9 13405 Education
Less than secondary 20.9 14.9 9.0 12.9 5.3 14.5 5049 Secondary 24.5 17.6 5.1 6.8 3.2 8.4 12758
Tertiary 16.6 8.6 4.2 3.4 1.4 5.7 8407 Students (all levels) 30.5 20.2 21.3 16.0 12.7 19.7 1000 Age
15-24 29.5 21.6 14.9 13.8 8.1 17.0 2378 25-54 18.5 12.9 4.1 5.6 1.9 7.1 19653 55-64 26.5 13.1 5.2 8.6 2.4 9.0 3673
65+ 33.9 36.4 8.0 23.7 6.9 15.7 489 Disability or illness affects life 28.2 19.7 5.8 6.8 4.0 8.0 3840 Origin
Native majority 15.7 12.2 4.2 7.1 2.8 6.9 19999 Native minority 30.3 16.1 10.7 6.0 1.8 14.0 1770
2nd generation immigrant 31.1 14.4 6.7 6.2 2.1 12.6 2092 Immigrant: 2386
Working rights due to nationality a 30.0 16.5 6.5 8.7 1.9 15.0 1650 No working rights due to nationality 33.5 33.7 5.9 6.0 0.0 14.3 736
From CEE of FSU 37.1 55.4 7.1 11.9 1.4 18.9 1049 From developing countries 23.6 16.2 1.9 6.8 0.0 13.0 728 From developed countries 28.8 20.8 0.0 5.2 2.3 8.6 609
Occupation Highly skilled non-manual 17.2 8.6 3.0 3.9 1.2 5.1 10986
Low skilled non-manual 20.9 12.4 6.8 9.0 3.8 10.7 6909 Skilled manual 21.9 13.6 5.6 8.5 3.8 9.0 5479
Elementary 30.3 28.6 9.7 14.6 8.0 16.8 2319 Establishment size
1-9 31.2 25.7 10.6 13.2 4.9 16.2 6501 10-24 15.5 9.5 5.5 7.7 2.6 7.8 5549 25-99 16.5 4.1 2.5 5.7 1.4 5.5 6445 100+ 14.9 6.3 1.7 2.7 1.9 4.1 6893
NA 21.1 6.5 10.3 17.6 29.0 13.4 859 Economic activity
Agriculture & Forestry 31.1 27.7 7.1 14.3 5.6 13.3 623 Manufacturing and Mining 15.8 9.5 3.1 5.1 2.1 5.6 4341
Construction 27.1 19.7 11.4 10.0 5.5 13.7 1863 Trade & Auto Repair 24.5 13.9 7.7 9.1 3.3 11.0 3292 Hotels & Restaurants 29.7 22.1 10.4 22.2 6.1 19.7 996
Transport 23.0 12.5 3.5 6.6 4.3 7.6 1271 Finances 17.1 2.4 3.4 3.1 1.8 6.0 824
Business Services 15.1 9.2 6.5 6.8 1.4 7.8 2243 Public utilities 22.2 7.4 2.3 10.1 0.0 6.3 335
Post & Telecom 8.4 7.2 3.8 3.7 0.0 4.5 443 Public Administration 14.5 5.4 2.6 4.3 1.1 6.1 2055
Education 18.7 7.5 2.1 4.8 2.0 6.1 2644 Health & Social Care 10.8 9.1 2.1 4.8 1.9 4.1 2808
Personal & HH Services 39.5 38.6 8.3 13.3 5.2 17.7 1471 Notes: For Italy and Austria, results refer to 2006 and 2007, respectively. Countries weighted equally (i.e. a respondent from any country is equally likely to be sampled. a Country-specific (and year-specific) rules on free movement of labor within EU are taken into account. Source: Calculation with ESS data.

35
Table 5 Dynamics of informal employment and unemployment in European countries,
2004-2009 a
Informal Dependent Employment
Informal Self‐Employment
Total Unemployed Willing to Work
LFS‐Based Unempl. Rate
Roun
d 4
vs.
Roun
d 3
Roun
d 3
vs.
Roun
d 2
Roun
d 4
vs.
Roun
d 3
Roun
d 3
vs.
Roun
d 2
Roun
d 4
vs.
Roun
d 3
Roun
d 3
vs.
Roun
d 2
Roun
d 4
vs.
Roun
d 3
Roun
d 3
vs.
Roun
d 2
Southern Europe Cyprus -5.4* 0.0 -3.4** -0.5
Greece b -0.5 0.7 -2.7* -0.9
Portugal 0.0 3.6*** 1.5 -2.5 1.1*** -1.4*** 0.1 0.9
Spain -0.6 1.0*** -1.0 1.7 3.7*** -1.8 4.7 -1.8
Eastern Europe Poland -0.2 0.9 4.2** -3.5** -2.7* -5.8*** -5.4 -5.8
Ukraine 0.2 0.5 1.1 2.0 -3.0 -2.1 2.7 -1.9 Slovenia 2.7** -1.1 1.3 -1.5 -6.3*** 5.2*** -1.3 -0.9
Bulgaria -2.4** 0.5 -3.2 -2
Czech R.b -0.8 1.7 -2.5** -1.6
Slovakia -1.0 0.3 1.6 -1.3 -4.6*** -6.2*** -2.6 -5.4
Russia 1.2 0.7 0.1 0.8 Estonia -0.5 2.0*** 1.8* -1.6* 6.2*** -4.8*** 4.9 -3.4
Hungary 0.6 -1.2 -1.1 -0.9 7.5*** 2.4 2.2 0.4
Latvia -2.4*** 0.3 10.7*** 11
Western Europe Ireland -6.9*** -2.0 -0.9 1.1 11.2*** 1.7 8.1 0.1 UK -0.4 -2.3 1.5 -1.0 1.2 -3.1** 0.7 0.8
Austria 1.3 0.4 -3.6*** -0.9
Switzerland -0.5 0.8 -2.1 1.9 1.2 -1.1 0.5 -0.9 Netherlands -1.7** -1.0 2.2* -0.6 -2.5*** -0.6 -0.9 -1.1
Germany 0.3 -0.5 0.3 1.1 -3.8*** -1.7 -2.2 -0.9
Belgium 0.0 -0.4 -1.2 -0.1 -1.0 -1.6 -0.7 -0.5 France -1.1 1.4 0.1 -0.7 Northern Europe Norway -0.9 0.5 -2.1* -0.2 -0.6 -2.9*** 0.7 -1.2
Denmark -3.9*** 2.7** 0.1 1.0 0.3 -4.2*** -0.2 -1.3
Finland 0.4 -0.1 0.6 -0.6 -2.4** -1.1 -0.6 -1.1
Sweden 0.2 0.1 -0.2 -0.4 -1.5* -1.5 0.2 -0.9
Notes: a The table presents the changes in estimated prevalence of informal employment and unemployment between ESS rounds: Round 4 (2008-2009), Round 3 (2006-2007), Round 2 (2004-2005). b For Greece and the Czech R., Round 4 is compared to Round 2 (rather than to Round 3). *, **, *** - estimates significantly different from 0 at the 10%, 5%, 1% level, respectively (not shown for LFS-based unemployment rates). Source: Calculation with ESS data.

36
Table 6 Sectoral distribution of informal workers’ main job, by European region and employment status. 2004-2009
East South West North
Em
ploy
ees
Self-
empl
oyed
Tot
al
Em
ploy
ees
Self-
empl
oyed
Tot
al
Em
ploy
ees
Self-
empl
oyed
Tot
al
Em
ploy
ees
Self-
empl
oyed
Tot
al
Agriculture & Forestry 5.4 15.5 11.3 3.9 19.8 13.3 1.7 15.6 11.1 3.8 21.4 17.7 Manufacturing 14.7 9.6 12.0 13.4 9.2 11.0 14.2 8.0 10.2 14.6 6.7 8.5 Construction 13.0 8.9 10.8 11.6 8.3 9.5 8.5 11.7 10.4 14.8 12.4 12.9
Trade, Auto Repair, Hotels & Restaurants 20.7 27.0 24.2 22.2 34.1 29.4 25.5 18.5 21.7 17.4 19.8 19.3 Transport, finance, & business activities 10.6 15.4 13.0 12.6 11 11.6 14.5 20.2 17.7 16.2 19.4 18.6 Education, Health & Social Care, Public Administration, Utilities, Post & Communications 16.2 4.7 9.8 20.3 3.3 10.4 24.0 10.3 15.3 22.8 8.0 11.4 Community, Personal & Household Services 9.9 10.5 10.0 13.4 10.1 11.3 7.8 10.3 9.1 5.6 9.9 8.7 NA 8.5 7.2 7.7 2.7 4.2 3.5 2.7 4.6 3.8 3.3 2.3 2.5 Total 100 100 100 100 100 100 100 100 100 100 100 100 N obs. 1857 2136 4152 2036 2337 4540 1703 2680 4567 391 1137 1561
Notes: See Table 1 for definitions of informal employment. Columns ‘Employees’ and ‘Self-employed’ here correspond, respectively, to categories 5 and 3 defined in Table 1; column ‘Total’ includes also family workers. Countries are not weighted by population size. Design weights corrected for variation of sample size across countries in each round are applied (i.e., all respondents are assumed equally likely to be sampled; countries which did not participate in some rounds are, however, under-represented). Source: Calculation with ESS data. Table 7 Perceived discrimination on grounds of race, ethnicity, religion, language, nationality,
age or disability among formal and informal workers, by European region. 2004-2009
% South East West North Total [1] Formal Employees 3.5 3.8 4.1 2.3 3.6 [2] Informal Employees 7.6 6.4 5.3 2.8 6.2 [3] Informal Self-employed 3.9 4.0 3.9 2.3 3.7
[2]/[1] 2.18 1.70 1.30 1.24 1.74 t-test : [2] = [1] 0.000 0.002 0.057 0.540 0.000 t-test : [3] = [1] 0.505 0.638 0.749 0.970 0.609
Notes: Countries are not weighted by population size. Design weights corrected for variation of sample size across countries in each round are applied (i.e., all respondents are assumed equally likely to be sampled;
countries which did not participate in some rounds are, however, under-represented). Source: Calculation with ESS data.

37
Table 8 Labor market status effects on perception of household’s financial difficulties in European regions, 2004-2009. Population aged 15-74
Ordered probit coefficients
South East West-1 West-2 North Employment status
(vs. formal employees)
Formal self-employment -0.518*** -0.640*** -0.308*** -0.318*** -0.093 Informal self-employment -0.130*** -0.320*** -0.018 -0.067 0.090**
Family workers -0.385*** -0.633*** 0.016 0.230 0.237 Informal dependent employees 0.169*** 0.170*** 0.127*** 0.332*** 0.195***
Unemployed willing to work 0.723*** 0.872*** 0.908*** 0.911*** 0.906*** Other (inactive) 0.089*** 0.264*** 0.254*** 0.171*** 0.493***
Other controls
Gender, family status, children, age, age squared, education, country and time fixed effects, parental background, ethnic/immigration origin, rural residence, economic activity of last employment,
disability status, household size (log) Pseudo R-sq. 0.1160 0.1435 0.0692 0.0913 0.1157 N obs. 24889 46357 20288 21393 19578
Notes: South : ES, PT, IT, GR, CY, and IL; East : CZ, PL, SK, HU, EE, LV, BG, RO, SI, RU, and UA; North: DK, FI, NO, and SE; West -1: UK, IE, NL, and AT; West-2: DE, FR, BE, and CH. Larger coefficients indicate larger perceived difficulties. *, **, *** indicate that respective coefficient for the
given employment status is significantly different from the coefficient for formal employees at 10%, 5%, 1% level, respectively (based on robust standard errors clustered on within-country region). Marginal effects are presented in Figure 7. Countries are not weighted by population size. Design weights corrected for variation of sample size across countries in each round are applied (i.e., all respondents are assumed equally likely to be sampled; countries which did not participate in some rounds are, however, under-represented). Source: Calculation with ESS data.
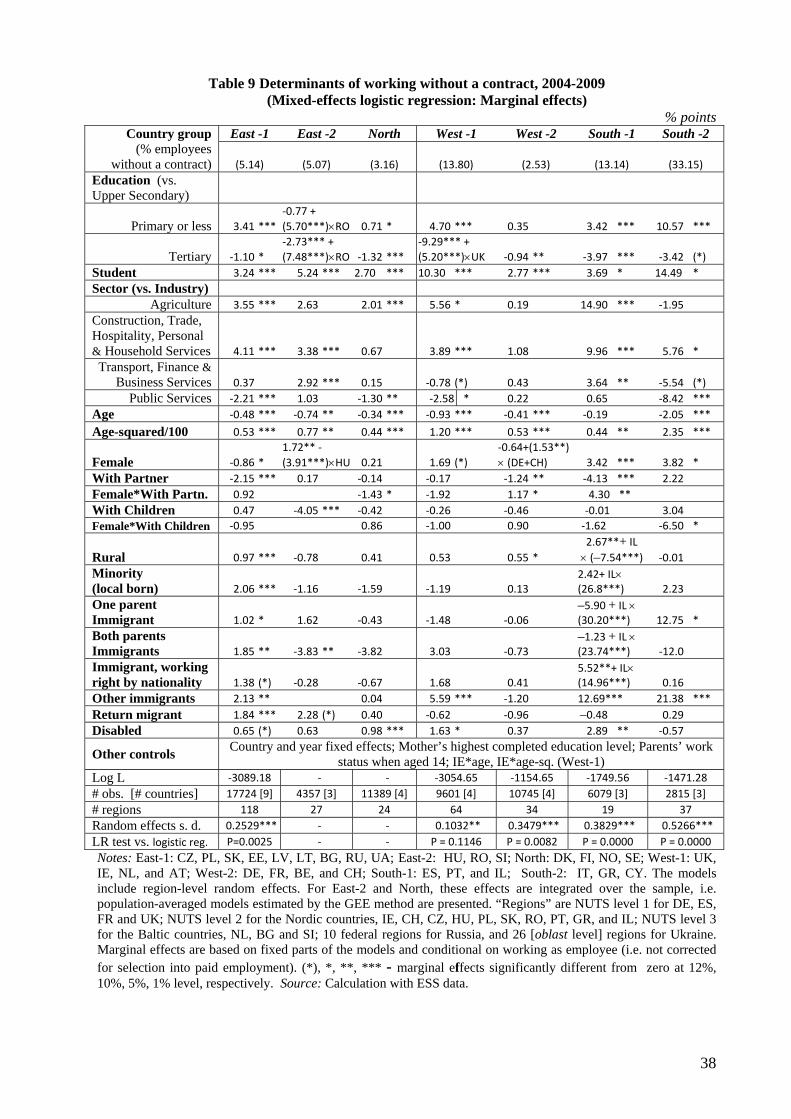
38
Table 9 Determinants of working without a contract, 2004-2009 (Mixed-effects logistic regression: Marginal effects)
% points East -1 East -2 North West -1 West -2 South -1 South -2 Country group
(% employees without a contract) (5.14) (5.07) (3.16) (13.80) (2.53) (13.14) (33.15)
Education (vs. Upper Secondary)
Primary or less 3.41 *** ‐0.77 + (5.70***)×RO 0.71 * 4.70 *** 0.35 3.42 *** 10.57 ***
Tertiary ‐1.10 * ‐2.73*** + (7.48***)×RO ‐1.32 ***
‐9.29*** + (5.20***)×UK ‐0.94 ** ‐3.97 *** ‐3.42 (*)
Student 3.24 *** 5.24 *** 2.70 *** 10.30 *** 2.77 *** 3.69 * 14.49 * Sector (vs. Industry)
Agriculture 3.55 *** 2.63 2.01 *** 5.56 * 0.19 14.90 *** ‐1.95 Construction, Trade, Hospitality, Personal & Household Services 4.11 *** 3.38 *** 0.67 3.89 *** 1.08 9.96 *** 5.76 * Transport, Finance &
Business Services 0.37 2.92 *** 0.15 ‐0.78 (*) 0.43 3.64 ** ‐5.54 (*) Public Services ‐2.21 *** 1.03 ‐1.30 ** ‐2.58 * 0.22 0.65 ‐8.42 ***
Age ‐0.48 *** ‐0.74 ** ‐0.34 *** ‐0.93 *** ‐0.41 *** ‐0.19 ‐2.05 ***
Age-squared/100 0.53 *** 0.77 ** 0.44 *** 1.20 *** 0.53 *** 0.44 ** 2.35 ***
Female ‐0.86 * 1.72** ‐ (3.91***)×HU 0.21 1.69 (*)
‐0.64+(1.53**) × (DE+CH) 3.42 *** 3.82 *
With Partner ‐2.15 *** 0.17 ‐0.14 ‐0.17 ‐1.24 ** ‐4.13 *** 2.22 Female*With Partn. 0.92 ‐1.43 * ‐1.92 1.17 * 4.30 ** With Children 0.47 ‐4.05 *** ‐0.42 ‐0.26 ‐0.46 ‐0.01 3.04 Female*With Children ‐0.95 0.86 ‐1.00 0.90 ‐1.62 ‐6.50 *
Rural 0.97 *** ‐0.78 0.41 0.53 0.55 * 2.67**+ IL × (–7.54***) ‐0.01
Minority (local born) 2.06 *** ‐1.16 ‐1.59 ‐1.19 0.13
2.42+ IL× (26.8***) 2.23
One parent Immigrant 1.02 * 1.62 ‐0.43 ‐1.48 ‐0.06
–5.90 + IL × (30.20***) 12.75 *
Both parents Immigrants 1.85 ** ‐3.83 ** ‐3.82 3.03 ‐0.73
–1.23 + IL × (23.74***) ‐12.0
Immigrant, working right by nationality 1.38 (*) ‐0.28 ‐0.67 1.68 0.41
5.52**+ IL× (14.96***) 0.16
Other immigrants 2.13 ** 0.04 5.59 *** ‐1.20 12.69*** 21.38 *** Return migrant 1.84 *** 2.28 (*) 0.40 ‐0.62 ‐0.96 –0.48 0.29 Disabled 0.65 (*) 0.63 0.98 *** 1.63 * 0.37 2.89 ** ‐0.57
Other controls Country and year fixed effects; Mother’s highest completed education level; Parents’ work status when aged 14; IE*age, IE*age-sq. (West-1)
Log L ‐3089.18 ‐ ‐ ‐3054.65 ‐1154.65 ‐1749.56 ‐1471.28 # obs. [# countries] 17724 [9] 4357 [3] 11389 [4] 9601 [4] 10745 [4] 6079 [3] 2815 [3] # regions 118 27 24 64 34 19 37 Random effects s. d. 0.2529*** ‐ ‐ 0.1032** 0.3479*** 0.3829*** 0.5266*** LR test vs. logistic reg. P=0.0025 ‐ ‐ P = 0.1146 P = 0.0082 P = 0.0000 P = 0.0000 Notes: East-1: CZ, PL, SK, EE, LV, LT, BG, RU, UA; East-2: HU, RO, SI; North: DK, FI, NO, SE; West-1: UK, IE, NL, and AT; West-2: DE, FR, BE, and CH; South-1: ES, PT, and IL; South-2: IT, GR, CY. The models include region-level random effects. For East-2 and North, these effects are integrated over the sample, i.e. population-averaged models estimated by the GEE method are presented. “Regions” are NUTS level 1 for DE, ES, FR and UK; NUTS level 2 for the Nordic countries, IE, CH, CZ, HU, PL, SK, RO, PT, GR, and IL; NUTS level 3 for the Baltic countries, NL, BG and SI; 10 federal regions for Russia, and 26 [oblast level] regions for Ukraine. Marginal effects are based on fixed parts of the models and conditional on working as employee (i.e. not corrected for selection into paid employment). (*), *, **, *** - marginal effects significantly different from zero at 12%, 10%, 5%, 1% level, respectively. Source: Calculation with ESS data.

39
Annex Measurement issues Table A1 Legal requirements on employee contracts in European countries
Contract or ToE must be signed in advance orimmediately after starting work
Time period to sign a contract or ToE after starting work
A written contract is always required
Bulgaria, the Czech R., Denmark, Estonia, Italy,Lithuania, Latvia, Norway, Romania, Slovakia, Slovenia, Sweden, Switzerland
Greece – 2 months;
Russia – 3 days; Ukraine – 3 days
A written contract is required, except for
“atypical” employment a
Hungary
Cyprus – 1 month
A written contract is required only for “atypical”
employment a; otherwise an oral contract is
acceptable
Austria, Belgium, France, Portugal b
If a written contract is
absent, the employee
must be given written
terms of employment
(ToE) signed by the
employer
A written contract is considered good practice
but not generally required; oral (in Finland – also
electronic) contract is fine
Germany, Poland
Finland – 1 month,The Netherlands –
1 month, Ireland – 2 months,
UK – 2 monthsA written contract is required if either party requests it (even during the course of employment relationship),
as well as for “atypical” employment a; otherwise an oral contract is acceptable
Spain –
not specified
Notes: In most countries, having a written contract is considered good practice even when it is not required by the law. a “Atypical” employment include: Apprenticeship; Fixed-term contract or contract for specific work; Seasonal
work; Replacement contract; Part-time contract; Contract employing a domestic worker. b In Portugal, very short-term contracts (as well as indefinite ones) might be oral. Source: EURES (2011).
Table A2 Employees’ responses on European Social Survey question on
contract type depending on presence of the answer ‘no contract’ (selected countries) ESS round 1 (2002-2003) ESS rounds 2-4 (2004-2009)
Employees not responding on the question on contract type
(answer 'no contract' not offered)
Employees without a contract or not responding on the question
on contract type min max average % of all employees Slovenia 2.3 4.5 7.7 6.0 Poland 1.2 5.4 6.0 5.8 Austria 2.8 9.0 10.3 9.7 Netherlands 1.4 6.2 5.0 2.9 The United Kingdom 2.6 16.2 12.4 12.4 Denmark 0.5 6.3 9.1 4.5 Portugal 1.0 5.8 10.5 10.8
Notes: In all rounds, answers “Contract of unlimited duration”, “Contract of limited duration”, and “Don’t know” were offered. In addition, answer “No contract” was offered in rounds 2-4. Source: Calculation with ESS data.

40
Table A3 Prevalence of informal employment in European countries: ESS results compared with other sources
%
(Informal employees) /
(All employees) (Informally employed) /
(All employed) European Social Survey
Fourth European Working Conditions
Survey (EWCS), 2005 2004/2005 2006/2007
EWCS
European Social Survey
No
contract No contract or no answer
No contract or no answer to the contract question 2005
2004/ 2005
2006/ 2007
1 2 3 4 5 6 7 Cyprus 41.5 41.5 56.8 50.2 63.0 Greece 26 27.3 35.4 46.1 55.9 Ireland 27.7 28.4 34.9 33.8 38.0 43.7 43.5
Romania 6.8 9.2 6.1 a 31.3 Italy 6.1 6.4 4.8 28.1 26.4
Portugal 7 9.2 5.8 10.6 25.4 22.9 23.9 UK 14.1 17 16.3 12.4 25.2 26.6 22.2
Poland 5.8 6.5 5.4 5.9 24.7 24.9 20.2 Spain 8.2 8.6 5.5 6.8 22.4 19.4 21.9
Austria 8.6 14.9 9.0 10.3 22.0 19.5 20.6 Bulgaria 6.2 8.1 11.3 19.0 19.7 Lithuania 5.3 7.0 3.0 a 18.8 Slovenia 9.4 9.7 5.7 4.5 17.3 14.2 11.9
Switzerland 2.8 3.1 2.1 3.1 15.1 14.3 17 Hungary 4.4 4.4 4.1 2.6 15.0 13.1 11.1 Denmark 10.3 10.5 6.3 9.1 14.2 12.6 15.9 Belgium 2.5 3.4 2.7 2.1 13.2 14.0 13.1 Czech R. 0.8 1.3 2.7 12.9 13.2 Estonia 5.1 6.1 2.1 4.2 12.4 8.9 8.8 France 3.9 4.3 4.5 12.4 11.1 Finland 2.2 2.6 0.8 0.7 12.4 12.0 11.1 Slovakia 1.3 1.8 2.8 2.9 12.1 15.5 13.2 Latvia 5.4 6.3 7.2 11.7 11.2
Germany 3.7 4.3 2.5 1.8 9.8 12.4 12.8 Norway 2.1 2.5 6.2 6.5 9.8 15.9 15.7
Netherlands 2.1 2.6 6.2 5.0 8.6 14.6 12.9 Sweden 0.2 1.7 0.5 0.7 7.5 9.1 8.7
Other surveys No contract Year
ESS 2006/2007
ESS 2008/2009
Latvia b 9.5 2006/2007 7.2
Russia c 11.0 2009 7.2
Bulgaria d 8.0 2009/2010 7.5
Notes: Empty cells: data not available. Best matches between EWCS (col. 1 or 2) and ESS (col. 3 or 4) on work without contract are shown in bold. The EWCS-2005 total informality rate (col. 5) is very close either to both ESS-2004 and ESS-2006 rates (col. 6-7) or at least to one of them for most countries. Employee sub-sample size used for calculations with EWCS data varies between 790 and 970, except for Cyprus (484), Slovenia, Estonia and Greece (540 to 640). Sub-sample size used for calculations with ESS data varies from 740 to 1200 employees, except for Cyprus (~400), Italy (500), Bulgaria, Hungary, Slovenia and Poland (550 to 690). Total sample size is in most cases about 1000 for EWCS and between 1500 and 2400 for ESS. a Romanian ESS data refer to 2008, whilst Lithuanian ESS data refer to 2009. Hence, lower informality rates than in EWCS-2005 are consistent with the fact that work without contract tends to be less prevalent during the recession (see Section 2.5). Sources: Calculation with ESS data and with data of European Foundation for the Improvement of Living and Working Conditions (2007). b Own calculations with the data of survey of economically active population aged 15-65 conducted for the project „Specific problems of the labour market in Latvia and its regions” of the National Program of Labor Market Studies, N=9306. c Slonimczyk (2011: Table 5), based on Special Supplement to Russian Longitudinal Monitoring Survey. d Survey of N= 6337 employees conducted by Bulgarian Chamber of Commerce and Industry reported by Novinite (2011).

41
Greece 2005,2009Ireland 2005, 2007
Poland 2004, 2008
010
2030
4050
60P
er c
ent
South, 18 obs. West, 31 obs. East, 38 obs. North, 16 obs.
Based on rounds 2-4 of European Social Survey and the Fourth European Working Conditions Survey (2005)Countries (# obs.) by region, sorted descending by average prevalence of total informal employment:South - Cyprus (3), Greece (3), Malta (1), Israel (1), Italy (2), Portugal (4), Spain (4)West - Ireland (4), UK (4), Austria (3), Switzerland (3), Belgium (4), Netherlands (4), Germany (4), France (3)East - Poland (4), Romania (2), Bulgaria (3), Slovenia (4), Ukraine (3), Czech R. (3), Lithuania (2), Slovakia (4), Hungary (4), Russia (2), Estonia (4), Latvia (3)North - Denmark (4), Norway (4), Finland (4), Sweden (4)Informal employment = employees without contracts + non-professional self-employed without employees + + employers with <=5 employeesLabor force extended to include discouraged workersEWCS data amended with unemployment and discouragement data from EU LFS 2005/Q4Source: Calculation with ESS and EWCS data
in the labor force of European countries2004-2009, by region
Proportion of informal employment
Total Self-Employed Employees
Figure A1 Variation in size of total, dependent and own-account informal employment
in countries of Southern, Western, Eastern, and Northern Europe. 2004-2009