influvence of alloying additions on the structure and...
TRANSCRIPT

CHAPTER 4
EFFECT OF CALCIUM IN AI-7Si-O.3Mg ALLOY
Initially, Ca has been considered as one of the deleterious elements in
aluminum and its alloys and hence techniques have been developed for its re~oval. 32
Calcium, entering the aluminum casting alloys along with the addition of silicon and
appearing as calcium silicides, calcium phosphides and calcium nitrides, which are
considered to be hannful, requires removal to levels below 0.003% (30 ppm) and
preferably below 0.001 % (10 ppm).30 However, Ca introduced in the elemental form
modifies the eutectic silicon in AI-Si alloys/o-37 improves the fracture toughness and
impact properties of high iron containing recycled aluminum alloys,27,39-42 scavenges
the effect of Sb from secondary alloys,43, 44 imparts superplastic properties,45-49
and enables production of aluminum foams50-55 and alurninum metal matrix
composites. 56~ Aluminum alloys containing Ca as an intentional alloying element
are applied .industrially in the form of sacrificial anodes, bearings, electrolytic
capacitor cathode foils, packaging and others.65-86 The present study aims to
investigate the first two beneficial effects of calcium viz., modification and Fe
neutralization on the structure and properties of AI-7Si-0.3Mg and AI-7Si-0.3Mg-xFe
alloys respectively.
4.1 MODIFICATION
4.1.1 Methodology
AI-7Si-0.3Mg alloy was used as the base alloy. For each experiment, about 3-
4 kg of the alloy was melted in a clay-graphite crucible of 10 kg capacity using an
electric resistance furnace. The required amounts of calcium in the form of AI-I 0%
Ca master alloy to make calcium levels in the range 0-0.05% were immersed in the
melt at 1003 K using coated and preheated mild steel plunger and stirred for 2-3
minutes to enable complete dissolution and homogenization and the melt was held at
this temperature for about 20 minutes (holding time). The modification effect of Ca

has been compared with the well known modifier viz., Sr (0.02%), which was added
in the form of AI-lO% Sr master alloy. Figure 3.1 shows the dimensions (in mm) of
the moulds used and castings made. The casting and heat treatment procedures are
given in chapter 3.
4.1.2 Results and Discussion
4.1.2.1 Microstructure
Figure 4.1 shows the typical as cast microstructures of AI-7Si-0.3Mg alloy
without and with 0.01 % Ca, while Figure 4.2 shows those of the alloy treated with
0.02% Ca, 0.05% Ca and 0.02% Sr. It is seen that in Figure 4.1(a), eutectic Si
particles are in coarse acicular and platelet form. Only partial modification has been
observed in the alloy treated with 0.01% Ca [Figure 4.1(b)]. However, 0.02% Ca
shows a modified eutectic Si structure [Figure 4.2(a)]. On the other hand, 0.05% of
Ca addition has yielded a very fine fibrous eutectic Si [Figure 4.2 (b)] as well as leads
to the formation of an AI-Ca-Si compound which is identified as AbCaSh by
SEMlEDX analysis (Figure 4.3). When comparing the effects of Ca and Sr additions,
it has been observed that Sr addition leads to very fine globular eutectic Si. On the
other hand, Ca addition leads to the formation of both network and individual
globular eutectic Si. Quantification of the silicon particle characteristics using image
analysis in the as cast Ca added Al-7Si-0.3Mg alloys could not be done because of the
formation of eutectic Si in networks of fibrous form, wherein the identification of
individual Si is difficult.
4.1.2.2 Physical Characteristics
Porosity and electrical conductivity
Table 4.1 shows the effects of various amounts of calcium on the porosity and
electrical conductivity of Al-7Si-0.3Mg alloy. It is se~n that the % porosity increases
as the calcium content increases. The increased porosity at higher Ca levels may be
due to the increased melt affinity for gas absorption. When comparing the porosities
of 0.02% Ca and Sr added Al-7Si-0.3Mg alloys, it is seen that the porosity with Sr
addition is higher than that with Ca addition.
76

(a)
(b)
Figure 4.1: Typical as cast microstructures of AI-7Si-0.3Mg alloy treated (a) without and (b) with 0.01 % Ca
77

(b)
(c)
Figure 4.2: Typical as cast microstructures of AI-7Si-0.3Mg alloy treated (a) 0.02% Ca (b) 0.05% Ca and (c) 0.02% Sr
78

(a)
Si
Ca
1.00 2.00 3.00 4.00 5.00 Energy (keV)
(b)
Figure 4.3: (a) SEM photograph of AhCaSh phase in AI-7Si-0.3Mg alloy treated with 0.05% calcium (b) EDS spectra showing the distribution of AI, Si and Ca in AhCaSh phase
79

Table 4.1: % Porosity and Electrical Conductivity of AI-7Si-O.3Mg alloy treated without and with Ca
Alloy % Porosity Electrical Conductivity
AI-7Si-0.3Mg 1.47 31.2
AI-7Si-0.3Mg + 0.01 % Ca 1.40 34.8
AI-7Si-0.3Mg + 0.02% Ca 1.68 35.5
AI-7Si-0.3Mg + 0.05% Ca 2.84 33.9
AI-7Si-0.3Mg + 0.02% Sr 2.08 35.0
It is seen that Ca and Sr additions have increased the electrical conductivity
(in %IACS) compared to the untreated alloy. This is due to the modification of
eutectic Si by Ca addition, which allows easier flow of electrons compared to the
untreated alloy, where the platelet morphology of eutectic Si poses serious
impediment to the flow of electrons. On the other hand, the decrease in conductivity
with increasing calcium contents may be due to the higher amount of porosity present
in the samples. Nevertheless, the conductivity values of Ca treated alloys are still
higher than that of an untreated or unmodified alloy. When considering the effect of
porosity on %IACS, it is evident from the Table 4.1 that porosity has a significant
effect on %IACS. Though a very fine fibrous eutectic Si structure is obtained with
0.05% Ca addition, the presence of higher porosity has reduced the %IACS.
4.1.2.3 Mechanical Properties
Tensile properties
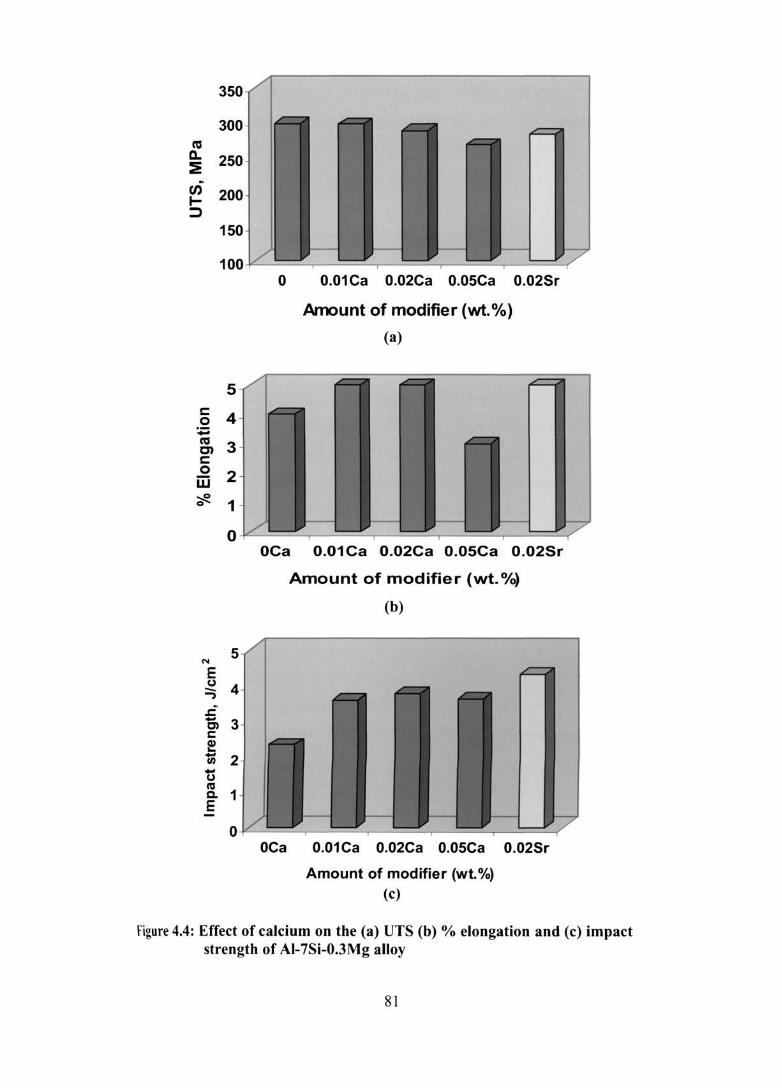
The effect of calcium on the tensile properties of T6-heat treated Al-7Si
O.3Mg alloy is shown in Figures 4.4 (a) and (b). Comparing the tensile strengths of
Al-7Si-0.3Mg alloy treated with and without Ca and Sr, it has been observed that the
tensile strength is decreased marginally with both Ca and Sr. This is due to the higher
porosity formation with the above additions. Similarly, comparing Ca and Sr
additions, UTS is lower in the case of Sr addition, which is due to the higher porosity
80
350
300 co c.. 250 :E
en 200 ~ ~
150
100~----~----~------~----~----~
5
g 4 :.;:;
~ 3 c: o iIi 2 ~ 1
o 0.01 Ca 0.02Ca 0.05Ca 0.02Sr
Amount of modifier (wt.%)
(a)
o ~----~------~----~----~------~
5
OCa 0.01 Ca 0.02Ca 0.05Ca 0.02Sr
Amount of modifier (wt. 0/0)
(b)
O~----~----~------~----~----~ OCa 0.01 Ca 0.02Ca 0.05Ca 0.02Sr
Amount of modifier (wt. %) (c)
figure 4.4: Effect of calcium on the (a) UTS (b) % elongation and (c) impact strength of AI-7Si-O.3Mg alloy
81

associated with Sr added sample. Both Ca and Sr additions lead to a significant
improvement (25% improvement) in elongation of AI-7Si-0.3Mg alloy. However,
when the Ca content is increased beyond 0.02%, the % elongation is decreased
dramatically. This is attributed to the over modification of eutectic Si, presence of AI
Ca-Si intermetallics and also higher porosity in the samples.
Impact strength
Figure 4.4 (c) shows the impact strength of Al-7Si-0.3Mg alloy with and
without Ca and Sr additions. It has been found that Ca and Sr additions improve the
impact strength significantly compared to the untreated alloy. Impact strength of AI-
7Si-0.3Mg alloy has been improved by 53, 62, 55 and 85% by treating the alloy with
0.01, 0.02, 0.05% Ca and 0.02% Sr respectively. This is due to the modification of
platelet eutectic Si to fibrous form. Figure 4.5 shows the SEM micrographs of the
fractured surface of impact tested Al-7Si-0.3Mg alloy without and with Ca and Sr.
Figure 4.5 (a) shows cleavage pattern typical of brittle fracture while Figure 4.5 (b)
shows few dimples along with the cleavage pattern. On the other hand, Figures 4.5
(c)-(e) show more dimples, a characteristic of ductile fracture. Though very fine
eutectic Si and more dimples are observed with 0.05% Ca, impact strength is almost
the same as that of 0.01 % Ca added sample. This is attributed to the detrimental effect
of AI-ea-Si intermetallics at higher calcium content.
4.1.3 Summary
1. The optimum level of Ca required for modification so as to get the best
mechanical properties lies in the range 0.01-0.02%.
2. Like Sr, higher amount of Ca also leads to the formation of higher porosity
and AI-Ca-Si intermetallics.
3. At 0.02% addition, Sr shows more porosity than Ca.
4. The properties obtained with Ca modification are at par with those obtained
with the well known modifier viz., Sr.
82

Figure 4.5: SEM micrographs showing the impact fracture surface of AI-7Si-0.3Mg alloy with and without Ca (a) 0% Ca (b) 0.01 % Ca (c) 0.02% Ca (d) 0.05% Ca and (e) 0.02% Sr
83

4.2 IRON NEUTRALIZATION
4.2.1 Methodology
Al-7Si-0.3Mg-xFe (x = 0.2 - 0.7%) alloys were prepared in a 20 kg capacity
crucible using AL T AB Fe compact (75% Fe and 25% AI). For each experiment,
about 3 kg of the alloy of known iron content was melted in a clay-graphite crucible
of 5 kg capacity using an electric resistance furnace. The melt was subjected to
fluxing and degassing using commercially available fluxes and degassing tablets
respectively. The required amount of calcium in the form of AI-l 0% Ca master alloy
was immersed in the melt at 1003 K using coated and preheated plunger and stirred
for 2-3 minutes to enable complete dissolution and homogenization and the melt was
held at this temperature for about 20 minutes (holding time). The casting, heat
treatment and testing procedures are given in chapter 3. The melt was cast into both
cylindrical and rectangular shapes, whose dimensions are given in Figure 3.2.
4.2.2 Results
4.2.2.1 Microstructure
Figures 4.6 (a) and (b) show the typical permanent mould as cast
microstructures of Al-7Si-0.3Mg alloy with 0.4 and 0.7wt.% Fe contents respectively.
It is seen that the microstructure consists of a large number of platelet Fe
intermetallics, platelet eutectic Si and primary aluminium. Further, it has been
observed that the size and volume fraction of the B phase increases with increasing
iron content. The platelet p-phase has been confirmed as AIsFeSi by SEMlEDX
analysis (Figure 4.7), which agrees well with the reported results.4, 8
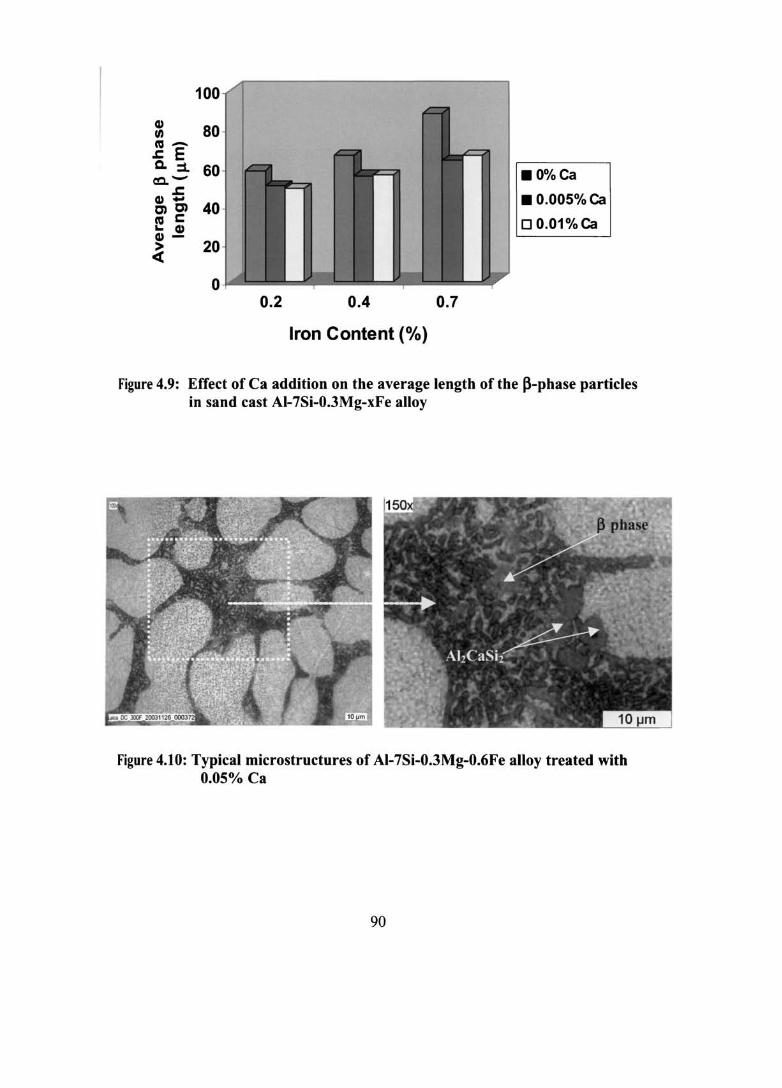
Figures 4.8 (a-d) show the typical sand cast microstructures of AI-7Si-0.3Mg
xFe (x = 0.2 and 0.7%) alloys without and with calcium addition. As observed in the
permanent mould cast samples, the size and volume fraction of the p-phase increases
when the iron content is increased from 0.2 to 0.7wt.%. This observation has also
been confirmed by the significant increase in the average length of the p-needles
measured by image analysis with increasing iron content (Figure 4.9). It can also
be seen that Ca addition reduces the size of the platelets, which is again confirmed by
84

(a)
(b)
Figure 4.6: Typical permanent mould as cast microstructures of AI-7Si-0.3Mg alloy with (a) 0.4 and (b) 0.7% Fe
85

IUlLT
(a)
2.10 2.10 3,50 '.20 '.10 1.10 '.30 1.00 7.'
(b)
Figure 4.7: (a) SEM photograph of ~-phase in AI-7Si-O.3Mg-O.7Fe alloy and (b) EDS spectra showing the distribution of AI, Si and Fe
86

(b)
(c) (d)
Figure 4.8: Typical microstructures of sand cast AI-7Si-0.3Mg alloy with (a) 0.2% Fe, (b) 0.7% Fe, (c) 0.2% Fe + 0.01 % Ca and (d) 0.7% Fe + 0.01 % Ca in the as-cast condition
87

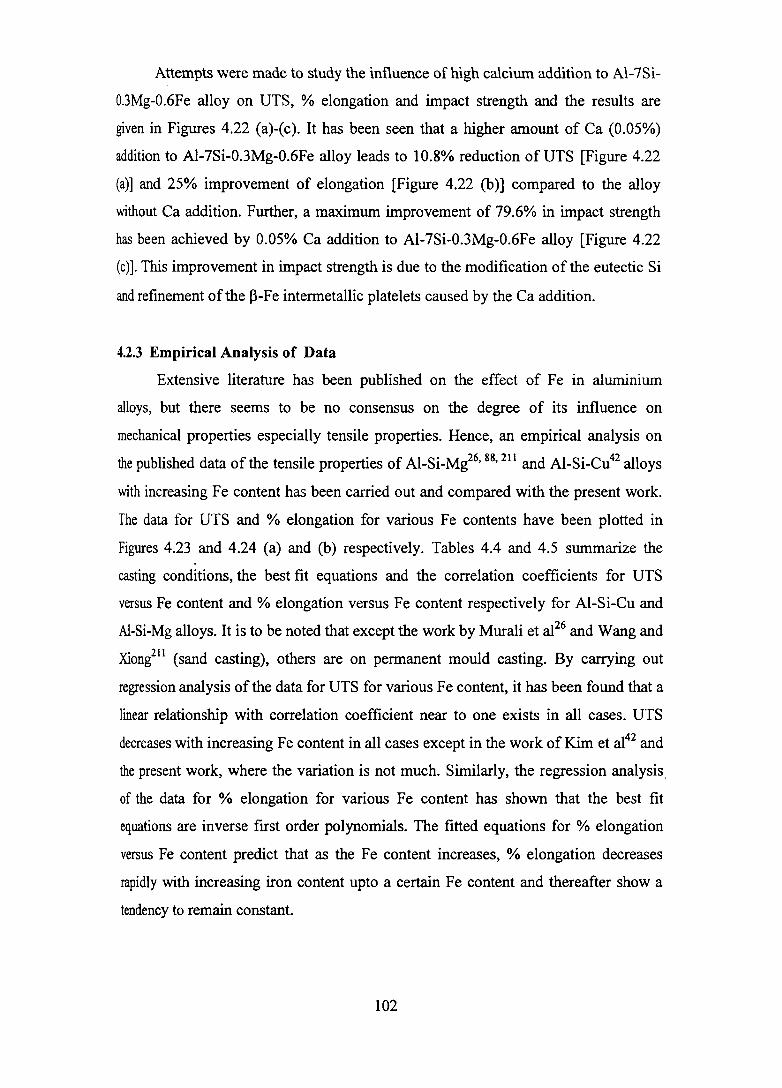
image analysis (Figure 4.9). Further, it has been observed that a higher amount of
Ca (0.05%) addition to AI-7Si-0.3Mg-0.6Fe alloy reduces the size of the platelet Fe
intennetallics to very fine form (Figure 4.10). It has also been seen that [me 13-platelets are precipitated along with the eutectic Si as clearly shown in the SEM
micrograph (Figure 4.11). Moreover, precipitation of AJ-Si-Ca intermetallic has also
been observed (Figure 4.10) which has been identified by SEMlEDX as AhCaSh
(Figure 4.12). This result is in agreement with the observations of Ware et al270 that
Ca-containing intermetallics form at high levels of Ca addition.
The eutectic Si in untreated alloys [Figures 4.6 and 4.8 (a) and (b)] is in coarse
acicular and platelet form, while it is in fine fibrous form in the alloys treated with
calcium [Figures 4.8 (c) and (d) and 4.10]. This shows the modification effect of
calcium. Quantification of the silicon particle characteristics in the as cast Ca added
alloys using image analysis could not be done because of the formation of eutectic Si
in networks of fibrous form, wherein the identification of individual Si is difficult.
The microstructures of AI-7Si-0.3Mg-xFe alloys with and without Ca in T6 condition
are shown in Figures 4.13 (a) and (b). The eutectic Si particles are more spheroidized
by Ca additi<?n [Figure 4.13 (b)], although they are spheroidized to some extent by T6
treatment. This observation has been confirmed by quantitative image analysis and
the various parameters measured are given in Table 4.2.
Table 4.2: Silicon particle characteristics of T6-heat treated samples
Silicon particle Al-7Si-0.3Mg-0.7Fe Al-7Si-0.3Mg-0.7Fe + characteristics Alloy 0.01 % Ca alloy
Length (J.Ull) 5.83 ± 3.41 5.42 ± 3.54
Breadth (Jlm) 3.56 ± 1.47 3.40 ± 1.67
Aspect Ratio 1.61 ± 0.44 1.55 ± 0.41
Equivalent diameter (Jlm) 4.12 ± 1.68 3.89± 1.89
The ± value in each case represents the standard deviation
88

Figure 4.14 shows the EBSD mapping result with back-scattered electron
image of AI-7Si-0.3Mg-0.2Fe+0.01 % Ca sample. If the crystallographic orientation
of neighbouring grains of aluminium in eutectic and primary dendrite is less than 5°,
the colour of mapping images is identical. The presence of many grains with different
orientations in eutectic area of Ca modified specimen (Figure 4.14) indicates the
existence of more than 5° orientation difference between neighbouring grains. It is
expected that neighbouring aluminium and silicon in the eutectic display the same
orientation. The EBSD patterns from aluminium and silicon are very similar since
aluminium has a fcc structure and silicon has a diamond structure. In the case of the
present measurement, the EBSD program was set for indexing of aluminium EBSD
patterns. This mapping result is in good agreement with the results of Nogita et al166
and Ware et af70. This shows the direct evidence of nucleation of the eutectic
heterogeneously in the interdendritic liquid and not from the primary dendrites.
Further, this suggests that the eutectic nucleated separately in the interdendritic melt,
but silicon and aluminium in the eutectic would still be expected to have a common
solidification interface.
4.2.2.2 Physical Characteristics
Porosity
The porosity of the sand cast cylindrical samples of AI-7Si-0.3Mg-xFe alloys
were calculated as per the details given in chapter 3. Figure 4.15 shows the effect of
various amounts of calcium on the porosity of Al-7Si-0.3Mg-xFe alloys and Table 4.3
gives the linear fit equations and the corresponding correlation coefficients. It can be
observed that the porosity level of the alloy increases as the iron content increases
from 0.2 to 0.7% for all calcium levels linearly with a correlation coefficient near to
1.0 for unmodified and 0.005% Ca added alloys. For the samples treated with 0.01 %
Ca, it appears that the porosity increases for 0.2-0.4% Fe and then remains constant
for 0.4-0.7% Fe. Hence, the fitted equation shows a lower coefficient of correlation of
0.8. Except for the 0.4% Fe + 0.01% Ca sample, the other calcium containing samples
showed lower porosity levels than the unmodified samples for each iron level. The
porosity for 0.2, 0.4 and 0.7% Fe containing alloys is consistently reduced by the
addition of 0.005% Ca, which may be attributed to the degassing effect produced
by low levels of calcium. Beyond this critical level of Ca, Ca containing oxide film
89
100
~ 80 co-.r. E Q. ::1. 60 co.. -
J:
& 0, 40 co s:::: ~ Q)
Q) - 20 ~
o 0.2 0.4
Iron Content (%)
0.7
.0%Ca
• 0.005% ca
o 0.01%ca
Figure 4.9: Effect of Ca addition on the average length of the ~-phase particles in sand cast AI-7Si-0.3Mg-xFe alloy
Figure 4.10: Typical microstructures of AI-7Si-0.3Mg-0.6Fe alloy treated with 0.05% Ca
90

Figure 4.11: SEM micrograph showing very fine Fe intermetallic phases in AI-7Si-0.3Mg-0.6Fe alloy with Ca (0.05%) addition
2.'0 ].10 ).10
Figure 4.12: (a) SEM micrograph showing the formation of AhCaSh phase in AI-7Si-0.3Mg-0.6Fe alloy with Ca (0.05%) addition (b) EDS spectrum showing AI, Si and Ca distributions.
91

(a) (b)
Figure 4.13: Typical microstructures of permanent mould cast AI-7Si-0.3MgO.7Fe alloy in T6 condition (a) without and (b) with 0.01 % Ca
Figure 4.14: EBSD mapping results of AI-7Si-0.3Mg-0.2Fe+0.Ol % Ca alloy
92

5.0,-------------------------------------~--_.
4.5
~ 4.0
'; ~ o a. 3.5 ?!-
3.0
• .0%Ca
I*------e 0.005% C ...
..... --...... 0.01% Ca
0.2 0.3 0.4 0.5 0.6 0.7 0.8
Iron content (wt.%)
Figure 4.15: Effect of Ca on the % porosity of AI-7Si-O.3Mg-xFe alloy
Table 4,3: Fitted equation and the correlation coefficient for the plot of % porosity versus % Fe content at various Ca levels
Amount of Fitted equation Correlation calcium (wt. %) coefficient, R2
0 % Porosity = 2.9998 + 2.5490 (% Fe) 0.9914
0.005 % Porosity = 2.1539 + 1.9571 (% Fe) 0.9609
0.01 % Porosity = 2.6698 + 3.1766 (% Fe) 0.7976
93

might have caused ruptures in the usually protective AhO) oxide film, leading to
I faster pickup of hydrogen. Figures 4.16 (a) and (b) are the optical and SEM
micrographs of platelet/needle like Fe intermetallic compound observed inside a
shrinkage pore in AI-7Si-0.3Mg-0.7Fe alloy.
Electrical conductivity
Figure 4.17 shows the effect of calcium on the electrical conductivity (in
%IACS) of AI-7Si-0.3Mg-xFe alloys. In the case of low Fe (0.2%) containing alloy,
conductivity increases with increasing calcium addition. This is due to the
modification of eutectic Si by Ca addition, which allows easier flow of electrons
compared to the untreated alloy, where the platelet morphology of eutectic Si poses
serious impediment to the flow of electrons. However, in the case of 0.4% iron
containing alloy, conductivity initially increases and then decreases with increased Ca
level. On the other hand, the conductivity of 0.7% iron containing alloy reduces with
increasing calcium content. The reasons for these observations are not fully
understood and may be attributed to the higher amount of porosity (Figure 4.16)
present in these samples.
4.2.2.3 Mechanical Properties
Tensile properties
Tensile testing was carried out on samples machined from the permanent
mould castings. Figure 4.18 shows the tensile properties of the alloys in the T6 heat
treated condition. It can be observed that the ultimate tensile strength CUTS) increases
marginally (2.2% improvement) as the Fe content increases from 0.2 to 0.4% for the
alloys without Ca addition. However, the UTS for the higher Fe content (0.7%)
sample remains the same as that of the 0.2% Fe alloy. Comparing the tensile strengths
0[0.2,0.4 and 0.7wt% Fe containing alloys treated with and without Ca addition, the
tensile strength is decreased slightly with Ca addition.
Figure 4.18 (b) shows a drastic decrease (74.3%) in % elongation of the alloys
without Ca addition as the Fe content is increased from 0.4 to 0.7%. This effect is due
to the increased amounts of (3-Fe intermetallic platelets dispersed throughout
the microstructure at higher Fe contents, leading to crack initiation and rapid crack
94

(a)
(b)
Figure 4.16: Micrographs of platelet/needle like Fe intermetallic compound observed within a shrinkage pore in AI-7Si-O.3Mg-O.7Fe alloy (a) Optical and (b) SEM
95

37
-rJ)
u ~ 36
eft. -~ :~ 35 .. (.) :::l "C c: o 34 (J
co (.) ·c t) 33 ~ W
0.0 0.1 0.2
•
.--~
0.3 0.4 0.5
Iron Content (wt.%)
• 0% Ca • 0.005% Ca ... 0.01% Ca
•
•
0.6 0.7
Figure 4.17: Effect of Ca on the %IACS of AI-7Si-O.3Mg-xFe alloy
96

350
300
~ 250 ~
uf 200 I-::J
150
100
8
c 0 :t:I
6 ca C)
4 c 0 W
~ 2
0
0
0.2 0.4 0.7
Iron conte nt, (wt. %)
(a)
0.2 0.4 0.7
I ron Content, (wt. 0/0)
(b)
.0%Ca
.0.005% Ca
00.01% Ca
.0%Ca
.0.005% Ca
00.01% Ca
Figure 4.18: Effect of Ca addition on the (a) UTS and (b) % elongation of AI-7SiO.3Mg-xFe alloy (T6 condition)
97

propagation in the alloy. The addition of Ca has improved the elongation of 0.2, 0.4
and 0.7% Fe containing alloys. The addition of 0.005% Ca to the 0.2,0.4 and 0.7% Fe
~loys leads to a 17, 12 and 22% improvement in % elongation respectively. Addition
of 0.01% Ca improved the % elongation by 18, 14 and 44% respectively compared to
the unmodified alloy. These observations are supported by the microstructural
observations on modification of eutectic Si and refinement of p-platelets with Ca
addition.
Figure 4.19 shows the SEM micrographs of the fractured surface of tensile
samples. At low Fe contents (0.2 and 0.4%) [Figures 4.19 (a)-(c)], there is no
significant difference in the fracto graphs of AI-7Si-0.3Mg-xFe alloys with and
without Ca. These fracto graphs exhibit dimpled structure typical of ductile fracture.
However, the embrittling nature of the p-platelets is evident in high Fe content (0.7%)
alloy [Figure 4.19 (d)].
The quality index (Qi71 values for the alloys have also been calculated using
the following equation and plotted in Figure 4.20.
Quatity index (Q) = UTS + 150 log (% elongation) ............... (5)
Higher the Q-value, the material will be both strong and ductile. It is seen from the
Figure that the quality index increases with increasing iron from 0.2 to 0.4% and then
decreases rapidly with further increase in iron to 0.7%. This is due to the rapid
decrease in the % elongation as the iron content increases from 0.4 to 0.7% [Figure
4.18 (b)] indicating that the quality index represents the relative ductility of the
material. Further, the higher Q-value with Ca addition compared to untreated alloys is
due to the improved % elongation with Ca addition.
Impact strength
Figure 4.21 shows the impact strength of Al-7Si-0.3Mg-xFe alloys with and
without Ca addition. It is seen that Ca addition significantly improves the impact
strength of the alloys compared to the untreated alloys. Improvement in impact
strength obtained in the 0.2, 0.4 and 0.7% Fe containing alloys with Ca addition are
44, 48 and 16% respectively.
98

Figure 4.19: SEM micrographs showing the tensile fractured surface of AI-7Si-0.3Mg alloy (T6 condition) containing (a) 0.2% Fe (b) 0.2%Fe + 0.005% Ca (c) 0.4% Fe + 0.01 % Ca and (d) 0.7% Fe + 0.005% Ca
99

460
440 lr;; •
>< 420 Q) 'C I:
~ 400
C'CI ::::J -----0% Ca a 380 ----..- 0.005% Ca
----A- 0.01 % Ca
360 •
340 0.2 0.3 0.4 0.5 0.6 0.7
Iron Content, (wt.%)
Figure 4.20: Effect of Ca on the quality index of AI-7Si-0.3Mg-xFe alloy in T6 condition
100

3.
N 3 E u ::; 2.5 ~
0, 2 c: ! u; 1.5 .. g 1 Q.
§ 0.5
o 0.2 0.4
Iron Content, (wt. %)
0.7
.0%Ca
• 0.005% Ca
00.01% Ca
Figure 4.21: Effect of Ca on the impact strength of AI-7Si-O.3Mg-xFe alloy
101
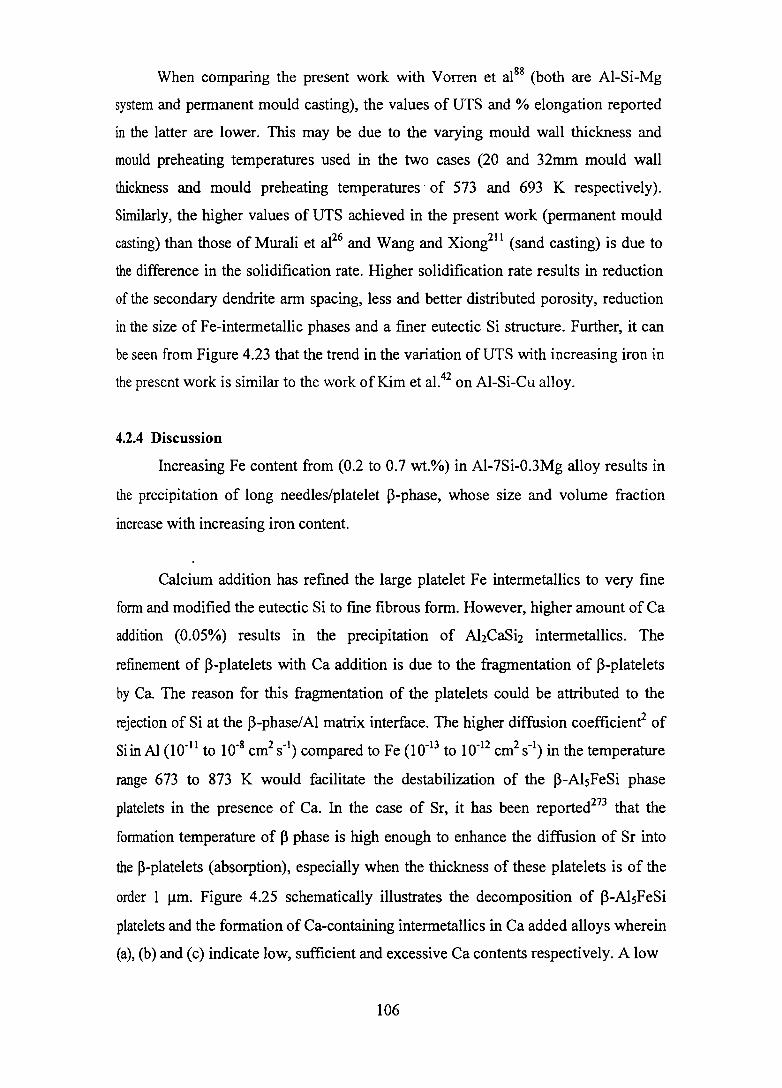
Attempts were made to study the influence of high calcium addition to Al-7Si-
0.3Mg-0.6Fe alloy on UTS, % elongation and impact strength and the results are
given in Figures 4.22 (a)-(c). It has been seen that a higher amount of Ca (0.05%)
addition to Al-7Si-0.3Mg-0.6Fe alloy leads to 10.8% reduction of UTS [Figure 4.22
(a)] and 25% improvement of elongation [Figure 4.22 (b)] compared to the alloy
without Ca addition. Further, a maximum improvement of 79.6% in impact strength
has been achieved by 0.05% Ca addition to Al-7Si-0.3Mg-0.6Fe alloy [Figure 4.22
(c)]. This improvement in impact strength is due to the modification of the eutectic Si
and refinement of the p-Fe intermetallic platelets caused by the Ca addition.
4.2.3 Empirical Analysis of Data
Extensive literature has been published on the effect of Fe in aluminium
alloys, but there seems to be no consensus on the degree of its influence on
mechanical properties especially tensile properties. Hence, an empirical analysis on
the published data of the tensile properties of AI-Si-Mg26, 88, 211 and Al-Si-Cu42 alloys
with increasing Fe content has been carried out and compared with the present work.
The data for UTS and % elongation for various Fe contents have been plotted in
Figures 4.23 and 4.24 (a) and (b) respectively. Tables 4.4 and 4.5 summarize the
casting conditions, the best fit equations and the correlation coefficients for UTS
versus Fe content and % elongation versus Fe content respectively for AI-Si-Cu and
Al-Si-Mg alloys. It is to be noted that except the work by Murali et al26 and Wang and
Xiong211 (sand casting), others are on permanent mould casting. By carrying out
regression analysis of the data for UTS for various Fe content, it has been found that a
linear relationship with correlation coefficient near to one exists in all cases. UTS
decreases with increasing Fe content in all cases except in the work of Kim et al42 and
the present work, where the variation is not much. Similarly, the regression analysis.
of the data for % elongation for various Fe content has shown that the best fit
equations are inverse first order polynomials. The fitted equations for % elongation
versus Fe content predict that as the Fe content increases, % elongation decreases
rapidly with increasing iron content upto a certain Fe content and thereafter show a
tendency to remain constant.
102

350
300 ca a. 250 ~
en 200 I-:::J
150
100
2
s::: 1.5 0 ~ ca en 1 s::: .2 w ~ Cl
0.5
0
Ne 3
C)
:::;
.£ 2 Cl c: I!! -rn ti 1 ('Cl
Co e
o
A B Alloy code
(a)
A B Alloy code
(b)
A B Alloy code
(c)
Figure 4.22: Effect of higher amount of Ca (0.05%) on the (a) UTS (b) % elongation and (c) impact strength of AI-7Si-0.3Mg-0.6Fe alloy (T6 condition) {A= AI-7Si-0.3Mg-0.6Fe and B= A + 0.05% Cal
103

Mcr~------------------------------------~I
360
340
320
(tt a. 300 6 (f) 280 ~
260
24Q
22Q
°0
o
• • .... _ .. _ .. _ .. _. _.'- '- '- -
• • • -• ---.eo-. --c.-_~ -o
"'0. .... -
. . 42 -•. --. Kim et al. 8B '0- - ..... 0 Vorten"efal. y - -_.y Ml!raJ!etal:26 211 A ,· .. · ..... A, Wang andXlCing •. _ .. -. Presentwork
-r.._ -J!!.
~0+---~.r---~-----r----~----~.--~r----4
0.0 0.2 0.4 0.6 O.S 1.0 1.2 1.4
Iron content (wt%)
Figure 4.23: Empirical analysis of the variation of UTS with iron content in AI-Si-Mg and AI-Si-Cu alloys
Table 4.4: Empirical analysis of data for UTS versus Fe content
Investigator Alloy Casting UTS Vs Fe (Linear fit)
Best fit equation Correlation coefficient, R2
Kim et al'!": Al-Si-Cu PM UTS= -15.8(%Fe)+324.2 0.9996
Vorren et al lSlS Al-Si-Mg PM UTS= -49.7(%Fe)+318.8 0.9990
Murali et al":!> Al-Si-Mg SM UTS= -39.9(%Fe)+25 1. 1 0.9996
Wangand Xiong211
AI-Si-Mg SM UTS= -65.2(%Fe)+286.8 0.9999
Present work Al-Si-Mg PM UTS= -15.l(%Fe)+360.7 0.9997
[PM = Permanent Mould; SM = Sand Mould]
104

12~--------------, 8~--------------------~
10
o
0.. \
• •
·_Pr __
a· - -0 Vorren et al~
2' 0' ..... 0()
0.0 0.2
~- . o ----0
0.4 0.6
Iron content (wt%)
(a)
• 0.8 1.0 1.2
7
6
c: o S
"" to
g 4 "i: .,. 3
2
0 0.0 0.2 0.4
.... ~ "" ..
0.8
_ lWnet,i2 O· - -0 M.iaI;.t Bi..2~ 'f'''''''f' Present~
...... . ,
Q.8 1.0
Iroll content ('M%}
(b)
Figure 4.24: Empirical analysis of the variation of % elongation with iron content in AI-Si-Mg and AI-Si-Cu alloys
Table 4.5: Empirical analysis of data for % elongation versus Fe content
Investigato,r Alloy Casting % Elongation Vs Fe (polynomial fit)
1.2
Best fit equation Correlation coefficient, R2
Kim et al42 AI-Si-Cu PM %Elongation = 1.5766+ 0.2295
(%Fe) 0,9995
Vorren et aI88 AI-Si-Mg PM %Elongation = -0.2781 + 0.4966
(%Fe) 0_9296
Murali et af6 AI-Si-Mg SM %Elongation = 2.4834+ 0.5931
(%Fe) 0.9991
Present work Al-Si-Mg PM %Elongation = 0.2663+ 1.3392
(%Fe) 0.8402
[PM = Pennanent Mould; SM = Sand Mould]
105
When comparing the present work with Vorren et al88 (both are AI-Si-Mg
system and permanent mould casting), the values of UTS and % elongation reported
in the latter are lower. This may be due to the varying mould wall thickness and
mould preheating temperatures used in the two cases (20 and 32mm mould wall
thickness and mould preheating temperatures· of 573 and 693 K respectively).
Similarly, the higher values of UTS achieved in the present work (permanent mould
casting) than those of Murali et af6 and Wang and Xiong211 (sand casting) is due to
the difference in the solidification rate. Higher solidification rate results in reduction
of the secondary dendrite arm spacing, less and better distributed porosity, reduction
in the size of Fe-intermetallic phases and a fmer eutectic Si structure. Further, it can
be seen from Figure 4.23 that the trend in the variation of UTS with increasing iron in
the present work is similar to the work ofKim et a1.42 on AI-Si-Cu alloy.
4.2.4 Discussion
Increasing Fe content from (0.2 to 0.7 wt.%) in AI-7Si-0.3Mg alloy results in
the precipitation of long needles/platelet B-phase, whose size and volume fraction
increase with increasing iron content.
Calcium addition has refmed the large platelet Fe intermetallics to very fine
fonn and modified the eutectic Si to fine fibrous form. However, higher amount of Ca
addition (0.05%) results in the precipitation of AhCaSh intermetallics. The
refinement of ~-platelets with Ca addition is due to the fragmentation of ~-platelets
by Ca. The reason for this fragmentation of the platelets could be attributed to the
rejection of Si at the ~-phase/ Al matrix interface. The higher diffusion coefficient2 of
Si in AI (10.11 to 10.8 cm2 S·I) compared to Fe (10.13 to 10.12 cm2 S·I) in the temperature
range 673 to 873 K would facilitate the destabilization of the ~-AI5FeSi phase
platelets in the presence of Ca. In the case of Sr, it has been reported273 that the
fonnation temperature of ~ phase is high enough to enhance the diffusion of Sr into
the ~-platelets (absorption), especially when the thickness of these platelets is of the
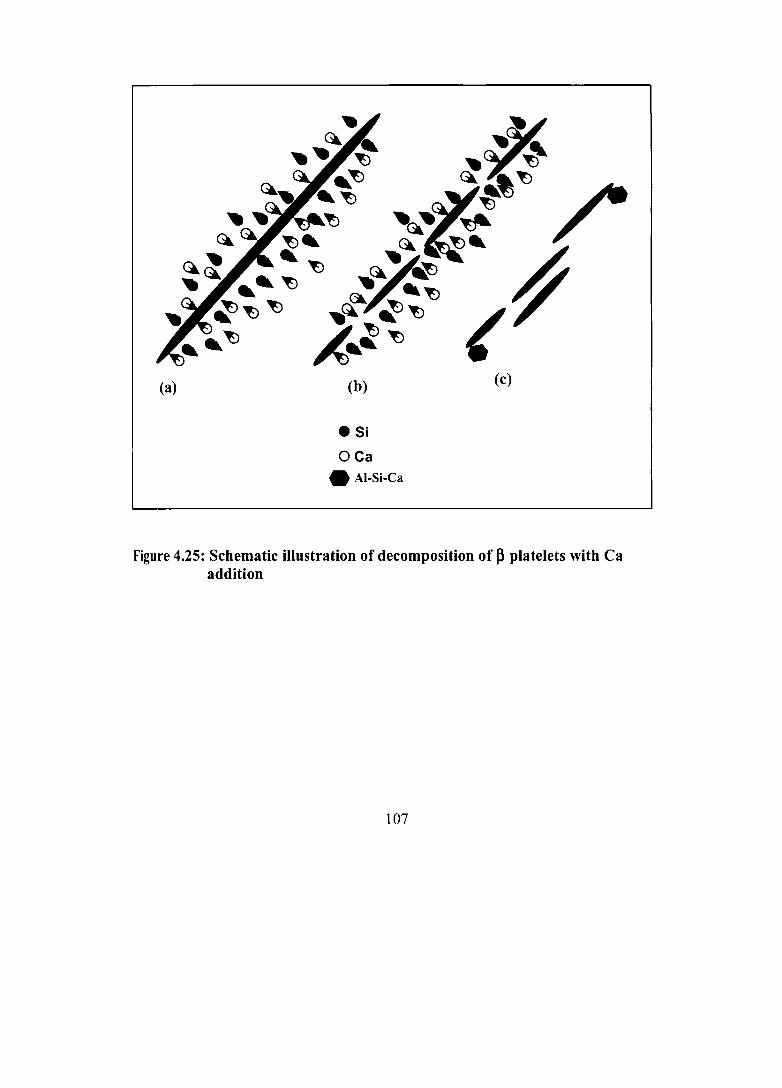
order I Ilm. Figure 4.25 schematic ally illustrates the decomposition of ~-Al5FeSi
platelets and the formation of Ca-containing intermetallics in Ca added alloys wherein
(a), (b) and (c) indicate low, sufficient and excessive Ca contents respectively. A low
106
·Si
OCa • Al-Si-Ca
Figure 4.25: Schematic illustration of decomposition of ~ platelets with Ca addition
107

level of calcium induces no changes in the I3-AIsFeSi platelets, whereas a sufficient
amount of Ca content leads to fragmentation of the I3-AlsFeSi platelets. On the other
hand, an excessive amount of Ca will lead to fragmentation of the I3-AIsFeSi platelets
and precipitation of Al-Ca-Si intennetallic phase respectively. As this intennetallic
phase is seen to be attached to the sides or the end of the l3-phase platelets, it could be
assumed that the Si rejected from the latter reacts with the Ca in the surrounding area,
leading to the fonnation of the AhCaSh particles. This has been further confinned by
the SEMlEDS analysis (Figure 4.12) of the AI-7Si-0.3Mg-0.6Fe alloy where the Al
Ca-Si compound is seen to be attached to the side of the l3-phase platelets. This is
further supported by the work of Samuel et a1 19s, 273 on Sr addition to 6111 (Al
O.65Si-0.32Fe-0.86Cu-0.21 Mn-0.89Mg-0.048Cr) and 319 (Al-6.2Si-3.7Cu) alloys.
It has been observed that the % porosity of the alloy increases as the iron
content increases from 0.2 to 0.7wt.%. This may be due to the difficulty in the
feeding of the liquid metal due to the presence of large intercepting l3-platelets. This
result is in accordance with the work of Samuel et al19s on the effect of trace elements
on ~-AlsFeSi characteristics, porosity and tensile properties of 319 (AI-6.2Si-3.7Cu)
alloy. I3-Fe platelets are often found to be associated with shrinkage pores,273, 274 and
this observation is understood to be the direct result of their effect in increasing
restrictions to feeding through the small interdendritic channels in the later stages
of feeding. It has been reported274 that the platelets are observed to fonn as an
interlocking network and grow around pre-existing features in the microstructure.
These relatively large and long l3-platelets intersect and reduce the size of the
interdendritic feeding paths, limiting feeding and thus increasing the driving force for
pores to fonn.
It is interesting to note that the % porosity of 0.2, 0.4 and 0.7% Fe containing
alloys is reduced with 0.005% Ca addition. This may be due to the degassing effect of
calcium at low levels. This is supported by the work of Velasco et al. 104 There are
several mechanisms that have been proposed to explain the changes in porosity that
occurs as a result of adding eutectic modifiers to AI-Si alloys. First, the porosity
fonnation at various Ca levels may be explained by the recent theory I 58 that porosity
108

fonnation in hypoeutectic AI-Si alloys is strongly dependent on the eutectic
solidification mode. EBSD analysis of the Ca-containing sample in the present work
indicates that the eutectic nucleates in the interdendritic liquid away from the primary
aluminiwn/liquid interface and the eutectic evolves with a front growing in a direction
opposite to the thermal gradient, while in unmodified alloys the eutectic nucleates
with a very high nucleation frequency adjacent to the dendrite tips throughout the
sample. This is further supported by the results of Knuutinen et al.130 showing a direct
relationship between porosity and eutectic solidification mode in A356 alloy treated
with different levels of Ba, Ca, Y and Yb. The principle implies the impact of the
different modes of eutectic solidification and thus spatial distribution of evolving
eutectic on the interdendritic permeability in the final stages of solidification. Such
considerations therefore account for the overall solidification and feeding occurring in
the sample, thus determining the overall feedability and feeding requirements of
different regions of the casting. Therefore, at the intermediate Ca level (0.005%), the
eutectic may display a mixed eutectic solidification mode, ie. between that of the
unmodified and Ca modified alloys, thus leading to a minimum of porosity for this
particular c~ting with its solidification and feeding pattern. The role of feeding
direction and influence of eutectic solidification mechanisms have been discussed in
detail by Dinnis et al?75 Secondly, In the case of Sr modified AI-Si melts, it has been
reported that Sr does not alter the regassing rate of melts and it can react with
hydrogen in the melt and precipitate as hydrides.268 Since the values for free energy of
formation of SrH2 and CaH2 are of the same order viz., -61.15 and -61.70 kJmor\
respectively,276 like Sr, Ca at very low levels may also react with the hydrogen
present in the melt and form solid hydride particles, reducing the amounts of free
hydrogen that can cause porosity. This could possibly explain the reduction of
porosity for the 0.005% of Ca addition. However, further evidence is required to
confirm such a hypothesis. Beyond this critical level of Ca, Ca containing oxide film
might have caused ruptures in the usually protective Ah03 oxide film, leading to
faster pickup of hydrogen. The increased porosity at 0.01 % Ca may be due to the
increased melt affinity for gas absorption.
109

The increase in electrical conductivity with calcium addition can be attributed
to the modification of eutectic Si by Ca addition, which allows easier flow of
electrons when compared to the untreated alloy, where the eutectic Si in platelet fonn
acts as an impediment to the flow of electrons.
4.2.5 Summary
1. Ca addition has dual role modifier of the eutectic Si and refiner of the long
platelet I3-Fe phases. The proposed mechanism of Fe-neutralization by Ca is
the destabilization of the l3-platelets and fragmentation of the long l3-platelets
into smaller sizes.
2. A low amount of Ca (0.005%) has reduced the porosity of the alloy probably
due to the trapping of hydrogen as calcium hydride.
3. Higher Ca levels lead to faster pickup of hydrogen, probably due to the
rupture of the protective Ah03 oxide film by the Ca containing oxide film.
4. Electrical conductivity is increased with Ca addition due to the modification
of eutectic Si from acicular to fibrous fonn.
5. Ca addition has improved the % elongation of the alloy by 18, 14 and 44%
and tJIe impact strength by 44, 48 and 16% respectively at 0.2, 0.4 and 0.7%
Fe contents.
6. Higher amount of Ca (0.05%) addition reduces the size of the platelet Fe
intennetallics to very fine fonn. A maximum improvement of79.6% in impact
strength has been achieved by 0.05% Ca addition to AI-7Si-0.3Mg-0.6Fe
alloy. However, higher amount of Ca addition has led to the precipitation of
AhCaSh intennetallics and higher porosity in the castings.
7. An empirical analysis carried out for comparing the results of the present work
with those of the other researchers on the effect of increasing iron content on
VTS and % elongation of AI-Si-Mg and AI-Si-Cu alloys has shown a linear
and an inverse first order polynomial relationships respectively.
110