influencing factors on the actual usage of mobile phone
TRANSCRIPT
Global Review of Islamic Economics and Business, Vol. 7, No. 1 (2019) 001-019
Faculty of Islamic Economics and Business-State Islamic University Sunan Kalijaga Yogyakarta ISSN 2338-7920 (O) / 2338-2619 (P)
Influencing Factors on the Actual Usage of Mobile Phone Banking in the Shari’ah Banks:
A Survey in Palembang City, Indonesia
1Chandra Zaky Maulana, 2Yuyus Suryana, 3Dwi Kartini, 4Erie Febrian
1, 2, 3, 4Universitas Padjadjaran Bandung
Email: [email protected]
Abstract: This research was developed from a study conducted by Talukder, Quazi and Sathye
in 2014 whom were tried to discover mobile phone banking usage behavior of banks customers
in Canberra, Australia. A research model was set to find the relationship between independent
and dependent variables. Independent variables consisted of five variables, namely, Perceived
Usefulness (PU), Perceived Ease of Use (PEU), Trust (T), Social Influence (SI) and System
Quality (SQ), whilst the dependent variable is Actual Usage (AU) of Mobile banking in the
Shari’ah banks. Thus, making this research a multiple regression analysis. A survey was
conducted by distributing questionnaires to gather primary data from 126 respondents of Shari’ah
banks customers in Palembang City, South Sumatra Province, Indonesia. The findings show
evidence that there are positive and significant relationship between all independent variables and
the dependent variable. As such variable with the highest impact is PEU (30,3%) whilst the lowest
is SI (18%) meaning that perceived ease of use amongst customers of Shari’ah banks in
Palembang City gave the highest impact on their actual usage of mobile banking, compared to
social influence, which is lower. Therefore, it is recommended that Shari’ah banks in this city
should consider to put more attention in to providing their customers with a mobile banking
application which is easy to use as well as keeping it up to date with the needs of the customers.
As an implication to the providers, financial institutions can capitalize on the finding of this
research to enhance the ease of use of their application on mobile banking.
Keywords: Shari’ah Banks, Mobile Phone Bamking, Perceived Ease of Use, Trust, Social
Influence, Actual Usage.
Introduction
Mobile banking was launched for the first time in Indonesia by Excelkom at the end of
1995. The background of the launch of this banking service is that banks at that time were strived
to gather trusts from their customers by using technology. Technology was used by banks to
continuously improved the already existed service qualities. Mobile banking service is a chance
to offer value-added as incentives to banks’ customers.
Mobile banking is a service provided by banks which allows their customers to be able
to do banking transactions using cellular phones by using downloaded applications. The benefit
of using mobile banking is to maintain privacy between the banks and their customers, cost-
effective and also time effective since customers do not have to go to the banks’ offices or queuing
up at the ATM machines.
According to the Rules of Indonesian Financial Services Authority (OJK) No.
19/POJK.03/2014, concerning Branchless Financial Service in the matter of Inclusive Finance,
“mobile banking is a service to conduct banking transactions via cellular phones, as intended in
the stipulation regarding banks’ business activities based on core capital”.
There are some features that enable customers to conduct via mobile banking, such as
fund transfer, bill payments, etc. They can also use it to pay zakah, infaq and sadaqah. This leads
to customers’ convenience and they find it handy in using mobile banking to conduct their daily
financial transactions.
2 Maulana et al: Influencing Factors on the Actual Usage of Mobile Phone Banking in the Shari’ah Banks: A Survey in Palembang City, Indonesia
Association of Indonesian Financial Planners (APERKEI), projected that there are very
wide open opportunity for mobile banking users in Indonesia, considering internet users have
reached 132,7 million and mobile connection users are 318 million. Data from WeAreSocial Asia
2015 mentioned that Indonesia has 318 million users of mobile connection or 125% of the total
population. Whilst according to Bank Indonesia, as of May 2016, mobile banking users in four
major banks in Indonesia, BCA, BNI, BRI and Mandiri (including Shari’ah commercial and
subsidiary units) has only reached 23,65 million, indicating that mobile transaction users are still
very low. The mobile transaction will bring many benefits to society, particularly in the matter of
time and security. Time saved from mobile banking activities can be used to do other productive
and profitable activities.
OJK recorded e-banking (sms banking, phone banking, mobile banking, and internet
banking) users, has increased by 270% from 13,6 million in 2012 to 50,4 million in 2016. This
figure grew along with the change in society’s behavior and growing needs in using digital
technology for their banking activities.
In the same vein, the transaction frequency of e-banking users also grown by 169% from
150,8 million transactions in 2012 to 405,4 million transactions in 2016 (OJK, 2017). Considering
this phenomenon, OJK has called out to the banking industry whom has already implemented
digital banking services to establish digital branch as soon as possible, in the form of offices or
unit which specifically intended at providing and serve transaction with digital banking.
Technology in the financial sector (financial technology) is growing fast and is predicted
to be rapidly developing in 2020. Limited access to banking services is one of the reasons why
financial technology is intriguing for customers, specifically banks customers. Digitalization of
banking service facilitates customers to conduct their transactions by using computers or cellular
phones without having to go and queuing at the bank offices.
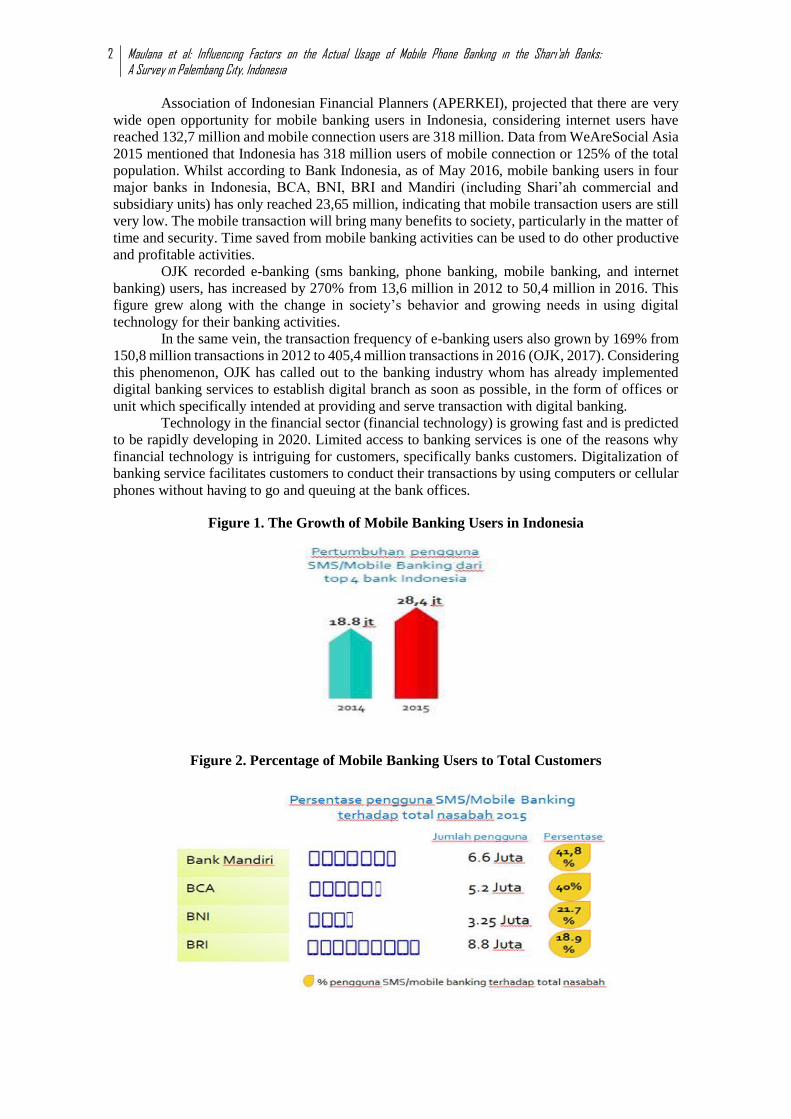
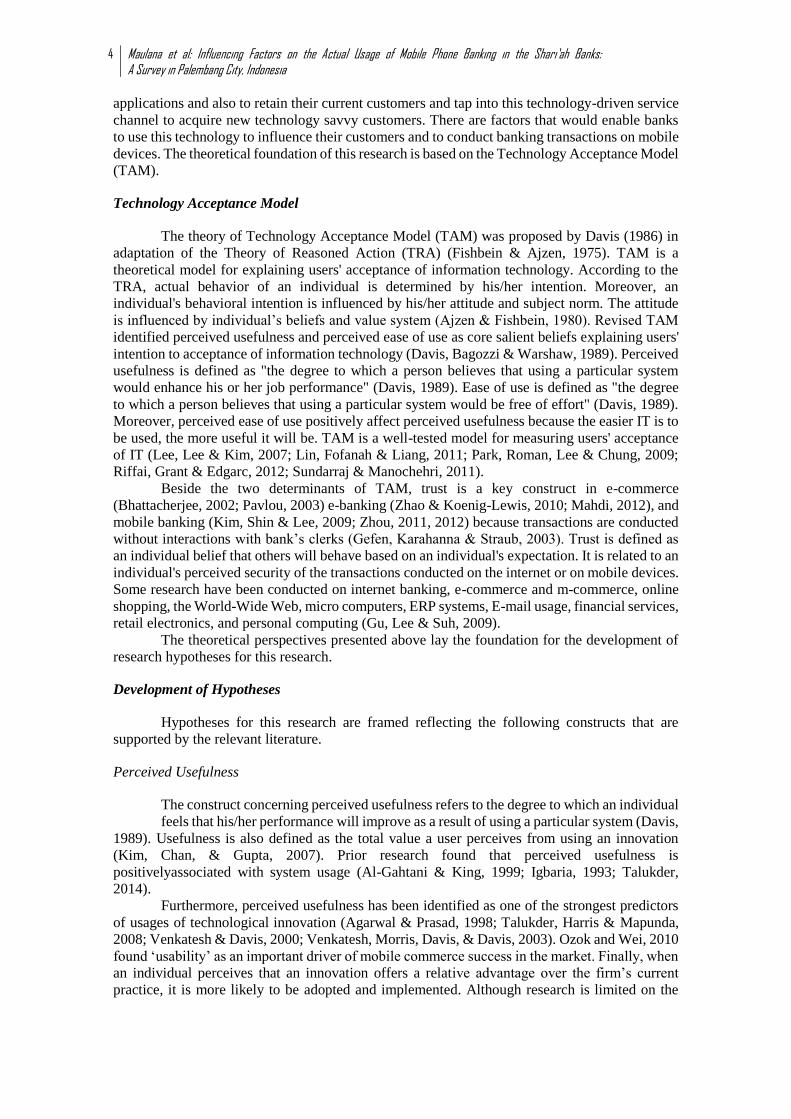
Figure 1. The Growth of Mobile Banking Users in Indonesia
Figure 2. Percentage of Mobile Banking Users to Total Customers

Global Review of Islamic Economics and Business, Vol. 7, No. 1 (2019) 001-019 3
The figures above showed the growth percentage of mobile banking users in Indonesia
from 50% in 2012, grew 58% in 2013, and 80% in 2014. This significant growth is a big
opportunity which must be continuously well managed and observed so that it will continue to be
used by prospective customers.
Figure 3. A Snapshot of the Country’s Digital Statistical Indicators
To the end of 2017, the amount of internet banking users in Indonesia is still low, yet
Bank Mandiri claimed that the growth of digital banking users is improving. Bank Mandiri
reported 94% or 3.067 billion of transactions were electronically conducted by customers, without
the assistance of tellers for the year of 2017. This fact is giving an opportunity to increase the
penetration of electronic transaction in Indonesia. Another survey conducted by the Association
of Indonesia Internet Service Provider (APJII) in 2017, reveals that only 7,39% internet users in
Indonesia accessing digital banking service. Internet users in Indonesia mostly use chatting
application (89,4%) and social media (87%).
This research is trying to conduct an empirical study in the field of Shari’ah bankings.
The reason is we are trying to discover the behavior of Shari’ah banks’ customers in adopting
mobile banking services, specifically in Palembang City, South Sumatra Province, Indonesia, as
the Shari’ah banks in this city is continue to grow over the past decade. One of the Shari’ah banks
providing mobile banking facility in Indonesia is BCA Syariah. They called their service BCA
Syariah Mobile, which giving their customers the ability to access all of their account portfolios
including financing account (single relationship model), besides other features such as bill
payment and insurance. This service launched in 2014, with 1.105 users and 3.176 transactions
generating a total of 3,1 billion IDR. This amount grew 50% every year, and in 2017 were used
by 8.790 users and recorded 43.189 transactions amounting more than 46 billion IDR. This
amount is increasing 56,84% from 29,34 billion IDR in 2016. The transaction volume is also
increased 52,53% from 28.315 to 43.189 transactions per day. Hence, there are still few
researches concerning the behavior of customers in adopting mobile banking services provided
by Shari’ah banking industry in Indonesia, in which we consider that such research is important
and still needed to be conducted.
Literature Review and Development of Hypotheses
Advancements in technology over the years have led many individuals to use technology
as a tool to get information and news, communicate, and purchase products or services online.
Just like the internet, mobiles phones also could be used to buy goods and services from anywhere
and at anytime. One of the new areas of service in the mobile technology is mobile banking. It
represents a challenge for financial service providers to launch their own mobile banking
4 Maulana et al: Influencing Factors on the Actual Usage of Mobile Phone Banking in the Shari’ah Banks: A Survey in Palembang City, Indonesia
applications and also to retain their current customers and tap into this technology-driven service
channel to acquire new technology savvy customers. There are factors that would enable banks
to use this technology to influence their customers and to conduct banking transactions on mobile
devices. The theoretical foundation of this research is based on the Technology Acceptance Model
(TAM).
Technology Acceptance Model
The theory of Technology Acceptance Model (TAM) was proposed by Davis (1986) in
adaptation of the Theory of Reasoned Action (TRA) (Fishbein & Ajzen, 1975). TAM is a
theoretical model for explaining users' acceptance of information technology. According to the
TRA, actual behavior of an individual is determined by his/her intention. Moreover, an
individual's behavioral intention is influenced by his/her attitude and subject norm. The attitude
is influenced by individual’s beliefs and value system (Ajzen & Fishbein, 1980). Revised TAM
identified perceived usefulness and perceived ease of use as core salient beliefs explaining users'
intention to acceptance of information technology (Davis, Bagozzi & Warshaw, 1989). Perceived
usefulness is defined as "the degree to which a person believes that using a particular system
would enhance his or her job performance" (Davis, 1989). Ease of use is defined as "the degree
to which a person believes that using a particular system would be free of effort" (Davis, 1989).
Moreover, perceived ease of use positively affect perceived usefulness because the easier IT is to
be used, the more useful it will be. TAM is a well-tested model for measuring users' acceptance
of IT (Lee, Lee & Kim, 2007; Lin, Fofanah & Liang, 2011; Park, Roman, Lee & Chung, 2009;
Riffai, Grant & Edgarc, 2012; Sundarraj & Manochehri, 2011).
Beside the two determinants of TAM, trust is a key construct in e-commerce
(Bhattacherjee, 2002; Pavlou, 2003) e-banking (Zhao & Koenig-Lewis, 2010; Mahdi, 2012), and
mobile banking (Kim, Shin & Lee, 2009; Zhou, 2011, 2012) because transactions are conducted
without interactions with bank’s clerks (Gefen, Karahanna & Straub, 2003). Trust is defined as
an individual belief that others will behave based on an individual's expectation. It is related to an
individual's perceived security of the transactions conducted on the internet or on mobile devices.
Some research have been conducted on internet banking, e-commerce and m-commerce, online
shopping, the World-Wide Web, micro computers, ERP systems, E-mail usage, financial services,
retail electronics, and personal computing (Gu, Lee & Suh, 2009).
The theoretical perspectives presented above lay the foundation for the development of
research hypotheses for this research.
Development of Hypotheses
Hypotheses for this research are framed reflecting the following constructs that are
supported by the relevant literature.
Perceived Usefulness
The construct concerning perceived usefulness refers to the degree to which an individual
feels that his/her performance will improve as a result of using a particular system (Davis,
1989). Usefulness is also defined as the total value a user perceives from using an innovation
(Kim, Chan, & Gupta, 2007). Prior research found that perceived usefulness is
positivelyassociated with system usage (Al-Gahtani & King, 1999; Igbaria, 1993; Talukder,
2014).
Furthermore, perceived usefulness has been identified as one of the strongest predictors
of usages of technological innovation (Agarwal & Prasad, 1998; Talukder, Harris & Mapunda,
2008; Venkatesh & Davis, 2000; Venkatesh, Morris, Davis, & Davis, 2003). Ozok and Wei, 2010
found ‘usability’ as an important driver of mobile commerce success in the market. Finally, when
an individual perceives that an innovation offers a relative advantage over the firm’s current
practice, it is more likely to be adopted and implemented. Although research is limited on the

Global Review of Islamic Economics and Business, Vol. 7, No. 1 (2019) 001-019 5 specific impact of perceived usefulness on mobile phone usage, exploration of the following
hypothesis may produce useful information to resolve this particular issue. Therefore, we have
proposed the following hypotheses:
H1: Perceived Usefulness has a positive and significant impact on actual usage of mobile phone
banking
Perceived Ease of Use
Perceived ease of use is defined as the degree to which mobile banking is perceived as
easy to understand and operate (Lin, 2011). Puschel et al. (2010) found that perceived ease of use
(PEOU) influences attitude towards mobile banking and this influences adoption and behavioral
intentions towards mobile banking besides continuing to use the service. Lin (2011) tested the
PEOU and its influence on adoption and asserted that PEOU in fact has a significant effect on
adoption or continuing to use mobile banking. The TAM consistently has shown that PEOU is
antecedent to perceived usefulness. Davis (1989) defines ease of use as the degree to which users
expect the target system to be free of effort. According to Karahanna, Agarwal and Angst (2006),
ease of use represents the perceived cognitive burden induced by technology. It is an assessment
of the mental effort involved when a new system is employed (Van der Heijden, 2004; Lee, Lee
& Kwon, 2004). It is the extent to which an individual believes that using mobile phone banking
would increase flexibility without too much effort. Ease of use would influence the intention and
thus ultimately relate to the actual use of the technology (Schepers & Wetzels, 2007; Lee, Kim,
Rhee & Trimi, 2006). Thus, the following hypothesis is proposed:
H2: Perceived Ease of Use has a positive and significant impact on actual usage of mobile phone
banking.
Trust
Trust is defined as the user's relative confidence in the mobile banking service itself. By
having trust, it means that the user perceives the service as trustworthy. Mobile banking adoption
by users has received attention by researchers. Zhou (2011) constructed a model to test the effect
of trust on flow experience and the actual usage of mobile banking. Eriksson, Kerem and Nilsson
(2005) have found trust has a positive effect on both perceived ease of use and perceived
usefulness. Chen and Chang (2012) found that perceived risk would negatively influence
perceived trust and purchase intention.
Perceptions of trust are likely to be important factors in predicting acceptance of mobile
phone banking. Research shows that privacy is the number one issue of concern facing the online
business environment (Benassi, 1999). Trust can be described as the belief that the other party
will behave in a socially responsible manner and by doing so, will fulfill the trusting party’s
expectations without taking advantage of its vulnerabilities (Gefen 2000). Trust has a positive
influence on the development of positive attitude, intention and consequently the usage of a new
system (Swan, Bowers & Richardson, 1999).
In this research, it is hypothesized that perceived trust would affect the actual usage of
mobile phone banking.
H3: Trust has a positive and significant impact on actual usage of mobile phone banking
Social Influence
Social influence is the extent to which members of a social group influence one another
person’s adoption of an innovation (Konana & Balasubramanian, 2005; Venkatesh & Brown,
2001). It is perceived pressure and influence that peers feel when adopting an innovation andthis
influence is exerted through messages and signals that help to form perceptions of thevalue of
6 Maulana et al: Influencing Factors on the Actual Usage of Mobile Phone Banking in the Shari’ah Banks: A Survey in Palembang City, Indonesia
innovation or activity (Fulk & Boyd, 1991). Ajzen and Fishbein (1980) refer to suchinfluences as
normative beliefs about the appropriateness of adoption of innovation.
According to this perspective, consumers may adopt an innovation not because of its
usefulness but because of perceived social pressure. Such pressure may be perceived as coming
from individuals whose beliefs and opinions are important, including peers and people who are
in social networks (Igbaria, Parasuraman, & Baroudi, 1996; Talukder, Quazi & Djatikusumo,
2013). According to Abrahamson and Rosenkopf (1997), it is a largelyinternal influence that
potential adopters exert on each other that persuades them to adopttechnological innovation.
Individuals very often are influenced by peers in the adoption of aninnovation. When peers
embrace an innovation, this may signal its importance and certainadvantages which eventually
motivate an individual to accept it. It has been suggested that social persuasion and
communication from peers are factors that influence the acceptance of an innovation (Davis,
Bagozzi, & Warshaw, 1989; Mirvis,Sales, & Hackett, 1991). Adoption of an innovation is also
affected by the social environment.
Communication between members of a social network can enhance the degree of
innovation adoption. The participation of individuals in an organization in informal networks
facilitatesthe spread of information about the innovation, which consequently influences the
probabilityof an adoption (Yi, Jackson, Park, & Probst, 2006; Talukder, Quazi & Keating, 2014).
Nodirection has been postulated apriori for the following hypothesis because social influencemay
have a positive or negative impact on the actual usageof mobile phone banking. Thehypothesis
below is therefore developed:
H4: Social Influence has a positive and significant impact on actual usage of mobile phone
banking
System Quality
System quality represents both the technical quality of the mobile system itself and the
quality of the information being provided to customers. Technical quality is concerned withthe
consistency of the user interface, system accessibility, ease of use, system reliability,
dataaccuracy, response time and system flexibility (Lin, 2008; DeLone & McLean, 1992).
Information quality is concerned with issues such as reliability, timeliness, relevance,
completeness and accuracy of information generated by mobile phone banking (Chiu, Hsu,
&Wang, 2006; Lin, 2008). A number of studies found the technicality of a system as animportant
determinant of usage (DeLone & McLean, 1992) and success (Jennex, Amoroso & Adelakun,
2004) of an e-based system. Therefore, we need to test the hypotheses below:
H5: System Quality has a positive and significant impact on actual usage of mobile phone banking
The above stated five hypotheses and their relationship to the actual usage of mobile
phone banking are depicted in the following diagram:
Global Review of Islamic Economics and Business, Vol. 7, No. 1 (2019) 001-019 7
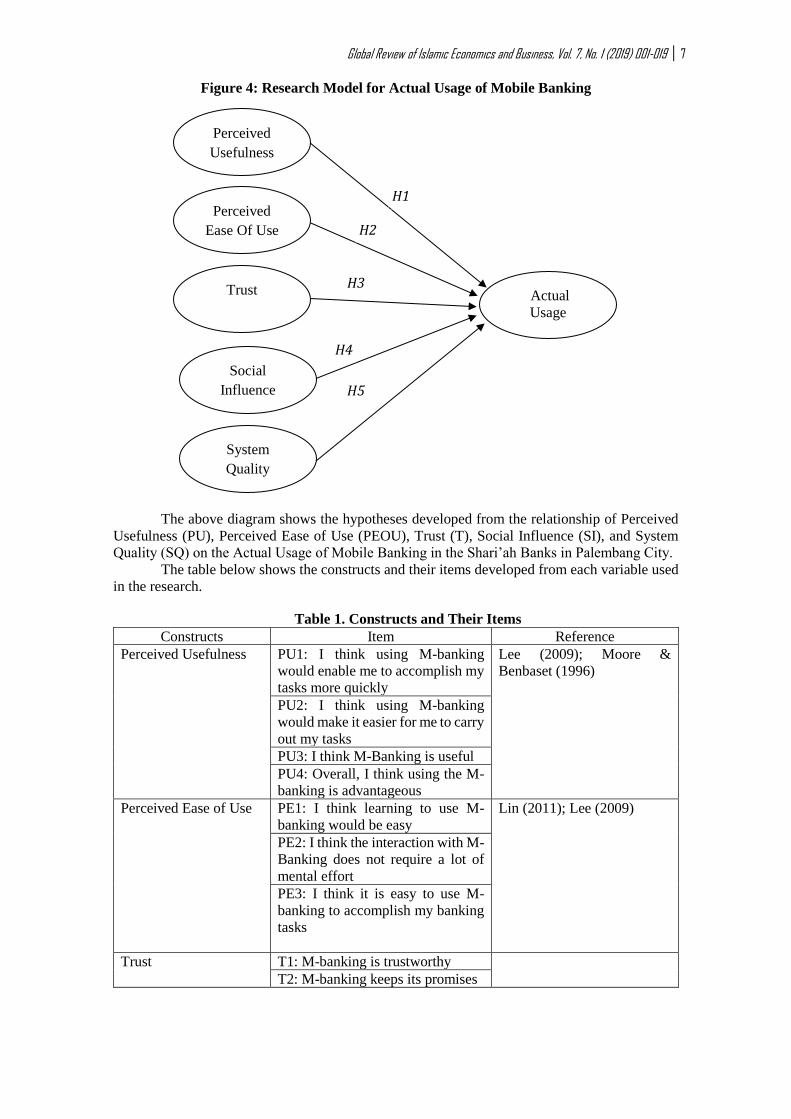
Figure 4: Research Model for Actual Usage of Mobile Banking
The above diagram shows the hypotheses developed from the relationship of Perceived
Usefulness (PU), Perceived Ease of Use (PEOU), Trust (T), Social Influence (SI), and System
Quality (SQ) on the Actual Usage of Mobile Banking in the Shari’ah Banks in Palembang City.
The table below shows the constructs and their items developed from each variable used
in the research.
Table 1. Constructs and Their Items
Constructs Item Reference
Perceived Usefulness PU1: I think using M-banking
would enable me to accomplish my
tasks more quickly
Lee (2009); Moore &
Benbaset (1996)
PU2: I think using M-banking
would make it easier for me to carry
out my tasks
PU3: I think M-Banking is useful
PU4: Overall, I think using the M-
banking is advantageous
Perceived Ease of Use PE1: I think learning to use M-
banking would be easy
Lin (2011); Lee (2009)
PE2: I think the interaction with M-
Banking does not require a lot of
mental effort
PE3: I think it is easy to use M-
banking to accomplish my banking
tasks
Trust T1: M-banking is trustworthy
T2: M-banking keeps its promises
Perceived
Usefulness
System
Quality
Social
Influence
Trust
Perceived
Ease Of Use
Actual
Usage
H1
H2
H3
H4
H5

8 Maulana et al: Influencing Factors on the Actual Usage of Mobile Phone Banking in the Shari’ah Banks: A Survey in Palembang City, Indonesia
Constructs Item Reference
T3: M-banking keeps customers’
interests in mind
Luom Li, Zhang & Shim
(2010); Gu, Lee & Suh
(2009) T4: I trust in the technology M-
banking is using
Social Influence SI1: People think I should use M-
banking
Venkatesh & Brown (2001);
Talukder & Quazi (2011)
SI2: people think using M-banking
is valuable
SI3: People’s opinions are
important
SI4: I learned how to use it from my
friends
System quality SQ1: M-banking is a stable system Lee & Chung (2009); Lin
(2011) SQ2: The speed of M-banking is
quick and fast
SQ3: M-banking is an easily
navigable system
Actual Usage of M-
Banking
AU1: How frequently do you use
M-banking?
Iqbaria, Zinatelli, Cragg &
Cavaye (1997); Lin (2011)
AU2: How much time do you
spend to use M-banking?
AU3: Usage of different M-
banking applications
Methodology
This research used a quantitative approach, whilst its type is survey research, wherein
gathering samples from a population and using questionnaires as its tool to collect primary data.
The type of data is primary data, as in answers from selected respondents to the questions given
from the distributed questionnaires. Locations of data collecting were 4 major Shari’ah banks in
Palembang city, namely, BNI Syariah, Bank Syariah Mandiri, Bank BCA Syariah, and Bank BRI
Syariah, (all at their Branch Offices).
The population is the customers, particularly active and individual customers being
selected as samples. Samples were chosen using purposive sampling, in which selected using
considerations and certain criteria which were: (1) active customers; and (2) individual customer.
The samples size is 100 or using the ratio 5-10 times the number of observations for every
indicator used. (Hair, 2006) Therefore, 21 (indicators) x 6 = 126 respondents are selected using
convenience sampling technique.
The data for this study was collected using survey questionnaires distributed to bank
customers residing in the Palembang City, South Sumatra Province, Indonesia. The data was
collected from May to August 2018. All questionnaires were distributed manually, generating 126
usable responses. The profile of the respondents is summarized in Table 2.
Data Analysis
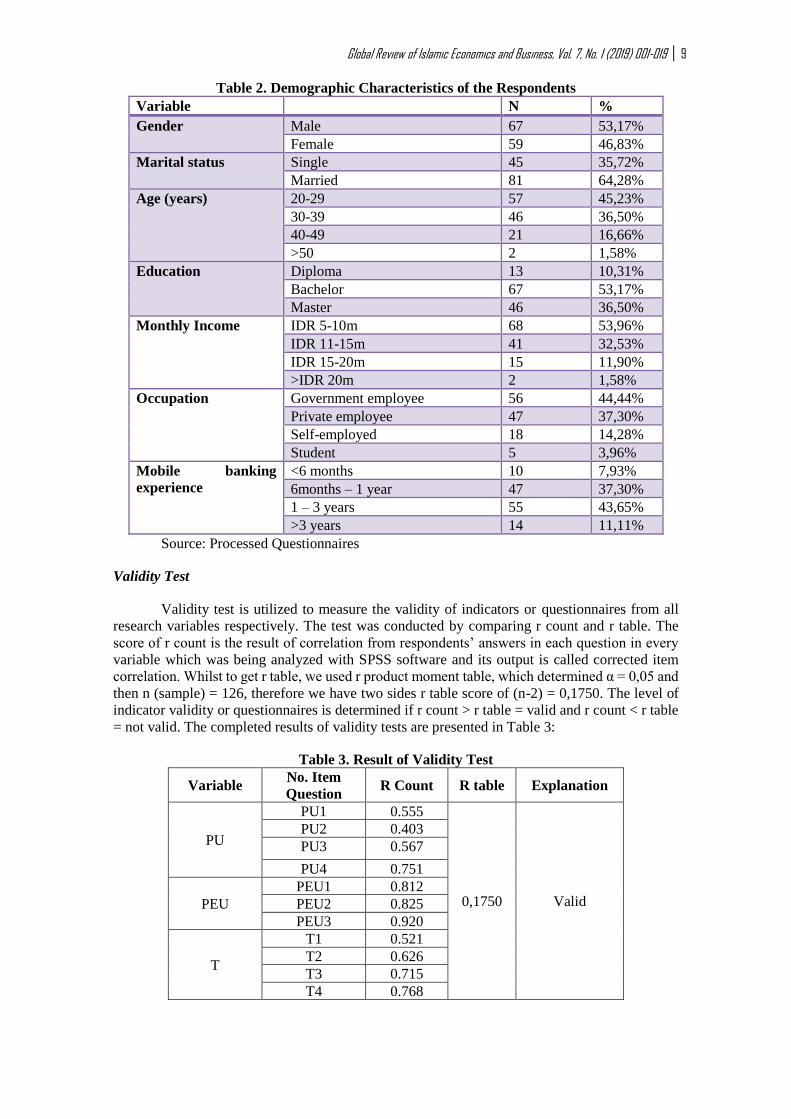
From the demographic characteristics of the respondents, we found that most of the
respondents are male (53,17%), at the range of 30-39 years of age (45,23%), holds bachelor
degrees (53,17%), have monthly income in the range of 5-10 million IDR per month (53,96%),
government employees (44,44%), and having the experience of using mobile phone banking
service for 1-3 years (43,65%).
Global Review of Islamic Economics and Business, Vol. 7, No. 1 (2019) 001-019 9
Table 2. Demographic Characteristics of the Respondents
Variable N %
Gender Male 67 53,17%
Female 59 46,83%
Marital status Single 45 35,72%
Married 81 64,28%
Age (years) 20-29 57 45,23%
30-39 46 36,50%
40-49 21 16,66%
>50 2 1,58%
Education Diploma 13 10,31%
Bachelor 67 53,17%
Master 46 36,50%
Monthly Income IDR 5-10m 68 53,96%
IDR 11-15m 41 32,53%
IDR 15-20m 15 11,90%
>IDR 20m 2 1,58%
Occupation Government employee 56 44,44%
Private employee 47 37,30%
Self-employed 18 14,28%
Student 5 3,96%
Mobile banking
experience
<6 months 10 7,93%
6months – 1 year 47 37,30%
1 – 3 years 55 43,65%
>3 years 14 11,11%
Source: Processed Questionnaires
Validity Test
Validity test is utilized to measure the validity of indicators or questionnaires from all
research variables respectively. The test was conducted by comparing r count and r table. The
score of r count is the result of correlation from respondents’ answers in each question in every
variable which was being analyzed with SPSS software and its output is called corrected item
correlation. Whilst to get r table, we used r product moment table, which determined α = 0,05 and
then n (sample) = 126, therefore we have two sides r table score of (n-2) = 0,1750. The level of
indicator validity or questionnaires is determined if r count > r table = valid and r count < r table
= not valid. The completed results of validity tests are presented in Table 3:
Table 3. Result of Validity Test
Variable No. Item
Question R Count R table Explanation
PU
PU1 0.555
0,1750 Valid
PU2 0.403
PU3 0.567
PU4 0.751
PEU
PEU1 0.812
PEU2 0.825
PEU3 0.920
T
T1 0.521
T2 0.626
T3 0.715
T4 0.768

10 Maulana et al: Influencing Factors on the Actual Usage of Mobile Phone Banking in the Shari’ah Banks: A Survey in Palembang City, Indonesia
Variable No. Item
Question R Count R table Explanation
SI
SI1 0.597
SI2 0.467
SI3 0.615
SI4 0.789
SQ
SQ1 0.919
SQ2 0.952
SQ3 0.940
AU
AU1 0.888
AU2 0.950
AU3 0.937
Source : Results of Primary Data Process, 2018
Results of validity test are presented in Table 3, which indicate that the score of r count
from each indicator of the variable is higher than the score of r table, therefore indicator used by
each variable is valid to be used as the tool of variable measurement.
Reliability Test
Reliability test is used to find whether indicator used in a research is reliable as a tool of
variable measurement. The reliability of an indicator is able to be seen by its score of Cronbach's
alpha (α), if it’s higher (>) 0,60, means that indicator is reliable, otherwise, if its α is lower (<)
than 0,60, it is not reliable. (Nunnally, 1978). The reliability test result for this research can be
seen in the table 4 below:
Table 4. Result of Reliability Test
Variables Cronbach’s
Alpha
Reliability
Standard
Explanation
PU 0.759 0,60 Reliable
PEU 0.919 0,60 Reliable
T 0.827 0,60 Reliable
SI 0.795 0,60 Reliable
SQ 0.965 0,60 Reliable
AU 0.948 0,60 Reliable
Source : Results of Primary Data Process, 2018
The score of Cronbach’s alpha for all variables are higher than 0,60 as presented in table
4. Therefore, it may be concluded that all indicators are reliable to be used as the tool of variable
measurement.
Normality Test
Table 5. Result of Normality Test
Unstandardized Residual
Kolmogrov-Smirnov Z
Asymp. Sig. (2-tailed)
0,528
0,943
Source : Results of Primary Data Process, 2018
According to table 5, the score of KSZ is 0,528 and Asymp. Sig is 0,943 which are higher
than 0,05. Therefore data in this research is concluded to be normally distributed.

Global Review of Islamic Economics and Business, Vol. 7, No. 1 (2019) 001-019 11 Multicollinearity Test
Table 6. Result of Multicollinearity Test with Tolerance dan VIF
Model Tolerance VIF
PU 0.544 1.838
PEU 0.619 1.615
T 0.631 1.586
SI 0.965 1.036
SQ 0.864 1.157
Source : Results of Primary Data Process, 2018
Based on the results presented in table 6, the score of tolerance from all independent
variables is> 0,10. The score of VIF from all independent variables is <10,00. According to the
decision making criterion, we may conclude that there is no issue of multicollinearity.
Autocorrelation Test
Table 7. Result of Autocorrelation Test with Durbin-Watson
Model Durbin Watson
1 2,099
Source : Results of Primary Data Process, 2018
Based on the table 7, the score of DW 2,099. The score of DL at K (independent variable)
= 5 and n (samples) = 126 according to the Durbin Watson table is 1,6276, whilst DU score is
1,7923. Based on the decision making criterion, the score for du<DW<4-du, meaning that there
is no issue of autocorrelation.
Heteroscedasticity Test
Table 8. Result of Heteroscedasticity Test using Glejser Method
Variables Sig
PU 0.861
PEU 0.827
T 0.152
SI 0.463
SQ 0.132
Source : Results of Primary Data Process, 2018
The output results show a significant score of the independent variable against absolute
residual is higher than 0,05. Since its sig score >0,05, we may conclude that there is no issue of
heteroscedasticity in the study as the results in Table 8 show.
Linearity Test
The simplest method to determine linearity is using Sig. Linearity and Sig. Deviation
from linearity test. If the sig. score < α = 0,05, this means that the regression model is linear and
vice- versa.
Table 9. Linearity Test AU and PU
Sig.
AU* Linearity
PU Deviation from linearity
0,000
0,052
Source : Results of Primary Data Process, 2018

12 Maulana et al: Influencing Factors on the Actual Usage of Mobile Phone Banking in the Shari’ah Banks: A Survey in Palembang City, Indonesia
Based on the table 9, the Sig. Linearity score is 000 < α = 0,05, which means linear
regression is able to be used to explain the effect between the variable PU and AU.
Table 10. LinearityTest AU and PEU
Sig.
AU* Linearity
PEU Deviation from linearity
0,000
0,298
Source : Results of Primary Data Process, 2018
Based on the table 10, the Sig. Linearity score is 000 < α = 0,05, which means linear
regression is able to be used to explain the effect between the variable PEU and AU.
Table 11. Linearity Test AU and T
Sig.
AU* Linearity
T Deviation from linearity
0,000
0,038
Source : Results of Primary Data Process, 2018
Based on the table 11, the Sig. Linearity score is 000 < α = 0,05, which means linear
regression is able to be used to explain the effect between the variable AU and T.
Table 12. Linearity Test AU and SI
Sig.
AU* Linearity
SI Deviation from linearity
0,030
0,001
Source : Results of Primary Data Process, 2018
Based on the table 12, the Sig. Linearity score is 000 < α = 0,05, which means linear
regression is able to be used to explain the effect between the variable AU and SI.
Table 13. Linearity Test AU and SQ
Sig.
AU* Linearity
SQ Deviation from linearity
0,000
0,048
Source : Results of Primary Data Process, 2018
Based on the table 13, the Sig. Linearity score is 000 < α = 0,05, which means linear
regression is able to be used to explain the effect between the variable AU and SQ.
Multiple Regression Analysis
Multiple regression analysis utilized in this research with the purpose to prove the
hypothesis regarding the effect of independent variables (PU, PEU, T, SI, and SQ) partially and
simultaneously to the dependent variable (AU). The statistic calculation in the multiple regression
analysis is using SPSS software. The results of the calculation can be seen in the table 14 below:

Global Review of Islamic Economics and Business, Vol. 7, No. 1 (2019) 001-019 13
Table 14. Regression Coefficient
Model
Unstandardized
Coefficients t Sig.
Beta
(Constant)
PU
PEU
T
SI
SQ
-5,513
0,240
0,303
0,280
0,182
0,225
-3,381
3,229
3,226
3,779
2,887
2,599
0,001
0,002
0,002
0,000
0,005
0,011
Source : Results of Primary Data Process, 2018
Based on the table 14, the equation for the multiple regression is as follow:
AU = -5,513 + 0,240 PU + 0,303 PEU + 0,280 T + 0,182 SI + 0,225 SQ
From the regression results presented in table 14, the explanation is that if Constant score
is -5,513, this means that if there are no factors of PU, PEU, T, SI, and SQ, the AU variable would
still be at the position of -5,513. The results also show that the independent variables with the
most impact on the dependent variable is PEU, with the coefficient score of 0,303, whilst the
lowest effect is SI, with coefficient score 0,182. From the equation, we may also conclude that all
independent variables (PU, PEU, T, SI, and SQ) have positive and significant effect on AU, which
means that the higher the perception of respondents on the PU, PEU, T, SI, and SQ, it will have
effect on the increase of AU as well.
Hypotheses test of the Multiple Linear Regression
Simultaneous significant Test (F Test)
The F test is used to show whether all independent variables in the model have
simultaneous significant effect on the dependent variable.
Table 15. Result of ANOVA Test
Model F Sig.
Regression
Residual
Total
29,301 0,000
Source : Results of Primary Data Process, 2018
The test show that F score is 29,301 with probability 0,000 at the significant level of 95%
(α=0,05). Significant score 0,000<0,05. This means that the regression model is able to be used
to predict AU. In other words, the independent variables (PU, PEU, T, SI, and SQ) have
simultaneous significant effect on the AU variable.
Hypotheses Test
T test or partial test is used to discover how high are the effects of PU, PEU, T, SI and
SQ to AU. The result is as follow:

14 Maulana et al: Influencing Factors on the Actual Usage of Mobile Phone Banking in the Shari’ah Banks: A Survey in Palembang City, Indonesia
Table 16. Result of Hypotheses Test
Model T Sig.
(Constant)
PU
PEU
T
SI
SQ
-3,381
3,229
3,226
3,779
2,887
2,599
0,001
0,002
0,002
0,000
0,005
0,011
Source : Results of Primary Data Process, 2018
Based on the t count:
If t count > t table, Ho is rejected, meaning it has effect.
If t count< t table, Ho is accepted, meaning there is no effect.
The partial test conclusions are as follow:
PU
Variable item PU, from PU1 to PU4 in total, have positive and significant effect on AU with the
t score = 3,229 whereas t table 1,65765 (t count> t table), p = 0,002 significant at p<0,05. This
result means “Hypothesis 1 is accepted. ”
PEU
Variable item PEU, from PEU1 to PEU3 in total, have positive and significant effect to AU with
the t score = 3,226 whereas t table 1,65765 (t count> t tabel), p = 0,002 significant at p < 0,05.
This result means “Hypothesis 2 is accepted. ”
T
Variable itemT, from T1 to T4in tota,l have positive and significant effect on AU with the t score
= 3,779 whereas t table 1,65765 (t count> t tabel), p = 0,000significant at p < 0,05. This result
means “Hypothesis 3 is accepted. ”
SI
Variable itemSI, from SI1 to SI3 in total, have positive and significant effect on AU with the t
score = 2,887whereas t table 1,65765 (t count> t tabel), p = 0,005significant at p < 0,05. This
result means “Hypothesis 4 is accepted. ”
SQ
Variable itemSQ, from SQ1 to SQ3 in total, have positive and significant effect on AU with the t
score = 2,599whereas t table 1,65765 (t count> t tabel), p = 0,011significant at p < 0,05. This
result means “Hypothesis 5 is accepted. ”
Determination Coefficient (R2)
Determination coefficient (R2) is conducted to discover the relationship of inter variables
in a research, which is shown by the fluctuation of independent variables (PU, PEU, T, SI, and
SQ) which will be followed by AU variable at the same portion. This test is observing R square
score ranging from 0 to 1. A low R2 score means that the ability of independent variables to
explain the variation of dependent variables are limited. A score close to 1 means that independent
variables could explain almost all pieces of information needed to predict the dependent variable.
Global Review of Islamic Economics and Business, Vol. 7, No. 1 (2019) 001-019 15
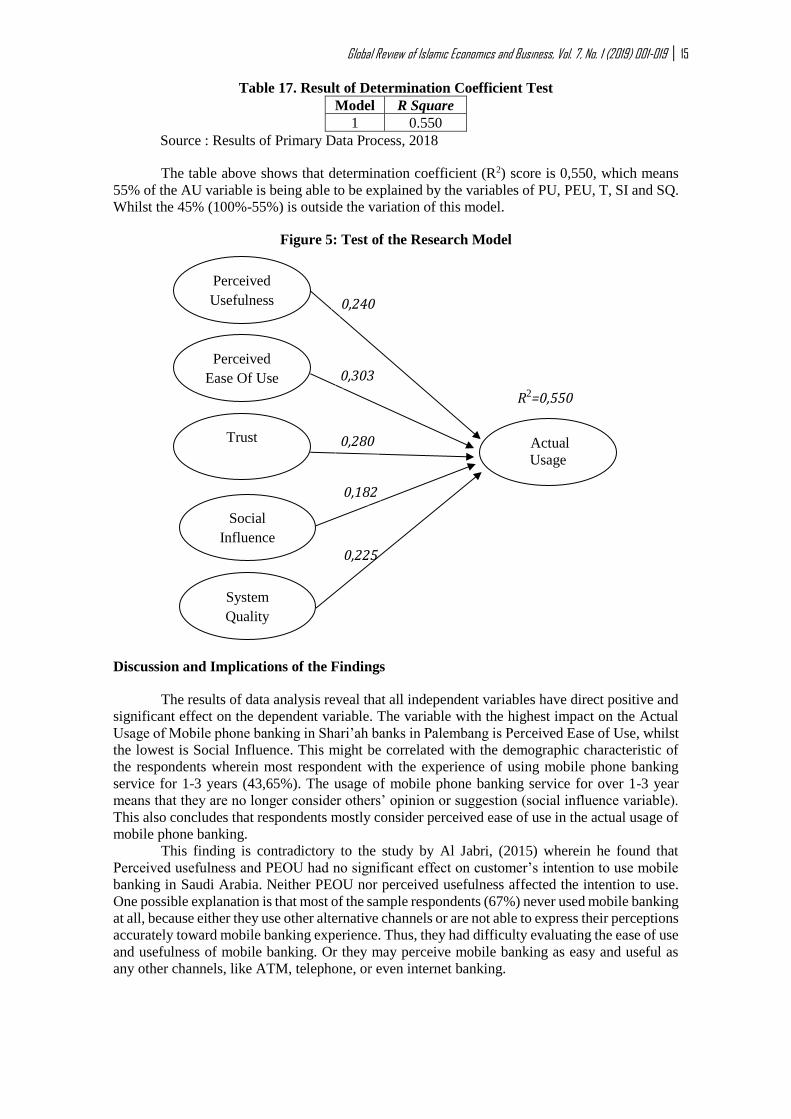
Table 17. Result of Determination Coefficient Test
Model R Square
1 0.550
Source : Results of Primary Data Process, 2018
The table above shows that determination coefficient (R2) score is 0,550, which means
55% of the AU variable is being able to be explained by the variables of PU, PEU, T, SI and SQ.
Whilst the 45% (100%-55%) is outside the variation of this model.
Figure 5: Test of the Research Model
Discussion and Implications of the Findings
The results of data analysis reveal that all independent variables have direct positive and
significant effect on the dependent variable. The variable with the highest impact on the Actual
Usage of Mobile phone banking in Shari’ah banks in Palembang is Perceived Ease of Use, whilst
the lowest is Social Influence. This might be correlated with the demographic characteristic of
the respondents wherein most respondent with the experience of using mobile phone banking
service for 1-3 years (43,65%). The usage of mobile phone banking service for over 1-3 year
means that they are no longer consider others’ opinion or suggestion (social influence variable).
This also concludes that respondents mostly consider perceived ease of use in the actual usage of
mobile phone banking.
This finding is contradictory to the study by Al Jabri, (2015) wherein he found that
Perceived usefulness and PEOU had no significant effect on customer’s intention to use mobile
banking in Saudi Arabia. Neither PEOU nor perceived usefulness affected the intention to use.
One possible explanation is that most of the sample respondents (67%) never used mobile banking
at all, because either they use other alternative channels or are not able to express their perceptions
accurately toward mobile banking experience. Thus, they had difficulty evaluating the ease of use
and usefulness of mobile banking. Or they may perceive mobile banking as easy and useful as
any other channels, like ATM, telephone, or even internet banking.
0,225
Perceived
Usefulness
System
Quality
Social
Influence
Trust
Perceived
Ease Of Use
Actual
Usage
0,240
0,303
0,280
0,182
R2=0,550

16 Maulana et al: Influencing Factors on the Actual Usage of Mobile Phone Banking in the Shari’ah Banks: A Survey in Palembang City, Indonesia
Similar findings are found in Puschel et al. (2010) where they found that perceived ease
of use (PEOU) influences attitude towards mobile banking and this influence adoption and
behavioral intention towards mobile banking besides continuing to use the service. Lin (2011)
also tested the PEOU and its influence on adoption and asserted that PEOU, in fact, has a
significant effect on adoption or continuing to use mobile banking.
Conclusion and Recommendations
The research has discovered some interesting facts about the drivers of mobile phone
usage in Palembang City, Indonesia which can be considered as advancement over the extant
research in the related field. In particular, the research has empirically established that perceived
usefulness, perceived ease of use, trust, system quality and social influence have positive and
significant impact on the usage of mobile phones in the Shari’ah banking industry in Palembang
city, Indonesia. These findings facilitate the advancement of the Theory of Reasoned Action
(TRA) and the Technology Acceptance Model (TAM) in an Indonesian setting. While the above
determinants are well established in the literature in reference to technology adoption ingeneral,
these factors are rarely explored empirically in terms of usage of mobile phonesparticularly in
financial transactions in Indonesia.
This research was developed from a study conducted by Talukder, Quazi and Sathye in
2014. They tried to discover mobile phone banking usage behavior of banks customers in
Canberra, Australia. The findings are relatively similar concerning all determinants have positive
and significant effect on the actual usage. Yet, it has a contrary result regarding the effect of
perceived ease of use and social influence. Perceived ease of use is the highest determinant of
actual usage of mobile banking in Shari’ah banking, whilst social influence has emerged as the
least striking determinant. This finding is inconsistent with the study of technology adoption
conducted by Talukder et.al (2014) whom had found that Social Influence is the determinant with
the most significant effect on the intention to use and behavioral usage of mobile banking in
Australia.
As an implication to the providers, financial institutions can capitalize on this finding to
enhance the ease of use of their application on mobile banking. They also can check on the updates
of the mobile banking applications regularly in order to keep it up to dates to the advancement of
technology. This strategic approach would be appropriate for exploiting the sentiments of
usersand especially the young cohort of customers who are professional and innovative in
theirapproaches to new technology.
Limitations and avenues of future research
This research has few limitations. First, the use of mobile banking in Indonesia is still in
its infancy stage. Few banks offer mobile banking with few and limited numbers of services.
Therefore, this study may need to be replicated when the usage becomes more mature.
Second, researchers need to explore other factors that are suitable for the mobile banking
context, like ubiquity, convenience, security, and personal innovativeness that may affect the
actual usage of mobile banking. Other factors that may need to be included in the model of this
research are age and gender.
The technology acceptance literature points a strong relationship between age and the
acceptance of new technologies, [e.g. Gattiker, (1992), Harrison et al., (1992)]. Older customers
are found to have problems with new technologies, and hence, are expected to have negative
attitudes towards innovations. Trocchia and Janda (2000), for instance, indicate that many older
consumers possess more negative intention to change. However, they argue that a person's overall
perception of technology affects more than the age.
Gender has also been suggested as a factor of mobile banking adoption. Some studies
argue that mobile usage and internet is male-dominated. In Finland, the research counts that 45%
of Internet users are female (Statistics Finland, 2000).

Global Review of Islamic Economics and Business, Vol. 7, No. 1 (2019) 001-019 17
Third, this research is a cross-sectional study. Since user behavior is dynamic, a
longitudinal study may provide more insights into user behavior dynamics and development. This
research only conducted in 4 banks and in one city only. A few more banks and wider region
might give different results and generalization.
References
Agarwal, R & Prasad, J (1998), ‘The Antecedents and Consequents of User Perceptions in
Information Technology Adoption’, Decision Support Systems, Vol. 22, No. 1, pp.15-29.
Al-Gahtani, S & King, M (1999), ‘Attitudes, satisfaction and usage: Factors contributing to each
in the acceptance of information technology’, Behaviour & Information Technology, Vol.
18, No. 4, pp. 277-297.
Ajzen, I & Fishbein, M (1980), ‘Understanding attitudes and predicting social behaviour’,
Englewood Cliffs, New Jersey, Prentice-Hall.
Al-Jabri, I.M., (2015), The Intention to Use Mobile Banking: Further Evidence from Saudi
Arabia, S. Afr. Journal of Business and Management, 46 (1).
Benassi, P. (1999), ‘TRUSTe: an online privacy seal program’, Communication of the ACM, Vol.
42, No. 2, pp. 56-59. http://dx.doi.org/10.1145/293411.293461
Chiu, C, Hsu, M & Wang, E (2006), ‘Understanding knowledge sharing in virtual communities:
an integration of social capital and social cognitive theories’, Decision Support Systems,
Vol. 42, pp. 1872-1888.
Chen, Yu-Shan, Ching-Hsun Chang (2012) ‘Enhance Green Purchase Intentions; The Roles of
Green Perceived Value, Green Perceived Risk, and Green Trust’, Management Decision,
Vol. 50, Issue: 3, pp.502-520.
Davis, F.D. (1986). ‘A technology acceptance model for empirically testing new end-user
information systems: Theory and results,’ doctoral dissertation, MIT Sloan School of
Management, Cambridge, MA.
Davis, F 1989, ‘Perceived Usefulness, Perceived Ease of Use, and User Acceptance of
Information Technology’, MIS Quarterly, Vol. 13, No. 3, pp. 319-340.
Eriksson, K., Kerem, K. and Nilsson, D. (2005), ‘Customer Acceptance of Internet Banking in
Estonia, International Journal of Bank Marketing, 23, 2/3, 200-216.
Gefen, D 2000, ‘E-commerce: The role of familiarity and trust’, Omega: The International
Journal of Management Science, Vol. 28, No. 6, pp. 725-737.
Gu, J.-C., Lee, S.-C. & Suh, Y.-H. (2009). ‘Determinants of behavioral intention to mobile
banking’, Expert Systems with Applications, 36(9): 11605-11616.
Igbaria, M, Zinatelli, N, Cragg, P & Cavaye, A (1997), ‘Personal computing acceptance factors
in small firms: A structural equation model’, MIS Quarterly, Vol. 21, No. 3,pp. 279-305.
Igbaria, M 1993, ‘User acceptance of microcomputer technology: An empirical test’, Omega
(Oxford), Vol. 21, No. 1, pp. 73-90.
Jennex, M, Amoroso, D & Adelakun, O (2004), ‘E-commerce infrastructure successfactors for
small companies in developing economies’, Electronic CommerceResearch, Vol. 4, pp.
263-286.

18 Maulana et al: Influencing Factors on the Actual Usage of Mobile Phone Banking in the Shari’ah Banks: A Survey in Palembang City, Indonesia
Kim, H, Chan, H & Gupta, S 2007, ‘Value-based adoption of mobile Internet: An empirical
investigation’, Decision Support Systems, Vol. 43, No. 1, pp. 111-126.
Konana, P & Balasubramanian, S (2005), ‘The social-economic-psychological (SEP) model of
technology adoption and usage: An application to online investing’, DecisionSupport
Systems, Vol. 39, No. 3, pp. 505-524.
Lee, K & Chung, N (2009), ‘Understanding factors affecting trust in and satisfaction withmobile
banking in Korea: A modified DeLone and McLean’s model perspective’,Interacting
with Computers, Vol. 21, No. (5-6), pp. 385-392.
Lee, H, Lee, Y & Kwon, D 2005, ‘The Intention to Use Computerized Reservation Systems:The
Moderating Effects of Organizational Support and Supplier Incentive’, Journal of
Business Research, Vol. 58, No. 11, pp. 1552-1561.1
Lee, S, Kim, I, Rhee, S & Trimi, S 2006, ‘The Role of Exogenous Factors in Technology
Acceptance: The case of object-oriented technology’, Information & Management, Vol.
43, No. 4, pp. 469-480.
Lin, H (2008), ‘Determinants of successful virtual communities: contributions from
systemcharacteristics and social factors’, Information and Management, Vol. 45, pp. 522-
527.
Lin, H.-F. (2011). ‘An empirical investigation of mobile banking adoption: The effect of
innovation attributes and knowledge-based trust’, International Journal of Information
Management, 31(3): 252-260.
Moore, G & Benbasat, I (1996), ‘Integrating diffusion of innovations and Theory of Reasoned
Action Models to Predict Utilization of Information Technology by End users’, In K.
Kautz & J. Pries-Heje (Eds.), Diffusion and Adoption of InformationTechnology (pp. 132-
146). London, Chapman and Hall.
Nunnally, J. C. (1978), ‘Psychometric Theory’ (2nd Ed.) New York: McGraw-Hill.
Ozok, A & Wei, J 2010, ‘An empirical comparison of consumer usability preferences in online
shopping using stationary and mobile devices: results from a college student population’,
Electronic Commerce Research, Vol.10, pp. 111-137.
Puschel, J., Mazzon, A. & Hernandez, J.M.C. (2010). ‘Mobile banking: Proposition of an
integrated adoption intention framework’, International Journal of Bank Marketing,
28(5): 389-409.
Schepers, J & Wetzels, M 2007, ‘A Meta-analysis of The Technology Acceptance Model:
Investigating Subjective Norm and Moderation Effects’, Information & Management,
Vol. 44, No. 1, pp. 90-103.
Swan, E, Bowers, R & Richardson, D (1999), ‘Customer Trust in the Salesperson: An Integrative
Review and Meta Analysis of The Empirical Literature’, Journal of Business Research,
Vol. 44, No. 2, pp. 93-107. http://dx.doi.org/10.1016/S0148-2963(97)00244-0
Talukder, M, Harris, H & Mapunda, G 2008, ‘Adoption of innovations by individuals within
organizations: An Australian study’, Asia Pacific Management Review, Vol. 13, No. 2,
pp. 463-480.
Talukder, M & Quazi, A (2011), ‘The impact of social influence on individuals’ adoption of
innovation’, Journal of Organizational Computing and ElectronicCommerce, Vol. 21, No.
2, pp. 111-135
Global Review of Islamic Economics and Business, Vol. 7, No. 1 (2019) 001-019 19 Talukder, M, Quazi, A & Keating, B 2014, ‘Virtual systems in Australia: A study of individual
users’ commitments’ and usage’, Journal of Internet Commerce. Vol. 13, No. 1, pp. 1-21.
Talukder, Majharul, Ali Quazi, Milind Sathye (2014) Mobile Phone Banking Usage Behaviour:
An Australian Perspective, Australasian Accounting, Business and Finance Journal, Vol.
8, Issue 4, Special Issue on Financial Planning & Financial Instruments.
Van der Heijden, H 2004, ‘User acceptance of hedonic information systems’, MIS Quarterly, Vol.
28, No. 4, pp. 695-704.
Venkatesh, V & Brown, S (2001), ‘A longitudinal investigation of personal computers inhomes:
Adoption determinants and emerging challenges’, MIS Quarterly, Vol. 25,No. 1, pp. 71-
102
Venkatesh, V & Davis, F (2000), ‘A Theoretical Extension of The Technology Acceptance
Model: Four longitudinal field studies’, Management Science, Vol. 46, No. 2, pp. 186-
204. http://dx.doi.org/10.1287/mnsc.46.2.186.11926
Venkatesh, V, Morris, M, Davis, G & Davis, F. (2003) , ‘User Acceptance of Information
Technology: Toward a unified view’, MIS Quarterly, Vol. 27, No. 3, pp. 425-478.
Zhou, Tao, (2011), ‘An Empirical Examination of Initial Trust in Mobile Banking‘, Internet
Research, Vol. 21 Issue: 5, pp.527-540, https://doi.org/10.1108/10662241111176353.
www.ojk.go.id. 2017, Laporan Tahunan OJK 2017. Accessed July 18th, 2018.
www.stat.fi. Statistics Finland-Census 2000. Accessed September 1st, 2018