influences on wine purchases: a comparison between
TRANSCRIPT

i
INFLUENCES ON WINE PURCHASES:
A COMPARISON BETWEEN MILLENNIALS AND PRIOR GENERATIONS
Presented to the
Faculty of the Agribusiness Department
California Polytechnic State University
In Partial Fulfillment
of the Requirements for the Degree
Bachelor of Science
By
Kelsea Nissen
March 2012
© 2012 Kelsea Nissen

ii
APPROVAL PAGE
TITLE: Influences on Millennial Wine Purchases
AUTHOR: Kelsea Nissen
DATE SUBMITTED: March 2012
_Lindsey Higgins _________________________
Senior Project Advisor Signature

iii
ABSTRACT
This study was undertaken to determine the factors that influence wine purchases for
wine consumers in San Luis Obispo County. The study was performed in order to compare the
influential factors between Millennials and prior generations.
This collected data was analyzed through the use of statistical tests. Frequency tests were
used to determine which influential factors and demographics made up the largest percentages.
Chi-squared tests were performed in order to determine if a relationship between influential
factors and generations was present. The statistical tests of independent t-tests and analysis of
variance (ANOVA) were performed to determine the differences between generations on the
factors that influence wine purchases.
Based on the results, it was discovered that for San Luis Obispo County wine consumers,
when purchasing wine, the factors that influence purchases are not the same between
generations. The differences suggest differences in the motivations for purchasing wine, and
therefore a needed difference in marketing and advertising for each generation is recommended.

iv
TABLE OF CONTENTS
Chapter Page
I. INTRODUCTION .....................................................................................................................1
Problem Statement ...............................................................................................................2
Hypothesis............................................................................................................................2
Objectives ............................................................................................................................2
Significance..........................................................................................................................3
II. REVIEW OF LITERATURE ....................................................................................................4
Consumer Segmentation in the Wine Industry ....................................................................4
Millennials ...........................................................................................................................6
Factors Influencing Wine Purchases ....................................................................................8
Survey and Data Analysis Methods .....................................................................................9
III. METHODOLOGY ..................................................................................................................12
Procedures for Data Collection ..........................................................................................12
Procedures for Data Analysis.............................................................................................14
Assumptions .......................................................................................................................17
Limitations .........................................................................................................................17
IV. RESULTS ................................................................................................................................18
Demographics of Survey Respondents ..............................................................................18
Analysis..............................................................................................................................22
V. SUMMARY, CONCLUSIONS, AND RECOMMENDATIONS...........................................31
Summary and Conclusions ................................................................................................31
Recommendations ..............................................................................................................34
References Cited ............................................................................................................................36
APPENDIX ....................................................................................................................................39

v
LIST OF TABLES
TABLE Page
Table 1: Summary of Demographics for Entire Sample Population ............................................ 19
Table 2: Gender Distribution by Generation ................................................................................ 20
Table 3: Education Level Distribution by Generation .................................................................. 20
Table 4: Income Level Distribution by Generation ...................................................................... 21
Table 5: Consumption Level Category Distribution by Generation ............................................. 21
Table 6: Rankings of Most Influential Factors to Wine Purchases .............................................. 23
Table 7: Extremely, Very, and Non Influential Factors for Wine Purchases by Generation ....... 25
Table 8: Factors Influencing Wine Purchases: Millennials Compared to Other Generations ...... 26
Table 9: Factors Influencing Wine Purchases: All Generations Compared ................................. 27
Table 10: Factors Influencing Wine Purchases: Millennials compared to each Generation ........ 28
Table 11: Factors Influencing Wine Purchases: Gender Compared ............................................. 29
Table 12: Factors Influencing Wine Purchases: Education Level Compared ............................. 30
Table 13: Factors Influencing Wine Purchases: Income Level Compared .................................. 30
1
CHAPTER I
INTRODUCTION
In recent years, the US’s wine industry has expanded dramatically, bringing a continually
competitive and challenging wine market. In order to deal with the growing market many wine
marketing experts have pushed the need to focus on finding new populations of wine consumers.
Luckily for the wine industry the Millennial generation offers an opportunity for growth.
Historically, much of the wine industry’s focus has been the Baby Boomer generation,
which consists of 80 million people (Nowak, Thach, and Olsen, 2006). The focus has now
shifted toward a younger segment known as the Millennial generation. A generation that is larger
than its predecessors, the Gen Xers, the Millennial generation has the capability of supporting the
wine industry’s need for a new population. Millennials are recognized for their buying power, as
well as population size, which trail the Boomers by only four million.
Previous research has been conducted on marketing to this generation, but little research
has gone into what differentiates Millennials from past generations. Marketers must realize that
Millennials bring in a new type of wine consumer compared to past generations. In order to be
successful wine industry professionals will need to look at the factors that influence wine
purchases. It is essential that they notice the differences between the Millennial generation and
past generations when it comes to making wine purchase decisions. This study intends to
distinguish what influences wine purchases made by Millennials, and how this compares to the
influences of past generations.

2
Problem Statement
When it comes to the factors that influence wine purchases, what are the primary
differences between Millennial wine drinkers and other generations in San Luis Obispo County?
Hypothesis
There is no significant difference in the factors that influence wine purchases between
Millennials and prior generations. Price point, brand recognition, and region will be the most
influential variables for wine purchases.
Objectives
1. To investigate the factors influencing wine purchases.
2. To determine the factors that influence wine purchases made by all generations at a
winery in San Luis Obispo County.
3. To examine the factors wine consumers deem influential to their wine purchase
decision and compare the evaluation between Millennials and prior generations.
4. To determine if the selected demographic characteristics of education level, income
and gender have an effect on the influences on wine purchases.

3
Significance
Many studies have been conducted on marketing wine to the Millennial consumer, but
few have been conducted to show the differences between marketing to Millennials compared to
prior generations. The significance of this study is to determine the differences in what
influences wine purchases between Millennial wine drinkers and past generations of wine
consumers in San Luis Obispo County, California. The results of this study will aid a winery,
producer, or distributor in marketing and advertising wine to the Millennial generation. As the
wine industry has grown significantly in recent years, so has the number of Millennials entering
into legal drinking age, in order to keep up with the changing preferences of consumers a wine
producer must adhere to the preferences of this generation. By adapting to the preferences of the
Millennial generation wine industry professionals will be better able to suit the needs of this
generation.

4
CHAPTER II
REVIEW OF LITERATURE
Consumer Segmentation in the Wine Industry
Understanding customers and satisfying their needs is the foundation of marketing,
however since customers won’t all have the same requirements, it is rarely possible to satisfy all
customers by treating them alike. Market segmentation is used to allow companies to meet the
distinct needs of their customers by dividing a market into more homogeneous groups. Generally
segmentation is beneficial for two reasons. First, it allows for marketing researchers to analyze
the needs of a specific customer segment. Second, from the evaluation, companies can develop
specific marketing campaigns directed to the particular needs of the segment (Thach and Olsen,
2006). The factors used for segmentations are typically drawn from demographics, behavior,
attitudes, and needs (Wyner 1995). When market segmentation is used appropriately it
effectively allows for a focus on the marketing tools which will identify marketing situations that
will maximize profits.
A commonly used customer segmentation approach, created by the Wine Market Council
(2009), breaks customers into four groups characterized by wine consumption levels. The four
segmentation groups are core drinkers, marginal drinkers, non-adopters, and non-drinkers. Core
drinkers consume the most amount of wine; they typically drink at least three times a

5
month. About 12.5% of the US’s population fits into this segment, and they drink 88% of the
wine sold in the US (Olsen and Thach 2006). Next are the marginal drinkers, they enjoy wine but
drink it less often, usually about two times a month. Fourteen percent of America’s population
falls into the marginal drinker segment (Olsen and Thach 2006). The non-adopters consist of
those who drink alcoholic beverages but not wine; they make up 31% of the US population.
Finally 43% of the nation's population is the non-drinker who drinks no alcoholic beverages
(Olsen and Thach 2006). Even in today's economy where sales in many industries are down,
Hochstein (2009) notes that wine consumption has increased. He states that since 2000, the
number of people in the core drinker segment has increased 60%, while those in the non-adopter
segment has declined 21%. The trend of decreasing non-adopters shows that more consumers are
switching to wine, and while they may not fall into the core drinker category, increased
consumption is good for the wine industry, regardless of the level.
With the increase in people consuming wine, it is important for companies to be able to
focus their marketing strategies to the needs of their new customers. Segmentation by wine
consumption level can be used to do this, but meeting the needs of the new consumers can be
done more efficiently when broken down even further into sub-segments. Sub- segments will
allow for an even greater focus on the customers’ needs within the consumption level segment.
For many industries, including the wine industry, age can tell companies a great deal about their
consumer’s needs; generational segmentation can give great insight to the needs of customers in
each segment. The four major generations are Traditionalists, Baby Boomers, Gen Xers, and
Millennials. Olsen and Thach (2006) consider Traditionalists to be those born between 1900 and
1945, Baby Boomers 1946 to 1964, Gen Xers 1965 to 1976, and Millennials 1977 to 1999. Baby
Boomers make up most of the population followed by Millennials, with 80 and 76 million

6
respectively. In the wine industry, where Baby Boomers currently make up the largest
percentage of wine consumption, the number of Millennials will soon surpass the Baby Boomers
and companies will need to note the generation size changes in order to reach their targets in the
right manner (Olsen, Thach, and Nowak 2006).
Millennials
Also known as Gen Y, Nexters, and Echo Boomers, Millennials are known for
characteristics that set them apart from past generations, and these characteristics also contribute
to their purchasing decisions. One of these traits is that Millennials are very technologically
driven; many have grown up with the Internet and they have been able to use it in order to
research products, and make purchases (Nowak, Thach, and Olsen, 2006). This generation has
become very trusting of what they read on the Internet and this has greatly influenced their
purchasing decisions. A past study showed that Millennials spend on average 16.7 hours per
week on the Internet, excluding email (Thach 2005). They use the Internet for shopping, to chat,
for research, and to keep up with today’s trends (Thach 2005). A second characteristic is their
concern for the environment. This trait has been seen strongly in those who go as far as
boycotting a particular brand that does not share the same values as they do (Nowak, Thach, and
Olsen, 2006). Millennials are knowledgeable about brands and they value quality products, but at
the same time they are interested in fair pricing and the environmental practices of companies.
Finally this generation has a strong belief in the balance responsibility and fun, part of this is due
to their relatively young age. Teagle (2010) believes this to be because Millennials have less
financial commitments compared to older generations, thus giving them the opportunity to go out

7
more compared to those older generations. Millennials want to embrace an enjoyable lifestyle,
but at the same time they want responsibility and a challenge on the job (Barber, Dodd, and
Ghiselli, 2008). In order to create advertising campaigns that addresses the characteristics of
Millennials, it is best if companies conduct consumer research in order to gain the insight of
Millennials.
In a growing industry, it is important for wine professionals to note the differences in
why consumers are making purchases, by asking “who” is doing the purchasing. By asking this
question professionals will be able to adjust their advertising strategies to the needs of their
consumers. Being able to analyze the traits and characteristics of Millennials will provide useful
information to marketers as they develop new campaigns for this generation. By realizing the
importance of marketing to this generation early on then marketers will be able to consistently
attract this generation in the future because it has been reported that wine consumption trends
tend to stay with one with age (Fowler, et al., 2010). By realizing the importance of the
Millennial generation now, it will enable wine companies the opportunity to draw in these
consumers now and create a brand loyalty at an early stage between them and the customer. This
is specifically important in today’s growing wine industry where Millennials will be the key
segment to market to as the number of Boomers gradually decreases. Marketers that do not
bother to learn the interests of Millennials will essentially draw a blank when it comes to pulling
in this generation, the consumers will become skeptical and even untrusting if a positive
emotional bond is not created between the two parties (Barber, Dodd, and Ghiselli, 2008).

8
Factors Influencing Wine Purchases
There is a perceived risk that goes hand in hand with purchasing wine. Consumers strive
to reduce the likelihood of making a bad purchase decision by using a variety of tools to get
around the risk. Some of these methods include selecting wines based on brands that represent
consistent quality, recommendations from family and friends, advice from a sales associate, or
the consumers’ own knowledge. Wine consumers use intrinsic and extrinsic cues when making
wine purchases, and these cues are normally used as an indicator of quality. Intrinsic cues refer
to characteristics of a wine that relate to the wine itself, such as grape variety, alcohol content,
and wine style. Characteristics that are labeled intrinsic are items that if changed, will change the
composition of the wine as well. Although intrinsic cues can be a good indicator of quality, it is
more common to look at the extrinsic cues when purchasing wine since intrinsic quality related
attributes such as taste and aroma are not always available to the consumer while shopping
(Jacoby and Olson 1985). Consumers commonly rely on extrinsic cues such as price or region of
origin as an indicator of quality, but will also consider label, packaging, brand, and shelf position
when making wine purchases (Lockshin and Rhodus 1993, Atkin and Johnson 2010). In
addition, consumers will also look to brands and wines from regions that have pleased them in
the past. Extrinsic cues are under the control of the producer, and can be changed without
actually changing the product. Consumers use extrinsic cues to reduce their risk and are used in
combination with intrinsic cues, and when the intrinsic cues that come from tasting a wine
cannot be used.
Extensive research has proven that consumers will use extrinsic cues when making
purchases. Lockshin (2000) states that brand name often acts as a substitute for quality, and

9
consumers will also look at brand name in order to delegate perceived risks. However, Gluckman
(1990) stresses that consumers will place the same status on generic varietals as they do to
brands, since they do not clearly understand the concept of wine branding. It has also been seen
that when in the absence of wine knowledge, purchasers will use price as a cue for quality
(Barber, Dodd, and Ghiselli, 2008). Place of origin or region are also often used as an indicator
of quality since wine is a product with a strong relationship to territory. Consumers often use the
image of a region to make a decision. Wines from Napa, California are an example of this;
consumers will purchase a wine because it’s from Napa, and not for any other reason besides
origin (Atkin and Johnson 2010). The origin information gives a perceived notion that the wine
will be of superior quality and this leads to a risk reduction to the consumer’s purchase. The
belief is based off the concept that brand and region are indicators of wine quality.
Survey and Data Analysis Methods for Consumer Characteristics
Surveys are conducted as a means to collect information from a sample population to
make an inference about the entire population. Surveys are used as a way to collect
demographics, but they can also be used to find out consumer purchasing preferences. Surveys
can be implemented in various ways such as a written document completed by the person being
surveyed, an online questionnaire, a face-to-face interview, or a telephone interview (Barribeau,
2005). One type of written document is a survey mailed to the person being questioned. This is a
low cost option and allows you to reach large groups, however often people don’t take the survey
received in the mail. Another written survey is an in-person questionnaire. In this case, where the
surveyor gives the questionnaire to the person being questioned, there tends to be a higher

10
response rate. However, with this method, the surveyor can create a bias depending on the way
they present themselves and how the person views them. Another low cost option is a telephone
survey. Although the cost advantage, people often are not willing to take the time to respond.
The last option is the online questionnaire. This is a very low cost option. However there are
disadvantages; Opperman (1995) warns that initially there are many responses but as time goes
by survey responses significantly drop. Also this method is limited to only respondents with
computer and internet access.
Once the type of survey is chosen, the researcher must choose a design to best represent
the population. Nonprobability and probability sampling are two types of sampling techniques
that can be used. Nonprobability sampling means that random selection is not used when
creating the sample population, which thus creates a sampling bias meaning that some members
of the intended population are less likely to be included than others. On the other side,
probability sampling uses random selection, which allows the researcher to know the odds of
how well the sample represents the population. According to Weisberg, Krosnick, and Bowen
(1989), it is not surprising that most survey researchers prefer probability sampling methods
because of the bias that is created with nonprobability sampling. Three of the most common
probability samplings are simple random sample, stratified sample, and cluster sample. With
simple random samples, the sample is created from pulling individuals from a list of the
population. Stratified samples involve creating groups within the population then randomly
choosing from each group to create your sampling set. And finally in a cluster sample the
population is broken down into groups and then only one group is surveyed. However with this
method it is said that accuracy declines (Weisberg et. al, 1989).

11
Once the data has been collected it is important to analyze the findings. It is most
common to input the results in Microsoft Excel and then analyze the data by using a variety of
statistical tests. Another program that is commonly used is SPSS. This statistics program allows
the researcher to input data and is known for its ease in running statistical tests. Some of these
statistical tests include the independent sample t-test, chi-squared test, and ANOVA test. The use
of these tests can tell the researcher if there is a relationship among the data collected, and will
allow the researcher to reject or fail to reject the hypothesis.
The independent sample t-test examines differences between two groups on the response
to one variable, and is used on quantitative data. This is the most common method of testing the
hypothesis if two variables are related. To compute this test the mean, standard deviation, and
number of data points for each of the variables being compared is needed.
Another common test is the chi squared test, which indicates if two variables are related,
however it does not indicate the degree of relation. In order to complete this test a probability
value (p-value) is needed to determine if one can support the hypothesis. Most often a p-value of
.05 is used. If the p-value results from the chi squared test are greater than the p-value then the
researcher does not reject the hypothesis, if the result is less than the p-value then the hypothesis
must be rejected (Fisher and Yates 1990).
Another common test is the analysis of variance (ANOVA) which analyzes variation in
multiple groups on one or more variables. ANOVA is frequently used to test equality among
several means by comparing the variance among groups (Larson 2008). ANOVA is an extension
of the independent t-test in that it allows the comparison of means among several independent
samples at once. Once all the tests are finished the results can be analyzed to determine if the
overall hypothesis should be supported.

12
CHAPTER III
METHODOLOGY
Procedures for Data Collection
The primary objective for this study was to determine the factors that influence wine
purchases and then compare the differences between generations with a primary focus on
Millennials. A short written survey was administered asking participants how influential
particular factors are when purchasing wine and about their personal characteristics (see
Appendix). A written survey was chosen due to the private manner of responses and to allow
multiple people to complete surveys at the same time.
The survey was conducted throughout October, November, and December 2011, and
January 2012 at the tasting room of a winery in San Luis Obispo County called Rotta Winery,
located in Templeton, California. Rotta Winery was chosen because of its recognition as one of
the first three wineries established in the Paso Robles area, making it well known to many
consumers. A total of 220 residents of San Luis Obispo County over the age of 21 were surveyed
at Rotta Winery. Surveys were conducted Friday through Sunday between 10:30AM and
5:00PM because generally this is when most people go wine tasting. The number of people to be
surveyed was determined by using San Luis Obispo County’s wine consumer population of
69,147 to create a sample size proportionate to the population (SRDS 2012). For the purpose of
determining the sample size the researcher used a confidence level of 95 percent and a

13
confidence interval of 6.6. The confidence level tells the researcher how sure one can be that the
findings are accurate, and it represents how often the true percentage of the population lies
within the confidence interval. The confidence interval is the plus or minus figure that gives an
accuracy range for the research findings (MaCorr Research, 2012). For the purpose of this study
the confidence level and interval indicate that if the whole population were questioned then the
researcher is 95 percent sure the results would be within plus or minus 6.6 percent from the
sample results, thus resulting in the sample size of 220.
The survey included a variety of short and simple questions that allowed the researcher to
look into the influences of wine purchases (see Appendix). Upon leaving the winery, patrons
were randomly asked upon leaving the winery if they would take a brief survey. To randomly
select participants, the researcher asked every other person that left the winery if they could
complete the survey. The first question asked where the respondent lives in order to find out if
they represent San Luis Obispo County. If the respondent did not select San Luis Obispo County
then their response to the survey was not included in the research. In order to determine which
generation applies to the respondent, the second question asked which range best described the
respondent’s age. The third question asked how often they drink wine. This question helped to
distinguish the core drinkers (those who drink at least three times a month) from the marginal
drinkers (those drinking one to two times per month). If the respondent answered “never” to the
question of how often they drink wine, then their survey was removed since they do not fall into
the target of wine consumers.
Questions four through thirteen listed a variety of factors that influence people’s
decisions when purchasing wines. The factors that were chosen for this study was based on
previous research completed by Wolf, Carpenter and Qenani-Petrela (2005) and include brand

14
recognition, brand loyalty, varietal recognition, recommendation, expert rating, region, value,
label, food pairing and price. The respondent was asked to rate each factor on a scale of zero to
four, zero meaning not influential and four indicating extremely influential. The response to
these questions allowed the researcher to determine what the sample population deems as
influential to their wine purchases. Questions 14 through 16 related to the demographics of sex,
education level, and income. The response to these questions was used to further analyze the
responses and decided if these factors have any pull in what the respondent sees as influential to
their wine purchase.
Procedures for Data Analysis
After 220 complete surveys were obtained, the data was analyzed to explain the
demographic characteristics and preferences of the sampled San Luis Obispo County wine
drinkers. The survey responses were inputted into SPSS, allowing the researcher to easily
examine individual responses, sort the responses, and run the statistical tests needed. Since the
focus of this study is on the Millennial wine drinker, the results were sorted according to the
response given for age range. With these specified generational groups, the researcher was able
to compare the Millennials’ results to the responses of the other generations.
First the results were organized into tables in order to easily summarize the findings.
Tables were used to summarize the percentage of respondents by gender, education levels,
income levels, generation, as well as the percentage of respondents that fell into the categories of
core or marginal wine drinkers. The tables were also used to display the percentage of
respondents that chose each influential factor. A table was created for the entire sample and

15
tables for each generation segment. With the use of these tables the results were easily displayed
and allowed for a quick, visible determination of which factors were most influential.
Next, SPSS was used to process the responses using a chi-squared test, an independent
sample t-test, ANOVA and ANOVA post hoc. The responses to question four through thirteen,
as well as questions fourteen through sixteen were analyzed using these statistical tests. The chi-
squared test allowed the researcher to test if response to influential factors for wine purchases is
related to generational segmentation. From these results the researcher was able to note the
degree of influence each factor had. The chi-squared results allowed the researcher to create a
table showing the factors that were “extremely,” “very,” or “not” influential.
Next, the independent sample t-test was used to allow the researcher to see the variations
in means between the target and non-target groups and was used to compare the response by
Millennials and the response given by the other generations for each influencing factor
(questions four to thirteen). From these results the researcher determined whether a response to
certain influential factors was recorded more times for Millennials than the other generations. A
p-value was given in these results; this indicated if there were significant differences in what
influences wine purchases between generations.
Next, analysis of variance (ANOVA) was used for the comparison between each
generation on the factors that were influential for their wine purchases. The results from
questions four through thirteen were used again for this statistical test, and the generations were
separated by using the response to question two. With ANOVA, a p-value is given to indicate if
there was a significant difference in the influence of the factors for each generation.
Following ANOVA, ANOVA post hoc was used for questions four through thirteen to
compare the response given by Millennials to the response for each other generation. This
16
allowed the researcher to determine which generations were similar to Millennials and which
generations differed from Millennials. Like the previous statistical tests, a p-value is used to
determine if significant differences are present.
After all the tests had been completed the researcher was able to determine if there were
differences between what influences wine purchases between the generations. The hypothesis
that there are no significant differences in the factors that influence Millennials compared to
prior generations will be rejected if the results from the statistical tests indicate a p-value less
than .05. The hypothesis that wine consumers are more influenced by price point, brand
recognition, and region will be rejected if the results from ANOVA indicate a p-value less than
.05, and if the results from independent t-test indicate a p-value less than .05. If the hypotheses
from ANOVA and independent t-test are rejected, then the overall hypothesis must be rejected as
well.
Finally in order to determine if the demographics of gender, education, and income level
affect wine purchase decisions the chi- squared test was used. The response to questions four
through thirteen were each compared to the response to questions fourteen through sixteen in
order to indicate if a relationship was present. In order to declare that there is a relationship
between the two factors being compared a p-value was used. This p-value was used to test
whether the researcher can fail to reject the hypothesis that the factors are in fact related; or if not
then the hypothesis is rejected.

17
Assumptions
The results from the research are dependent upon the assumption that all respondents
answered truthfully. The researcher also acted on the assumption that respondents answered in a
way that reflects their true purchasing behavior. It should be noted that some consumers do not
always know what influences their purchases and their response to the survey may not be the
same as their actions while shopping. The research is also dependent on the assumption that the
researcher completed the survey properly. There is the possibility that bias and incorrect answers
may have resulted if the survey wasn’t delivered properly. The researcher also made the
assumption that the sample size provides an accurate representation of San Luis Obispo County
wine consumers.
Limitations
The results of the survey were limited to only the responses from the randomly selected
wine drinkers in San Luis Obispo County who visited Rotta Winery on the given days the survey
was conducted. It was also limited to only those visitors that were willing to participate. This in
turn creates a self-selection bias which may impact the results in that the respondents that are
more inclined to participate have a greater interest in wine. Also, since the survey was conducted
only in San Luis Obispo County, the results and conclusions were based only on those responses
and is not a complete representation for the nation.

18
CHAPTER IV
RESULTS
Demographics of Survey Respondents
Below, Table 1 summarizes the demographics of the survey respondents. As shown, there
was an even distribution between male and female patrons that were surveyed. Also, the ages of
the respondents were approximately evenly distributed between the generation segments. Of the
people surveyed, 44.1% responded that a Bachelor’s degree was their highest level of education.
While 58.3% of the respondents made an income under $75,000. And 56.8% were considered
core wine drinkers. In comparison to the research results, based on research conducted by Wine
Market Council (2009), for US core wine drinkers there was also an even distribution between
males and females. However, the generation distribution from the demographics was not the
same. Based on the report, there were more that fell into the Baby Boomers and less in each of
the other generation segments. Another difference between the survey and the demographic
report from Wine Market Council (2009) was that there were slightly less (34%) in the report
with a Bachelor degree as their highest education level. Base on the comparisons from the
research and Wine Market Council’s report there are some similarities and differences in the
sample population of San Luis Obispo County wine drinkers compared to the sample US wine
consumers.

19
Table 1: Summary of Demographics for Entire Sample Population
To examine the demographics of those surveyed more extensively, each generation was
analyzed. The gender distribution by generation is summarized in Table 2. As shown, for
Millennials, 59.3% were male and 40.7% were female. Next for the Gen Xers, 55.4% were male
and 44.6% were female. But unlike the Millennials and Gen Xers, there were more females
surveyed for the Baby Boomers and traditionalists. Of the Baby Boomers surveyed, 40.4% were
male and 59.6% were female. Lastly for the Traditionalists, 43.8% were male and 56.3% were
female. The summary from Table 2 shows that for the younger generations, Millennials and Gen
Xers, males are the more likely to be the target consumers of wine, and for the older generations,
Baby Boomers and Traditionalists, females are the more likely target consumer for wine.
Age Percent Gender Percent Consumption Level Percent
21-36 26.8% Male 50% Core 56.8%
35-46 25.5% Female 50% Marginal 43.2%
47-65 25.9%
65 + 21.8%
Income Percent Education Percent
Less than $20,000 4.1% Highschool graduate 6.8%
$20,000 to $34,999 10.0% Some college no degree 22.7%
$35,000 to $49,999 20.5% Associate degree 17.7%
$50,000 to $74,999 23.6% Bachelor degree 44.1%
$75,000 to $99,999 18.6% Graduate degree 8.6%
$100,000 to $149,999 14.5%
$150,000 or more 8.6%

20
Table 2: Gender Distribution by Generation
Following gender, the distribution of education between the generations was analyzed;
this data is summarized in Table 3. About half of the Millennials’ highest level of education
completed was a Bachelor’s degree. Less than 40% of Gen Xers indicated that their highest
degree of education was a Bachelor’s degree. For Baby Boomers, over half of those surveyed
had received their Bachelor’s degree or higher. Slightly more than a quarter of Traditionalists
had received their Bachelor’s degree.
Table 3: Education Level Distribution by Generation
Following education, income level was analyzed; Table4 summarizes the income level
distribution between generations. Over 50% of the Millennials surveyed made an income over
$50,000. Almost 50% of the Gen Xers surveyed made over $50,000 a year. Baby Boomers and
Traditionalists had a higher income distribution. Almost 45% of Baby Boomers made over
$100,000 a year, and over 50% of Traditionalists made more than $75,000 a year.
Gender Millennials Gen Xers Baby Boomers Traditionalists
Male 59.3% 55.4% 40.4% 43.8%
Female 40.7% 44.6% 59.6% 56.3%
Education Millennials Gen Xers Baby Boomers Traditionalists
Highschool graduate 3.4% 5.4% 10.5% 8.3%
Some college no degree 13.6% 25.0% 15.8% 39.6%
Associate degree 18.6% 23.2% 14.0% 14.6%
Bachelor degree 50.8% 39.3% 56.1% 27.1%
Graduate degree 13.6% 7.1% 3.5% 10.4%

21
Table 4: Income Level Distribution by Generation
Finally the consumption level category was analyzed; Table 5 summarizes the
distributions by generation. Of Millennials, 26.3% were considered core wine drinkers. Over
23.2% of the Gen Xers surveyed fell into the core wine drinker category. For Baby Boomers,
27.4% were categorized as core wine drinkers. And lastly, 23.1% of Traditionalists considered
themselves core wine consumers. Although the percentages are not the same, this corresponds
with research from Wine Market Council (2009) that states that Baby Boomers make up the
highest percentage of core wine drinkers.
Table 5: Consumption Level Category Distribution by Generation
Income Millennials Gen Xers Baby Boomers Traditionalists
Less than $20,000 8.5% 3.6% 0.0% 4.2%
$20,000 to $34,999 18.6% 14.3% 3.5% 2.1%
$35,000 to $49,999 23.7% 28.6% 15.8% 12.5%
$50,000 to $74,999 16.9% 33.9% 15.8% 29.2%
$75,000 to $99,999 11.9% 12.5% 21.1% 31.3%
$100,000 to $149,999 8.5% 7.1% 29.8% 12.5%
$150,000 or more 11.9% 0.0% 14.0% 8.3%
Consumption Level Millennials Gen Xers Baby Boomers Traditionalists
Core 26.3% 23.2% 27.4% 23.1%
Marginal 27.2% 27.2% 24.8% 20.8%

22
Analysis
In order to discover which factors were most influential when purchasing wine, the
researcher ranked the factors according to highest response. In Table 6, below, Baby Boomers’
most highly ranked factor for influence to wine purchases was wine varietal followed by
recommendation from family and friends, having tasted the wine before, and good value for the
wine. For Traditionalists, 92.1% ranked having tasted the wine before as the most influential
factor when purchasing wine. Also highly ranked by Traditionalists were wine varietal, region
the wine came from, and recognition of the wine’s brand.
Table 6 summarizes the rankings of the influential factors to wine purchases. As shown,
for the entire sample, having tasted a brand before had the highest response followed by value
and varietal. For each generation segment the rankings for most influential factors were not the
same. For Millennials, 91.5 % stated that if a wine was of good value that influenced their
purchase decision, recognizing a wine brand, having tasted a brand before, and price were also
important for Millennial wine purchases. Wine as a good value was also important for Gen Xers,
but at a lower degree compared to Millennials. Gen Xers also found recommendations from
family and friends, having tasted the wine brand before, and varietal to be influential to their
wine purchases. Baby Boomers’ most highly ranked factor for influence to wine purchases was
wine varietal followed by recommendation from family and friends, having tasted the wine
before, and good value for the wine. For Traditionalists, 92.1% ranked having tasted the wine
before as the most influential factor when purchasing wine. Also highly ranked by Traditionalists
were wine varietal, region the wine came from, and recognition of the wine’s brand.

23
Table 6: Rankings of Most Influential Factors to Wine Purchases by Generation
In order to test the hypothesis that there is a difference between age and the influence of
selected factors when purchasing wine a chi-squared test was used. The output of the chi-squared
test provided the percentage from each generation to describe a factor as extremely, very,
somewhat, slightly, or not influential and the associated p-value. Table 7 summarizes the factors
that participants perceived as extremely, very, or not influential and does not include the factors
that respondents viewed as slighlty or somewhat influential. As shown, wine label was the only
factor that did not have a significant difference between generations. The table also shows that
Millennials viewed value to be the most “extremely” influential factor to consider when
Entire Sample n= 220 Millennials n= 59 Gen Xers n= 56
Brand Tasted 83.7% Value 91.5% Value 85.4%
Value 80.1% Brand Recognition 85.4% Recommendation 84.3%
Varietal 79.6% Brand Tasted 84.7% Brand Tasted 81.1%
Recommendation 78.4% Price 84.7% Varietal 79.6%
Brand recognition 76.7% Recommendation 82.7% Price 76.4%
Price 73.3% Varietal 75.9% Brand Recognition 76.1%
Region 67.4% Food Pairing 64.4% Food Pairing 65.0%
Food Pairing 64.0% Region 59.7% Region 64.6%
Expert Rating 55.9% Expert Rating 54.2% Expert Rating 57.5%
Label 45.4% Label 44.7% Label 46.8%
Baby Boomers n=57 Traditionalists n= 48
Varietal 81.4% Brand Tasted 92.1%
Recommendation 78.9% Varietal 82.1%
Brand Tasted 78.2% Region 76.7%
Value 75.4% Brand Recognition 76.3%
Region 70.2% Recommendation 65.4%
Price 69.8% Value 65.4%
Brand Recognition 68.8% Price 59.6%
Food Pairing 68.4% Food Pairing 57.1%
Expert Rating 61.4% Expert Rating 49.6%
Label 43.2% Label 47.1%
24
purchasing wine. Gen Xers considered value to be “extremely” influential but not to the same
level as Millennials. For Baby Boomers, varietal was ranked highest as an “extremely”
influential factor, followed closely by having tasted a brand before. Lastly for Traditionalists,
60.4% considered having tasted a brand before as “extremely” influential to their wine
purchases.
For factors that were considered to have no influence, 37.3% of Millennials considered
label to have no influence, and 10.2% considered expert’s ratings to have no influence. Other
factors that had no influence for some Millennial wine consumers included varietal (5.1%),
region (5.1%), food pairing (5.1%), value (3.4%), and price (1.7%). For Gen Xer wine
consumers surveyed, 30.4% considered label to have no influence to their wine purchases, and
17.9% considered expert’s rating to have no influence. Other factors some Gen Xers considered
to not be influential were food pairing (10.7%) and region of origin (7.1%). For 42.1% of Baby
Boomers wine label was considered to have no influence to their wine purchases. Food pairing
(10.5%), brand recognition (3.5%), and expert ratings (1.8%) were also factors some Baby
Boomers considered to have no influence to their wine purchases. Lastly, 27.1% of
Traditionalists considered expert rating to have no influence to wine purchases, followed by wine
label (25.0%) and recommendations (22.9%). Other factors some traditionalists considered to
have no influence on wine purchases included food pairing (18.8%), value (6.3%), price (6.3%),
and brand recognition (2.1%).

25
Table 7: Extremely, Very, and Non Influential Factors for Wine Purchases by Generation
Millennial Gen Xer Baby Boomer Traditionalist P-value
Brand Tasted
Extreme 52.5% 26.8% 35.1% 60.4% 0.000 **
Influence Very 20.3% 57.1% 35.1% 39.6%
None 0.0% 0.0% 0.0% 0.0%
Brand Recognition
Extreme 42.4% 23.2% 17.5% 31.3% 0.008 **
Influence Very 42.4% 39.3% 28.1% 33.3%
None 0.0% 0.0% 3.5% 2.1%
Varietal
Extreme 32.2% 26.8% 38.6% 37.5% 0.003 **
Influence Very 25.4% 44.6% 29.8% 41.7%
None 5.1% 0.0% 0.0% 0.0%
Region
Extreme 13.6% 5.4% 21.1% 25.0% 0.000 **
Influence Very 13.6% 37.5% 28.1% 41.7%
None 5.1% 7.1% 0.0% 0.0%
Recommendation
Extreme 44.1% 39.3% 26.3% 8.3% 0.000 **
Influence Very 25.4% 42.9% 42.1% 33.3%
None 0.0% 0.0% 0.0% 22.9%
Expert Rating
Extreme 10.2% 8.9% 7.0% 4.2% 0.009 **
Influence Very 11.9% 21.4% 22.8% 16.7%
None 10.2% 17.9% 1.8% 27.1%
Price
Extreme 44.1% 32.1% 15.8% 2.1% 0.000 **
Influence Very 39.0% 30.4% 26.3% 22.9%
None 1.7% 0.0% 0.0% 6.3%
Value
Extreme 72.9% 51.8% 17.5% 6.3% 0.000 **
Influence Very 18.6% 28.6% 42.1% 35.4%
None 3.4% 0.0% 0.0% 6.3%
Label
Extreme 3.4% 0.0% 7.0% 2.1% 0.291
Influence Very 11.9% 16.1% 7.0% 6.3%
None 37.3% 30.4% 42.1% 25.0%
Food Pairing
Extreme 18.6% 7.1% 17.5% 4.2% 0.006 **
Influence Very 22.0% 46.4% 33.3% 35.4%
None 5.1% 10.7% 10.5% 18.8%
Chi Square Test: ** significance at .05

26
To continue to test the hypothesis that there is a difference in the factors that influence
wine purchases between Millennials and prior generations an independent t-test was used next.
The independent t-test was used on questions four through thirteen. The output of the t-test
provided the percentage from each group, as well as a p-value. Of the ten influencing factors on
wine purchases five of the factors were significantly different between Millennials and prior
generations. As shown in Table 8, there is a significant difference in the influence of brand
recognition, region of grape origin, recommendations from family and friends, price, and value
between Millennials and prior generations. The significant differences were a result of the
Millennials viewing brand recognition, recommendations from family and friends, price, and
value as more influential than prior generations viewed these factors. The significant differences
were also a result of the prior generations viewing wine region of origin more influential that
Millennials viewed it.
Table 8: Factors Influencing Wine Purchases: Millennials Compared to Other Generations
FactorMillennials
Other
GenerationsP-value
n=59 n=161
Brand Tasted 84.7% 83.4% 0.600
Brand Recognition 85.4% 73.5% 0.000 **
Varietal 75.9% 81.0% 0.101
Region 59.7% 70.1% 0.001 **
Recommendation 82.7% 76.8% 0.028 **
Expert Rating 54.2% 56.5% 0.506
Price 84.7% 69.1% 0.000 **
Value 91.5% 75.9% 0.000 **
Label 44.7% 45.6% 0.807
Food Pairing 64.4% 63.9% 0.878
Independent t-test ** Significance at .05 level
* Significance at .10 level

27
To further analyze the influence of the selected influential factors on wine purchases
ANOVA was used. Similar to the independent t-test, ANOVA also looks at the differences
between Millennials and the other generations. However, unlike the t-test, ANOVA allows for
past generations to be separated instead of being grouped together. Questions four through
thirteen were used to complete ANOVA, which gives a p-value that allows the researcher to
determine the significant differences. Table 9 summarizes the results from ANOVA; of the ten
influential factors, seven had significant differences when analyzed with ANOVA. The
significant differences included brands tasted before, brand recognition, wine region of origin,
recommendations from family and friends, expert ratings, price of the wine, and if the wine is of
good value. These significant differences were a result of Traditionalists viewing tasting a brand
before and region as more influential, Millennials viewing brand recognition, price and value as
more influential, and Gen Xers considering recommendations and expert ratings more influential
to their wine purchases. The factors of varietal, label, and food pairing did not show any
significant differences.
Table 9: Factors Influencing Wine Purchases: All Generations Compared
Factor Millennials Gen Xers Baby Boomers Traditionalists P-value
n=59 n=56 n=57 n=48
Brand Tasted 84.7% 81.1% 78.2% 92.1% 0.000 **
Brand Recognition 85.4% 76.1% 68.8% 76.3% 0.000 **
Varietal 75.9% 79.6% 81.4% 82.1% 0.266
Region 59.7% 64.6% 70.2% 76.7% 0.000 **
Recommendation 82.7% 84.3% 78.9% 65.4% 0.000 **
Expert Rating 54.2% 57.5% 61.4% 49.6% 0.050 **
Price 84.7% 76.4% 69.8% 59.6% 0.000 **
Value 91.5% 85.4% 75.4% 65.4% 0.000 **
Label 44.7% 46.8% 43.2% 47.1% 0.784
Food Pairing 64.4% 65.0% 68.4% 57.1% 0.102
ANOVA ** Significance at .05 level
* Significance at .10 level

28
ANOVA post hoc, an extension of ANOVA, allowed the researcher to compare the
Millennial response to the responses from each other generation separately. For example,
Millennial response for the influence of brand recognition versus the Baby Boomer response for
the influence of brand recognition. ANOVA post hoc gave the researcher a greater understanding
on the differences between Millennials and each other generation. Table 10 summarizes the
significant differences between generations. The results of ANOVA post hoc showed that
between Millennials and Gen Xers we find there was a significant difference in the influence of
brand recognition and price point. There were significant differences between Millennials and
Baby Boomers in the influence of brand recognition, region of wine origin, price point, and
value. Millennials and Traditionalists expressed a significant difference in the influence of region
of wine origin, recommendations from family and friends, price point, and value.
Table 10: Factors Influencing Wine Purchases: Millennials compared to each Generation
Factor Comparison P-value
Brand Recognition
Millennial vs. Gen Xer 0.036 **
Millennial vs. Baby Boomer 0.000 **
Millennial vs. Traditional 0.054 *
Region
Millennial vs. Baby Boomer 0.029 **
Millennial vs. Traditional 0.000 **
Recommendation
Millennial vs. Traditional 0.000 **
Price
Millennial vs. Gen Xer 0.068 *
Millennial vs. Baby Boomer 0.000 **
Millennial vs. Traditional 0.000 **
Value
Millennial vs. Baby Boomer 0.000 **
Millennial vs. Traditional 0.000 **
ANOVA Post Hoc ** Significance at .05 level
* Significance at .10 level

29
Not only were there differences in the factors that influence wine purchases between
Millennials and prior generations, but there were also differences in the factors between the
demographics of gender, education level, and income level. In order to test that these
demographics have an effect on wine purchases ANOVA was used to note the significant
differences. The results from ANOVA are summarized in Table 11, Table 12, and Table 13.
From analyzing gender the researcher found a significant difference in the influence of wine
varietal, region of wine origin, and price between males and females, all of which were more
influential for men.
Table 11: Factors Influencing Wine Purchases: Gender Compared
There were significant differences in the influence of wine varietal, wine region of origin,
expert rating of wine, and wine label by education level. Wine labels were reported to influence
over 70% of respondents with only a highschool education and were much less of an influence
Gender
Male Female P-value
Brand Tasted 85.6% 81.8% 0.103
Brand Recognition 78.4% 75.1% 0.209
Varietal 82.5% 76.7% 0.016 **
Region 69.8% 64.9% 0.084 *
Recommendation 76.9% 79.8% 0.225
Expert Rating 54.2% 57.6% 0.256
Price 76.2% 70.4% 0.031 **
Value 82.2% 78.0% 0.116
Label 43.3% 47.5% 0.172
Food Pairing 64.9% 63.1% 0.570
ANOVA ** significance at .05
* significance at .10

30
for those with higher education. Wine region of origin was reported to influence over 80% of
respondents with only a highschool education and was much less of an influence for respondents
with higher education.
Lastly, Table 13 shows the significant differences between income levels. There were
significant differences in the influence of all the factors except for recommendations from family
and friends.
Table 12: Factors Influencing Wine Purchases: Education Level Compared
Table 13: Factors Influencing Wine Purchases: Income Level Compared
Education Level
Highschool
Graduate
Some College
No Degree
Associate
degree
Bachelor
degree
Graduate
degree
P-value
Brand Tasted 85.3% 83.2% 82.1% 84.3% 84.2% 0.956
Brand Recognition 85.3% 74.4% 76.4% 76.3% 78.9% 0.406
Varietal 82.7% 77.6% 79.0% 82.3% 70.5% 0.086 *
Region 81.3% 73.6% 63.6% 64.9% 60.0% 0.003 **
Recommendation 80.0% 76.0% 80.0% 79.0% 76.8% 0.812
Expert Rating 60.0% 63.6% 53.3% 54.6% 44.2% 0.014 **
Price 73.3% 75.6% 73.8% 74.0% 62.1% 0.152
Value 73.3% 76.8% 85.1% 81.4% 76.8% 0.154
Label 72.0% 52.4% 37.9% 42.9% 33.7% 0.000 **
Food Pairing 64.0% 66.0% 62.6% 61.9% 72.6% 0.434
ANOVA ** significance at .05
* significance at .10
Income Level
Less than
$20,000
$20,000 to
$34,999
$35,000 to
$49,999
$50,000 to
$74,999
$75,000 to
$99,999
$100,000 to
$149,999
$150,000 or
more P-value
Brand Tasted 75.6% 74.5% 87.6% 82.7% 84.9% 81.9% 92.6% 0.012 **
Brand Recognition 73.3% 81.8% 83.6% 77.3% 78.5% 68.8% 64.2% 0.001 **
Varietal 62.2% 70.0% 85.8% 83.5% 80.0% 78.1% 75.8% 0.000 **
Region 68.9% 60.9% 72.9% 66.2% 72.7% 67.5% 52.6% 0.007 **
Recommendation 93.3% 83.6% 78.2% 75.0% 77.1% 77.5% 78.9% 0.102
Expert Rating 64.4% 57.3% 62.7% 48.5% 54.2% 56.9% 56.8% 0.073 *
Price 75.6% 79.1% 83.1% 72.7% 75.6% 60.6% 60.0% 0.000 **
Value 82.2% 88.2% 87.6% 79.2% 77.1% 73.1% 72.6% 0.005 **
Label 62.2% 50.0% 52.4% 38.1% 55.6% 36.3% 28.4% 0.000 **
Food Pairing 82.2% 63.6% 69.8% 55.4% 65.9% 66.9% 56.8% 0.007 **
ANOVA ** significance at .05
* significance at .10

31
CHAPTER V
SUMMARY, CONCLUSIONS, AND RECOMMENDATIONS
Summary and Conclusions
The results proved the hypothesis that Millennials and prior generations are influenced by
the same factors when purchasing wine to be incorrect; it showed there to be significant
differences between Millennials and prior generations when purchasing wine. This allowed the
researcher to reject the hypothesis that the influences for wine purchases were the same for
Millennials and prior generations. The chi-squared test showed there were significant differences
in the degree of influence between all generations for all of the factors except wine label. The
independent t-test showed compared to all other generations (as one group), Millennials have
significant differences in the influence of wine brand recognition, region of wine origin,
recommendations from family and friends, price, and value of the wine. ANOVA proved there to
be significant differences when comparing each generation to each other for all of the factors
except wine varietal, wine label, and food paring. Finally ANOVA post hoc showed significant
differences between Millennials and each generation. There were significant differences between
Millennials and Gen Xers, Millennials and Baby Boomers, and Millennials and Traditionalists in
the influence of brand recognition and price. For region and value there were significant
differences between Millennials and Baby Boomers, as well as Millennials and Traditionalists.

32
There was also a significant difference in the influence of recommendations between Millennials
and Traditionalists.
Based on the results that there are significant differences between the generations on the
influence of brand recognition and recommendations, it can be concluded that socializing plays a
part in wine purchases. Meaning that in order to increase the likeliness of being purchased a wine
has to be recognized; socializing, discussing wine, and getting recommendations from peers can
increase brand recognition. There was also a significant difference between Millennials and prior
generations on the influence of price and value. These results suggest that not only are
Millennials looking for a wine that is affordable, but they also want a wine that gives them more
for their money. As a generation that currently has a lower income compared to other
generations, Millennials will want a product that gives them more for less. An interesting result
of the research showed that label was not perceived as influential to wine purchases. This goes
against past research completed by Barber and Almanza (2008) that showed that consumers
placed great significance on the overall label and bottle packaging. The findings from this study
may have been affected by respondents not realizing that a wine’s label does, in fact, influence
their purchases. Another interesting result from the research showed the decreasing influence of
a wine’s region. This may be due to Millennials being more open to trying wines from different
regions, but also shows that Millennials have fewer preconceived notions about regions and their
impact on wine quality.
The hypothesis that wine purchases will be mostly influenced by price, brand recognition
and region also proved to be incorrect. By looking at the ranking of most influential factors for
all generations (Table 6), it is seen that having tasted the brand, value, and varietal were
perceived as the most influential factors to wine purchases. However, when looking at each

33
generation there are differences in these rankings. Millennials perceive value, brand recognition,
and having tasted the brand before to have the most influence. Gen Xers view value,
recommendations, and having tasted the brand before to have the most influence. Baby Boomers
perceived that varietal, recommendation, and having tasted the brand before to be most
influential to wine purchase. And Traditionalists viewed having tasted the brand, varietal, and
region to be most influential. Based on these rankings, only Millennials and Traditionalists
supported the hypothesis that brand recognition and region were the most influential. Millennials
and Gen Xers both perceived value to be influential which can consider them as price conscious
shoppers. Based on the rankings for all generations and for each generation, it can be concluded
that having tasted a wine brand before is of highest influence to wine consumers, also value of
the wine and the varietal are of high influence to wine purchases.
This study also analyzed the impact of demographics and the influence of factors to
purchasing wine. In particular this study analyzed the demographics of gender, education, and
income level. From these results it showed there were significant differences between males and
females on the influence of varietal, region, and price. Based on education, there was a
significant difference in the influence of wine varietal, wine region of origin, expert rating of
wine, and wine label. Lastly, for income level, there were significant differences in the influence
of all of the factors except recommendations from family and friends.
Based on the results from analyzing the demographics it can be concluded that for men
the influence from the type of wine and where the wine originated from are more important
compared to women. For those with lower levels education level wine label, expert rating, and
region of origin are more influential to wine purchases than those with higher levels education.
From this it can be concluded that individuals with lower education levels rely on the opinions of

34
others to make purchase decisions, along with region which could be used as an indicator of
quality. Lastly, by looking at income level, there were no significant differences between the
income levels, except for the influence recommendations. The differences show that income
level changes what factors of wine will be influential to making purchases, but it also shows that
between income levels recommendations have similar influences to all consumers.
Recommendations
This research was limited to only residents of San Luis Obispo County, it would
be recommended to extend further research to outside of San Luis Obispo County. This research
can be expanded to other counties, states, and countries. By expanding this research it will
provide wine professionals a true representation of the factors that influence wine purchases.
This study was also limited on the purchasing behavior of the respondents. In further research it
would be recommended to extend the survey to questions relating to why wine is purchased, how
much wine is purchased, at what prices wine is purchased, etc. By asking these questions the
researcher will have better knowledge of the wine consumers’ behaviors. It would also be
interesting to follow a group of Millennials throughout their lifespan to determine if their current
purchasing behavior stays consistent as they age. This would determine if there are actually
generational differences or if the differences in factors that influence wine purchases to due to
age.

35
References Cited
Atkin, T and R. Johnson. 2010. “Appellation as an indicator of quality.” International
Journal of Wine Business Research, 22(1), pp.42-61.
Barber, Nelson, Tim Dodd, and Richard Ghiselli. 2008. “Capturing the Younger Wine
Consumer.” Journal of Wine Research. 19. no. 2: 123-141.
Barber, Nelson, and Barbara Almanza. 2008. “Influence of Wine Packaging on Consumers’
Decision to Purchase.” Journal of Food Service Business Research. Vol.9 Iss.4. 83-98.
Barribeau, P. (2005). Writing Guide: Survey Research. Colorado State University Department of
English
Fisher, R. A., and F. Yates. 1990. "CHI-SQUARE TEST." Penn State Lehigh Valley.
Fowler, Deborah C., Celia D. Henley, Jingxue Yuan, Betty L. Stout, and Ben K. Goh.
"Marketing Wine to Millennials." Paper presented at the International CHRIE
Conference, Massachusetts, July 31. 2010.
Gluckman, R.L. 1990. ‘‘A consumer approach to branded wines.’’ European Journal of
Marketing, Vol. 24 No. 4: 27-46.
Hochstein, Mort, 2009. "Stunning Growth in Core Wine Drinking Population." Wine Business
Monthly March.
Jacoby, J. and J.C. Olson. 1985. Perceived Quality: How Consumers View Stores and
Merchandise. Lexington Books, Lexington, MA.

36
Larson, Martin G. 2008. "Analysis of Variance." Circulation: Journal of American Heart
Association. Vol. 117: 115-21.
Lockshin, L. 2000. ‘‘Using involvement and brand equity to develop a wine industry strategy’’,
The Australian Grapegrower and Winemaker, December, 47-52.
Lockshin, L. and W. Rhodus.1993. ‘‘The effect of price and oak flavor on perceived wine
quality.’’ International Journal of Wine Marketing, Vol. 5 No. 2: 13-25.
MaCorr Research. 2012. “Sample Size Methodology.”
Nowak, Linda, Liz Thach, and Janeen E. Olsen. 2006. “Wowing the Millennials: Creating Brand
Equity in the Wine Industry.” Journal of Product & Brand Management. 15 . no. 5: 318-
323.
Olsen, Janeen, Elizabeth Thach, and Linda Nowak . “Consumer Socialization of U.S. Wine
Consumers.” Paper presented at the 3rd
International Wine Business and Marketing
Research Conference, Montpellier, France, July6-8. 2006.
Opperman, M. 1995. E-Mail Surveys--Potentials and Pitfalls. Marketing Research, 7 (3), 29-33
SRDS. 2012. Local Market Audience Analyst. “Lifestyle Ranking: San Luis Obispo County-
Alcohol & Tobacco.”
Teagle, J., Mueller, S. and Lockshin, L. “How do Millennials’ wine attitudes and behavior differ
from other generations?” Presented at the 5th
International Association of Wine Business
Research Conference, Auckland, New Zealand, Febr 8-10, 2010.

37
Thach, Elizabeth, and Janeen Olsen, 2006. "Market Segment Analysis to Target Young Adult
Wine Drinkers." Agribusiness: An International Journal. 22:3: 307-22.
Thach, Liz. 2005. “How to Market to Millennials.” Wine Business Monthly.
Weissberg, H.F., J.A. Krosnick, and B.D. Bowen. 1989. An introduction to survey research and
data analysis. Glenview, IL: Scott Foresman.
Wine Market Council.2009. The US Wine Market: Consumer Trends and Analysis.
Wolf, Marianne McGarry, Scott Carpenter, and Eivis Qenani-Petrela. 2005. “A Comparison of
X, Y, and Boomer Generation Wine Consumers in California. Journal of Food
Distribution Research. 186- 191.
Wyner, G.A. 1995. “Segmentation analysis, then and now.” Marketing Research: A Magazine of
Management and Applications. Vol 7(1), 40-41.

38
APPENDIX
Consumer Research on Wine Purchase Influences
1. Where do you live?
a. San Luis Obispo County
b. Other California area
c. Outside of California
2. Which of the following ranges describes your age?
a. 20 or younger
b. 21-34
c. 35-46
d. 47-65
e. 65 or older
3. How often do you drink wine?
a. At least 3 times a month
b. 1 to 2 times a month
c. Never
The following is a list of factors that influence people when purchasing wines. Please indicate
the influence of each factor for you when you purchase wine. Please circle one for each of the
following factors; 1= not influential, 2 = slightly influential, 3 = somewhat influential, 4 = very
influential, and 5 = extremely influential.
4. Brand I have tasted: 1 2 3 4 5
5. Brand I recognize: 1 2 3 4 5
6. Varietal I recognize: 1 2 3 4 5
7. Well known region: 1 2 3 4 5
8. Recommendation: 1 2 3 4 5
9. Expert Rating: 1 2 3 4 5
10. Sale Price: 1 2 3 4 5
11. Good Value: 1 2 3 4 5
12. Label: 1 2 3 4 5
13. Food Pairing: 1 2 3 4 5
Continued on backside
39
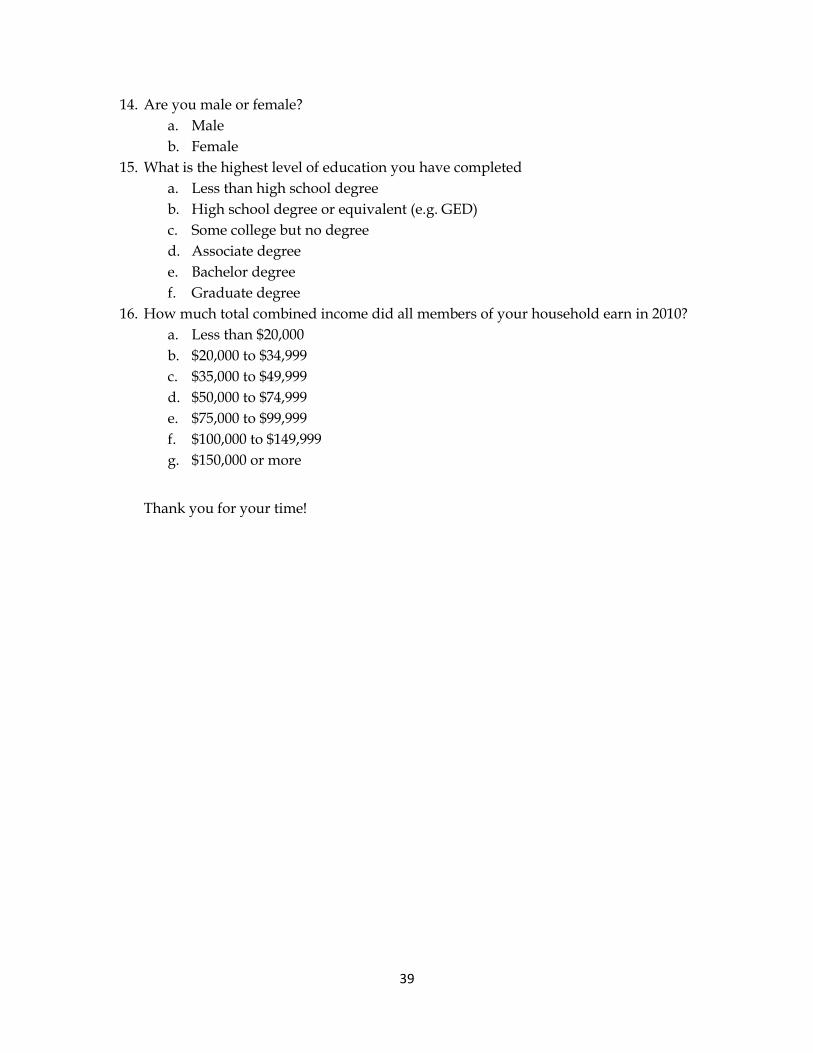
14. Are you male or female?
a. Male
b. Female
15. What is the highest level of education you have completed
a. Less than high school degree
b. High school degree or equivalent (e.g. GED)
c. Some college but no degree
d. Associate degree
e. Bachelor degree
f. Graduate degree
16. How much total combined income did all members of your household earn in 2010?
a. Less than $20,000
b. $20,000 to $34,999
c. $35,000 to $49,999
d. $50,000 to $74,999
e. $75,000 to $99,999
f. $100,000 to $149,999
g. $150,000 or more
Thank you for your time!