influences of the normative environment of peer groups on community college students'...
TRANSCRIPT
Research in Higher Education, Vol. 41, No. 6, 2000
INFLUENCES OF THE NORMATIVEENVIRONMENT OF PEER GROUPSON COMMUNITY COLLEGESTUDENTS’ PERCEPTIONS OF GROWTHAND DEVELOPMENT
Corinna A. Ethington
:::: : : : : : : : : : : : : : : : : : : : : : : : : : : : : : : : : : : : : : : : : : : : : : : : : : : : : : : : : : : : : : : : : : : : : : : : : :Grounded in Weidman’s (1989a) socialization model and Pace’s (1979b) theoreticalconception of “quality of effort,” this study examines the effects of peer groups oncommunity college students perceptions of general educational gains. Peer groupswere defined as the aggregate student body within an institution. The sample con-sisted of a national sample of community college students who had responded to theCommunity College Student Experiences Questionnaire. Given the nested structureof the data, hierarchical linear modeling was used to examine institutional- and stu-dent-level effects. Dominant influences on students’ perceived gains were from thequality of effort exerted by students. Aggregates of individual-level measures wereused as indicators of the peer environment and had little impact on individual-levelestimates.
:::::::::::::::::::::::::::::::::::::::::::::::::::::::::::::::::::::::::::::::::::::::::::::::::
Pascarella and Terenzini (1998) note that the vast body of research on theimpact of college on students has led to an understanding of a variety of institu-tional contexts that support student development (e.g., faculty emphasis onteaching and student development, small institution size, frequent interactionbetween students and both peers and faculty). However, this research has domi-nantly focused on students attending four-year institutions, and they note thatwith respect to community colleges “we are functioning in virtual ignorance ofthe educational impact of one of the nation’s most significant social institutions”(p. 155). Additionally, the research related to community colleges reviewed byPascarella and Terenzini (1991) was focused primarily on comparisons on avariety of outcomes between students initially attending two-year institutions
A previous version of this study was presented at the Association for the Study of Higher Educa-tion, Miami, November 1998.
Address correspondence to: Corinna A. Ethington, Counseling, Educational Psychology and Re-search, Ball Hall 100, University of Memphis, Memphis, TN 38152.
703
0361-0365/00/1200-0703$18.00/0 2000 Human Sciences Press, Inc.

704 ETHINGTON
and those initially attending four-year institutions, and not on the experiencesof students within the two-year institutions or the impact of college on outcomesthat would be associated with a two-year institution.
But community colleges and two-year institutions obviously differ in a varietyof ways from four-year institutions. They have multiple missions (e.g., preparingstudents for transfer, vocational education) and they have more diverse studentbodies. The community college students compared to their peers at four-yearinstitutions are more likely to be older, attend part-time, have a more diverseracial makeup, have lower socioeconomic background, and attend for more var-ying reasons than four-year students (Astin, 1988; Cohen and Brawer, 1989).This diversity in mission and student body creates normative peer environmentsthat are a part of the socialization that community college students experience,and that socialization, in all likelihood, differs from that experienced by four-year students. However, this “normative pressure” (Weidman, 1989a) has gener-ally been overlooked even in the college impact research focusing on four-yearinstitutions. An exception to this omission is the work of Dey (1996) where heexamined the influence of peer and faculty normative contexts on students’development of political orientations. For his sample of four-year college anduniversity students, he found positive influences from both faculty and students,supporting Weidman’s description of student socialization.
A large segment of the research over the past two decades on the impact ofcollege on students has tended to be grounded in conceptual frameworks thatare variations of Tinto’s Model of Institutional Departure (1975, 1987) or Pasca-rella’s General Model for Assessing Change (1985). Generally, this research hasconsidered student outcomes to be a function of three types of measures: (1)student pre-college and background measures, (2) measures reflecting the struc-tural aspects of the institutions attended and factors associated with majors ordepartments, and (3) measures indicating the types of students’ social and aca-demic involvement within the institutions. Weidman (1989a) argues that thisresearch, while contributing to understandings of the types of college effectspresent, what types of students are affected, and what social and academic as-pects of college contribute to these effects, it does not address the socializationprocess that occurs within institutions. He develops a conceptual model of un-dergraduate socialization that focuses strongly on the normative contexts andsocialization processes associated with various subenvironments within institu-tions, as well as those associated with the student’s background, parents, andnoncollege reference groups. Drawing from his own research (Weidman, 1984,1989b; Weidman and Friedman, 1984; Weidman and White, 1985), Chicker-ing’s model (1969), and research on adult socialization (Brim and Wheeler,1966; Mortimer and Simmons, 1978), the portion of his model that conceptual-izes the college experience reflects both academic and social contexts andindicates that the socialization processes reflect normative influences through

COMMUNITY COLLEGE STUDENTS’ PERCEPTIONS OF GROWTH 705
interpersonal interactions, intrapersonal processes, and social and academicinvolvement with peers.
Weidman’s (1989a) interpretation of norms is based on Hawkes’s (1975) de-scription of a norm as being “conceived loosely as a rule, a standard, or aprescription for behavior” (p. 888). The normative pressures that Weidmanspeaks of reflect Clausen’s (1968) conception of socialization that sees an indi-vidual pressured to conform to the actions and conceptions of the groups ofpeople to which the individual belongs and with whom the individual interacts.Thus, the behaviors of the student body of the institution should induce a studentto behave similarly. When the student body as a whole is highly engaged inacademic and social activities that contribute to student learning and develop-ment, the press would be for each individual to become similarly engaged.
Recent work by Tinto (1997) examining the classroom as a learning commu-nity has shown how peer groups can enhance desired collegiate outcomes.Studying the Coordinated Studies Programs of Seattle Central Community Col-lege, he found that students who shared a curriculum that required them to sharethe learning experience and work interdependently with other students perceivedgreater achievement gains than students who did not engage in such coordinatedlearning. Tinto suggested that the involvement with peers in the learning com-munities resulted in greater academic and social integration and greater levelsof effort expended in learning. Thus, the norm of the peer group was higherlevels of academic engagement and the press was for peer group members toconform and contribute to the learning experience.
The purpose of the present study is to examine the effects of the normativepeer group environment on a national sample of community college students’perceptions of their growth and development. The study is grounded within thecontext of Weidman’s (1989a) socialization model and Pace’s (1979b) theoreti-cal conception of “quality of effort.” Pace argues that students’ growth anddevelopment requires time and effort expended by the student, and that muchof what students learn during their years in college will in large part depend onthe quality of effort that they exert toward maximizing the college experience;that is, the effort they expend to take advantage of what a college or universityoffers. He further posits that it is the combined influences of the college environ-ment and the individual student’s expended efforts that lead to their growth anddevelopment. He argues that students perceive images of their institutions thatvary depending on the goals of the institution—such as scholarship and voca-tional development—and the atmosphere created by the institution and its stu-dent body is the stimulus for students’ effort and involvement.
Extending Pace’s concept of quality of effort to the institutional level, theinvolvement and efforts expended by the student body as a whole reflect aspectsof the college environment and Weidman’s normative peer group. Institutionsin which the students are more actively involved in good practices would be

706 ETHINGTON
considered “involving colleges” (Kuh, Schuh, Whitt, and Associates, 1991) be-cause it is assumed that those institutions had implemented policies and prac-tices that encouraged and expected greater student involvement and efforts intheir educational experience. It is anticipated that students within such institu-tions should exhibit higher levels of growth and development. Thus, the collegeenvironment, both that perceived by the student from aspects of the institutionitself and that created by the student body or peer group, is anticipated to impactstudents’ development and the relationships between their efforts and develop-ment.
METHOD
Sample
The sample for this study was drawn from the administration of the Commu-nity College Student Experiences Questionnaire (CCSEQ; Friedlander, Pace,and Lehman, 1990) from its initial development in 1990 through 1994. Like theCollege Student Experiences Questionnaire (CSEQ; Pace, 1979a, 1984, 1992),which was developed for the assessment of the college experience at four-yearinstitutions, the CCSEQ is derived from Pace’s (1979b) model for studyingstudent learning and development. It is a self-report instrument that assesses thelevel of student involvement in a variety of in-class and out-of-class activities,as well as background information, perceptions of the institutional environment,and self-assessments of progress and gains in 23 areas. The college activitiesassessed in the CCSEQ, while similar to those found in the CSEQ, are focusedon only those activities that are most available and pertinent to community col-lege and two-year students. There are only eight Quality of Effort scales in theCCSEQ as opposed to fourteen in the four-year version. Of the 56 institutionsrepresented in the full dataset, only 48 had a sufficient number of students withcomplete data on the variables used in the analyses. The analyses reported werebased on the 8,063 students within the 48 institutions. The number of studentswithin each institution ranged from 18 to 624.
Two datasets were created from the students’ responses to the CCSEQ inorder to conduct this study. The first dataset contained information on individualcollege students, while the second contained institutional level measures reflect-ing characteristics of the institutions that those students attend. The measures inthe institutional dataset represent Weidman’s (1989a) normative influences ofthe college environment as defined by the peer group within the institution. Itshould be noted that while Weidman’s full model contains factors external tothe institution, such as influences emanating from the family and community,no external factors were considered in these analyses due to lack of such mea-

COMMUNITY COLLEGE STUDENTS’ PERCEPTIONS OF GROWTH 707
sures in the CCSEQ. The items from the CCSEQ used in constructing the vari-ables described below are given in the appendix.
Variables
The dependent variable was a scale constructed from the questionnaire itemsasking students to indicate the extent to which they had gained or made progressin 23 areas. The response to each item was from 1 = very little to 4 = verymuch. Fourteen of these items were selected as reflecting general educationrequirements and encompass writing and literature, science, mathematics, his-tory, economics, and understandings of different philosophies, cultures, andways of life. This scale was created by summing across the 14 items and hadan internal consistency reliability of .88.
It is acknowledged that the items used in the construction of the dependentvariable, perceptions of gains in core general education areas, are student self-reports and that the validity of self-reported measures of achievement is oftenquestioned. However, Pike (1995, 1996) has examined the relationship betweenstudents’ self-reports and objective measures and suggested that “self-reports asgeneral indicators of achievement can be justified” because “self-reports and testscores based on the same set of specifications do represent the same educationaloutcome domains” (p. 110). Ewell, Lovell, Dressler, and Jones (1994), in theirreport for the National Center for Education Statistics, also suggest that stu-dents’ self-reports of growth and development as a result of attending collegeare valid assessments of collegiate achievement and have utility as policy indica-tors.
The student-level independent variables consisted of six Quality of EffortScales, four items indicating the students’ perceptions of the college environ-ment, students’ self-reported grades, and a variable indicating whether thestudent was in a vocational or transfer program. The Quality of Effort Scalesrepresent the effort expended by the students in science, in writing, in discus-sions with student acquaintances, in the library, with faculty, and in their course-work. The scale representing interactions with fellow students reflect social con-texts, the scale representing interactions with faculty reflect both academic andsocial contexts, and the four remaining scales reflect academic contexts. Thesescales were created by summing across the respective items and had reliabilitiesranging from .86 to .93. (See Ethington and Polizzi, 1996, for a full descriptionof the psychometric properties of the Quality of Effort Scales.) The four percep-tion of the environment items depict the friendliness and supportiveness of otherstudents, the approachability and supportiveness of faculty, the extent to whichcourses were challenging and stimulating, and the extent to which the collegewas a stimulating and exciting place. These four measures portray student per-

708 ETHINGTON
ception of the image of their institutions. Exploratory analyses indicated nomulticollinearity among these variables as all variance inflation factors wereless than 2.19 and tolerance levels were greater than .457.
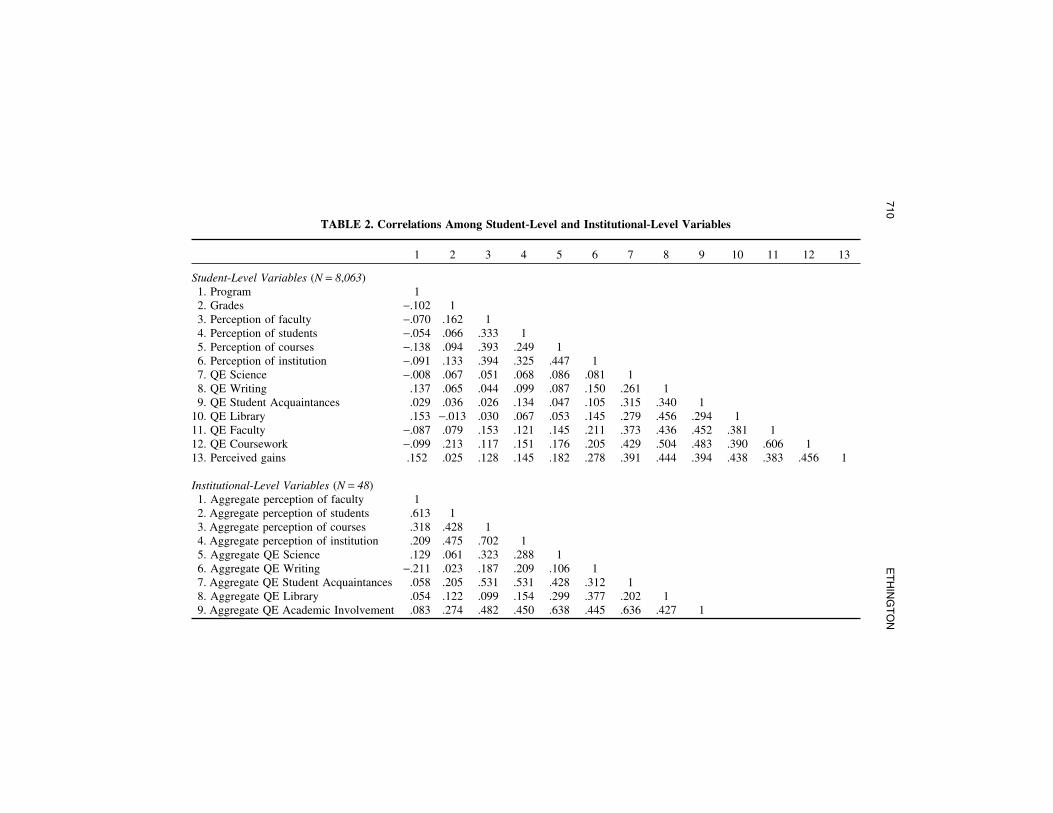
The institutional-level independent variables representing the normative envi-ronment of the peer group within the institution were the aggregates for each ofthe 48 institutions of the six Quality of Effort Scales and the four perception ofthe environment items. They represent both social and academic contexts of theinstitutional environment. Initial exploratory analyses of the data indicated thatthere was considerable multicollinearity among these institutional-level vari-ables. The variance inflation factors and tolerance levels indicated that only twovariables were contributing to the multicollinearity. The aggregate measures ofquality of effort in involvement with faculty and quality of effort in courseworkhad variance inflation factors of 8.55 and 10.72 and tolerances of .117 and .093,respectively. This was taken as an indicator that at the aggregate institutionallevel, these two variables were essentially measuring similar efforts since thecorrelation between them was .895. That is, as a measure of an environmentalnormative influence, the totality of peer involvement within institutions withboth faculty and coursework are similar constructs. This is interpreted as anindicator that at the institutional level, both measures reflect general efforts incourse-related academic involvement. These two scales were subsequently com-bined at the institutional level as a single measure of general academic involve-ment, resulting in nine institutional-level independent variables. No multicollin-earity was present among these nine variables given that all variance inflationfactors were less than 3.25 and tolerances greater than .307. The means andstandard deviations for the variables used in the analyses are given in Table 1,and correlations among each set of variables are given in Table 2.
Analyses
Given the nested structure of the data (students within institutions), the meth-odology employed was the Hierarchical Linear Modeling approach of Bryk andRaudenbush (1992). Analyses were conducted using HLM2L (Bryk, Rauden-bush, and Congdon, 1994), a program for the analysis of multilevel data thatuses maximum likelihood empirical Bayes (EB) techniques. (See Ethington,1997, for a more in-depth discussion of Hierarchical Linear Modeling as appliedto research in higher education.) Three stages of modeling were incorporated inthese analyses. First, a base model was estimated in which the variability of thedependent variable, students’ perceived gains in the general education area, wasdecomposed into variance due to differences between institutions and variancedue to differences among students. The second stage estimated the student-levelmodel in which individual students’ perceived gains were considered a functionof their program (vocational/transfer), grades, the six quality of effort measures,

COMMUNITY COLLEGE STUDENTS’ PERCEPTIONS OF GROWTH 709
TABLE 1. Means and Standard Deviations
Mean Standard Deviation
Student-Level Variables (N = 8,063)Program (transfer vs. vocational) 1.73 0.44Grades 4.27 1.21Perception of faculty 2.99 0.72Perception of students 2.91 0.65Perception of courses 2.93 0.70Perception of institution 2.52 0.78QE Science 16.78 6.75QE Writing 21.94 5.56QE Student Acquaintances 11.95 4.10QE Library 14.09 4.56QE Faculty 16.19 4.51QE Coursework 25.40 5.35Perceived general educational gains 32.54 8.32
Institutional-Level Variables (N = 48)Aggregate perception of faculty 2.98 0.12Aggregate perception of students 2.91 0.11Aggregate perception of courses 2.93 0.13Aggregate perception of institution 2.52 0.14Aggregate QE Science 16.63 1.88Aggregate QE Writing 22.27 1.19Aggregate QE Student Acquaintances 11.98 0.79Aggregate QE Library 14.26 1.17Aggregate QE Academic Involvement 42.15 2.69
and the four perceptions of the environment items. At this level of analysis,estimates are made of each institution’s regression equation and the coefficientsreported are weighted averages. The student-level independent variables wereeach centered about the respective institutional means, allowing the interceptsto be interpreted as the mean gain for each institution. The variance of theintercepts and each coefficient is calculated and tested with a chi-square statisticto determine if the estimates are really different across institutions, or if thevariability is only due to chance.
The final stage of the analyses incorporated an institutional-level model inwhich the parameters from the student-level model that were found to varyacross institutions were considered a function of the six aggregate Quality ofEffort measures and the four aggregate perception of the environment measures.Thus, institutional measures are used to predict the coefficients in the student-
710E
TH
ING
TO
N
TABLE 2. Correlations Among Student-Level and Institutional-Level Variables
1 2 3 4 5 6 7 8 9 10 11 12 13
Student-Level Variables (N = 8,063)1. Program 12. Grades −.102 13. Perception of faculty −.070 .162 14. Perception of students −.054 .066 .333 15. Perception of courses −.138 .094 .393 .249 16. Perception of institution −.091 .133 .394 .325 .447 17. QE Science −.008 .067 .051 .068 .086 .081 18. QE Writing .137 .065 .044 .099 .087 .150 .261 19. QE Student Acquaintances .029 .036 .026 .134 .047 .105 .315 .340 1
10. QE Library .153 −.013 .030 .067 .053 .145 .279 .456 .294 111. QE Faculty −.087 .079 .153 .121 .145 .211 .373 .436 .452 .381 112. QE Coursework −.099 .213 .117 .151 .176 .205 .429 .504 .483 .390 .606 113. Perceived gains .152 .025 .128 .145 .182 .278 .391 .444 .394 .438 .383 .456 1
Institutional-Level Variables (N = 48)1. Aggregate perception of faculty 12. Aggregate perception of students .613 13. Aggregate perception of courses .318 .428 14. Aggregate perception of institution .209 .475 .702 15. Aggregate QE Science .129 .061 .323 .288 16. Aggregate QE Writing −.211 .023 .187 .209 .106 17. Aggregate QE Student Acquaintances .058 .205 .531 .531 .428 .312 18. Aggregate QE Library .054 .122 .099 .154 .299 .377 .202 19. Aggregate QE Academic Involvement .083 .274 .482 .450 .638 .445 .636 .427 1

COMMUNITY COLLEGE STUDENTS’ PERCEPTIONS OF GROWTH 711
level model and the analyses test whether the influence of individual studentmeasures on individual perceived gains depends on the environment of the insti-tution attended or whether it is consistent, regardless of institutional environ-ment. The variances for the coefficients found to not vary across institutionswere specified to be zero. All institutional-level variables were centered aboutthe grand mean.
Prior to the estimation of the models above, a series of interaction tests wereconducted to determine whether the influences of the student-level measuresdiffered as a function of being enrolled in a vocational or transfer program oron the basis of ethnic background. Each of these tests were significant, but theywere considered to be a function of the large sample size since the increase inexplained variance in each instance was less than 1% (program: R2 change =.004; ethnic: R2 change = .003). Thus, the model was estimated for the full sam-ple of students. No indicators of ethnic group were included as independentvariables because there were too few students of African-American or Hispanicbackground in several of the institutions, and inclusion of these indicator vari-ables would have further reduced the number of institutions with sufficient datafor the analyses. The absence of interactive effects, however, indicates that theresults from these analyses are applicable to all students in the sample, regard-less of ethnicity.
RESULTS
The results from the estimation of the base model are presented in Table 3.This analysis decomposed the variance in perceived gains into variability re-flecting between institution differences and variability reflecting differencesamong students within institutions. These results indicate that only 5% of thevariability in students’ perceptions of gains is due to between-institution differ-ences (3.453/[3.453 + 66.062]). Thus, almost all variability (95%) is due to dif-ferences among students themselves. The chi-square test for the between institu-
TABLE 3. Estimation of Base Model of Perceived General Educational Gains
Fixed Effects Coefficient S.E. t-ratio
Institutional Mean Perceived Gain 32.610 .294 111.077***
Random Effects Variance DF Chi-squareBetween Institutions 3.453 47 441.931***Within Institutions 66.062
***p < .001.

712 ETHINGTON
tion variance is significant, indicating that the average perception of gains ofstudents within institutions varies across institutions.
The results of the estimation of the full student-level model in which per-ceived gains are considered a function of the six Quality of Effort scales, fourperception scales, grades, and program are given in Table 4. The within institu-tion variability has been reduced from 66.062 to 38.704 indicating that approxi-mately 41% of the variability in individual students’ perceived gains is ex-
TABLE 4. Estimation of Student-Level Model of PerceivedGeneral Educational Gains (Within-Institution Model)
Fixed Effects Coefficient S.E. t-ratio Reliability
Mean Perceived Gain 32.631 .299 109.067*** .901Program 2.196 .255 8.625*** .343Grades −.249 .079 −3.151** .266Perception of faculty .249 .132 1.893 (p = .069) .177Perception of students .117 .135 .868 .143Perception of courses .714 .129 5.528*** .103Perception of institution 1.567 .113 13.924*** .039QE Science .220 .018 12.119*** .374QE Writing .220 .020 11.258*** .196QE Student Acquaintances .285 .024 12.137*** .145QE Library .293 .022 13.014*** .192QE Faculty .004 .028 .151 .280QE Coursework .225 .025 9.096*** .263
Random Effects Variance DF Chi-squareBetween Institutions 3.876 47 755.003***Program slope 1.204 47 70.823*Grades slope .086 47 57.591Perception of faculty slope .167 47 46.546Perception of students slope .137 47 44.533Perception of courses slope .091 47 37.064Perception of institution slope .025 47 38.391QE Science slope .006 47 77.614**QE Writing slope .004 47 55.500QE Student Acquaintances slope .004 47 41.662QE Library .005 47 58.323QE Faculty slope .011 47 57.495QE Coursework slope .009 47 57.340Within Institutions 38.704
*p < .05; **p < .01; ***p < .001.

COMMUNITY COLLEGE STUDENTS’ PERCEPTIONS OF GROWTH 713
plained by the set of student-level variables. Five of the six Quality of Effortmeasures have significant impact on gains with only involvement with facultybeing non-significant. The positive effects of these variables indicate that thegreater the student effort in science, writing, library, coursework, and discus-sions with student acquaintances, the greater the perceived gains. Two of thefour measures of the perception of the environment have significant positivecoefficients with the perceptions of students being friendly and supportive andof faculty being approachable and helpful non-significant. The significant posi-tive effects indicate that the more students perceive their courses to be challeng-ing and worthwhile and the college environment stimulating, the greater theperceived gains. Grades have a significant negative effect indicating that thehigher the self-reported grades, the less perceived gains, and the positive signifi-cant coefficient for type of program indicates that transfer students perceivegreater gains than do vocational students. Only the intercept, which representsaverage gains across institutions, and the slopes for program and effort in sci-ence are found to vary significantly across institutions. This variability indicatesthat average gains differ across institutions, the difference between transfer andvocational students differs across institutions, and the relationship between ef-fort in science and perceived gains also differs across institutions. These threecoefficients are then modeled in the next stage of analysis using the 10 institu-tional measures. Other coefficients do not vary across institutions and thus theirinfluence, or lack thereof, is considered to be the same, regardless of what insti-tution students attend. The variances of these coefficients are thus specified tobe zero and are not modeled at the next stage of analysis.
The final model estimated includes both student-level and institutional-levelvariables; the results of this model are given in Table 5. The effects seen fromthe institutional-level variables reflect the impact of aspects of the normativestudent body—or peer group environment—on the average gains of studentswithin institutions, the gap between vocational and transfer students, and thegains/science effort relationship. The variance of mean gains between institu-tions has been reduced to 1.123 from 3.876 (the estimate from the full student-level model is used to calculate the proportion of between institution varianceexplained by the institutional variables), indicating that approximately 71% ofthe variance between institutions in mean perceived gains is explained by the10 institutional variables. One must remember that only 5% of the total variabil-ity in gains was due to institutional differences. The reduction in variance ofthe program slope and effort in science slope indicates that the institutionalvariables explain 23% of the gap between vocational and transfer students ingains and 40% of the variability in the effort in science slope across institutions.However, each of these variances are still significantly different from zero, indi-cating that there is still nonrandom variability in the coefficients that is unex-plained by the variables in the model.

714 ETHINGTON
TABLE 5. Intercept- and Slopes-as-Outcomes Model of PerceivedGeneral Educational Gains
Fixed Effects Coefficient S.E. t-ratio
Model for Institutional Mean PerceivedGains
Intercept (Mean Institutional Gains) 32.690 .179 182.341***Aggregate QE Science .470 .146 3.217**Aggregate QE Writing .435 .189 2.295*Aggregate QE Student Acquaintances .868 .329 2.637*Aggregate QE Library .497 .183 2.715*Aggregate QE Academic Involvement −.125 .125 −1.002Aggregate perception of faculty 1.168 2.095 .558Aggregate perception of students −3.518 2.671 −1.317Aggregate perception of courses −2.193 2.260 −.970Aggregate perception of institution 5.525 2.048 2.698*
Model for Program slopeIntercept (Mean Program slope) 2.022 .267 7.561***Aggregate QE Science .637 .228 2.793*Aggregate QE Writing −.209 .271 −.774Aggregate QE Student Acquaintances −.318 .482 −.660Aggregate QE Library −.163 .267 −.612Aggregate QE Academic Involvement −.028 .187 −.151Aggregate perception of faculty −.923 3.197 −.289Aggregate perception of students .848 4.007 .212Aggregate perception of courses .548 3.474 .158Aggregate perception of institution 1.127 3.072 .367
Grades −.280 .062 −4.503**Perception of faculty .253 .115 2.212 (p = .045)Perception of students .119 .119 1.000Perception of courses .669 .119 5.629**Perception of institution 1.590 .109 14.529***Model for QE Science slope
Intercept (Mean QE Science slope) .209 .017 12.031***Aggregate QE Science −.007 .014 −.480Aggregate QE Writing .006 .017 .368Aggregate QE Student Acquaintances .058 .030 1.905Aggregate QE Library .008 .017 .497Aggregate QE Academic Involvement −.028 .011 −2.457*Aggregate perception of faculty .029 .192 .204Aggregate perception of students .051 .253 .212Aggregate perception of courses −.283 .215 −1.314Aggregate perception of institution .205 .190 1.079
QE Writing .232 .016 14.299***QE Student Acquaintances .284 .021 13.690***

COMMUNITY COLLEGE STUDENTS’ PERCEPTIONS OF GROWTH 715
TABLE 5. (Continued)
Fixed Effects Coefficient S.E. t-ratio
QE Library .300 .019 15.769***QE Faculty −.005 .021 −.212QE Coursework .228 .020 11.689***
Random Effects Variance DF Chi-squareBetween Institutions 1.123 38 192.120***Program slope .921 38 58.363*QE Science slope .004 38 59.608*Within Institutions 39.365
*p < .05; **p < .01; ***p < .001.
Average institutional gains are highest for institutions in which the studentsare more heavily involved in science, writing activities, and library work. Also,institutions where students have more interactions and discussions with otherstudents—and perceive the college to be a stimulating and exciting place tobe—have higher mean gains. Only one institutional measure has an impact onthe difference in gains between transfer and vocational students. The positivecoefficient for the aggregate Quality of Effort in Science measure indicates thatthe difference between vocational and transfer students in perceptions of gainsis greatest for institutions where the student body is more heavily involved inscience. The relationship between student effort in science and perceived gains(QE Science slope) is also affected by only one institutional measure, the aca-demic involvement of the student body. The negative coefficient for this vari-able indicates that individual effort in science has less of a relationship to one’sperceived gains within institutions where the student body as a whole is moreactively involved in academics. The effect of one’s individual effort is greatestwhere the student body is less engaged in academic work.
The influence of student-level variables remains the same in this final modelwith one exception. Students’ perceptions of faculty now becomes significant,and the positive coefficient indicates that the more the student perceives thefaculty to be approachable and helpful the greater the perceived gains. However,this coefficient is marginally significant now (p = .045) and was marginally non-significant (p = .069) in the student-level analysis.
CONCLUSIONS
These results clearly support the strong relationships between the efforts thatstudents’ expend in taking advantage of the opportunities provided by their col-
716 ETHINGTON
leges and their perceived gains in learning as posited by Pace (1979b). With theexception of involvement with faculty, each of the Quality of Effort measureshas a significant impact on perceived general education gains when consideringindividual student gains. This relationship is also manifested when consideringthe average institutional gains where four of the five aggregate effort measuresimpact gains. Thus, Kuh et al.’s (1991) “involving colleges” for this samplewould be those that more actively engage students in their coursework, science,writing, library work, and encourage discussions among students’ peers. Theparticular practices implemented by institutions that resulted in higher levels ofinvolvement by students would be indicators of “good practices” (Ewell, Lovell,Dressler, and Jones, 1994) that other institutions could adopt in efforts to im-prove their own students’ development. In all likelihood, the environment ofthose “involving” institutions would be perceived by students as a stimulatingand exciting place to be which is important since that perception has impact onboth individual- and institutional-level gains.
The absence of influence from involvement with faculty and the marginalsignificance of students’ perception of faculty’s supportiveness perhaps reflectsthe dominant nature of community college students as commuter students. Infact, the mean for this sample of students on the Quality of Effort with Facultyscale is only 16.19, which is more than 3/4 standard deviation below 20 whichwould be considered average involvement (the scale was created by summingacross 8 items, each measured on a scale from 1 to 4). Thus, for this sample ofstudents, it appears that it is not the involvement with faculty per se that impactstheir development, but rather the opportunities and requirements developed byfaculty for their courses. Course requirements and activities that engage thestudent and require more effort from them provide the stimulus and context forthe amount and quality of student involvement. When this occurs across coursesand departments, the general environment of the institution is one of challengeand stimulation; the normative peer group environment becomes characterizedas a body of students heavily engaged in the college experience.
The aggregate measures at the institutional level reflect the level of engage-ment and the general perceptions of the student bodies and, as noted, are as-sumed to be the normative environment for individual students. The influenceof this environment is not generally strong in this study since there are fewsignificant effects from these measures on the relationship between the individ-ual-level variables and perceived gains. The absence of substantial influencesmay again reflect the general nature of community college students as commut-ers who tend to spend little time on campus other than attending classes. If thisis the case, there is little opportunity for students to be strongly influenced byother students. However, while the normative context has little impact for thissample, the students’ perceptions of their courses and the institution doesstrongly influence their perceived gains.

COMMUNITY COLLEGE STUDENTS’ PERCEPTIONS OF GROWTH 717
If we explain the absence of influences of the student body and faculty bythe nature of students as commuters, that does not absolve institutions from theobligation to provide appropriate opportunities for commuter students to becomemore actively engaged in their educational experience. Tinto (1998) notes thatsince the time spent on campus by commuter students (most particularly incommunity colleges) is generally restricted to time spent in classes, the class-room becomes the focal point of not only academic involvement but involve-ment with faculty and peers as well. Thus, interventions designed to enhancestudent involvement should focus on the classroom. Utilizing curricula andmethods of teaching that decrease the likelihood of students being passive re-ceivers of knowledge requires students to assume greater responsibility for theirown learning process. Student learning then becomes a richer and more personalexperience that leads to higher levels of actual and perceived growth and devel-opment. Friedlander, Murrell, and MacDougall (1993) describe how some insti-tutions have implemented such programs and practices that apply at the class-room level. Faculty at some institutions designed curricula that required studentparticipation in projects designed to enhance critical thinking abilities, indepen-dent inquiry, writing, and collaborative learning with other students.
Tinto (1998) encourages academic organizational reforms that compel studentsto interact with their peers and faculty both within and outside the classroom. Heargues that the increased academic involvement with peers and faculty promoteshigher levels of learning, increases the likelihood of persistence, and helps formsocial networks that commuter students often find difficult to establish. One suchreform is the establishment of learning communities in which students take blocksof courses as a cohort, and faculty work together to provide connections acrossthe courses (see Tinto, 1997, for a description of one such program). The resultis a much more proximal group of peers engaged in common learning experiences.Within these cohorts, students are more likely to form their own supportive peergroups that promote greater academic and social involvement. Thus, changing thestandard classroom experiences to those that encourage peer and faculty interac-tions create greater opportunities for socialization to occur.
Pacheco (1994) describes how institutions can structurally adapt to make iteasier for students to become more involved and to create a social system wherethey feel comfortable and supported. He describes the University of Texas at ElPaso’s efforts to provide more user-friendly support by bringing together in oneplace, the student union, all opportunities for student social involvement. Thisincludes all campus student organizations, as well as opportunities for commu-nity involvement and classes in leadership skills. Similarly, the library serves asthe focal point for out-of-classroom academic involvement. In addition to theusual library resources, it houses a tutorial center, computer lab, and adequatestudy facilities. Both sites provide student workers and aides, peer advisors, andpeer tutoring and stay open late at night.

718 ETHINGTON
Policies and practices such as those described above optimize the likelihoodthat students will become heavily integrated into the academic and social dimen-sions of institutions. Although they require greater efforts of the students, theeducational experience becomes much richer and meaningful. The socializationthat occurs leads students to active rather than passive learning and to morecontact with faculty and peers. When students interact more with faculty andpeers, and the interactions are of a more substantive nature, there should be agreater press on an individual student to adapt to the norm. Institutions provid-ing other or similar opportunities for students would then be perceived by stu-dents as having courses that are challenging and stimulating and as a stimulatingand exciting place. The “good practices” of the institutions then put in placesocialization processes that lead students to engage in “good practices,” morepositive perceptions of the institutions, and higher levels of student growth anddevelopment.
APPENDIXVARIABLES USED IN ANALYSES
Perceived General Educational Gains. Students responded to the prompt “To what extentdo you feel you have gained or make progress in each of the following respects.” Ascale was created by summing across the following items. Response to each item rangedfrom 1 = very little to 4 = very much. Cronbach α = .88.
Developing an understanding of literatureWriting clearly and effectivelyRepresenting ideas effectively in speakingBecoming aware of different philosophies and culturesClarifying your own valuesUnderstanding your own abilities and interestsUnderstanding the role of science and technologyPutting ideas togetherDeveloping the ability to learn on your ownSpeaking another languageInterest in political and economic eventsSeeing the importance of historyLearning about other parts of the worldUnderstanding and getting along with others
Program. Indication of type of program with 1 = vocational and 2 = transfer.
Grades. Self-reported grades with values ranging from 1 = lower than C− to 6 = A.
Perception of faculty. Extent to which students perceive that faculty are approachableand helpful. Values range from 1 = few or none to 4 = all.

COMMUNITY COLLEGE STUDENTS’ PERCEPTIONS OF GROWTH 719
Perception of students. Extent to which students perceive other students as being friendlyand supportive. Values range from 1 = few or none to 4 = all.
Perception of courses. Extent to which students perceive courses as challenging andstimulating. Values range from 1 = few or none to 4 = all.
Perception of institution. Extent to which students perceive the college is stimulating andexciting. Values range from 1 = rarely or never to 4 = all of the time.
Quality of Effort in Science. Students indicated how often they had participated in eachof the following activities with values ranging from 1 = never to 4 = very often. Thescale was created by summing across the following items. Cronbach α = .93.
Memorized formulas, definitions, technical termsPracticed to improve your skills in using laboratory equipmentShowed a classmate how to use a piece of scientific equipmentAttempted to explain an experimental procedure to a classmateTested your understanding of some scientific principle by seeing if you could explain it
to other studentsCompleted an experiment/project using scientific methodsTalked about social and ethical issues related to science and technology such as energy,
pollution, chemicals, genetics, etc.Used information you learned in a science class to understand some aspect of the world
around youTried to explain to someone the scientific basis for environmental concerns about pollu-
tion, recycling, alternative forms of energy, etc.
Quality of Effort in Writing. Same response categories as above. The scale was createdby summing across the following items. Cronbach α = .87.
Used a dictionary to look up the proper meaning, definition, and/or spelling of wordsPrepared an outline to organize the sequence of ideas and points in a paper you were
writingThought about grammar, sentence structure, paragraphs, and word choice as you were
writingWrote a rough draft of a paper or essay and revised it before handing it inUsed a computer (word processor) to write or type a paperAsked other people to read something you wrote to see if it was clear to themSpent at least 5 hours or more writing a paperAsked an instructor for advice and help to improve your writing or about a comment he/
she made on a paper you wrote
Quality of Effort with Student Acquaintances. Same response categories as above. Thescale was created by summing across the following items. Cronbach α = .89.

720 ETHINGTON
Had serious discussions with students who were much older or much younger than youHad serious discussions with students whose ethnic or cultural background was different
from yoursHad serious discussions with students whose philosophy or life or personal values were
very different from yoursHad serious discussions with students whose political opinions were very different from
yoursHad serious discussions with students whose religious beliefs were very different from
yoursHad serious discussions with students from a country different from yours
Quality of Effort in the Library. Same response categories as above. The scale was cre-ated by summing across the following items. Cronbach α = .86.
Used the library as a quiet place to read or study material you brought with youRead newspapers, magazines, or journals located in the libraryChecked out books to read at homeUsed the card catalogue or computer to find books the library had on a topicPrepared a bibliography or set of references for a term paper or reportAsked the librarian for help in finding materials on some topicFound some interesting material to read just by browsing in the stacks
Quality of Effort with Faculty. Same response categories as above. The scale was createdby summing across the following items. Cronbach α = .87.
Asked an instructor for information about grades, make-up work, assignments, etc.Talked briefly with an instructor after class about course contentMade an appointment to meet with an instructor in his/her officeDiscussed ideas for a term paper or other class project with an instructorDiscussed your career plans and/or educational plans, interests, and ambitions with an
instructorDiscussed comments an instructor made on a test or paper you wroteTalked informally with an instructor about current events, campus activities, or other
common interestsDiscussed your school performance, difficulties, or personal problems with an instructor
Quality of Effort in Coursework. Same response categories as above. The scale wascreated by summing across the following items. Cronbach α = .86.
Participated in class discussionsWorked on a paper or project which combined ideas from different sources of informa-
tionSummarized major points and information from readings or notesTried to explain material to another studentDid additional readings on topics that were introduced and discussed in class

COMMUNITY COLLEGE STUDENTS’ PERCEPTIONS OF GROWTH 721
Asked questions about points made in class discussions or readingsStudied course materials with other studentsApplied principles and concepts learned in class to understand other problems or situa-
tionsCompared and contrasted different points of view presented in a courseConsidered the accuracy and credibility of information from different sources
REFERENCES
Astin, A. W. (1988). The American Freshman: National Norms for Fall 1988. Washing-ton, DC: American Council on Education.
Brim, O. G., Jr., and Wheeler, S. (1966). Socialization After Childhood: Two Essays.New York: John Wiley & Sons.
Bryk, A. S., and Raudenbush, S. W. (1992). Hierarchical Linear Models: Applicationsand Data Analysis Methods. Newbury Park, CA: SAGE Publications.
Bryk, A. S., Raudenbush, S. W., and Congdon, R. T. (1994). Hierarchical Linear Model-ing with the HLM/2L and HLM/3L Programs. Chicago: Scientific Software Interna-tional.
Chickering, A. W. (1969). Education and Identity. San Francisco: Jossey-Bass.Clausen, J. A. (1968). Introduction. In J. A. Clausen (ed.), Socialization and Society (pp.
1–17). Boston: Little, Brown.Cohen, A. M., and Brawer, F. B. (1989). The American Community College. 2nd edition.
San Francisco: Jossey-Bass.Dey, E. L. (1996). Undergraduate political attitudes: an examination of peer, faculty and
social influences. Research in Higher Education 37, 535–554.Ethington, C. A. (1997). A hierarchical linear modeling approach to studying college
effects. In J. Smart (ed.), Higher Education: Handbook of Theory and Research, Vol.12, pp. 165–194. New York: Agathon Press.
Ethington, C. A., and Polizzi, T. B. (1996). An assessment of the construct validity ofthe CCSEQ Quality of Effort Scales. Research in Higher Education 37: 711–730.
Ewell, P. T., Lovell, C. D., Dressler, P., and Jones, D. P. (1994). A preliminary study ofthe feasibility and utility for national policy of instructional “good practice” indica-tors in undergraduate education (Report No. NCES 94-437). Washington, DC: Na-tional Center for Education Statistics.
Friedlander, J., Murrell, P. H., and MacDougall, P. R. (1993). The Community CollegeStudent Experiences Questionnaire. In T. Banta and Associates (eds.), Making a Dif-ference: Outcomes of a Decade of Assessment in Higher Education (pp. 196–210).San Francisco: Jossey-Bass.
Friedlander, J., Pace, C. R., and Lehman, P. W. (1990). Community College StudentExperiences Questionnaire. Memphis: University of Memphis, Center for the Studyof Higher Education.
Hawkes, R. K. (1975). Norms, deviance, and social control: a mathematical elaborationof concepts. American Journal of Sociology 80: 886–908.
Kuh, G., Schuh, J., Whitt, E., and Associates (1991). Involving Colleges. San Francisco:Jossey-Bass.
Mortimer, J. T., and Simmons, R. G. (1978). Adult socialization. In R. H. Turner, J.Coleman, and R. C. Fox (eds.), Annual Review of Sociology, Vol. 4 (pp. 421–454).Palo Alto, CA: Annual Reviews.

722 ETHINGTON
Pace, C. R. (1979a). The College Student Experiences Questionnaire. Bloomington: Indi-ana University, School of Education.
Pace, C. R. (1979b). Measuring Outcomes of College: Fifty Years of Findings and Rec-ommendations for the Future. San Francisco: Jossey-Bass.
Pace, C. R. (1984). Measuring the Quality of Student Experiences. Los Angeles: Univer-sity of California, Graduate School of Education, Higher Education Research Institute.
Pace, C. R. (1992). College Student Experiences Questionnaire: Norms for the ThirdEdition, 1990. Los Angeles: University of California, Center for the Study of Evalua-tion.
Pacheco, A. (1994, Fall). Bridging the gaps in retention. Metropolitan Universities, pp.53–60.
Pascarella, E. T. (1985). College environmental influences on learning and cognitivedevelopment: a critical review and synthesis. In J. Smart (ed.), Higher Education:Handbook of Theory and Research, Vol. I (pp. 1–61). New York: Agathon Press.
Pascarella, E. T., and Terenzini, P. T. (1991). How College Affects Students. San Fran-cisco: Jossey-Bass.
Pascarella, E. T., and Terenzini, P. T. (1998). Studying college students in the 21stcentury: meeting new challenges. The Review of Higher Education, 21: 151–165.
Pike, G. R. (1995). The relationship between self-reports of college experiences andachievement test scores. Research in Higher Education 36: 1–21.
Pike, G. R. (1996). Limitations in using students’ self-reports of academic developmentas proxies for traditional achievement measures. Research in Higher Education 37:89–114.
Tinto, V. (1975). Dropout from higher education: a theoretical synthesis of recent re-search. Review of Educational Research 45: 89–125.
Tinto, V. (1987). Leaving College: Rethinking the Causes and Cures of Student Attrition.Chicago: University of Chicago Press.
Tinto, V. (1997). Classrooms as communities. Journal of Higher Education 68: 599–623.Tinto, V. (1998). Colleges as communities: taking research on student persistence seri-
ously. The Review of Higher Education 21: 167–177.Weidman, J. C. (1984). Impacts of campus experiences and parental socialization on
undergraduate career choices. Research in Higher Education 20: 445–476.Weidman, J. C. (1989a). Undergraduate socialization: a conceptual approach. In J. Smart
(ed.), Higher Education: Handbook of Theory and Research, Vol. V (pp. 289–322).New York: Agathon Press.
Weidman, J. C. (1989b). The world of higher education: a socialization-theoretical per-spective. In K. Hurrelmann and U. Engel (eds.), The Social World of Adolescents:International Perspectives (pp. 87–105). Berlin-New York: de Gruyter/Aldine.
Weidman, J. C., and Friedman, R. R. (1984). The school-to-work transition for highschool dropouts. Urban Review 16: 25–42.
Weidman, J. C., and White, R. N. (1985). Postsecondary “high-tech” training for womenon welfare: correlates of program completion. Journal of Higher Education 56: 555–568.
Received February 25, 1999.