influence on ultrasonic incident angle and defect ... · pdf fileinfluence on ultrasonic...
TRANSCRIPT

- 45.1 - DE05F3804
Influence on ultrasonic incident angle and defect detection
sensitivity by cast stainless steel structure
Yasuo Kurozurni, Institute of Nuclear Safety System, Inc.
*DE0210575
30th MPA-Seminar in conjunction with the 9th German-Japanese Seminar
Stuttgart, October 6 and 7 2004
Abstract
It is well known that ultrasonic waves are affected strongly by macro-structures incast stainless steel, as in the primary pipe or other components in pressurized waterreactors (PWRs). In this work, ultrasonic refractive angles and defect detectionsensitivities are investigated at different incident angles to cast stainless steel. The aimsof the investigation are to clarify the transmission of ultrasonic waves in cast stainlesssteel and to contribute to the transducer design. The results are that ultrasonic refractiveangles in cast stainless steel shift towards the 45-degree direction with respect to thedirection of dendritic structures by 11.8 degrees at the maximum and that the sensitivityof transducer for inner surface breaking cracks increases with decreasing incident angle.However, in an ultrasonic inspection of actual welds at smaller incident angles, a trade-off occurs between increased defect detection sensitivity and decreased defectdiscrimination capability due to intense false signals produced by non-defective features.
introduction
Cast stainless steel is widely used for reactor coolant pipes and pump casings of
pressurized water reactors (PWRs), as it has excellent corrosion resistance and
weldability. Straight reactor coolant pipes are manufactured from centrifugally cast
stainless steel. It is known that centrifugally cast stainless steel develops large
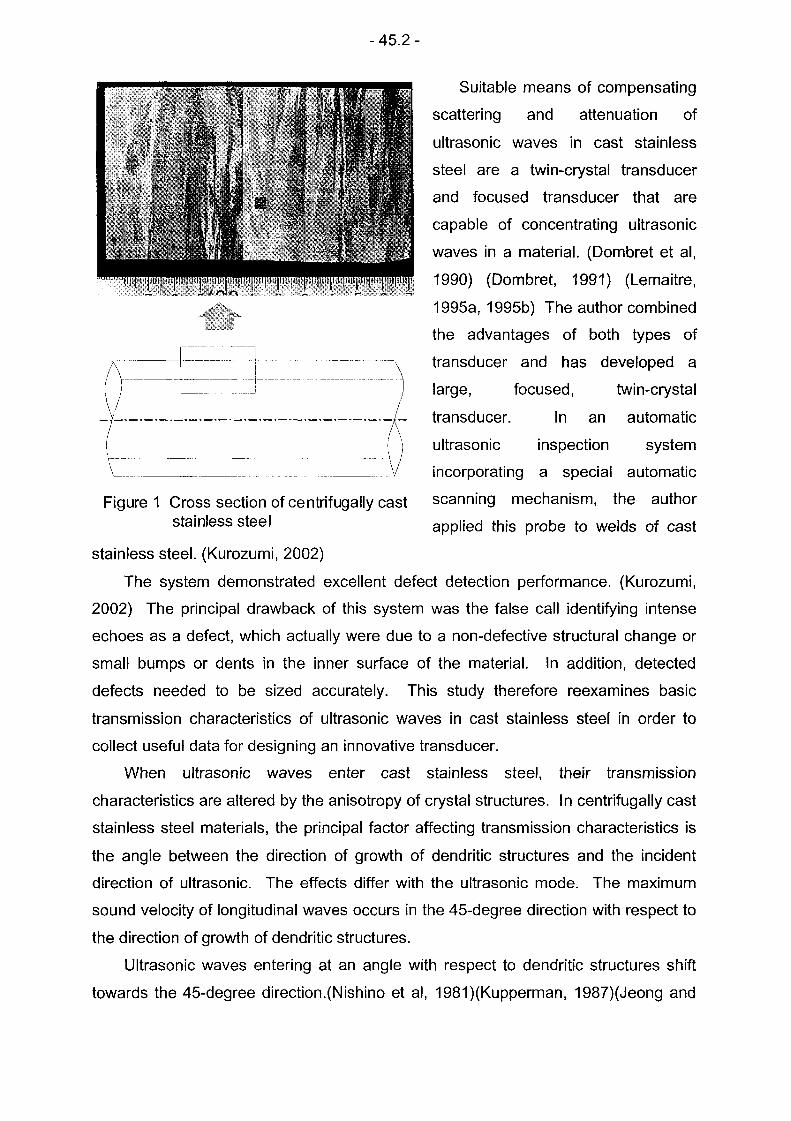
dendritic structures in radial directions during cooling down process. Figure shows
a macro-structure of the centrifugally cast stainless steel used in the study. The
cross section reveals the macro-structure of the test piece, including large grains that
developed in a radial direction.
These large, anisotropic grain structures cause severe scattering of ultrasonic
waves that penetrate the material and a shift in the direction of ultrasonic beams. As
a result, the signal-to-noise ratio of the defect signal decreases, or it becomes difficult
to distinguish defects from other features, and defect locations can be misidentified.
For these reasons, it is difficult to get a good result from an ultrasonic inspection on
centrifugally cast stainless steel. Studies have been conducted extensively on such
ultrasonic properties specific to cast stainless steel.
45.2 -
Suitable means of compensating
scattering and attenuation of
ultrasonic waves in cast stainless
steel are a twin-crystal transducer
and focused transducer that are
capable of concentrating ultrasonic
waves in a material. (Dombret et al,
1990) (Dombret, 1991) (Lemaitre,MM--- Mg-OMME0�0- WWMcLaos 1995a, 1995b) The author combined
the advantages of both types of
transducer and has developed a
large, focused, twin-crystal
..................... ............. transducer. I n an automatic
ultrasonic inspection system
incorporating a special automatic
Figure Cross section of centrifugally cast scanning mechanism, the author
stainless steel applied this probe to welds of cast
stainless steel. (Kurozumi, 2002)
The system demonstrated excellent defect detection performance. (Kurozumi,
2002) The principal drawback of this system was the false call identifying intense
echoes as a defect, which actually were due to a non-defective structural change or
small bumps or dents in the inner surface of the material. In addition, detected
defects needed to be sized accurately. This study therefore reexamines basic
transmission characteristics of ultrasonic waves in cast stainless steel in order to
collect useful data for designing an innovative transducer.
When ultrasonic waves enter cast stainless steel, their transmission
characteristics are altered by the anisotropy of crystal structures. In centrifugally cast
stainless steel materials, the principal factor affecting transmission characteristics is
the angle between the direction of growth of dendritic structures and the incident
direction of ultrasonic. The effects differ with the ultrasonic mode. The maximum
sound velocity of longitudinal waves occurs in the 45-degree direction with respect to
the direction of growth of dendritic structures.
Ultrasonic waves entering at an angle with respect to dendritic structures shift
towards the 45-degree direction.(Nishino et al, 1981)(Kupperman, 1987)(Jeong and
- 45.3 -
Ammirato, 1989a, 1989b, 1989c) In this study, using a twin-crystal transducer having
a capability of setting the incident angle to a desired value, the author measured
incident angles and refractive angles of longitudinal ultrasonic waves entering
wrought stainless steel and cast stainless steel and identified a relationship.
Furthermore, the author ascertained the relationship between the incident angle of
ultrasonic waves entering cast stainless steel and defect detection performance.
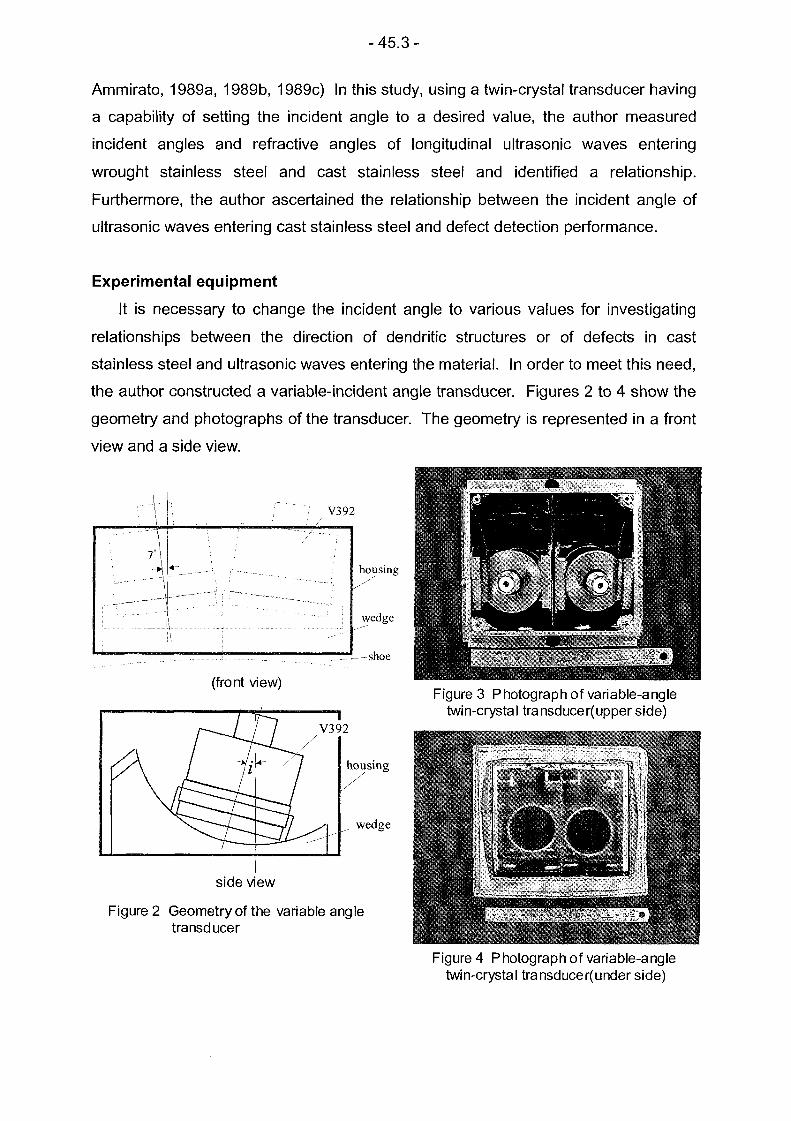
Experimental equipment
It is necessary to change the incident angle to various values for investigating
relationships between the direction of dendritic structures or of defects in cast
stainless steel and ultrasonic waves entering the material. In order to meet this need,
the author constructed a variable-incident angle transducer. Figures 2 to 4 show the
geometry and photographs of the transducer. The geometry is represented in a front
view and a side view.
V392
7housing
wedge
-- shoe
(front vi ew) Figure 3 Photograph of variable-angletwin-crysta I tra nsduce r(upper side)
V392
housing
wedge
side view M_
Figure 2 Geornetryof the variable angletransducer
Figure 4 Photograph of variable-angletwin-crysta I tra nsduce r(under side)

- 45.4 -
It is based on geometrical design specifications for twin-crystal transducers
suited to ultrasonic inspections of cast stainless steel. The top of the wedge located
at the bottom is concave, as shown in the side view. Incidentally, the wedge is
manufactured of a polystyrene resin the acoustic impedance of which is close to that
of water. The transducers can be rotated freely on the wedge. The incident angle i
changes accordingly. The two crystals are placed side by side, as shown in the front
view. They form an angle (roof angle), which corresponds to the depth of inspection.
The roof angle of the transducer was set to 7 degrees. At this angle, ultrasonic
waves are focused near the bottom of cast stainless steel 70 mm in thickness. The
angle is about the same as that of the large, focused twin-crystal transducer
developed by the author.(Kurozumi, 2002)
The pivot construction allows the incident angle, i, to vary between to 25
degrees viewed from side. Ultrasonic waves in longitudinal mode entering stainless
steel at within this range of incident angles have refractive angles varying
approximately from to 90 degrees. Two straight beam immersion transducers are
mounted on a wedge that has a pivot construction. Panametrics V392 was used as
the transducer, which is of a 1-MHz wide-band type and suitable for coarse-grained
materials such as cast stainless steel. Table shows specifications for the
transducer.
Table Specifications for TransducerDesignation of Panametrics V392transducer
Straight beam immersionType Transducer
transducer
Frequency 1 MHz
Crystal diameter 38 mm (1.5 inches) Test piece..... ............
-6 dB band width 64.6% (wide-band) IO
Test pieces were a wrought stainless a
steel block (SUS304) 90 mm in thickness (a)wrought stainless steel block (SUS304)
and cast stainless steel block (CF-8M) for Transducer
calibration 70 mm in thickness. Figure Test piece
shows the shapes of these test pieces. d
Figures 6 and 7 show how inspections direclion of thedendritic structures
were performed. The wrought stainlessa
steel test piece (SUS304) was 200 mm in N cast stainless steel block (CF13-M)
Figure 5 Geometry of the test pieces
- 45.5 -
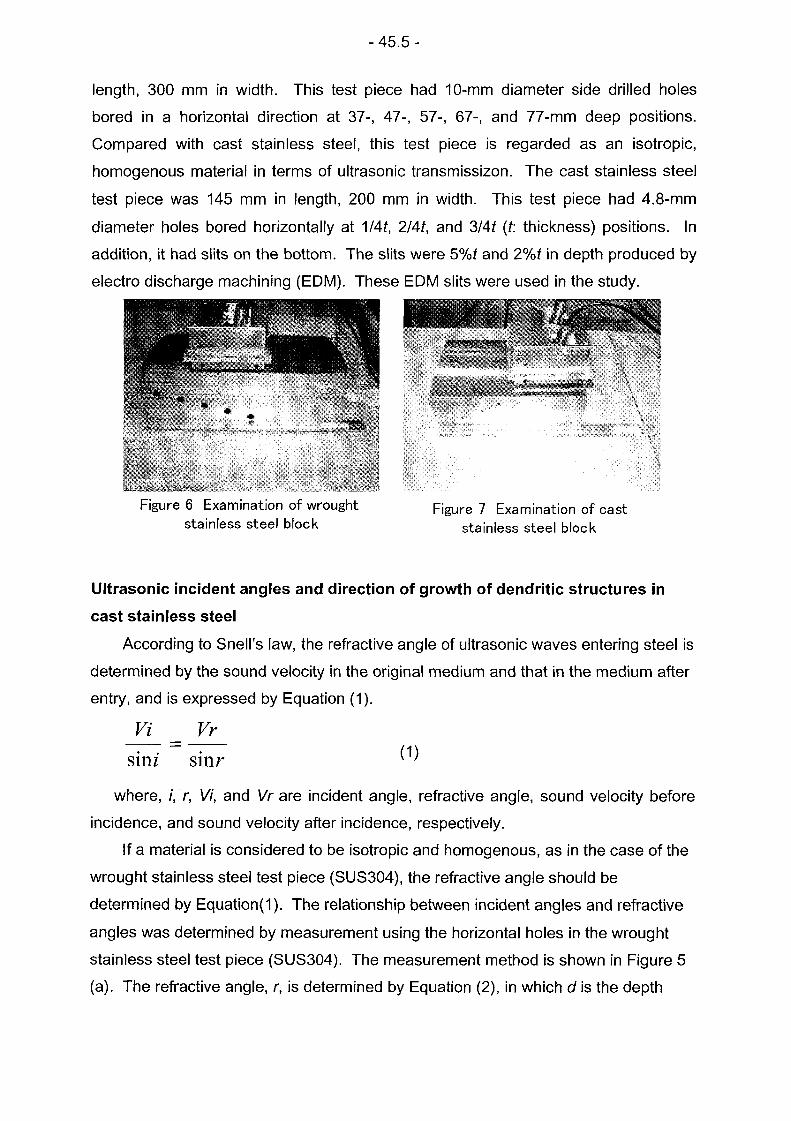
length, 300 mm in width. This test piece had 10-mm diameter side drilled holes
bored in a horizontal direction at 37-, 47-, 57-, 67-, and 77-mm deep positions.
Compared with cast stainless steel, this test piece is regarded as an isotropic,
homogenous material in terms of ultrasonic transmissizon. The cast stainless steel
test piece was 145 mm in length, 200 mm in width. This test piece had 4.8-mm
diameter holes bored horizontally at 114t, 214t, and 3/4t (t: thickness) positions. In
addition, it had slits on the bottom. The slits were 5%t and 2%t in depth produced by
electro discharge machining (EDM). These EDM slits were used in the study.
Figure 6 Examination of wrought Figure 7 Examination of caststainless steel block stainless steel block
Ultrasonic incident angles and direction of growth of dendritic structures in
cast stainless steel
According to Snell's law, the refractive angle of ultrasonic waves entering steel is
determined by the sound velocity in the original medium and that in the medium after
entry, and is expressed by Equation (1).
Vi Vr
sini sinr (1)
where, i, r, Vi, and Vr are incident angle, refractive angle, sound velocity before
incidence, and sound velocity after incidence, respectively.
If a material is considered to be isotropic and homogenous, as in the case of the
wrought stainless steel test piece (SUS304), the refractive angle should be
determined by Equation(l). The relationship between incident angles and refractive
angles was determined by measurement using the horizontal holes in the wrought
stainless steel test piece (SUS304). The measurement method is shown in Figure
(a). The refractive angle, r, is determined by Equation 2 in which d is the depth

- 45.6 -
from the surface of the test piece to the center of a horizontal hole and a, the
horizontal distance between the point of incidence of ultrasonic wave and the center
of the horizontal hole.
atanr = - (2)
d
The horizontal distance a was measured when the echo from the horizontal hole
was the maximum. Figure shows A-scope diagrams obtained at incident angles of
12.5 and 15 degrees............ ----------
(a) incident angle 25' side drilled hole (b) incident angle 15' side drilled hole
at 67mm in depth (35dB) at 67mm in depth (37dB)
Figure 8 A-scopes obtained from wrought stainless steel block
The refractive angle r was measured similarly for the cast stainless steel test
piece. The measurement method for the cast stainless steel is shown in Figure 5 (b).
The cast stainless steel test piece had dendritic structures growing almost
perpendicularly to the surface, as shown in Figure 5 (b). Hence, the angle between
the direction of the dendritic structures and the direction of ultrasonic transmission in
the test piece is deemed as the refractive angle, r, of ultrasonic wave transmitted to
the steel from the transducer placed on the test piece. The measurement of the test
piece of cast stainless steel was conducted using the 5%t slit. In this case, depth d
equals the thickness of the test piece and therefore: d = 70 mm.
Table 2 Measurement results of refractive angleIncident Refractive Refractive Table 2 shows measurementangle(') angle(SUS) angle (CS) results of refractive angle, r, of the
7.5 18.2 28.410.0 24.5 34.0 wrought stainless steel test piece
12.5 32.1 38.7 (SUS304) and the cast stainless steel
15.0 38.8 43.0 test piece.17.5 49.6 47.320.0 52.1 48.8
- 45.7 -
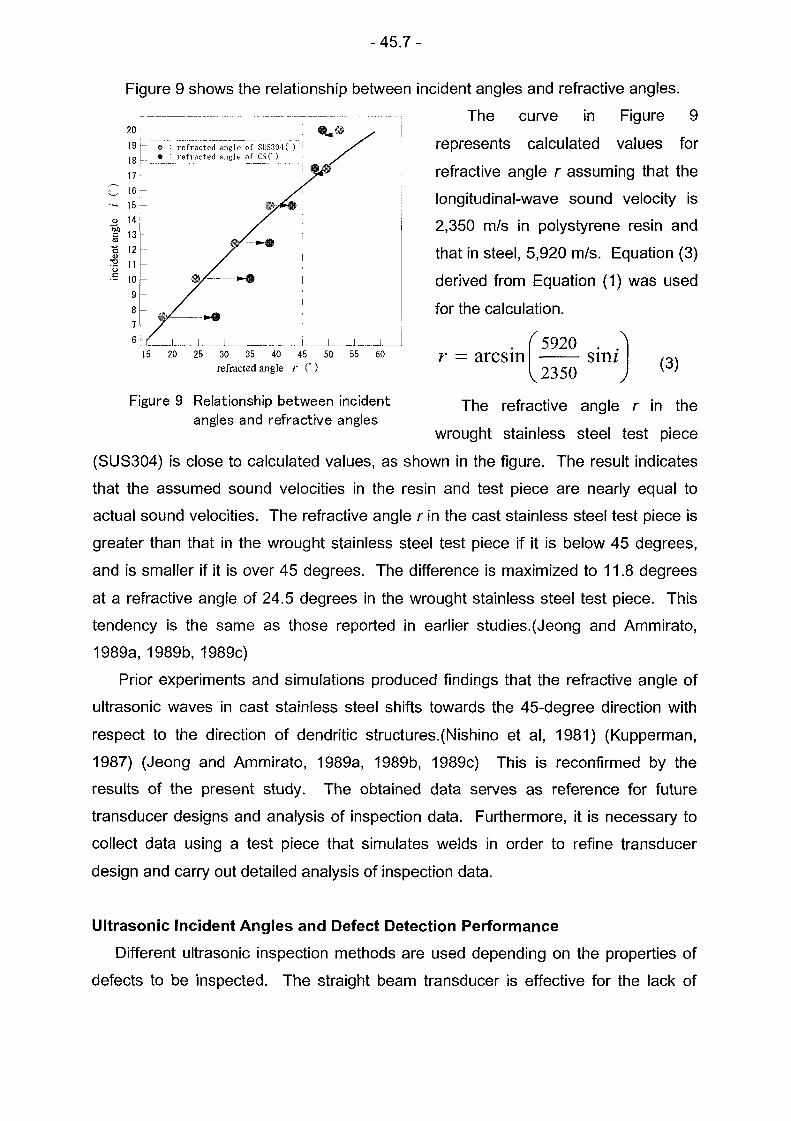
Figure 9 shows the relationship between incident angles and refractive angles.
The curve in Figure 9209 refracted angle of SUS30 C represents calculated values for
8 a refracted angle of CSC)
17 refractive angle r assuming that the6-5 longitudinal-wave sound velocity is4- 2,350 m/s in polystyrene resin and3-
2 that in steel, 5920 m1s. Equation 3)
10 derived from Equation (1) was used
8 for the calculation.7
6 -L- -- I -- ---- I-A 5920I 20 25 30 35 40 45 50 55 60 r = arcsin - sim
refracted angle r C ) 2350 (3)
Figure 9 Relationship between incident The refractive angle r in theangles and refractive angles
wrought stainless steel test piece
(SUS304) is close to calculated values, as shown in the figure. The result indicates
that the assumed sound velocities in the resin and test piece are nearly equal to
actual sound velocities. The refractive angle r in the cast stainless steel test piece is
greater than that in the wrought stainless steel test piece if it is below 45 degrees,
and is smaller if it is over 45 degrees. The difference is maximized to 11.8 degrees
at a refractive angle of 24.5 degrees in the wrought stainless steel test piece. This
tendency is the same as those reported in earlier studies.(Jeong and Ammirato,
1989a,1989b,1989c)
Prior experiments and simulations produced findings that the refractive angle of
ultrasonic waves in cast stainless steel shifts towards the 45-degree direction with
respect to the direction of dendritic structures.(Nishino et al, 1981) (Kupperman,
1987) (Jeong and Ammirato, 1989a, 1989b, 1989c) This is reconfirmed by the
results of the present study. The obtained data serves as reference for future
transducer designs and analysis of inspection data. Furthermore, it is necessary to
collect data using a test piece that simulates welds in order to refine transducer
design and carry out detailed analysis of inspection data.
Ultrasonic Incident Angles and Defect Detection Performance
Different ultrasonic inspection methods are used depending on the properties of
defects to be inspected. The straight beam transducer is effective for the lack of
- 45.8 -
penetration, blow-holes and other defects that occur inside the material during
construction of equipment. In contrast, surface breaking cracks are likely to occur
when the equipment is in service. The angle beam method is effective for this type of
defect.
The angle beam method using a twin-crystal transducer is effective for surface
breaking cracks in cast stainless steel. In this study, relationships between ultrasonic
incident angles and defect detection sensitivity were examined. A variable-incident
angle transducer similar to that explained in the previous section was used, with the
incident angle varied to 75, 10, 12.5, 15, 17.5, and 20 degrees. Surface breaking
cracks were simulated by the 2%t and 5%t EDIVI slits in the cast stainless steel test
piece. The measurement method is shown in Figure 5 (b). Incidentally, the incident
angle was set to 15 degrees for the large, focused double-crystal transducer
developed by the author.
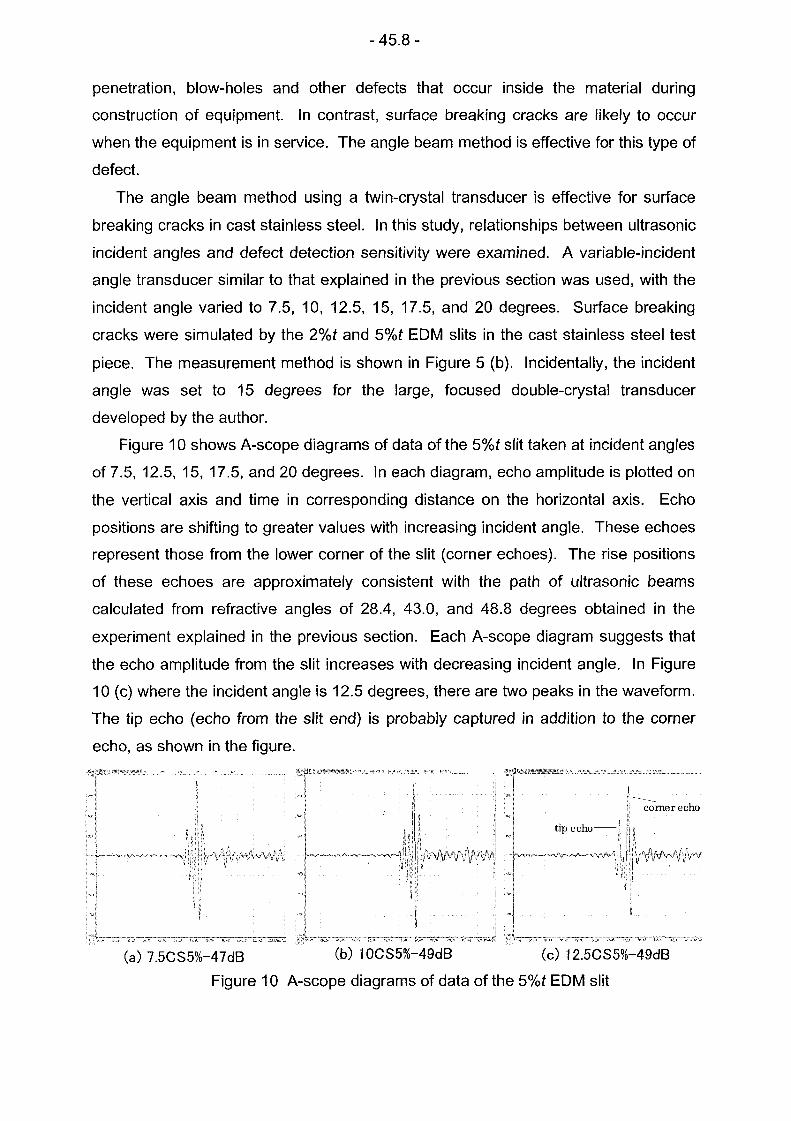
Figure 1 0 shows A-scope diagrams of data of the 5%t slit taken at incident angles
of 75, 12.5, 15, 17.5, and 20 degrees. In each diagram, echo amplitude is plotted on
the vertical axis and time in corresponding distance on the horizontal axis. Echo
positions are shifting to greater values with increasing incident angle. These echoes
represent those from the lower corner of the slit (corner echoes). The rise positions
of these echoes are approximately consistent with the path of ultrasonic beams
calculated from refractive angles of 28.4, 43.0, and 48.8 degrees obtained in the
experiment explained in the previous section. Each A-scope diagram suggests that
the echo amplitude from the slit increases with decreasing incident angle. In Figure
1 0 (c) where the incident angle is 12.5 degrees, there are two peaks in the waveform.
The tip echo (echo from the slit end) is probably captured in addition to the corner
echo, as shown in the figure.
corner echo
tip echo
(a) 7.5CS5%-47dB V IOCS5%-49dB (c) 12.5CS5%-49dB
Figure 1 0 A-scope diagrams of data of the 5%t EDM slit
45.9 -
-- ------------
Qv OV
Z-4- M_'_7E1_ NT 7 -
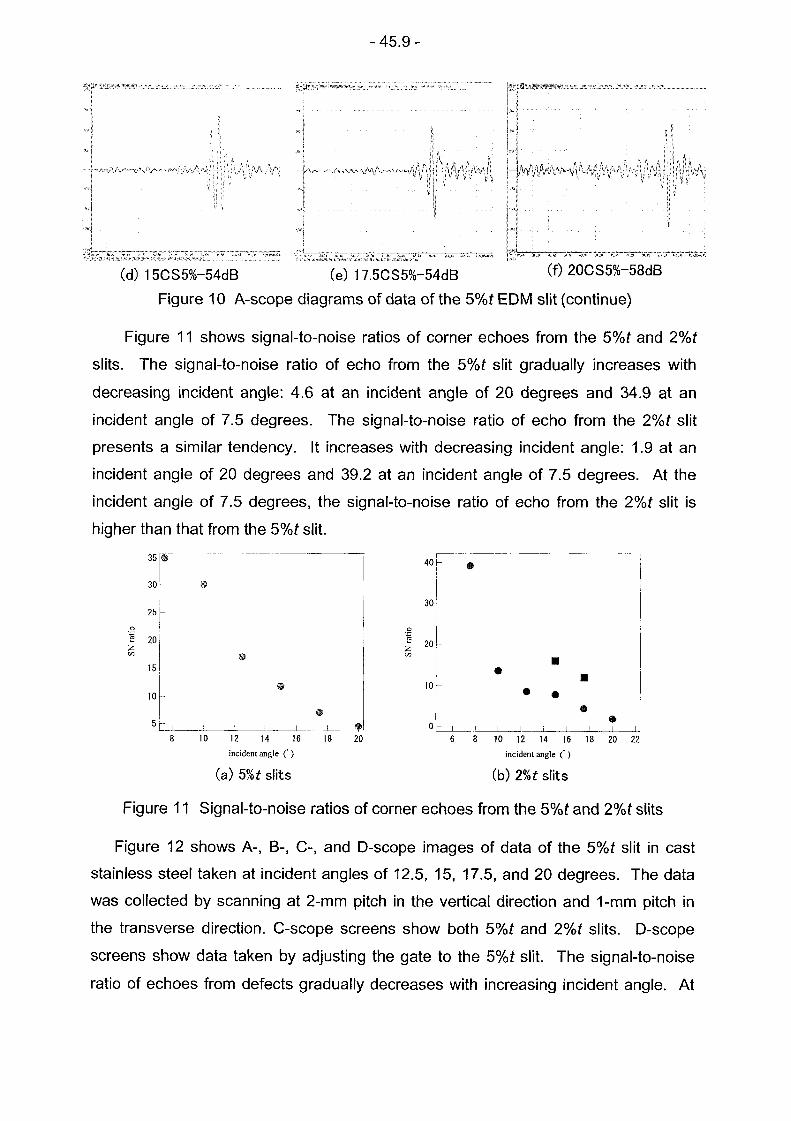
(d) 15CS5%-54dB (e) 17.5CS5%-54dB M 20CS5%-58dB
Figure 10 A-scope diagrams of data of the 5%t EDM slit (continue)
Figure 1 1 shows signal-to-noise ratios of corner echoes from the 5%t and 2%t
slits. The signal-to-noise ratio of echo from the 5%t slit gradually increases with
decreasing incident angle: 46 at an incident angle of 20 degrees and 34.9 at an
incident angle of 75 degrees. The signal-to-noise ratio of echo from the 2%t slit
presents a similar tendency. It increases with decreasing incident angle: 19 at an
incident angle of 20 degrees and 39.2 at an incident angle of 75 degrees. At the
incident angle of 75 degrees, the signal-to-noise ratio of echo from the 2%t slit is
higher than that from the 5%t slit.
35 40F
30 0
25L
z 20
15
10 10
5 0-
8 10 12 14 16 18 20 6 8 10 12 14 16 18 20 22
incident angle incident angle (
(a) 5%t slits (b) 2%t slits
Figure 1 1 Signal-to-noise ratios of corner echoes from the 5%t and 2%t slits
Figure 12 shows A-, B-, C-, and D-scope images of data of the 5%t slit in cast
stainless steel taken at incident angles of 12.5, 15, 17.5, and 20 degrees. The data
was collected by scanning at 2-mm pitch in the vertical direction and 1-mm pitch in
the transverse direction. C-scope screens show both 5%t and 2%t slits. D-scope
screens show data taken by adjusting the gate to the 5%t slit. The signal-to-noise
ratio of echoes from defects gradually decreases with increasing incident angle. At

- 45.10 -
the incident angle of 15 degrees, the D-scope screen shows two areas where signal
intensity is high. This is probably due to the detection of tip echo from the end of the
defect, as was observed in the A-scope diagram taken at the incident angle of 12.5
degrees. The defect is assessed to be approximately mm in depth on the screen,
which is a value being close to the actual depth of the defect (5%t = 35 mm) yet is
slightly exaggerated data. The cause of this error is probably the low resolution of
the transducer, which is attributable to the use of a low frequency of MHz and to its
large diameter of 38 mm making the effective range of ultrasonic beams wide. In
contrast, all C-scope screens suggest that the defect is approximately 30 mm long,
which is close to the length of the actual slit 30 mm). Thus, smaller incident angles
of ultrasonic entering cast stainless steel produce better results if detection sensitivity
for surface breaking cracks alone is taken into consideration.
_77 ----
AVIWI�
(a) incident angle 12.5' (b) incident angle 15'
t Al
(c) incident angle 7.5' (d) incident angle 20'
Figure 12 A-, B-, C-, and D-scope images of data
of the 5%t slit in cast stainless steel
- 45.11 -
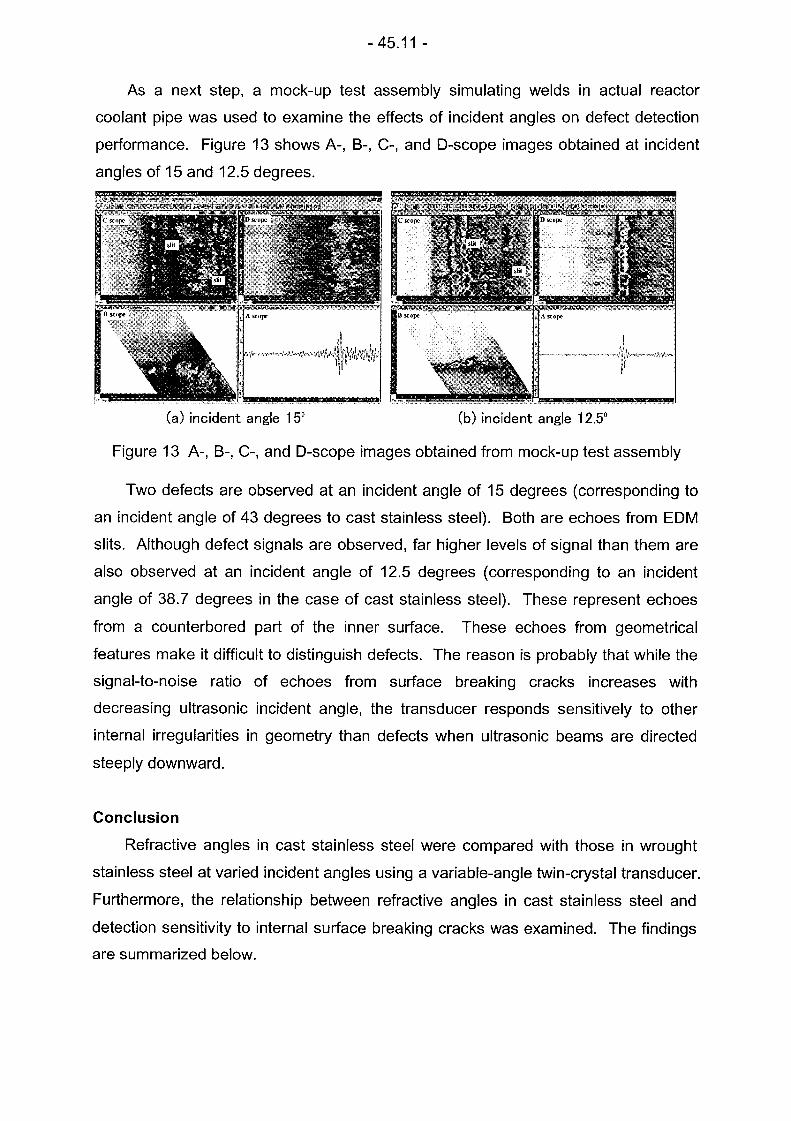
As a next step, a mock-up test assembly simulating welds in actual reactor
coolant pipe was used to examine the effects of incident angles on defect detection
performance. Figure 13 shows A-, B-, C-, and D-scope images obtained at incident
angles of 15 and 12.5 degrees.
A .. M ]A .. p�
Article
(a) incident angle 15' (b) incident angle 12.5'
Figure 13 A-, B-, C-, and D-scope images obtained from mock-up test assembly
Two defects are observed at an incident angle of 15 degrees (corresponding to
an incident angle of 43 degrees to cast stainless steel). Both are echoes from EDM
slits. Although defect signals are observed, far higher levels of signal than them are
also observed at an incident angle of 12.5 degrees (corresponding to an incident
angle of 38.7 degrees in the case of cast stainless steel). These represent echoes
from a counterbored part of the inner surface. These echoes from geometrical
features make it difficult to distinguish defects. The reason is probably that while the
signal-to-noise ratio of echoes from surface breaking cracks increases with
decreasing ultrasonic incident angle, the transducer responds sensitively to other
internal irregularities in geometry than defects when ultrasonic beams are directed
steeply downward.
Conclusion
Refractive angles in cast stainless steel were compared with those in wrought
stainless steel at varied incident angles using a variable-angle twin-crystal transducer.
Furthermore, the relationship between refractive angles in cast stainless steel and
detection sensitivity to internal surface breaking cracks was examined. The findings
are summarized below.

- 45.12 -
(1) All ultrasonic refractive angles in cast stainless steel tend to shift towards the 45-
degree direction. Differences between designed and actual refractive angles
were quantitatively ascertained. The maximum difference reaches 11.8 degrees.
(2) Defect detection sensitivity increases with decreasing incident angle. If, however,
the incident angle is smaller than 15 degrees, echoes from geometrical features
become intense, as shown by the inspection result of a mock-up test assembly
simulating welds in reactor coolant pipe.
Differences between designed and actual refractive angles should be taken into
consideration when determining the size of a defect. Smaller incident angles of
transducer produce better results if the signal-to-noise ratio of echoes from defects
alone is taken into account. However, the relative sensitivity to echoes from
geometrical features also increases with decreasing incident angle. It is therefore
necessary for reducing the false call to select the optimal angle from incident angles
greater than 15 degrees, which is the incident angle of the earlier transducer.
REFERENCES
D.S.Kupperman., K.J.Reimann., 1987, "Ultrasonic NDE of Cast Stainless Steel,"
NDT International, Vol.20, pp.145-152
P.Jeong., F.Amirato., 1989a, "Application of Ultrasound Ray Tracing for Cast
Stainless Steel Components and Austenitic Welds Examination in Nuclear
PowerPlant," Review of Progress Quantitative Nondestructive Evaluation, Vol.8,
pp.1131-1136
P.Jeong., F.Amirato., 1989b, "Ultrasonic Evaluation of Cast Stainless Steel
Component," Review of Progress Quantitative Nondestructive Evaluation, VoI.8,
p.2105-2112
P.Jeong., F.Amirato., 1989c, "Ultrasonic Examination of Cast Stainless Steel,
EPRI NP-6299 Project 1570-2 Topical Report
M.S.Good, E.R.Green, 1989, "Mapping of 1-MHz, 45' Longitudinal-Wave Fields in
Centrifugally Cast Stainless Steel," Review of Progress in Quantitative
Nondestructive Evaluation, 8A, p.889-895
S.Nishino., Y.Hida., M Yamamoto., 1981, "Ultrasonic inspection of austenitic
stainless steel," Technical Journal of Mitsubishi Heavy Industry, Vol.18, pp. 23-27

- 45.13 -
P Dombret P Caussin P Rorive, 1990, "Developing ultrsonics for PWR pump bowl
in-service inspection," Nuclear Engineering, 35, p.42-44
P. Dornbret., 1991, "Methodology for the ultrasonic testing of austenitic stainless
steel," Nuclear Engineering and Design, 131, pp. 279-284
P.Lemaitre., D.KobI6., 1995a, "Report on the evaluation of the inspection results
of the cast-to-cast PISC III Assemblies no.41, 42 and weld of Assembly 43," PSC
III Report no.34 European Commission
P.Lemaitre., D.Kobl6., 1995b, "Report on the evaluation of the inspection results
of the wrought-to-cast PISC III Assemblies 51 and weld A of Assembly 43," PISC III
Report no.35 European Commission
Y.Kurozumi., 2002, "Development of an ultrasonic inspection technique for cast
stainless steel," Insight, Vol.44, pp.437-442