influence of preoxidation on high ... -...
TRANSCRIPT
General rights Copyright and moral rights for the publications made accessible in the public portal are retained by the authors and/or other copyright owners and it is a condition of accessing publications that users recognise and abide by the legal requirements associated with these rights.
• Users may download and print one copy of any publication from the public portal for the purpose of private study or research. • You may not further distribute the material or use it for any profit-making activity or commercial gain • You may freely distribute the URL identifying the publication in the public portal
If you believe that this document breaches copyright please contact us providing details, and we will remove access to the work immediately and investigate your claim.
Downloaded from orbit.dtu.dk on: Sep 15, 2018
Influence of Preoxidation on High-Temperature Corrosion of a FeCrAl Alloy UnderConditions Relevant to Biomass Firing
Okoro, Sunday Chukwudi; Montgomery, Melanie; Jappe Frandsen, Flemming; Pantleon, Karen
Published in:Oxidation of Metals
Link to article, DOI:10.1007/s11085-017-9794-5
Publication date:2018
Document VersionPeer reviewed version
Link back to DTU Orbit
Citation (APA):Okoro, S. C., Montgomery, M., Jappe Frandsen, F., & Pantleon, K. (2018). Influence of Preoxidation on High-Temperature Corrosion of a FeCrAl Alloy Under Conditions Relevant to Biomass Firing. Oxidation of Metals,89(1-2), 99–122. DOI: 10.1007/s11085-017-9794-5
Influence of preoxidation on the high temperature corrosion of a FeCrAl alloy under conditions relevant to biomass firing
Sunday Chukwudi Okoro1, Melanie Montgomery1, Flemming Jappe Frandsen2, Karen Pantleon1
1Department of Mechanical Engineering, Technical University of Denmark (DTU), 2800 Kongens Lyngby, Denmark.
2CHEC Research Centre, Department of Chemical and Biochemical Engineering, DTU, 2800 Kongens Lyngby, Denmark.
Abstract Preoxidation of a commercial FeCrAl alloy (Kanthal APM) was evaluated as a surface modification approach to reduce alkali chloride induced corrosion during biomass firing in power plants. Samples of the alloy preoxidized at 900 oC in O2 or O2 + 10 vol % H2O, and at 1100 oC in O2, were coated with KCl and exposed at 560 oC to a gas mixture comprising of 12 vol % CO2, 6 vol % O2, 3 vol % H2O, 400 ppmv HCl and 60 ppmv SO2. The oxide formed at 1100 oC showed no reactivity with the corrosive species. In contrast, all samples preoxidized at 900 oC suffered severe attack, resulting in formation of Fe, Cr and Al containing corrosion products in a heterogeneous morphology, similar to non-preoxidized samples. The observed differences with respect to the degree of corrosion attack on the preoxidized samples are discussed in terms of the composition and thickness of the different types of Al2O3 layers obtained by the preoxidation treatment.
Keywords: FeCrAl alloy, Preoxidation, High temperature corrosion, KCl, Chlorination, Sulphation.
1

1. Introduction
Combustion of biomass for power production results in the deposition of corrosive K, Cl and S rich species on the superheater tubes [1,2]. These species aggravate fast corrosion of the superheaters at higher temperatures [3]. To avoid catastrophic corrosion of the superheaters, the present biomass fired boilers operate at or below a safe steam temperature limit (~540 oC). Operating at such low steam temperatures limits the efficiency of biomass fired boilers and as an alternative to lowering the operation temperature, new material solutions are needed to provide corrosion resistance at higher temperatures under biomass firing conditions.
Mechanistic understanding of high temperature corrosion under biomass firing conditions is necessary to find alternative superheater materials. From previous studies [4–8], it has been recognized that high Cr alloyed steels, that conventionally form a protective surface layer under oxidizing conditions, fail in alkali chloride containing environments because of: i) reactivity between alkali chloride and chromia, which consumes Cr from the alloy and consequently provokes the formation of a less protective Fe-rich oxide that is permeable to Cl species [5,7] and ii) selective attack of Cr and Cr-rich precipitates (possibly carbides) causing the development of a porous Cr depleted zone in the alloy [4]. In view of these observations, a viable approach would involve the initial formation of a protective oxide layer, which does not react with the corrosive species (KCl, HCl, SO2, etc.) encountered in biomass fired power plants.
The potential of preoxidation for protecting superheaters from corrosion has received considerable attention under sulphidizing environments [9–12]. However, under biomass firing conditions, i.e. involving oxidizing, chlorinating and sulphidizing species, investigations with focus on the influence of preoxidation are few. Investigations [13,14] involving only gaseous corrosive species (O2, HCl and SO2) have highlighted some positive effects of preoxidation on reducing corrosion of the investigated metals and alloys. Similarly, exposures involving solid deposits of KCl have recorded beneficial effects of preoxidation [15–17]. In particular, it is important to note that the preoxidation of Al-containing alloys seems promising because the stable oxide (α-Al2O3) is slow growing and permits lower ionic transport relative to Cr2O3 [16]. Moreover, chemical reactions between Al2O3 and KCl have been reported to be less likely compared with the reactivity between Cr2O3 and KCl [18]. However, assuming that the alloy contains enough Al, which can diffuse towards the surface to form a layer of Al2O3, it is also important to note that the protective nature of the oxide layer for subsequent exposure to biomass firing conditions will depend on the preoxidation environment and the temperature, because both parameters affect the evolution and stability of different Al2O3 polymorphs [19–25].
To explore the potential of Al2O3 to protect Al-containing alloys from corrosion, the present work investigates both the formation of Al2O3 and its effect on the high temperature corrosion of a commercial FeCrAl alloy (Kanthal APM) under laboratory conditions mimicking biomass firing.
2
2. Experimental
2.1 Material
A tube of the commercial FeCrAl alloy (Kanthal APM) with the composition given in Table 1 was employed for the experiments. Rings of 4 mm thickness were cut from the tube using a precision cut-off machine (Struers, Accutom-50). These rings were further sectioned into pieces to obtain arc-shaped specimens with external arc length of 21.4 mm which were ultrasonically degreased and dried in acetone and ethanol. For preoxidation as well as corrosion exposure, the samples were used in the as-cut condition without further surface preparation since it has been reported [26] that the nature of sample preparation influences the rate of oxidation.
Table 1. Chemical composition (in wt %) of Kanthal APM as specified by the manufacturer, Sandvik. Values in parenthesis were measured by energy dispersive X-ray spectroscopy.
Fe Cr Al Si Mn C Reactive elements
Bal. ≤23.5 (22.7) 5.8 (6.0) ≤0.7 (0.4) ≤0.4 ≤0.08 Y, Hf, Zr
2.2 Preoxidation and high temperature corrosion exposure
Preoxidation was carried out in a horizontal tube furnace applying different conditions to investigate the effect of both the preoxidation atmosphere (O2 with or without H2O) and temperature (900 oC and 1100 oC). The following conditions were used:
i) O2 at 900 oC,
ii) O2 + 10 vol% H2O at 900 oC
iii) O2 at 1100 oC.
Samples for each preoxidation experiment were placed parallel to the gas flow in the furnace and isothermally treated for the period of 168 h. The gas flow rate in each case was 300 mL/min. Afterwards, they were cooled to room temperature in the furnace under a flow of the applied gas.
For evaluating the effect of the preoxidation on corrosion resistance, the preoxidized samples as well as non-preoxidized samples (as reference) were subjected to an atmosphere containing 12 vol% CO2, 6 vol% O2, 400 ppmv HCl and 60 ppmv SO2 at a temperature of 560ºC for the period of 168 hours. Before the high temperature corrosion exposure, samples were coated with a deposit consisting of KCl, which together with the applied gas atmosphere resembles conditions in the power plant. The deposit was obtained by mixing 32-63 µm sized KCl particles (Sigma ≥ 99%) with iso-propanol. After drying the slurry, it left an approximately 1 mm thick KCl deposit on the surface of the samples. The samples were exposed in a corrosion test rig which consists of a gas mixing unit, a horizontal furnace and a gas cleaning unit. Details of the experimental setup are given elsewhere [27]. The gas
3

mixture was passed through a water bath, to add 3 vol% H2O, before feeding into the furnace through preheated gas lines using N2 as a carrier gas. The total gas flow rate was 1000 mL/min. A minimum of 3 samples, in a given condition, were exposed to check reproducibility of the results. The samples were aligned parallel to the gas flow in the furnace. After each exposure, samples were cooled inside the furnace under a flow of the applied gas mixture.
2.3 Characterization of preoxidized surfaces and corrosion products
Microstructure characterization of samples after preoxidation was carried out on sample cross sections, and supplemented by plan view investigations. Non-preoxidized and preoxidized samples were mounted in an epoxy resin followed by standard metallographic preparation of the sample cross sections down to 1 µm diamond suspension polishing.
The cross sections of preoxidized samples were coated with carbon prior to investigations with scanning electron microscopy (SEM) and energy dispersive X-ray spectroscopy (EDS), to avoid charging of the embedded samples in the SEM. The thickness of the oxide layers was measured from SEM images of the cross sections with the help of an image analysis software (ImageJ). In addition, plan view investigations applying SEM and EDS were carried out on the preoxidized samples and further supplemented with X-ray diffraction (XRD) analysis for identification of phases in the oxide layers.
Corrosion products were characterized by both cross-section and plan view investigations. As described previously [27], the metallographic preparation of sample cross sections after corrosion exposure occurred with special care to preserve the corrosion product. Plan view investigations started on the topside and underside of the deposit which had sintered during exposure and could easily be removed to reveal the as-corroded surface, and subsequently involved successive mechanical removal of the corrosion product layers with a scalpel or SiC paper. The revealed interfaces were characterized by the complementary use of SEM, EDS and XRD. The methodology of comprehensive plan view and cross section analysis has been previously reported [28].
The SEM (FEI Inspect S or Quanta ESEM FEG with EDS system from Oxford Instruments) was operated for both imaging and chemical analysis with an acceleration voltage of 15 keV (unless stated otherwise). Both secondary electrons (SE) and backscattered electrons (BSE) were used for imaging. For qualitative phase analysis by XRD, a Bruker AXS D8 Discover diffractometer equipped with Cr-Kα radiation was used. All XRD measurements were carried out in grazing incidence mode (GI-XRD) with a counting time of 10 s per step size of 0.03o2θ. A fixed incidence angle (γ) of 2o was used for oxide phase identification after preoxidation, which corresponds to a uniform X-ray penetration depth of about 1µm. XRD investigations on samples after corrosion exposures employed γ=5o, thus, covering slightly larger depths, which combined with subsequent mechanical removal, prevents averaging over the expected differences in chemical and phase composition below the surface.
4

For microstructure analysis of the FeCrAl bulk alloy before and after preoxidation as well as after corrosion exposure, polished cross-sections were etched with glyceregia and investigated using reflected light optical microscopy (LOM).
3. Results
3.1 Preoxidation under different gas atmospheres (O2, O2 + 10 vol% H2O) and temperatures (900°C, 1100°C)
The microstructure of the oxide formed after preoxidation in O2 at 900 oC is shown in Figure 1, from which features exhibiting globular (insert in Figure 1a) and platelet (Figure 1b) morphologies can been seen. Figure 1c showing the cross section of the sample reveals a thin oxide of about 0.5 µm thickness (Figure 2), which predominantly contains Al and O as revealed by EDS.
Figure 1. Oxide morphology resulting from preoxidation in O2 at 900 oC. (a, b) SE micrographs (acceleration voltage, 10 keV) showing plan view morphology of the sample surface, (c) BSE micrograph showing a cross section of the sample.
Changing the gas atmosphere by adding 10 vol% H2O during preoxidation (O2 + 10 vol% H2O) at 900°C, does not considerably affect the morphology and composition of the oxide (Figure 3), but results in local thickness variations with a slightly higher thickness (about 0.7 µm on average) of the preoxidized layer (Figure 2). The corresponding oxide surface and cross section as shown in Figure 3, reveal similar morphology (platelets and globular features, Figure 3b, c) and composition (Al enriched surface) as the oxide obtained after preoxidation at 900°C in O2 (cf. Figure 1). In contrast to preoxidation in O2, local enrichment of Cr was observed within the oxide adjacent the oxide/alloy interface where thicker oxides formed (Figure 3e).
5

Figure 2. Thickness of oxide layers after preoxidation under different gas atmospheres and temperatures. A minimum of 50 measurements were employed to obtain the statistical distribution of the oxide layer thickness. The round dots represent the mean thickness, while the vertical extensions depict the maximum and minimum oxide thickness. The box edges represent the standard deviation of the mean, and the horizontal bar inside each box depicts the position of 50% of the distribution.
Compared to the minor effect of the gas atmosphere during pre-oxidation at 900°C as described above, an increase of the temperature to 1100°C was found to strongly affect the thickness of the oxide. After preoxidation in O2 at 1100 oC, thickness measurements as well as microscopic cross section analysis with EDS measurements (Figure 4) reveal an about 4.3 µm thick oxide layer (Figure 2), which fully covers the surface. In addition, the platelet features observed on samples preoxidized at 900°C (Figures 1b and 3b) were absent on samples preoxidized at 1100°C. Instead, the oxide contained features with a globular morphology (Figure 4b).
6

Figure 3. Oxide morphology resulting from preoxidation in O2+ 10 vol % H2O at 900 oC. (a-c) SE micrographs (acceleration voltage, 10 keV) showing plan view morphology of the oxide. (d, e) BSE micrographs and EDS maps showing the cross-section and elemental composition of different regions of the oxide.
7

Figure 4. Oxide morphology resulting from preoxidation in O2 at 1100 oC. (a, b) SE micrographs (acceleration voltage, 10 keV) of the oxide in plan view of the sample surface. (c) BSE micrograph showing the cross-section and (d) elemental composition of the oxide.
The diffraction patterns obtained from grazing incidence X-ray diffraction measurements on samples subjected to the different preoxidation treatments are shown in Figure 5. For the samples that were preoxidized at 900°C, phase analysis confirmed the presence of the thermodynamically stable phase α-Al2O3 [Joint Committee on Powder Diffraction Standards (JCPDS) card: 46-1212] with a rhombohedral crystal lattice. Also Cr2O3 [JCPDS card: 38-1479] was detected on these samples independent of the applied gas atmosphere at 900°C. However, as α-Al2O3 and Cr2O3 are of the same crystal lattice, the formation of a solid solution of these oxides is possible [29–31] and the simultaneous presence of Cr-Al-oxide ((Al0.948Cr0.052)2O3, [JCPDS card: 71-0958]) is suggested from to the observed asymmetry of measured oxide peaks.
8

Figure 5. (a) XRD diffraction patterns measured for samples from the various preoxidation treatments. (b, c) Magnified regions of the diffraction patterns showing asymmetric peak profiles due to overlapping peaks from different phases in the preoxidation layers. Identified oxide phases are marked.
A metastable Al2O3 [JCPDS card: 46-1131] with a tetragonal lattice, possibly δ-Al2O3 [32], was also present in the oxides formed at 900 oC and overlap of its peaks with those of Cr2O3, (Al0.948Cr0.052)2O3 and α-Al2O3 also contributes to the observed asymmetric profile of some α-Al2O3 peaks as exemplified in Figure 5b. On the other hand, the oxide obtained after preoxidation in O2 at
9

1100 oC consists mainly of α-Al2O3. However, at higher diffraction angles, peaks corresponding to the α-Al2O3 phase also exhibit an asymmetric profile (Figure 5c), which indicates the simultaneous presence of a solid solution (Al0.948Cr0.052)2O3. As a result of the thin nature of these oxides, reflections from the bulk alloy (α-Fe [JCPDS card: 85-1410]) were also recorded in all the diffraction patterns.
3.2 Characterization of corrosion products
3.2.1 Corrosion of non-preoxidized samples
Figure 6 shows the cross section of the heterogeneous corrosion product resulting from severe attack after corrosion exposure of a non-preoxidized Kanthal APM sample. From the BSE micrograph in Figure 6a, it appears that the corrosion product has grown outwards and inwards, i.e. above and below the original sample surface. The corrosion attack progressed towards the bulk alloy by grain boundary attack.
Figure 6. Corrosion of a non-preoxidized sample. (a) BSE micrograph. (b, c) Magnified images emphasizing the microstructure of the corresponding areas in (a).
10

Figure 7. EDS map showing the elemental distribution in corrosion products resulting from corrosion exposure of non-preoxidized sample.
EDS maps in Figure 7 showing the elemental distribution within these corrosion products reveal that those formed above the original surface consist of a mixture of oxides of the alloying elements (Al, Cr and Fe) with K (from the applied deposit) and S (from the gas atmosphere). This is supported by the contrast differences observed by microscopy (Figure 6b), which relate to the formation of oxides and sulphate (dark regions) in the micrograph. The corrosion product formed below the original surface also consists of a mixture of different phases (Figure 6c) which is revealed by EDS mapping (Figure 7) to be an oxide mixture containing Al, Cr and Fe. The maps also show that Al and Cr oxides are present in the regions where grain boundary attack occurred. Slight local enrichment of S and Cl is observed at the corrosion front.
Results from plan view characterization (Figure 8 and 9) provide more information on the morphology of the corrosion products. At the gas/deposit and deposit/corrosion product interfaces, the typical microstructures of the deposit after exposure are shown in Figures 8a and b, respectively. A distinctive observation is the accumulation of K, S and O rich features, indicating the formation of K2SO4, around KCl deposit particles. The size of these K2SO4 accumulations is largest at the gas/deposit interface, partly obscuring identification of the KCl deposit particles, but is much smaller just below the surface (Figure 8a). Consistently, the smaller size of these K, S and O rich accumulations also is observed at the deposit/corrosion product interface (Figure 8b) where, consequently, EDS analysis also shows the presence of Cl due to contribution from the deposit particles.
11

Figure 8. BSE micrographs showing the plan view microstructure of deposits at the (a) gas/deposit and (b) deposit/corrosion product interfaces after exposure of a non-preoxidized sample. Inserted EDS results are given in wt %.
The plan view morphology of corrosion products after removal of the deposit is shown in Figure 9a, from which Fe-Cr containing oxides with platelet morphologies are evident. With successive mechanical removal of the outer corrosion products, regions of grain boundary attack were revealed. Figure 9b shows a typical plan view microstructure of such regions. In agreement with observations on sample cross sections (Figure 7), the accompanying EDS maps (Figure 9c) reveal that Al, Cr and O were present in the attacked grain boundaries. Local Cl accumulation is also identified around the regions of grain boundary attack.
Figure 10 shows the crystalline phases at different depths within the corrosion product as detected with XRD. At the deposit/gas interface, the presence of K2SO4 [JCPDS card: 70-1488] in the initial KCl deposit [JCPDS card: 41-1476] is revealed. This is in agreement with the observation of K, S and O rich features in Figure 8a. At the surface of the corrosion product, after deposit removal, Fe2O3 [JCPDS card: 33-0664] and FeCr2O4 [JCPDS card: 34-140] were identified. No additional phase is observed with further removal of the corrosion products, until the bulk alloy was approached. Instead, the peak intensities for Fe2O3 and FeCr2O4 decreased, while those from the bulk alloy (α-Fe [JCPDS card: 85-1410]) increased.
12

Figure 9. Selected results from plan view ‘top-down’ characterization of corrosion products on a non-preoxidized sample after corrosion exposure. (a) SE micrograph showing heterogeneous Fe-rich oxide after removal of the deposit (i.e. at the corrosion product/deposit interface). (b) BSE micrograph and (c) EDS maps showing the microstructure and elemental composition of grain boundary attacked regions at the corrosion product/bulk alloy interface. Inserted EDS results in (a) are given in wt %.
13
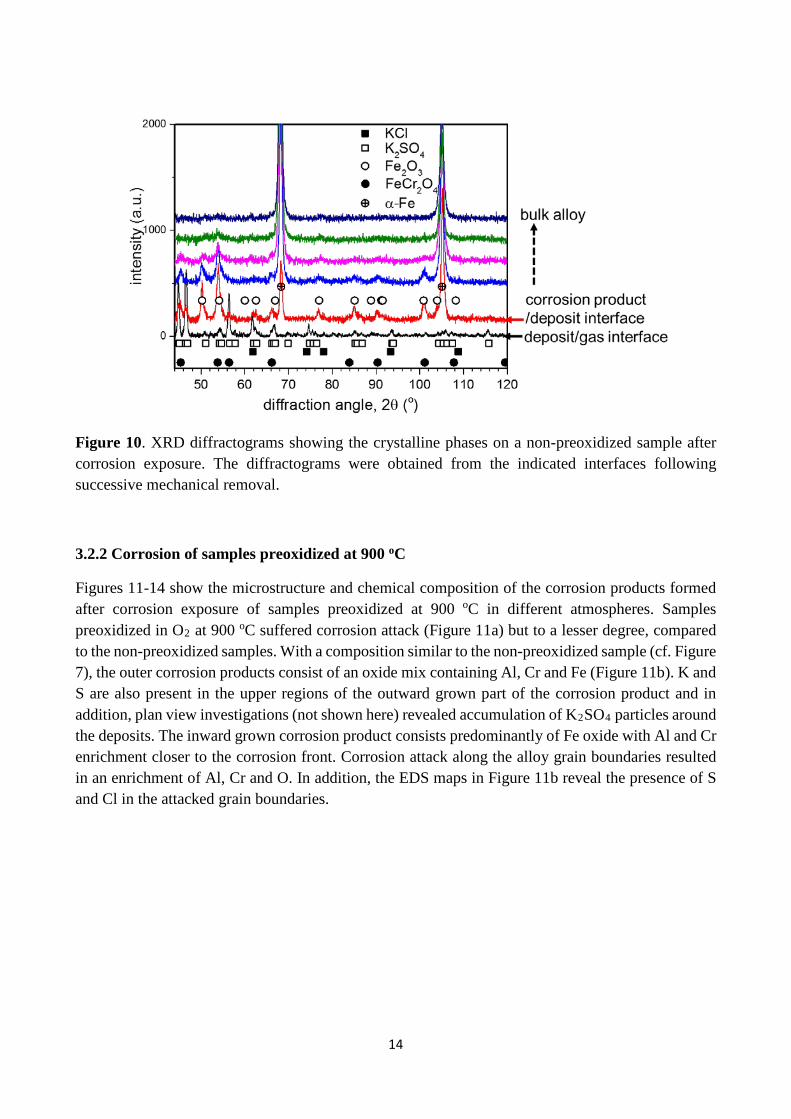
Figure 10. XRD diffractograms showing the crystalline phases on a non-preoxidized sample after corrosion exposure. The diffractograms were obtained from the indicated interfaces following successive mechanical removal.
3.2.2 Corrosion of samples preoxidized at 900 oC
Figures 11-14 show the microstructure and chemical composition of the corrosion products formed after corrosion exposure of samples preoxidized at 900 oC in different atmospheres. Samples preoxidized in O2 at 900 oC suffered corrosion attack (Figure 11a) but to a lesser degree, compared to the non-preoxidized samples. With a composition similar to the non-preoxidized sample (cf. Figure 7), the outer corrosion products consist of an oxide mix containing Al, Cr and Fe (Figure 11b). K and S are also present in the upper regions of the outward grown part of the corrosion product and in addition, plan view investigations (not shown here) revealed accumulation of K2SO4 particles around the deposits. The inward grown corrosion product consists predominantly of Fe oxide with Al and Cr enrichment closer to the corrosion front. Corrosion attack along the alloy grain boundaries resulted in an enrichment of Al, Cr and O. In addition, the EDS maps in Figure 11b reveal the presence of S and Cl in the attacked grain boundaries.
14
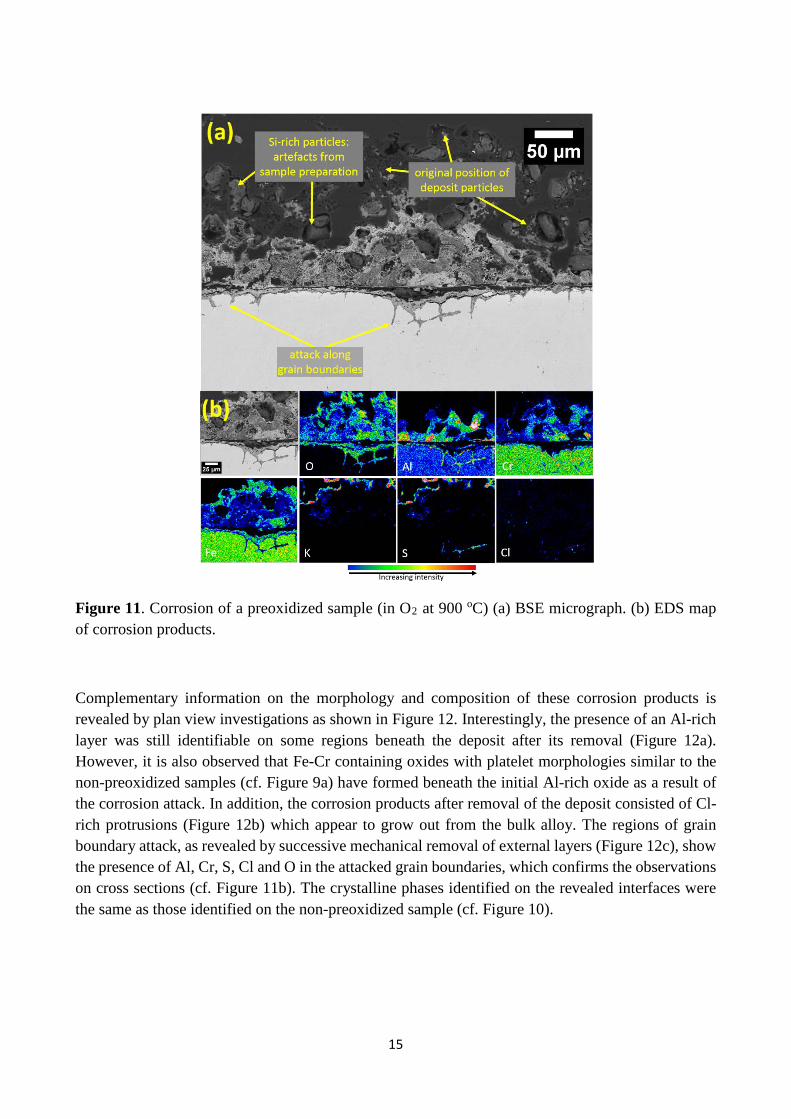
Figure 11. Corrosion of a preoxidized sample (in O2 at 900 oC) (a) BSE micrograph. (b) EDS map of corrosion products.
Complementary information on the morphology and composition of these corrosion products is revealed by plan view investigations as shown in Figure 12. Interestingly, the presence of an Al-rich layer was still identifiable on some regions beneath the deposit after its removal (Figure 12a). However, it is also observed that Fe-Cr containing oxides with platelet morphologies similar to the non-preoxidized samples (cf. Figure 9a) have formed beneath the initial Al-rich oxide as a result of the corrosion attack. In addition, the corrosion products after removal of the deposit consisted of Cl-rich protrusions (Figure 12b) which appear to grow out from the bulk alloy. The regions of grain boundary attack, as revealed by successive mechanical removal of external layers (Figure 12c), show the presence of Al, Cr, S, Cl and O in the attacked grain boundaries, which confirms the observations on cross sections (cf. Figure 11b). The crystalline phases identified on the revealed interfaces were the same as those identified on the non-preoxidized sample (cf. Figure 10).
15

Figure 12. Selected results from plan view ‘top-down’ characterization of corrosion products on a preoxidized sample (in O2 at 900 oC). (a) SE micrograph showing the heterogeneous Fe-rich oxide at the corrosion product/deposit interface. The initial oxide layer is evident on some regions. (b) Cl-rich protrusions (BSE micrograph) at the corrosion product/deposit interface. (c) BSE micrograph and EDS maps showing the microstructure and elemental composition of grain boundary attacked regions at the corrosion product/bulk alloy interface. Inserted EDS results in (a) and (b) are given in wt %.
16

Figure 13. BSE micrographs showing the corrosion of a preoxidized sample (in O2+ 10 vol % H2O at 900 oC). (a) Regions showing insignificant corrosion attack and (b) typical microstructure of severely attacked regions.
For the samples which were preoxidized in O2 + 10 vol% H2O at 900 oC, Figure 13a shows that some regions (less than 15% of the investigated cross sections) did not suffer significant corrosion attack after corrosion exposure. EDS maps in Figure 14a clearly show the presence of an Al rich layer in such regions, in addition to K, Cl, S and O. In contrast to these regions of considerable reduced attack, severe corrosion attack (Figure 13b) which preferentially progressed towards the bulk alloy through the grain boundaries also occurred for samples preoxidized in O2 + 10 vol% H2O at 900 oC. Such attack was observed on more than 80% of the sample cross section. In such regions where severe corrosion attack occurred, EDS maps (Figure 14b) reveal that the corrosion products were similar in composition, to that observed after corrosion of the sample preoxidized in O2 at 900 oC (cf. Figure 11b).
17
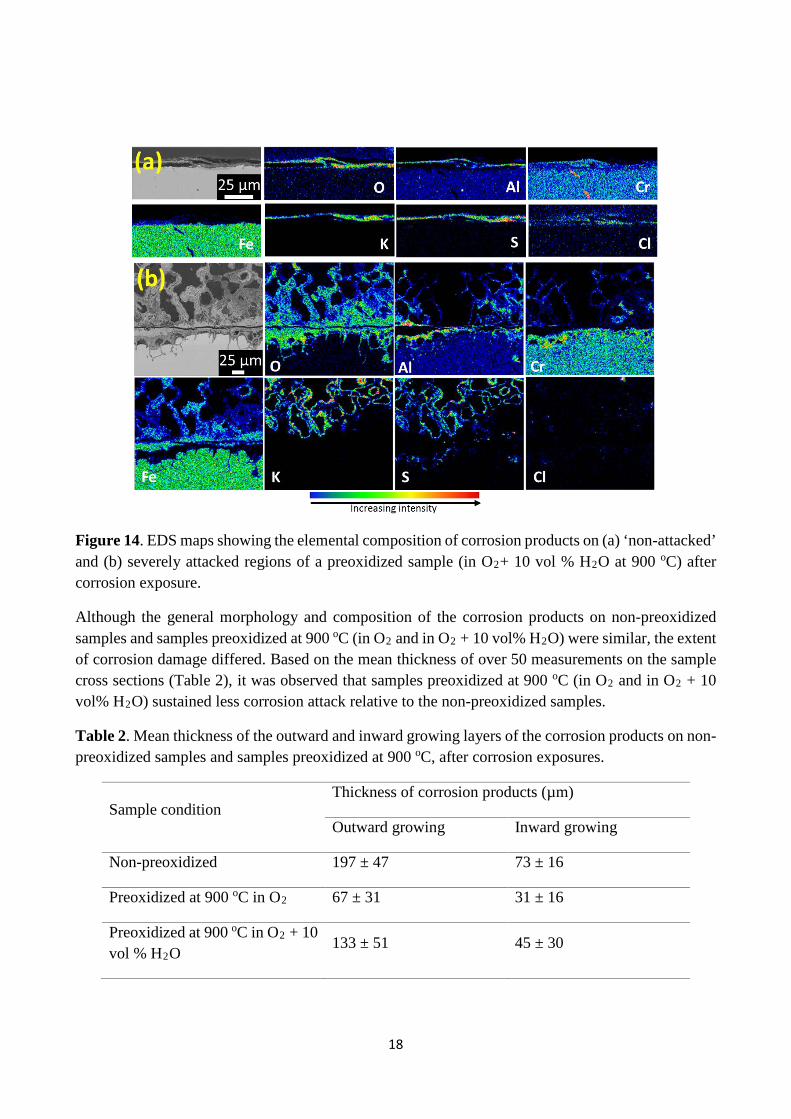
Figure 14. EDS maps showing the elemental composition of corrosion products on (a) ‘non-attacked’ and (b) severely attacked regions of a preoxidized sample (in O2+ 10 vol % H2O at 900 oC) after corrosion exposure.
Although the general morphology and composition of the corrosion products on non-preoxidized samples and samples preoxidized at 900 oC (in O2 and in O2 + 10 vol% H2O) were similar, the extent of corrosion damage differed. Based on the mean thickness of over 50 measurements on the sample cross sections (Table 2), it was observed that samples preoxidized at 900 oC (in O2 and in O2 + 10 vol% H2O) sustained less corrosion attack relative to the non-preoxidized samples.
Table 2. Mean thickness of the outward and inward growing layers of the corrosion products on non-preoxidized samples and samples preoxidized at 900 oC, after corrosion exposures.
Sample condition Thickness of corrosion products (µm)
Outward growing Inward growing
Non-preoxidized 197 ± 47 73 ± 16
Preoxidized at 900 oC in O2 67 ± 31 31 ± 16
Preoxidized at 900 oC in O2 + 10 vol % H2O
133 ± 51 45 ± 30
18

3.2.3 Corrosion of samples preoxidized at 1100 oC
The formed α-Al2O3–rich layer due to preoxidation in O2 at 1100 oC was still visible on the sample after corrosion (Figures 15 and 16) and obviously has protected the surface from severe corrosion attack as shown in Figure 15a. The localized regions (less than 40% of the sample) where corrosion attack occurred (Figure 15b) were close to the sample edges where the oxide layer spalled prior to corrosion exposure. The corrosion product, as shown in Figure 15b, laterally progressed underneath the preoxidation layer from the attack initiated close to the edges of the sample. From Figure 16, it is observed that the corrosion attack resulted in the formation of K2SO4 containing Fe and Al-rich oxide above the α-Al2O3-rich layer, and an Al, Cr and Fe containing oxide below. In the attacked grain boundaries, an enrichment of Al, Cr, S and Cl is observed.
Comparison of results after exposure of samples preoxidized in O2 at 1100 oC (Figure 15), with the exposure of samples preoxidized at 900 oC (Figures 11, 12 and 13) indicate that the resistance of the oxide layers to corrosion attack has been influenced by the preoxidation temperature. To check whether this effect is related to changes in the bulk microstructure due to the different preoxidation temperatures, the thermal stability of the sample bulk alloy at both 900 oC and 1100 oC was investigated with reflected light optical microscopy (not shown here) and confirmed that the bulk microstructure remained stable. Thus, the observed differences in the final corrosion attack of the various samples are solely related to the nature of the surface layers obtained by preoxidation (see section 4.3), and not induced by changes of the bulk microstructure, which could have implied different diffusion conditions during exposure.
Figure 15. BSE micrographs showing microstructure of a sample preoxidized in O2 at 1100 oC, after exposure. (a) Non-attacked regions are representative for most of the preoxidized sample, and (b) corrosion attack are close to positions at the sample edges.
19

Figure 16. Elemental composition of the corrosion products on local attacked regions of a sample preoxidized in O2 at 1100 oC, after corrosion exposure. Presence of Cl in the epoxy is responsible for its identification in the upper parts of the Cl map.
4. Discussion
4.1 The influence of preoxidation conditions
The 6 wt% of Al in the investigated alloy is above the minimum Al concentration suggested for the formation of Al-rich oxide layers on FeCrAl alloys [33] and, indeed, the formation of an Al-rich oxide layer was evident after the different preoxidation treatments (Figures 1, 3 and 4). It is well documented [19–21,24,25,33–40] that formation of any of the Al2O3 polymorphs (α-, γ-, δ-, θ-phase) is influenced by variables such as H2O in the environment, temperature and time. Earlier studies [22,24,32] have reported that α-Al2O3 formation is favoured at temperatures above 1050 oC, while at lower temperatures metastable polymorphs (δ-, γ-, θ-Al2O3) predominate. However, in agreement with previous investigations on FeCrAl alloys (Kanthal AF and Kanthal APMT) [19–21,38,40], XRD (Figure 5) indicated the formation of α-Al2O3 after preoxidation of Kanthal APM already at 900 oC. Nonetheless, for preoxidation at 900ºC, additional reflections from Cr2O3 and the tetragonal (metastable) Al2O3 were also recorded (Figures 5b), thus indicating that the oxide formed at 900 oC did not only consist of α-Al2O3. Cr2O3 can be formed during the initial stages of oxidation of Cr-containing alloys [19,21,38], and is known to facilitate the nucleation of α-Al2O3 as well as the transformation of metastable Al2O3 polymorphs to the stable α-Al2O3 [22,41].
As previously mentioned in section 3.1, the isomorphous lattices of α-Al2O3 and Cr2O3 can allow the formation of a solid solution of the oxides. At lower temperatures, the miscibility gap in the Al2O3-Cr2O3 system allows for the presence of Al2O3 and Cr2O3 rich solid solutions [31,42]. The incorporation of the larger Cr3+ into the α-Al2O3 lattice will cause an increase in its lattice cell parameter, in accordance with Vegard’s law, and therefore the α-Al2O3 peak positions will shift to lower diffraction angles if an α-Al2O3 layer contains some amount of Cr [29–31]. For molar fractions
20

of Cr2O3 higher than 0.5, separate reflections from Cr2O3 will also be recorded in the diffraction pattern [29]. On the example of the 116 reflection of α-Al2O3 at 2θ = 91.3o (Figure 5b), the high amount of Cr in the oxides formed at 900 oC is probably responsible for the separate 116 reflection of Cr2O3 at a lower 2θ value of 86.4o. The asymmetric profile of the α-Al2O3 116 peak is rather attributed to the overlapping 211 reflection of Cr2O3, as well as reflections from the metastable δ-Al2O3. On the basis of these observations, it is suggested that the oxides formed at 900 oC contain a Cr-rich solid solution of the stable α-Al2O3 and Cr2O3, as well as the metastable δ-Al2O3. The possible presence of metastable Al2O3 in these oxides is also supported by the platelet features observed by SEM (Figures 1b and 3b), which is the typical morphology reported for metastable polymorphs of Al2O3 [35,43,44]. In contrast, the oxide formed at 1100 oC did not contain such platelet features, but rather exhibited globular morphologies, hence suggesting the absence of metastable Al2O3 in such oxides. In addition, XRD results (Figure 5a, c) suggest that these oxides are not Cr-rich. On the example of the 300 reflection of α-Al2O3 at 2θ = 112.9o (Figure 5c), a high amount of Cr in the oxide should have caused separate 300 reflections from Cr2O3 at 2θ = 106.2o. Instead, a Cr-deficient solid solution of Al-Cr-oxide , i.e. (Al0.948Cr0.052)2O3, was present in the oxide and overlap between its peaks and α-Al2O3 peaks is responsible for the asymmetric profile of the α-Al2O3 peak shown in Figure 5c. The low content of Cr in this oxide could be due to volatilization of Cr from the oxide, which should be significant around 1100 oC [45,46].
It has been suggested that the ability of H2O to cause hydroxylation of metastable Al2O3 surfaces stabilizes these polymorphs against α-Al2O3 [19]. However, on the basis of XRD and microstructural characterization (Figures 1, 3 and 5), results from the present investigation do not suggest any strong effect of H2O on delaying the transformation of metastable alumina polymorphs to stable α-Al2O3. On the other hand, the preoxidation temperature is observed to influence the thickness and composition of the resulting oxide layer such that a thicker oxide comprising mainly of α-Al2O3 formed after preoxidation at 1100 oC (Figures 2 and 5).
4.2 Corrosion of non-preoxidized samples
The porous and heterogeneous morphology of corrosion products on non-preoxidized samples of Kanthal APM (Figure 6) suggest that corrosion possibly involved vapour phase transport of species rather than transportation through the oxide lattice. It is known that HCl in the inlet gas mixture, in addition to that formed from conversion of the deposits to K2SO4 [6,47,48], is able to induce chlorination of alloying elements, causing formation of non-stable metal chlorides. Thermodynamic calculations [49,50], in line with previous investigations [51] show that chlorination of the major alloying elements in Kanthal APM (Fe, Cr and Al) is favourable at 560 oC. The high vapour partial pressures of the metal chlorides generated from the chlorination process [14,28,52] is suggested to have provoked vapour phase transport of these species away from the corrosion front. This is supported by the heterogeneous and porous morphology of the corrosion products (Figures 6 and 9a). Although the investigated alloy contains about 6 wt % Al, which under oxidizing atmospheres should form a protective layer of Al2O3 [33], the nature of corrosion attack under biomass firing conditions prevented this. Al oxides can result from conversion of their chlorides to oxides (Figure 7), however AlCl3 is so volatile that it evaporates from the alloy before being oxidised and therefore does not
21

form a compact uniform layer but instead a porous heterogeneous oxide in the corrosion products above the original metal surface.
The preferential nature of corrosion attack along the alloy grain boundaries (Figures 6 and 9b) may have been caused by faster transportation through such pathways. However, as bulk microstructural characterization of the investigated alloy showed the presence of Cr-rich precipitates, possibly Cr-carbides (micrographs not shown here), the preferential attack of such precipitates, owing to the sensitivity of Cl towards Cr-carbides [3,51,53,54], may have caused attack to progress along the grain boundaries.
Since the oxide formed from conversion of the metal chlorides is not protective, both atomic and molecular transport of sulphur towards the corrosion front is possible during corrosion. The relatively low oxygen partial pressure at such positions may allow for sulphidation attack in addition to chlorination. This probably accounts for S accumulation in the internally formed corrosion products (Figure 7).
4.3 Corrosion of preoxidized samples
From assessment of the corrosion products on samples preoxidized at 900 oC in O2 or in O2 + 10 vol% H2O, and at 1100 oC in O2 (cf. Figures 11, 12, 13, and 15), it is evident that the samples preoxidized at 1100 oC resisted corrosion attack to a larger degree than those preoxidized at 900 oC. As was suggested in section 3.2.3, the stable bulk microstructure of the samples after the different heat treatments suggests that the difference in corrosion performance is related to the nature of the oxides obtained after the different preoxidation treatments. Specifically, the observed differences in thickness and composition of the oxides as a function of the preoxidation conditions are suggested as the main influence on the corrosion performance.
As shown in Figure 2, the type of preoxidation treatment resulted in different thickness of the oxide layers.The larger oxide thickness of samples preoxidized at 1100 oC exhibited resistance to corrosion because it physically prevented diffusion of the corrosive species through the oxide, compared to samples preoxidized at 900 oC. However, the thick oxide regions on samples preoxidized at 900 oC in O2 + 10 vol% H2O (Figure 4e) did not offer protection against corrosion, so this consideration may not fully explain the observed trend in corrosion attack. According to results in reference [13], the oxide composition as well as its compactness, is more important than the oxide thickness with respect to the resistance of pure metals (Fe, Cr and Ni) towards corrosion attack in Cl-containing environments. In line with this, the relatively low attack observed on samples preoxidized at 1100 oC may not solely relate to the thicker oxide, but may also originate from the observed difference in composition of this oxide, compared to the oxide obtained at 900 oC.
In literature, it is noted that the initiation steps of corrosion under biomass firing conditions involves direct reaction between the corrosive species and the material (or oxide) [7,55,56]. In this respect, the reaction between Cr2O3-rich oxides and KCl depletes an alloy of Cr and causes the formation of a less protective Cr-depleted oxide. Considering such reaction as a criteria for initialization of corrosion attack under the conditions investigated in this study, the severe corrosion attack suffered by samples
22

that were preoxidized at 900 oC (Figures 11-14) may result from reaction between KCl and Cr2O3 identified in these oxides (Figure 5). Subsequently, the less protective oxide may have allowed further ingress of corrosive species which propagated the corrosion attack. On the contrary, because the samples preoxidized at 1100 oC contained a very low amount of Cr in solid solution with α-Al2O3
(Figure 5c), they did not suffer severe corrosion attack. Indeed, microstructural investigations (Figures 15 and 16) show that the α-Al2O3 rich oxide was not attacked after the 1 week corrosion exposure. Thus both the increased thickness of this oxide and the very low content of Cr2O3 eliminated initiation sites for corrosion attack.
Considering also the direct reaction between KCl and different polymorphs of Al2O3, thermodynamic calculations with FactSage [49,50] show that both the thermodynamically stable α-Al2O3, and the metastable δ-Al2O3 polymorph will withstand corrosion attack due to the positive Gibbs free energy change (ΔG0) of their reactions with solid KCl at 560 oC (Table 3). However, according to data in literature [55], KCl is expected to have a vapour pressure of more than 10-6 atm at 560 oC, implying that gradual volatilization of the KCl deposits occurs. Interestingly, thermodynamic calculations in Table 3 suggest a slightly higher driving force (a negative ΔG0) for reaction between the metastable δ-polymorph of Al2O3 and the deposit when it is in the gas phase, in contrast to the reaction with stable α-Al2O3 (a positive ΔG0).
Table 3. Gibbs free energy changes for the reactions of different alumina polymorphs with KCl (s, g). Calculations were performed with FactSage [49,50].
Reaction
ΔG0 at 560 oC
(kJmol-1 HCl) [49,50]
α δ
12
Al2O3(s) + KCl(s) + 12
H2O ⇌ KAlO2(s) + HCl(g) 101.11 96.92
12
Al2O3(s) + KCl(g) + 12
H2O ⇌ KAlO2(s) + HCl(g) 4.15 -0.04
Thus, assuming that the initiation of corrosion attack was influenced by the thermodynamic favourability of reactions between KCl (g) and the preoxidized surfaces, the severe corrosion attack suffered by samples that were preoxidized at 900 oC (Figures 11-14), which contained the metastable δ-Al2O3 polymorph, corroborates the fact that the resistance of the oxide to corrosion attack is influenced by its composition.
In the event of breakdown of the preoxidized layer, it was not possible to form a new protective oxide layer during exposure (Figures 11-14) since the exposure temperature (560 oC) is too low to support protective Al2O3 formation. Therefore the corrosion process almost proceeds in a manner similar to the non-preoxidized samples such that the alloying elements are chlorinated and redeposited as porous
23

oxides. Moreover, as was observed for the non-preoxidized samples, the transport of S-species leading to sulphidation (Figures 11b and 12c) also becomes possible by virtue of the porous morphology of the corrosion products, as well as the low oxygen partial pressure induced by the presence of Cr- and Al-rich oxides close to the corrosion front [57]. Previous investigations [9–11,58] have also suggested that sulphidation of preoxidized samples only occurs if sulphur transport is facilitated by fissures or pores in the oxide. However, comparison of the corrosion products from such studies with the present results clearly suggests that the attack by Cl-containing species is more aggressive.
5. Conclusions
The phase composition and thickness of Al2O3 formed from preoxidation of Kanthal APM varies with temperature and preoxidation environment. At the lower preoxidation temperature of 900 ºC, a Cr-rich solid solution of Al-Cr-oxide was detected. Also, a metastable Al2O3, possibly δ-Al2O3, was identified in the oxides formed at this temperature. On the contrary, preoxidation at 1100 oC in O2 leads to formation of a layer consisting mainly of the thermodynamically stable α-Al2O3.
The corrosion attack on preoxidized Kanthal APM under conditions relevant to biomass firing is sensitive to the composition and thickness of the preoxidation layers. Thinner preoxidation layers formed in both O2 and O2 + 10 vol % H2O atmospheres at 900 oC containing a solid solution of Al with high amounts of Cr in the oxide as well as a metastable δ-Al2O3, suffer corrosion attack. Oxide layers formed at 1100 oC in O2, containing mainly α-Al2O3 are resistant to corrosion attack. In this regard, the preoxidation temperature, is more important than the preoxidation atmosphere with respect to corrosion resistance.
Corrosion attack does not occur on mechanically stable α-Al2O3 after 1 week exposure to conditions simulating biomass firing.
In the absence of a protective layer on Kanthal APM, the alloy suffers severe corrosion attack under biomass firing conditions. Protective Al-oxides cannot form under such conditions, instead porous, heterogeneous and non-protective corrosion products form due to volatile species involved in the corrosion attack.
Acknowledgements
This work is part of the Danish Strategic Research Centre, Power Generation from Renewable Energy (GREEN). The authors acknowledge funding from the Danish council for Strategic Research.
References
[1] F.J. Frandsen, Ash Formation, Deposition and Corrosion when Utilizing Straw for Heat and Power Production, Dr. Techn. Thesis, Department of Chemical and Biochemical Engineering, Technical Univeristy of Denmark. ISBN: 9788792481405, Kongens Lyngby, 2011.
[2] S.B. Hansen, P.A. Jensen, F.J. Frandsen, H. Wu, M.S. Bashir, J. Wadenbäck, B. Sander, P.
24

Glarborg, Deposit Probe Measurements in Large Biomass-Fired Grate Boilers and Pulverized-Fuel Boilers, Energy & Fuels. 28 (2014) 3539–3555.
[3] M. Montgomery, A. Karlsson, O.H. Larsen, Field test corrosion experiments in Denmark with biomass fuels. Part 1: Straw-firing, Mater. Corros. 53 (2002) 121–131.
[4] M. Montgomery, A. Karlsson, In-situ corrosion investigation at Masnedø CHP plant - a straw-fired power plant, Mater. Corros. 50 (1999) 579–584.
[5] J. Pettersson, H. Asteman, J.-E. Svensson, L.-G. Johansson, KCl Induced Corrosion of a 304-type Austenitic Stainless Steel at 600°C; The Role of Potassium, Oxid. Met. 64 (2005) 23–41.
[6] H.P. Nielsen, F.J. Frandsen, K. Dam-Johansen, Lab-Scale Investigations of High-Temperature Corrosion Phenomena in Straw-Fired Boilers, Energy & Fuels. 13 (1999) 1114–1121.
[7] R.A. Antunes, M.C.L. de Oliveira, Corrosion in biomass combustion: A materials selection analysis and its interaction with corrosion mechanisms and mitigation strategies, Corros. Sci. 76 (2013) 6–26.
[8] H.J. Grabke, E. Reese, M. Spiegel, The effects of chlorides, hydrogen chloride, and sulfur dioxide in the oxidation of steels below deposits, Corros. Sci. 37 (1995) 1023–1043.
[9] S. Sheybany, D.L. Douglass, The effect of preoxidation of some Ni, Fe, and Co-Base alloys on subsequent sulfidation at 982 oC in sulfur vapor, Oxid. Met. 30 (1988) 433–463.
[10] M.F. Pillis, L.V. Ramanathan, Effect of pre-oxidation on high temperature sulfidation behavior of FeCr and FeCrAl alloys, Mater. Res. 7 (2004) 97–102.
[11] F.H. Stott, M.F. Chong, The transport of sulphur through preformed Al2O3 scales on iron-base alloys in environments of high sulphur and low oxygen activities pertinent to coal conversion processes at high temperature, Solid State Ionics. 12 (1984) 493–503.
[12] M.F. Stroosnijder, V. Guttmann, H. Buscail, J.H.W. de Wit, The effect of pre-oxidation and the influence of deformation on the corrosion behaviour of two heat resistant steels in a sulphur-oxygen-carbon bearing environment, Corros. Sci. 36 (1994) 207–219.
[13] H. Asteman, M. Spiegel, Investigation of the HCl (g) attack on pre-oxidized pure Fe, Cr, Ni and commercial 304 steel at 400°C, Corros. Sci. 49 (2007) 3626–3637.
[14] P. Viklund, R. Pettersson, HCl-Induced High Temperature Corrosion of Stainless Steels in Thermal Cycling Conditions and the Effect of Preoxidation, Oxid. Met. 76 (2010) 111–126.
[15] J. Lehmusto, P. Yrjas, M. Hupa, The Effect of Pretreatment on the Corrosion Resistance of Superheater Materials, Solid State Phenom. 227 (2015) 309–312.
[16] N. Israelsson, J. Engkvist, K. Hellström, M. Halvarsson, J.-E. Svensson, L.-G. Johansson, KCl-Induced Corrosion of an FeCrAl Alloy at 600 °C in O2 + H2O Environment: The Effect of Pre-oxidation, Oxid. Met. 83 (2015) 29–53.
[17] K. Hellström, J. Hall, P. Malmberg, Y. Cao, M. Norell, J.-E. Svensson, Mitigation of Fireside
25

Corrosion in Power Plants: The Combined Effect of Sulfur Dioxide and Potassium Chloride on the Corrosion of a FeCrAl Alloy, Energy & Fuels. 28 (2014) 6116–6129.
[18] S. Kiamehr, K. V Dahl, T.N. Lomholt, T.L. Christiansen, M.A.J. Somers, High Temperature Corrosion due to Biomass Firing : A Study on the Reactivity between Potassium Chloride and Oxides, in: Int. Symp. High-Temperature Oxid. Corros., The Iron and Steel Institute of Japan, Hokkaido, 2014: pp. 144–147.
[19] H. Götlind, F. Liu, J.-E. Svensson, M. Halvarsson, L.-G. Johansson, The Effect of Water Vapor on the Initial Stages of Oxidation of the FeCrAl Alloy Kanthal AF at 900 °C, Oxid. Met. 67 (2007) 251–266.
[20] H. Josefsson, F. Liu, J.-E. Svensson, M. Halvarsson, L.-G. Johansson, Oxidation of FeCrAl alloys at 500-900°C in dry O2, Mater. Corros. 56 (2005) 801–805.
[21] J. Engkvist, S. Canovic, K. Hellström, A. Järdnäs, J.-E. Svensson, L.-G. Johansson, M. Olsson, M. Halvarsson, Alumina Scale Formation on a Powder Metallurgical FeCrAl Alloy (Kanthal APMT) at 900–1,100 °C in Dry O2 and in O2 + H2O, Oxid. Met. 73 (2010) 233–253.
[22] H.J. Grabke, M.W. Brumm, B. Wagemann, The Oxidation of NiAl, Mater. Corros. Und Korrosion. 47 (1996) 675–677.
[23] R. Janakiraman, G.H. Meier, F.S. Pettit, The effect of water vapor on the oxidation of alloys that develop alumina scales for protection, Metall. Mater. Trans. A. 30 (1999) 2905–2913.
[24] F.H. Stott, G.C. Wood, J. Stringer, The influence of alloying elements on the development and maintenance of protective scales, Oxid. Met. 44 (1995) 113–145.
[25] D.J. Young, Effects of Water Vapour on Oxidation, in: Corros. Ser., Elsevier, 2008: pp. 455–495.
[26] T. Dudziak, M. Łukaszewicz, N. Simms, J.R. Nicholls, Steam oxidation of TP347HFG, super 304H and HR3C – analysis of significance of steam flowrate and specimen surface finish, Corros. Eng. Sci. Technol. 50 (2015) 272–282.
[27] S.C. Okoro, M. Montgomery, F.J. Frandsen, K. Pantleon, Effect of Water Vapor on High-Temperature Corrosion under Conditions Mimicking Biomass Firing, Energy & Fuels. 29 (2015) 5802–5815.
[28] S.C. Okoro, M. Montgomery, F.J. Frandsen, K. Pantleon, High Temperature Corrosion under Laboratory Conditions Simulating Biomass-Firing: A Comprehensive Characterization of Corrosion Products, Energy & Fuels. 28 (2014) 6447–6458.
[29] M. Ristić, S. Popović, S. Musić, Structural properties of the system Al2O3-Cr2O3, Mater. Lett. 16 (1993) 309–312.
[30] J. Graham, Lattice spacings and colour in the system alumina-chromic oxide, J. Phys. Chem. Solids. 17 (1960) 18–25.
[31] F. Bondioli, A.M. Ferrari, C. Leonelli, T. Manfredini, L. Linati, P. Mustarelli, Reaction Mechanism in Alumina/Chromia (Al2O3-Cr2O3) Solid Solutions Obtained by
26
Coprecipitation, J. Am. Ceram. Soc. 83 (2004) 2036–2040.
[32] I. Levin, D. Brandon, Metastable Alumina Polymorphs: Crystal Structures and Transition Sequences, J. Am. Ceram. Soc. 81 (2005) 1995–2012.
[33] J. Engkvist, U. Bexell, M. Grehk, M. Olsson, High temperature oxidation of FeCrAl-alloys - influence of Al-concentration on oxide layer characteristics, Mater. Corros. 60 (2009) 876–881.
[34] H. Buscail, S. Heinze, P. Dufour, J.P. Larpin, Water-vapor-effect on the oxidation of Fe-21.5 wt.%Cr-5.6 wt.%Al at 1000°C, Oxid. Met. 47 (1997) 445–464.
[35] H.E. Kadiri, R. Molins, Y. Bienvenu, M.F. Horstemeyer, Abnormal High Growth Rates of Metastable Aluminas on FeCrAl Alloys, Oxid. Met. 64 (2005) 63–97.
[36] W.J. Quadakkers, D. Naumenko, E. Wessel, V. Kochubey, Growth Rates of Alumina Scales on Fe – Cr – Al Alloys, Oxid. Met. 61 (2004) 17–37.
[37] S. Canovic, J. Engkvist, F. Liu, H. Lai, H. Götlind, K. Hellström, J.-E. Svensson, L.-G. Johansson, M. Olsson, M. Halvarsson, Microstructural Investigation of the Initial Oxidation of the FeCrAlRE Alloy Kanthal AF in Dry and Wet O2 at 600 and 800°C, J. Electrochem. Soc. 157 (2010) C223.
[38] K. Hellström, N. Israelsson, M. Halvarsson, S. Canovic, J.-E. Svensson, L.-G. Johansson, The Oxide Scales Formed on a Dispersion-Strengthened Powder Metallurgical FeCrAl Alloy at 900 °C in O2 and in O2 + H2O, Oxid. Met. 84 (2015) 1–19.
[39] K. Hellström, N. Israelsson, N. Mortazavi, S. Canovic, M. Halvarsson, J.-E. Svensson, L.-G. Johansson, Oxidation of a Dispersion-Strengthened Powder Metallurgical FeCrAl Alloy in the Presence of O2 at 1,100 °C: The Influence of Water Vapour, Oxid. Met. 83 (2015) 533–558.
[40] F. Liu, H. Götlind, J.-E. Svensson, L.-G. Johansson, M. Halvarsson, Early stages of the oxidation of a FeCrAlRE alloy (Kanthal AF) at 900°C: A detailed microstructural investigation, Corros. Sci. 50 (2008) 2272–2281.
[41] M.W. Brumm, H.J. Grabke, The oxidation behaviour of NiAl-I. Phase transformations in the alumina scale during oxidation of NiAl and NiAl-Cr alloys, Corros. Sci. 33 (1992) 1677–1690.
[42] M. Fujita, K. Inukai, S. Sakida, T. Nanba, J. Ommyoji, A. Yamaguchi, Y. Miura, Sintering of Al2O3-Cr2O3 Powder Prepared by Sol-Gel Process, J. Soc. Mater. Sci. Japan. 56 (2007) 526–530.
[43] S. Chevalier, A. Galerie, O. Heintz, R. Chassagnon, A. Crisci, Thermal Alumina Scales on FeCrAl: Characterization and Growth Mechanism, Mater. Sci. Forum. 595-598 (2008) 915–922.
[44] R. Chegroune, E. Salhi, A. Crisci, Y. Wouters, A. Galerie, On the Competitive Growth of Alpha and Transient Aluminas During the First Stages of Thermal Oxidation of FeCrAl Alloys at Intermediate Temperatures, Oxid. Met. 70 (2008) 331–337.
27

[45] E.J. Opila, N.S. Jacobson, D.L. Myers, E.H. Copland, Predicting oxide stability in high-temperature water vapor, JOM. 58 (2006) 22–28.
[46] C.S. Tedmon, The Effect of Oxide Volatilization on the Oxidation Kinetics of Cr and Fe-Cr Alloys, J. Electrochem. Soc. 113 (1966) 766.
[47] L.W. Sengeløv, T.B. Hansen, C. Bartolome, H. Wu, K.H. Pedersen, F.J. Frandsen, A.D. Jensen, P. Glarborg, Sulfation of Condensed Potassium Chloride by SO 2, Energy & Fuels. 27 (2013) 3283–3289.
[48] S.C. Van Lith, F.J. Frandsen, M. Montgomery, T. Vilhelmsen, S.A. Jensen, Lab-scale Investigation of Deposit-induced Chlorine Corrosion of Superheater Materials under Simulated Biomass-firing Conditions. Part 1: Exposure at 560 °C, Energy & Fuels. 59 (2009) 3457–3468.
[49] What’s New in FactSage 7.0, (2015). http://www.crct.polymtl.ca/fact/facthelp/FS70New.htm (accessed June 2, 2016).
[50] C.W. Bale, E. Bélisle, P. Chartrand, S.A. Decterov, G. Eriksson, K. Hack, I.-H. Jung, Y.-B. Kang, J. Melançon, A.D. Pelton, C. Robelin, S. Petersen, FactSage thermochemical software and databases — recent developments, Calphad. 33 (2009) 295–311.
[51] A. Zahs, M. Spiegel, H. Grabke, The influence of alloying elements on the chlorine-induced high temperature corrosion of Fe-Cr alloys in oxidizing atmospheres, Mater. Corros. 50 (1999) 561–578.
[52] R. Bender, M. Schütze, The role of alloying elements in commercial alloys for corrosion resistance in oxidizing-chloridizing atmospheres part I: Literature evaluation and thermodynamic calculations on phase stabilities, Mater. Corros. 54 (2003) 567–586.
[53] H.J. Grabke, M. Spiegel, A. Zahs, Role of alloying elements and carbides in the chlorine-induced corrosion of steels and alloys, Mater. Res. 7 (2004) 89–95.
[54] M.A. Uusitalo, R. Backman, L.-M. Berger, P.M.J. Vuoristo, T.A. Mäntylä, Oxidation resistance of carbides in chlorine-containing atmospheres, High Temp. Mater. Process. 21 (2002) 307–320.
[55] J. Pettersson, N. Folkeson, L.-G. Johansson, J.-E. Svensson, The Effects of KCl, K2SO4 and K2CO3 on the High Temperature Corrosion of a 304-Type Austenitic Stainless Steel, Oxid. Met. 76 (2011) 93–109.
[56] J. Sui, J. Lehmusto, M. Bergelin, M. Hupa, The Effects of KCl, NaCl and K2CO3 on the High-Temperature Oxidation Onset of Sanicro 28 Steel, Oxid. Met. 85 (2016) 565–598.
[57] T. Gheno, B. Gleeson, On the Hot Corrosion of Nickel at 700 °C, Oxid. Met. 84 (2015) 567–584.
[58] P.S. Sidky, M.G. Hocking, The effect of pre-oxidation and thermal cycling on the corrosion behaviour of Fe-Cr-Al-based alloys in a coal gasifier atmosphere, Corros. Sci. 29 (1989) 735–765.
28