influence of polymer swelling and dissolution into food...
TRANSCRIPT
Influence of polymer swelling and dissolution into food simulants on therelease of graphene nanoplates and carbon nanotubes from poly(lactic)acid and polypropylene composite films
HristianaAQ17 Velichkova, Ivanka Petrova, Stanislav Kotsilkov, Evgeni Ivanov, Nikolay K. Vitanov,Rumiana KotsilkovaInstitute of Mechanics, Bulgarian Academy of Sciences, Acad. G. Bonchev Street, Block 4, Sofia, BulgariaCorrespondence to: R. Kotsilkova (E - mail: [email protected])
ABSTRACT: The study compared the effects of swelling and dissolution of a matrix polymer by food simulants on the release of gra-
phene nanoplates (GNPs) and multiwall carbon nanotubes (MWCNTs) from poly(lactic) acid (PLA) and polypropylene (PP) com-
posite films. The total migration was determined gravimetrically in the ethanol and acetic acid food simulants at different time and
temperature conditions, while migrants were detected by laser diffraction analysis and transmission electron microscopy. Swelling,
thermal analysis, and scanning electron microscopy were applied to characterize the degradation of polymer films at the migration
conditions. The release of nanoparticles was found in a high-temperature migration test of 4 h at 90 8C. The hydrolytic dissolution of
the PLA polymer in the food simulants caused a migration of GNPs (>100 nm) from the PLA/GNP/MWCNT films into the simulant
solvents, while the entangled MWCNTs formed a network on the film surface, preventing their migration from the PLA composite
films. In contrast, the PP polymer slightly swells in ethanol solvents, allowing some short carbon nanotubes to be released from the
surface and cut edges of the PP/MWCNT film into food simulants. Mathematical modeling of diffusion was applied that accounts for
type of polymer, time–temperature conditions, and solvent concentration; model parameters were validated with experimental results.
VC 2017 Wiley Periodicals, Inc. J. Appl. Polym. Sci. 2017, 134, 45469.
KEYWORDS: biodegradable; degradation; packaging; swelling
Received 31 March 2017; accepted 27 June 2017DOI: 10.1002/app.45469
INTRODUCTION
Researchers in food packaging technology are actively exploring
the potential of polymer nanotechnology in order to answer the
increased requirements for packaging materials to be stronger
but lightweight, have certain functional properties, and increase
the shelf life of the food.1,2 Incorporation of multiwall carbon
nanotubes (MWCNTs) and graphene nanoplates (GNPs) in pol-
y(lactic) acid (PLA) and polypropylene (PP) is a promising
approach for food packaging applications, leading to several
benefits, such as improved mechanical, thermal, and barrier
properties of the polymeric films.2–5 It was recently found that
carbon nanotubes and graphene have unique antimicrobial
properties at direct contact with bacteria, due to electrostatic
repulsion and oxidative stress.6 Such properties make graphene
and carbon nanotubes attractive nanofillers for active, rein-
forced, and smart packaging materials in food applications.
Despite the many advantages of nanotechnology, there were
serious uncertainties in the use of graphene and carbon
nanotube-based composites as materials in contact with food
that were related to consumer exposure to those nanoparticles
through migration into food and drink. Both graphene nano-
plates and carbon nanotubes fall under the definition of nano-
material according to (EU) No. 696/2011.7 The migration of
substances into foodstuff is an important aspect of food packag-
ing. Migration is a complex diffusion process from a theoretical
point of view and is influenced by the concentration gradient of
the additive, its solubility, the nature of the food simulant, tem-
perature, and contact time.8 Some theoretical studies reported
that nanoparticles larger than 3–4 nm in diameter cannot
migrate (following a Fickian law of diffusion) from commodity
plastics films, when fully incorporated in plastic film.9–11 It is
generally believed that because of the fixed or embedded nature
of nanoparticles in polymer, they will not migrate from film
into food and thus not pose a risk to the consumer.12
The chemical stability of the matrix polymers in food simulant
solvents is an important characteristic that has to be taken into
account when analyzing the migration. The dissolution or deg-
radation of the matrix polymer in the food simulant solvents
VC 2017 Wiley Periodicals, Inc.
WWW.MATERIALSVIEWS.COM J. APPL. POLYM. SCI. , DOI: 10.1002/APP.4546945469 (1 of 12)
J_ID: z8e Customer A_ID: APP45469 Cadmus Art: APP45469 Ed. Ref. No.: 20170926 Date: 7-July-17 Stage: Page: 1
ID: vedhanarayanan.m Time: 20:08 I Path: //chenas03/Cenpro/ApplicationFiles/Journals/Wiley/APP#/Vol00000/170623/Comp/APPFile/JW-APP#170623

may assist the release of nanoparticles from the nanocomposite
film into the surrounding media. Duncan et al.13 considered
two routes for the release of nanoparticles from polymer films:
via passive diffusion, desorption, and dissolution from the sur-
face of the film into the liquid media; and via matrix degrada-
tion.14 Schmidt et al.15 found that asymmetric clay platelets of
lateral size 50–800 nm indeed migrate from PLA composite film
into food simulant (95% ethanol) due to matrix degradation.
These authors observed the PLA polymer degradation by the
shift of the molecular mass distribution of the polymer before
and after migration contact.
The polymers of choice in this study are the biodegradable pol-
y(lactic) acid (PLA) polymer produced from natural sources
and the polypropylene (PP) that is an oil-based polymer; both
are widely used for food packaging applications. Researchers
have reported16–19 that ethanol and other polar solvents are
aggressive to PLA polymer due to hydrolysis, leading to the
release of lactic acid monomers, dimers, and oligomers. The
PLA degradation products are subsequently hydrolyzed in aque-
ous systems to lactic acid, which is a natural product and food
ingredient. In contrast, polypropylene is more resistant to
organic chemicals than are most other commercially available
thermoplastics.20 In some studies, the swelling process was
found to be dominant for polypropylene in the ethanol-based
solvents.21 To our knowledge, no attempt has been made to
characterize materials migrated from PLA and PP composite
films incorporating graphene nanoplates and carbon nanotubes
into food simulants. Moreover, it has not yet been explored in
depth if the partial degradation of the matrix polymer by the
food simulant solvents may cause a release of graphene nano-
plates and carbon nanotubes from the plastic films.
The main objective of the present work is to report experimen-
tal data for overall migration from the composite PLA and PP
films, incorporating 2 wt % carbon nanofillers (graphene nano-
plates and carbon nanotubes), as well as to detect migration of
GNPs and MWCNTs. The effect of high-temperature migration
conditions on polymer degradation and the enhanced molecular
mobility on overall migration are discussed. Neither graphene
nanoplates nor carbon nanotubes are found in the list of mate-
rials explicitly authorized and included in the European Plastics
Regulation specifications.22–24 The possible migration of gra-
phene nanoplates and carbon nanotubes into food is of great
concern because of their toxicity and similarity to asbestos, so
they may cause adverse health and environmental effects.25,26
Therefore it is important to characterize migrants from nano-
composite films containing graphene and carbon nanotubes into
different food simulants while varying the time–temperature
migration conditions. Here the migrants in the food simulants
were detected by laser diffraction analysis and high-resolution
transmission electron microscopy. The degradation of the poly-
mer before and after migration tests was investigated by swelling
tests, thermal analysis, and scanning electron microscopy. Migra-
tion modeling was applied to predict the diffusion coefficient
and concentration of migrants released from nanocomposite
films depending on the matrix polymer, temperature, and solvent
concentration.
EXPERIMENTAL
Materials
A thermoplastic masterbatch of graphene/poly(lactic) acid poly-
mer containing 8 wt % graphene nanoplates and short multi-
wall carbon nanotubes (GRAPH-PLA) was supplied by
Graphene 3D Lab. AQ1The PLA4043D Ingeo Biopolymer, supplied
by NatureWorks, AQ2is synthesized from a family of lactic mono-
mers with different molecular weights: L-100, L-300, L-800, and
M-3000. The average molecular weight of the final PLA polymer
is around MW � 160,000 DA. The residual lactide from the
PLA pallets is reported to be <0.3% in total, where the residual
D,L-lactide is< 0.13% and the meso-lactide is< 0.19%. Isotactic
polypropylene (PP), Buplen 6231 (from Lukoil, Bulgaria AQ3), and
the commercial masterbatch Plasticyl PP2001 (from Nanocyl
S.A., Belgium AQ4) containing 20% multiwall carbon nanotubes
were used in this study.
Preparation of Nanocomposites and Films
The masterbatch of poly(lactic) acid nanocomposites with
GNPs and MWCNTs was diluted with the neat PLA for produc-
tion of the 2 wt % nanocomposites. Melt mixing in the temper-
ature range 170–180 8C was applied. The 2 wt % MWCNT
nanocomposite in polypropylene was prepared by dilution of
the 20% PP/MWCNT masterbatch with neat PP in the tempera-
ture range 180–200 8C. Both nanocomposites were processed
with a double-screw extruder at the screw speed of 45 rpm and
then pelletized.
Films with thickness of �30 lm were fabricated by hot pressing
of pellets at 190 8C. The nanocomposite films were named the
PLA/GNP/MWCNT film and PP/MWCNT film, respectively.
The neat PLA and neat PP films were prepared as control sam-
ples using the same pressing procedure as for the composite
films. Test samples were cut from the films and subjected to fur-
ther studies.
Swelling and Dissolution
The swelling behavior of the PLA-based and PP-based neat and
composite films was investigated in three food simulants. Disk
samples with diameter 3 cm and thickness 30 lm were used for
the swelling tests. The degree of swelling of the disk samples
was determined gravimetrically by weighing the sample before
the migration test, as well as the swollen sample after storage at
the migration conditions studied. The excess dissolution
medium was blotted out with tissue paper, and the samples
were weighed in a high-precision analytical balance (60.01 mg).
The disks were then dried to a constant weight in an oven at
37 8C. Each determination at each time point was performed in
triplicate, and the standard deviation was calculated. The extent
of swelling and dissolution occurring was considered. The
degree of swelling (S, %) was calculated by the relative change
of mass of the disk using eq. (1), similar to Kavanagh and
Corrigan27:
S5Ww2Wo
Wo
3100% (1)
where Ww is the wet weight of the disk at a time t, and Wo is
the initial weight of the disk.
J_ID: z8e Customer A_ID: APP45469 Cadmus Art: APP45469 Ed. Ref. No.: 20170926 Date: 7-July-17 Stage: Page: 2
ID: vedhanarayanan.m Time: 20:08 I Path: //chenas03/Cenpro/ApplicationFiles/Journals/Wiley/APP#/Vol00000/170623/Comp/APPFile/JW-APP#170623
ARTICLE WILEYONLINELIBRARY.COM/APP
WWW.MATERIALSVIEWS.COM J. APPL. POLYM. SCI. , DOI: 10.1002/APP.4546945469 (2 of 12)
The maximum measured degree of dissolution (D, %) occurring
over the duration of the experiment was calculated for all com-
positions using eq. (2), by subtracting the dry weight of the
disk from its wet weight and dividing this value by the dry
weight at that time point27:
D5Ww2Wd
Wd
3100% (2)
where Ww is the wet weight of the disk at a time t, and Wd is
the dry weight of the disk at the same time.
Migration Test
The testing conditions for evaluation of overall migration were
taken from European Standard EN-1186-2002 with some modi-
fications.22 Disk samples with diameter 3 cm, thickness 30 lm,
and total surface area of 14 cm2 were fully immersed in 30 mL
of food simulant, and both sides were exposed to migration.
Three aqueous food simulants were selected: 10% (v/v) ethanol
(simulant A), 3% (v/v) acetic acid (simulant B), and 50% (v/v)
ethanol (simulant D1), representing aqueous, acidic, and fatty
foods, respectively.23 The migration test was performed at two
time–temperature conditions: 10 days at 40 8C (standard test),
according to regulation EU 10/2011,24 and 4 h at 90 8C (high-
temperature test), aiming to mimic the migration of com-
pounds from packaging films during microwaving, conventional
heat treatment, and storage.19
Analysis of Total Migration
The overall migration from the polymeric films (mass of
migrant per cm2) in the three food simulants at two migration
conditions (10 days at 40 8C and 4 h at 90 8C) was determined
gravimetrically, using a modified standard procedure EN-1186-
2002 for migration testing, proposed by Schmidt et al.15 After
the contact time, the films were removed, and the simulant sol-
vents were totally evaporated and dried in an oven at 105 8C for
30 min. The mass of the residue was determined with an analyt-
ical balance (60.01 mg accuracy) to determine the overall
migration value of the simulant, as an average of three determi-
nations (6 standard deviation). A simulant blank was also mea-
sured. No volatile products in the total migrants are expected
from the neat and the nanocomposite PLA and PP films that
may be lost during the repeated heating, drying, and weighing
cycle of the migration test method. This increases the reliability
of the test method.
Laser Diffraction Analysis
The migrated simulant solvents were subjected to laser diffrac-
tion analysis to detect nanoscale migrants. The Analysette 22
Nano Tec plus (FritschAQ5 ) with a wet dispersion unit was used,
having a detection limit of 0.020–2000 lm. A test sample of
10 mL of simulant solvent was added to 100 mL of distilled
water and gently stirred during the test. The device allows the
evaluation of the particle size distribution together with recog-
nition of the particle shape in a single process. The result of
the measurement was the average elongation calculated from
the axis relation of an ellipsoid approximating the particles. The
software provides a transformation of the equivalent volume-
based data to number percentages. In our study, the measure-
ments were performed within the range from 0.1 lm to 100 lm.
The simulant blank solutions were also studied, and all total
migration values are corrected for the blank value. The data for
the particle size distribution are presented as histograms of par-
ticle number percentage (n%) versus particle size (lm).
Transmission Electron Microscopy
A high-resolution transmission electron microscope (TEM) AQ6at
accelerating voltage 200 kV was used to analyze the dried col-
loids of migrated substances in the food simulants. A prelimi-
nary preparation technique for test samples was applied. A
microquantity of colloid was dropped on a standard copper
TEM grid covered by a membrane of amorphous carbon and
was dried after that in a dust-free atmosphere at ambient condi-
tions. TEM analysis was also applied to characterize the nanofil-
ler dispersion in the composite films. Thin slides of about
80 nm from a cross section of the films were cut from the films
and subjected to TEM visualization.
Scanning Electron Microscopy
Scanning electron microscopy (SEM) was used to visualize the
morphology of the film surface before and after migration tests
by using a digital Philips 515 microscope AQ7with accelerating vol-
tages 25 kV and 5 kV. Before the examination in the microscope,
the samples were covered with a metal coating for better con-
ductivity of the surface and to avoid discharge effects.
Thermal Analysis
A differential scanning calorimeter (DSC; Q20, TA Instruments AQ8)
in nitrogen atmosphere was used to perform calorimetric analy-
sis of the nanocomposite films before and after the migration
tests. All test samples were accurately weighed into 100 ll
aluminum pans to within 8.50 mg. The test was started by hold-
ing the samples at 30 8C for 5 min and then raising the tempera-
ture to 200 8C at 10 8C/min under nitrogen atmosphere. The
samples were isothermally heated at 200 8C for 3 min and subse-
quently cooled back to 30 8C at 210 8C/min and held at that
temperature for 3 min before heating again at 10 8C/min to
200 8C. The DSC characteristics were taken from the first and
second heating cycles in order to see the influence of sample
history. The glass-transition temperature (Tg), the crystallization
temperature (Tc), and the melting temperature (Tm) were deter-
mined. The crystallinity (vc %) of the PLA polymer in the compos-
ite films before and after the migration tests was calculated from
the DSC results by using the relation vc5ðDHm=DH�mÞ3100%,
where DHm is the melting enthalpy of PLA in the composite film,
and DH�m is the melting enthalpy of pure crystalline PLA, having a
value of 135 J/g, as suggested by Mitaya and Masuko.28
RESULTS AND DISCUSSION
Characterization of Nanofiller Dispersion in Composite Films
TEM and SEM images of cross sections of the films are shown
in Figure F11(a–c), visualizing the degree of dispersion of nano-
particles in PLA- and PP-based nanocomposite films. The TEM
micrograph in Figure 1(a) for the composite PLA/GNP/
MWCNT film shows a mixed nanofiller of graphene nanoplates
with lateral sizes of nano- to microscale, as well as some short
carbon nanotubes with length of 2500 nm, dispersed in
between the graphene nanoplates. In Figure 1(b), the TEM
micrograph of the composite PP/MWCNT film visualizes car-
bon nanotubes dispersed in smaller and larger agglomerates
J_ID: z8e Customer A_ID: APP45469 Cadmus Art: APP45469 Ed. Ref. No.: 20170926 Date: 7-July-17 Stage: Page: 3
ID: vedhanarayanan.m Time: 20:08 I Path: //chenas03/Cenpro/ApplicationFiles/Journals/Wiley/APP#/Vol00000/170623/Comp/APPFile/JW-APP#170623
ARTICLE WILEYONLINELIBRARY.COM/APP
WWW.MATERIALSVIEWS.COM J. APPL. POLYM. SCI. , DOI: 10.1002/APP.4546945469 (3 of 12)

that form an entangled network in the PP matrix. As seen from
the TEM analysis at magnification 310,000, the degree of nano-
filler dispersion at the nanoscale was not perfectly homoge-
neous, but it consists of large and small agglomerates contacting
each other. In contrast, at the microscale, the nanoparticles look
to be homogeneously dispersed in the polymer, as shown in
Figure 1(c) presenting the SEM micrograph of the cross section
of PLA/GNP/MWCNT film at magnification 31000. Such a
hierarchical structure of nanofiller in the polymer matrix is typ-
ical for polymer nanocomposites prepared by a top-down
approach.
Migration Study
Total Migration. The total migration (mass of migrant per
cm2) was determined gravimetrically by drying the three food
simulant solvents after the migration tests and weighing the res-
idue. The results are summarized in TableT1 I. Total migration
was found for the neat PLA film and the composite PLA/GNP/
MWCNT film after high-temperature migration conditions for
4 h at 90 8C. Meanwhile, migration was not detected for the
neat PP and the composite PP/MWCNT films at these high-
temperature migration conditions, with the detection limit of
60.01 mg (accuracy of the analytical balance). We observed that
the presence of carbon nanofiller in the PLA composite film
increases the total migration (Mt) by 0.006–0.011 mg/cm2, if
compared to the migration of the neat PLA films in the respec-
tive simulant solvent, which is assumed to be the approximate
amount of nanofiller migrant (MNP). The highest total migra-
tion (Mt 5 0.052 mg/cm2) that was observed for the composite
PLA/GNP/MWCNT film in the acetic acid food simulant is two
times lower than the migration limit for overall migration
(10 mg/dm2) for food contact materials.22,24
Swelling and Dissolution. The swelling of the neat PLA and PP
films, as well as their composites PLA/GNP/MWCNT and
PP/MWCNT, respectively, was estimated gravimetrically by
weighing the film before and after storage in the food simulant
solvents at two migration conditions. Swelling of the films was
not observed during the standard migration test at 40 8C for 10
days at the detection limit of 60.01 mg. Meanwhile, at the
high-temperature migration conditions of 90 8C for 4 h, a disso-
lution effect (decrease of mass, D%) was found for the
PLA-based films. The results are summarized in Table I. The
dissolution of the PLA films in the food simulants might be
indicative of partial hydrolytic degradation.19 Importantly, the
nanocomposite PLA/GNP/MWCNT film showed a higher per-
centage of dissolution than that of the neat PLA film, due prob-
ably to the release of nanoparticle migrants. We assumed that
the partial dissolution of the PLA polymer at the test conditions
assisted the release of nanoparticles from the nanocomposite
film into the simulant solvent. The nanoparticle migration was
calculated by subtracting the value of neat PLA migrant from
the value of the nanocomposite migrant. Thus, the approximate
amount of nanoparticle migrant was 0.006–0.011 mg/cm2
(Table I). If expressed in percentage, the released nanoparticles
were about 0.14–0.25% from the incorporated amount of nano-
particles in the film.
In contrast, the neat PP polymer film was chemically stable in
the three food simulant solvents at the high-temperature migra-
tion conditions. A slight swelling was observed only for the
Figure 1. TEM and SEM analysis of the cross sections of composite films: (a,b) TEM micrographs of PLA/GNP/MWCNT and PP/MWCNT films, respec-
tively, in magnification 310,000; and (c) SEM micrograph of the PLA/GNP/MWCNT film, in magnification 31000.
J_ID: z8e Customer A_ID: APP45469 Cadmus Art: APP45469 Ed. Ref. No.: 20170926 Date: 7-July-17 Stage: Page: 4
ID: vedhanarayanan.m Time: 20:08 I Path: //chenas03/Cenpro/ApplicationFiles/Journals/Wiley/APP#/Vol00000/170623/Comp/APPFile/JW-APP#170623
ARTICLE WILEYONLINELIBRARY.COM/APP
WWW.MATERIALSVIEWS.COM J. APPL. POLYM. SCI. , DOI: 10.1002/APP.4546945469 (4 of 12)

nanocomposite PP/MWCNT films in 10% ethanol (S 5 0.18%)
and 50% ethanol (S 5 0.30%) simulant solvents. Our results con-
firmed the Barson et al.21 reporting for swelling of PP into etha-
nol aqueous solvents of moderate concentrations.
Detection of Migrants in Simulant Solvents
Migrants from PLA-Based Films. Laser diffraction analysis was
used to characterize the size distribution of the total migrants
in the food simulant solvents. This instrumentation alone did
not provide any information on the identity of nanoparticles
and organic migrants occurring in the food simulant. To over-
come this limitation, the laser diffraction analysis of the liquid
solvents was combined with TEM analysis of the dried solvents.
Importantly, migrants were not detected in the food simulants
by TEM and laser diffraction analysis after the standard migra-
tion test of 10 days at 40 8C. Meanwhile, total migration was
found after high-temperature migration tests for 4 h at 90 8C,
particularly for the PLA-based films.
FigureF2 2(a–d) presents TEM micrographs of the total migrants
detected in the dried food simulants, for the composite PLA/
GNP/MWCNT film in the three food simulants: (a) 10% etha-
nol, (b) 50% ethanol, and (c,d) 3% acetic acid. In the insets,
the size distribution histograms of migrants are compared for
the neat PLA (dark bars) and the composite PLA/GNP/
MWCNT films (light bars) in the three food simulant solvents.
The TEM micrographs in Figure 2(a–c) show that few layer gra-
phene nanoplates of size around 100–1000AQ9 were able to migrate
from the PLA/GNP/MWCNT in the three food simulants.
AQ10 Meanwhile, carbon nanotubes fixed with organic substances
were rarely detected to migrate in large agglomerates (>2 lm);
this was observed mainly in the 3% acetic acid food simulant,
which was more aggressive for the PLA polymer [Figure 2(d)].
The results from the laser diffraction analysis [insets in Figure
2(a–c)] demonstrate differences between the neat PLA film and
the composite PLA/GNP/MWCNT film with respect to the par-
ticle size distribution of migrants in the corresponding solvents.
The PLA histograms (dark bars) show a bimodal size distribu-
tion with a small peak within the micrometer size range of
1–10 lm (0.3–1 n%) and the main peak above 10 lm (9–12
n%). The migrants obtained from the neat PLA film refer to
the low-molecular-weight organic substances dissolved from the
PLA matrix due to hydrolysis of the polymer chains.19 The his-
togram for the composite PLA/GNP/MWCNT film (light bars)
shows the presence of migrants in nanoform (0.1–1 lm) that
appeared in small amounts, �0.2 n%, in 50% ethanol and 3%
acetic acid solvents. Such migrants were not found from the
neat PLA film in the respective food simulants. Thus, the nano-
scale migrants from the composite PLA/GNP/MWCNT films
are associated with the released graphene nanoplates visible in
the TEM micrographs. Moreover, the peak within 1–10 lm was
much higher for the composite PLA/GNP/MWCNT film (1–4
n%) compared to the neat PLA (0.3–1 n%). The organic sub-
stances that migrated from the PLA polymer are detectable by
the laser diffraction analysis, but due to their transparency they
were not visible in the TEM micrographs.
Based on these results, we assume that the release of GNPs
from the composite PLA/GNP/MWCNT film was caused by the
partial polymer dissolution (hydrolysis) of PLA polymer in
aqueous food simulants at the high-temperature migration con-
ditions, mainly in 3% acetic acid and 50% ethanol. This led to
a diffusion of graphene nanoplates together with the decom-
posed polymer chains from the film surfaces to the food simu-
lants. The entangled MWCNTs released rarely in the aggressive
acetic acid food simulant were preferably fixed with the dis-
solved organic matrix. This confirmed that the release of both
nanofillers also depended on their compatibility with the matrix
polymers in addition to polymer swelling and hydrolysis.
Migrants from PP-Based Films. Migrants from the composite
PP/MWCNT films were rarely detected at the high-temperature
migration conditions of 4 h at 90 8C. The TEM micrographs in
Figure F33(a–c) visualize the migrants from the composite
Table I. Total Migrants and Degree of Swelling and Dissolution for Neat Polymeric Films and Composite Films into Food Simulants after Migration for
4 h at 90 8C
Polymertype
Foodsimulant
Neat polymer film Nanocomposite filmApproximatenanofillermigrantMNP
(mg/cm2)
Total migrantMt,exp
(mg/cm2)Dissolution(D, %)
Totalmigrant Mt,exp
(mg/cm2)Dissolution(D, %)
Swelling(S,%)
PLA-basedfilms
10% ethanolSimulant A
0.022 6 0.003 1.65 6 0.024 0.028 6 0.009 1.95 6 0.038 Not detected 0.006
3% acetic acidSimulant B
0.042 6 0.006 2.37 6 0.010 0.053 6 0.007 2.99 6 0.025 Not detected 0.011
50% ethanolSimulant D1
0.028 6 0.005 1.36 6 0.012 0.035 6 0.004 1.80 6 0.019 Not detected 0.007
PP-basedfilms
10% ethanolSimulant A
Not detected Not detected Not detected 0.18 6 0.023 Not detected Not detected
3% acetic acidSimulant B
Not detected Not detected Not detected Not detected 0.18 6 0.027 Not detected
50% ethanolSimulant D1
Not detected Not detected Not detected Not detected 0.30 6 0.031 Not detected
J_ID: z8e Customer A_ID: APP45469 Cadmus Art: APP45469 Ed. Ref. No.: 20170926 Date: 7-July-17 Stage: Page: 5
ID: vedhanarayanan.m Time: 20:08 I Path: //chenas03/Cenpro/ApplicationFiles/Journals/Wiley/APP#/Vol00000/170623/Comp/APPFile/JW-APP#170623
ARTICLE WILEYONLINELIBRARY.COM/APP
WWW.MATERIALSVIEWS.COM J. APPL. POLYM. SCI. , DOI: 10.1002/APP.4546945469 (5 of 12)

PP/MWCNT film into 10% ethanol, 50% ethanol, and 3% ace-
tic acid, respectively. Figure 3(d–f) compares the size distribu-
tion histograms of migrants from the neat PP (dark bars) and
the composite PP/MWCNT films (light bars). Total migration
from the neat PP films was found to be insufficientAQ11 in the three
food simulants. Migrants in nanoform of size 0.1–1 lm were
observed in small amounts around 0.5 n% for the composite
PP/MWCNT films in the ethanol-based food simulants [Figure
3(d,e)]. We associated the small amounts of nanoscale migrants
with single, short carbon nanotubes of length above 100–
200 nm and their aggregates, visible from the TEM micrographs
in Figure 3(a,b). Meanwhile, carbon nanotube migrants were
not observed in the acetic acid solvent, due probably to the
insufficient swelling of the PP-based films during the migration
test in this food simulant [Figure 3(f)].
It might be assumed that the swelling of the PP matrix in the
ethanol-based solvents and the increased molecular mobility at
high-temperature migration conditions assisted the release of
the short carbon nanotubes that were weakly fixed with poly-
mer at the surfaces and cut edges of the film. Our results com-
plement that of Huang et al.29 associating the diffusion of
migrants from a polymer film at high-temperature migration
conditions with an increase of the total permeation flux, due to
the higher flexibility of polymer chains above the glass transi-
tion, which caused a larger available free volume of polymer
matrix for diffusion.
Characterization of the Films Affected by the Migration Tests
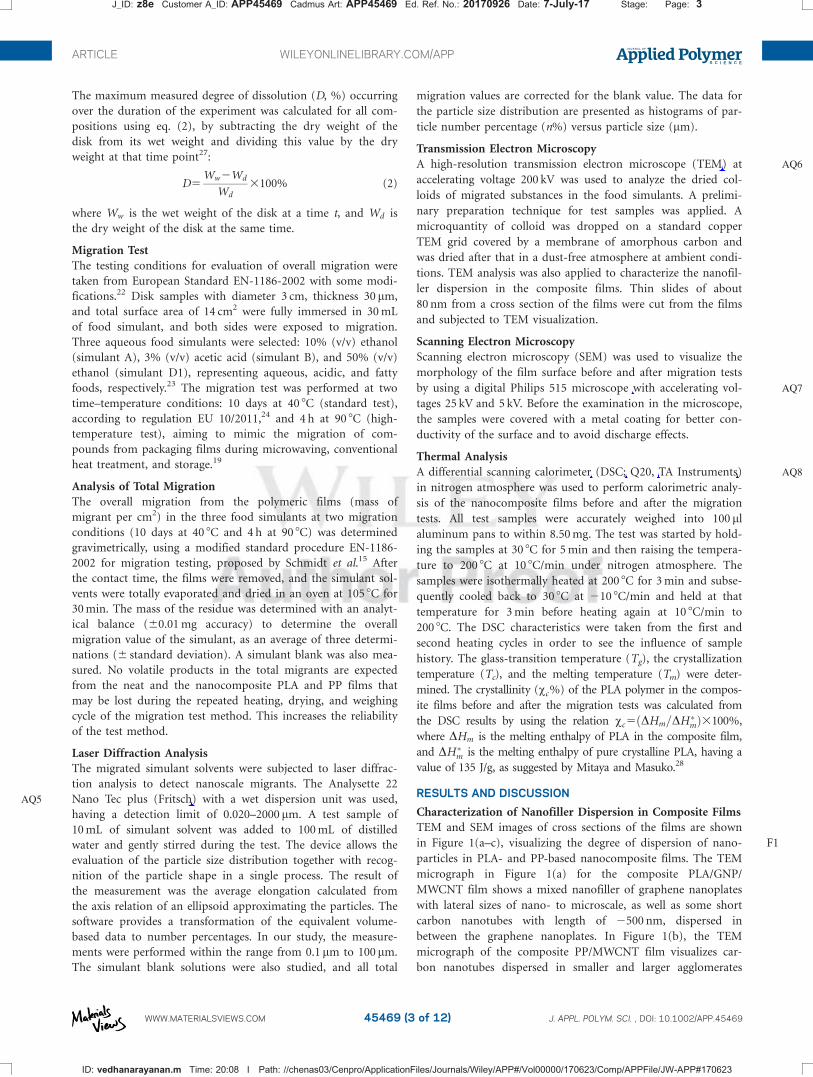
Microstructure of the Film Surfaces. SEM analysis was per-
formed to characterize the microstructure of the PLA/GNP/
MWCNT composite on the film surface and the cross section
[Figure F44(a–f)] after the high-temperature migration test at
90 8C for 4 h in the three simulant solvents. The control film
before the migration test in Figure 4(a) shows a smooth surface
without nanoparticles on it. After the migration test in 10%
ethanol [Figure 4(b)], a small number of graphene nanoplates
were migrated onto the film surface. In contrast, after migration
in 50% ethanol [Figure 4(c)], the film surface became rich with
graphene nanoplates, and a local surface-erosion process was
observed. In Figure 4(d), an extraction of substances from the
volume to the film surfaces was observed in 3% acetic acid, due
probably to the partial PLA polymer degradation in this food
simulant. The cross sections of the film after migration in 50%
Figure 2. TEM micrographs of dried migrants from PLA/GNP/MWCNT film after high-temperature migration test (at 90 8C for 4 h): (a) in 10% etha-
nol; (b) in 50% ethanol; (c,d) in 3% acetic acid. Insets: size distribution histograms of migrants from the neat PLA (dark bars) and PLA/GNP/MWCNT
films (light bars) in the liquid food simulants.
J_ID: z8e Customer A_ID: APP45469 Cadmus Art: APP45469 Ed. Ref. No.: 20170926 Date: 7-July-17 Stage: Page: 6
ID: vedhanarayanan.m Time: 20:09 I Path: //chenas03/Cenpro/ApplicationFiles/Journals/Wiley/APP#/Vol00000/170623/Comp/APPFile/JW-APP#170623
ARTICLE WILEYONLINELIBRARY.COM/APP
WWW.MATERIALSVIEWS.COM J. APPL. POLYM. SCI. , DOI: 10.1002/APP.4546945469 (6 of 12)

ethanol [Figure 4(e)] and in 3% acetic acid [Figure 4(f)] also
visualize the migration of substances at the cut ends of the
composite films. Our results confirm the findings of Rodriguez
et al.,30 who reported on a hydrolytic degradation of PLA in
acidic media due to autocatalysis, as determined by a decreasing
molecular weight followed by a rapid weight loss.
FigureF5 5(a–d) presents the SEM micrographs of the PP/
MWCNT film surfaces after the high-temperature migration test
at 90 8C for 4 h in the three simulant solvents. The micrograph
of the control composite film before the migration test [Figure
5(a)] shows that carbon nanotubes fixed with polymer were vis-
ible on film surfaces. Such movement of the MWCNTs to the
polymer–air interface appeared during hot pressing of the film
sample. It was observed that after the migration test of the
composite film in the ethanol-based solvents [Figure 5(b,c)],
the carbon nanotubes became hidden in the polymer matrix.
However, after the migration test in 3% acetic acid [Figure
5(d)], the carbon nanotubes were partly visible on the film sur-
faces. A significant extraction of organic substances from the
volume to the film surface at the high-temperature migration
conditions was not observed.
Characterization of Polymer Degradation. Calorimetric analy-
sis was performed in order to characterize the influence of
hydrolytic degradation of PLA polymer in the composite films
during the high-temperature migration test at 90 8C for 4 h in
the three food simulants. Figure F66(a,b) shows the DSC thermo-
grams (first and second runs) of the PLA/GNP/MWCNT film
and Figure 6(c,d) for the PP/MWCNT film (first run and cool-
ing), before and after migration tests into the three food
simulants.
Figure 3. TEM micrographs of migrants from composite PP/MWCNT film detected in dried food simulants; and (d–f) size distribution histograms of
migrants in the food simulant solvents after high-temperature migration tests in (a) 10% ethanol, (b) 50% ethanol, and (d) 3% acetic acid. The neat PP
is represented by dark bars and the PP/MWCNT films by light bars.
J_ID: z8e Customer A_ID: APP45469 Cadmus Art: APP45469 Ed. Ref. No.: 20170926 Date: 7-July-17 Stage: Page: 7
ID: vedhanarayanan.m Time: 20:09 I Path: //chenas03/Cenpro/ApplicationFiles/Journals/Wiley/APP#/Vol00000/170623/Comp/APPFile/JW-APP#170623
ARTICLE WILEYONLINELIBRARY.COM/APP
WWW.MATERIALSVIEWS.COM J. APPL. POLYM. SCI. , DOI: 10.1002/APP.4546945469 (7 of 12)
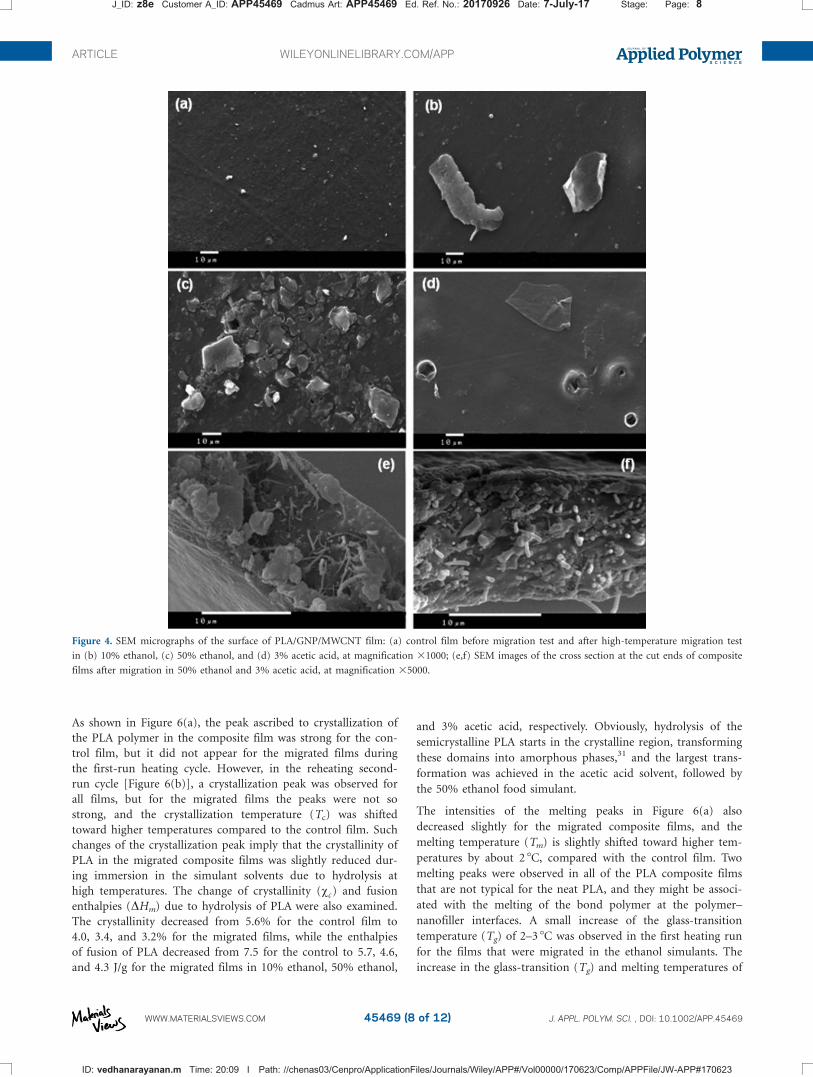
As shown in Figure 6(a), the peak ascribed to crystallization of
the PLA polymer in the composite film was strong for the con-
trol film, but it did not appear for the migrated films during
the first-run heating cycle. However, in the reheating second-
run cycle [Figure 6(b)], a crystallization peak was observed for
all films, but for the migrated films the peaks were not so
strong, and the crystallization temperature (Tc) was shifted
toward higher temperatures compared to the control film. Such
changes of the crystallization peak imply that the crystallinity of
PLA in the migrated composite films was slightly reduced dur-
ing immersion in the simulant solvents due to hydrolysis at
high temperatures. The change of crystallinity (vc ) and fusion
enthalpies (DHm) due to hydrolysis of PLA were also examined.
The crystallinity decreased from 5.6% for the control film to
4.0, 3.4, and 3.2% for the migrated films, while the enthalpies
of fusion of PLA decreased from 7.5 for the control to 5.7, 4.6,
and 4.3 J/g for the migrated films in 10% ethanol, 50% ethanol,
and 3% acetic acid, respectively. Obviously, hydrolysis of the
semicrystalline PLA starts in the crystalline region, transforming
these domains into amorphous phases,31 and the largest trans-
formation was achieved in the acetic acid solvent, followed by
the 50% ethanol food simulant.
The intensities of the melting peaks in Figure 6(a) also
decreased slightly for the migrated composite films, and the
melting temperature (Tm) is slightly shifted toward higher tem-
peratures by about 2 8C, compared with the control film. Two
melting peaks were observed in all of the PLA composite films
that are not typical for the neat PLA, and they might be associ-
ated with the melting of the bond polymer at the polymer–
nanofiller interfaces. A small increase of the glass-transition
temperature (Tg) of 2–3 8C was observed in the first heating run
for the films that were migrated in the ethanol simulants. The
increase in the glass-transition (Tg) and melting temperatures of
Figure 4. SEM micrographs of the surface of PLA/GNP/MWCNT film: (a) control film before migration test and after high-temperature migration test
in (b) 10% ethanol, (c) 50% ethanol, and (d) 3% acetic acid, at magnification 31000; (e,f) SEM images of the cross section at the cut ends of composite
films after migration in 50% ethanol and 3% acetic acid, at magnification 35000.
J_ID: z8e Customer A_ID: APP45469 Cadmus Art: APP45469 Ed. Ref. No.: 20170926 Date: 7-July-17 Stage: Page: 8
ID: vedhanarayanan.m Time: 20:09 I Path: //chenas03/Cenpro/ApplicationFiles/Journals/Wiley/APP#/Vol00000/170623/Comp/APPFile/JW-APP#170623
ARTICLE WILEYONLINELIBRARY.COM/APP
WWW.MATERIALSVIEWS.COM J. APPL. POLYM. SCI. , DOI: 10.1002/APP.4546945469 (8 of 12)

the migrated films compared to the control film could be asso-
ciated with minor changes in the polymer that influenced a
slight increase of its high-molecular-weight fractions.31
Figure 6(c,d) shows DSC thermograms of the PP/MWCNT film
in (a) the first heating run and (b) in the cooling regime in the
crystallization peak temperature zone, comparing the control film
and migrated films in the three food simulants. The thermogram
for the second heating run is similar to that obtained from the
first run, so it was not presented here. As seen from Figure 6(c),
the melting temperature (Tm) was slightly shifted by 1–2 8C
toward higher temperatures only for the films migrated in the
ethanol simulants compared to the control film. The crystalliza-
tion temperature (Tc) and the degree of crystallinity (v%), deter-
mined from the cooling curve in Figure 6(d), were not affected
by the simulant solvents after the high-temperature migration
test. These results indicated that the time–temperature structural
changes were insufficientAQ12 for the PP/MWCNT films immersed in
the three food simulants during the course of the migration test.
The small shift of melting temperature Tm for the composite
films migrated in ethanol-based simulants indicated the swelling
of the PP polymer in the ethanol solvents.
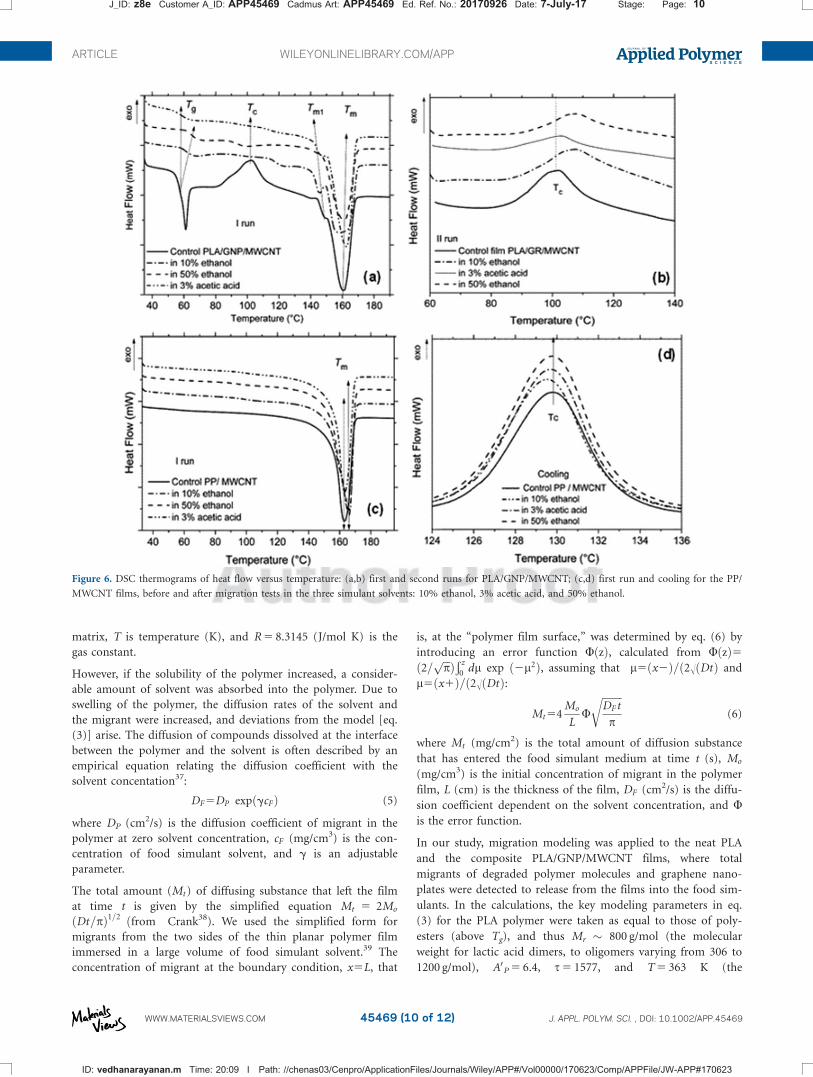
Migration Modeling
Polymer dissolution in solvents usually leads to the diffusion of
degraded polymer chains through a polymer–solvent interface
layer, which is associated with migration.32 Our experimental
results indicated that the partial degradation of PLA polymer
due to hydrolytic dissolution by food simulants at high-
temperature migration conditions facilitated the migration of
graphene nanoplates from the composite films. Thus the GNPs
and the dissolved PLA organic substances diffused from the vol-
ume toward the film surface and then into the food simulants.
Moreover, the type of penetrating food simulant solvent also
had an effect on the PLA polymer dissolution.
When the polymer is not dissolved in the food simulant solvent,
diffusion of a migrant from the polymer into the solvent can be
described by the Fick diffusion equation using the diffusion
coefficient33,34:
oC
ot5D
o2C
ox2(3)
where c is the amount of migrant in the polymer film at the
time t (s), D is the diffusion coefficient of migrant within the
polymer, and x is the position of the migrant along the thick-
ness of the polymer film.
Recently, an empirical relationship between diffusion coefficient,
molecular weight of migrant, and temperature was established for a
range of engineering plastics (Brandsch et al 35). Equation (4) was pro-
posed, which is applicable to migrants of molecular weight in the
range 100–2000 g/mol and represents an Arrhenius-like relationship36:
DP5104exp
�AP20:1351M
23r 10:003Mr2
10; 454R
RT
�cm2=s (4)
where AP5A0P2s=T , Mr is the relative molecular mass of
migrant, A0P and s are specific parameters of the polymer
Figure 5. SEM micrographs of PP/MWCNT films after high-temperature migration tests for 4 h at 90 8C into three food simulants: (a) control film, (b)
10% ethanol, (c) 50% ethanol, and (d) 3% acetic acid, at magnification 35000 (a,c) and 310,000 (b,d).
J_ID: z8e Customer A_ID: APP45469 Cadmus Art: APP45469 Ed. Ref. No.: 20170926 Date: 7-July-17 Stage: Page: 9
ID: vedhanarayanan.m Time: 20:09 I Path: //chenas03/Cenpro/ApplicationFiles/Journals/Wiley/APP#/Vol00000/170623/Comp/APPFile/JW-APP#170623
ARTICLE WILEYONLINELIBRARY.COM/APP
WWW.MATERIALSVIEWS.COM J. APPL. POLYM. SCI. , DOI: 10.1002/APP.4546945469 (9 of 12)
matrix, T is temperature (K), and R 5 8.3145 (J/mol K) is the
gas constant.
However, if the solubility of the polymer increased, a consider-
able amount of solvent was absorbed into the polymer. Due to
swelling of the polymer, the diffusion rates of the solvent and
the migrant were increased, and deviations from the model [eq.
(3)] arise. The diffusion of compounds dissolved at the interface
between the polymer and the solvent is often described by an
empirical equation relating the diffusion coefficient with the
solvent concentation37:
DF5DP expðgcFÞ (5)
where DP (cm2/s) is the diffusion coefficient of migrant in the
polymer at zero solvent concentration, cF (mg/cm3) is the con-
centration of food simulant solvent, and g is an adjustable
parameter.
The total amount (Mt ) of diffusing substance that left the film
at time t is given by the simplified equation Mt 5 2Mo
ðDt=pÞ1=2 ðfrom Crank38). We used the simplified form for
migrants from the two sides of the thin planar polymer film
immersed in a large volume of food simulant solvent.39 The
concentration of migrant at the boundary condition, x5L, that
is, at the “polymer film surface,” was determined by eq. (6) by
introducing an error function UðzÞ, calculated from UðzÞ5ð2=
ffiffiffippÞÐ z
0dl exp ð2l2Þ, assuming that l5ðx2Þ=ð2�ðDtÞ and
l5ðx1Þ=ð2�ðDtÞ:
Mt 54Mo
LU
ffiffiffiffiffiffiffiffiDF t
p
r(6)
where Mt (mg/cm2) is the total amount of diffusion substance
that has entered the food simulant medium at time t (s), Mo
(mg/cm3) is the initial concentration of migrant in the polymer
film, L (cm) is the thickness of the film, DF (cm2/s) is the diffu-
sion coefficient dependent on the solvent concentration, and Uis the error function.
In our study, migration modeling was applied to the neat PLA
and the composite PLA/GNP/MWCNT films, where total
migrants of degraded polymer molecules and graphene nano-
plates were detected to release from the films into the food sim-
ulants. In the calculations, the key modeling parameters in eq.
(3) for the PLA polymer were taken as equal to those of poly-
esters (above Tg), and thus Mr � 800 g/mol (the molecular
weight for lactic acid dimers, to oligomers varying from 306 to
1200 g/mol), A0P 5 6.4, s 5 1577, and T 5 363 K (the
Figure 6. DSC thermograms of heat flow versus temperature: (a,b) first and second runs for PLA/GNP/MWCNT; (c,d) first run and cooling for the PP/
MWCNT films, before and after migration tests in the three simulant solvents: 10% ethanol, 3% acetic acid, and 50% ethanol.
J_ID: z8e Customer A_ID: APP45469 Cadmus Art: APP45469 Ed. Ref. No.: 20170926 Date: 7-July-17 Stage: Page: 10
ID: vedhanarayanan.m Time: 20:09 I Path: //chenas03/Cenpro/ApplicationFiles/Journals/Wiley/APP#/Vol00000/170623/Comp/APPFile/JW-APP#170623
ARTICLE WILEYONLINELIBRARY.COM/APP
WWW.MATERIALSVIEWS.COM J. APPL. POLYM. SCI. , DOI: 10.1002/APP.4546945469 (10 of 12)

temperature of the migration test). In eq. (5), the concentration
of food simulant solvents cF was determined as 0.03, 0.1, and
0.5 for the 3% acetic acid and 10% and 50% ethanol simulant
solvents, respectively, while g 5 1 and 3.6 are the values for the
ethanol and the acetic acid solvents, respectively.40 For the
calculations in eq. (5), the initial amount of organic migrant
Mo � 100 mg/cm3 (corresponding to �8 wt %, which was the
concentration of the soluble molecular weight in the neat PLA
polymer, according to Crank38), and Mo;NP524 mg/cm3 (corre-
sponding to 2 wt % initial concentration of carbon nanofiller in
the PLA/GNP/MWCNT composite). The error function in eq.
(6), U 5 0.005, was determined at z 5 1 and l50:01.
TableT2 II presents the diffusion coefficients DP and DF (depend-
ing on the concentration and type of solvent) calculated using
eqs. (4) and (5), as well as the amount of total migrants Mt and
the nanoparticle migrant MNP, calculated with eq. (6).
The modeling results demonstrate a very good correlation
between the predicted amounts of total migrant Mt (0.023–
0.042 mg/cm3) for the PLA-based films and the nanoparticle
migrant MNP (0.006–0.010 mg/cm3) for the composite PLA/
GNP/MWCNT films (Table II), compared with the experimen-
tally determined values for migrants.
CONCLUSIONS
The results from this study demonstrate that the swelling and
partial hydrolytic dissolution of PLA polymer in ethanol and
acetic acid food simulants caused the release of graphene nano-
plates (100–1000 nm) from the composite PLA/GNP/MWCNT
film at the high-temperature migration conditions of 90 8C for
4 h. The fibrous MWCNTs formed an entangled network in the
PLA matrix, which prevented their release from the film surfa-
ces when the PLA matrix dissolved.AQ13 Hence, small amounts of
MWCNTs fixed with the organic PLA rarely release migrants in
the most aggressive acetic acid food simulant. In general, the
total amounts of migrants observed to release from the
composite PLA/GNP/MWCNT films were in the range of
0.028–0.053 mg/cm2, which is much lower than the overall
migration limit for food contact material (0.10 mg/cm2). In
contrast, only a few short carbon nanotubes (100–200 nm in
length) were detected to release from the surfaces and cut edges
of the chemically stable PP/MWCMT composite film in 10 v/v
% and 50 v/v % aqueous ethanol solvents. This was associated
with the increased dynamics of PP polymer molecules in the
high-temperature migration conditions, leading to a slight
swelling, especially in ethanol-based food simulants. The
migrated amount of MWCNTs was insufficient AQ14.
Mathematical modeling of diffusion was applied, where the dif-
fusivity of migrant from the film toward the solvent media was
modeled depending on the type of polymer, time–temperature
conditions, and solvent concentration. The predicted amounts
of migrants were found to be similar to the experimentally
detected values.
ACKNOWLEDGMENTS
This research was supported by the H2020MSCA-RISE-734164
Graphene 3D and the H2020-604391-GRAPHENE-Core1 projects.
Support from the Bulgarian “Science Fund” for the cofinanced
project for COST CA15114-AMICI is acknowledged. The authors
thank S. Gyoshev and N. Stoimenov from IICT-BAS for the laser
diffraction measurements.
REFERENCES
1. Silvestre, C.; Pezzuto, M.; Cimmino, S.; Duraccio, D. In Eco-
sustainable Polymer Nanomaterials for Food Packaging:
Innovative Solutions, Characterization Needs, Safety and
Environmental Issues; Silvestre, C., Cimmino, S., Eds.; Tay-
lor & Francis: UK, 2013; Chapter 1, pp 1–26.
2. Wei, H.; Yan Jun, Y.; Ning Tao, L.; Li Bing, W. J. Mater. Sci.
2011, 56, 1216.
Table II. Estimated Diffusion Modeling Parameters of the Neat PLA and Composite PLA/GNP/MWCNT Films Compared to Experimental Results for
Simulant Solvents after Migration for 4 h at 90 8C
Parameter 3% Acetic acid 10% Ethanol 50% Ethanol
Neat PLA film
DP (cm2/s) 2.35 3 10213 2.35 3 10213 2.35 3 10213
DF (cm2/s) 8.71 3 10213 2.60 3 10213 3.87 3 10213
Mo (mg/cm3) 100 100 100
Mt (mg/cm2) 0.042 0.023 0.028
Mt,exp (mg/cm2) 0.042 6 0.006 0.022 6 0.003 0.028 6 0.005
PLA/GR/MWCNT
DP (cm2/s) 2.35 3 10213 2.35 3 10213 2.35 3 10213
DF (cm2/s) 8.71 3 10213 2.60 3 10213 3.87 3 10213
Mo,NP (mg/cm3) 24 24 24
Mt (mg/cm2) 0.052 0.029 0.035
MNP (mg/cm2) 0.010 0.006 0.007
Mt,exp (mg/cm2) 0.053 6 0.007 0.028 6 0.009 0.035 6 0.004
MNP,exp (mg/cm2) 0.011 0.006 0.007
J_ID: z8e Customer A_ID: APP45469 Cadmus Art: APP45469 Ed. Ref. No.: 20170926 Date: 7-July-17 Stage: Page: 11
ID: vedhanarayanan.m Time: 20:10 I Path: //chenas03/Cenpro/ApplicationFiles/Journals/Wiley/APP#/Vol00000/170623/Comp/APPFile/JW-APP#170623
ARTICLE WILEYONLINELIBRARY.COM/APP
WWW.MATERIALSVIEWS.COM J. APPL. POLYM. SCI. , DOI: 10.1002/APP.4546945469 (11 of 12)

3. Ivanov, E.; Kotsilkova, R. In Handbook of Nanoceramic and
Nanocomposite Coatings and Materials; Abdel Makhlouf,
A., Scharnweber, D., Eds.; Elsevier, 2015; Chapter 17, pp
351–383.AQ15
4. Wu, L. L.; Wang, J.; He, X.; Zhang, T.; Sun, H. Packag. Tech-
nol. Sci. 2014, 27, 693.
5. Brody, A. L.; Bugusu, B.; Han, J. H.; Sand, C. K.; Mchugh,
T. H. J. Food Sci. 2008, 73, 8, 107.
6. Kang, S.; Herzberg, M.; Rodrigues, D. F.; Elimelech, M.
Langmuir 2008, 23, 13, 6409.
7. European Commission Recommendation (EU 2011) of
18.10.2011 on the Definition of a Nanomaterial 2011/696/
EU.
8. Bhunia, K.; Sablani, S. S.; Tang, J.; Rasco, B. Compr. Rev.
Food Sci. Food Saf. 2013, 12, 5, 23.
9. Bott, J.; Stoermer, A.; Franz, R. Food Packag. Shelf Life 2014,
2, 73.
10. Simon, P.; Chaudhry, Q.; Bakos, D. J. Food Nutr. Res. 2008,
47, 3, 105.
11. Lin, Q. B.; Li, H.; Zhong, H. N.; Zhao, Q.; Xiao, D. H.;
Wang, Z. W. Food Addit. Contam. Part A 2014, 31, 1284.
12. Chaudhry, Q.; Scotter, M.; Blackburn, J.; Ross, B.; Boxall,
A.; Castle, L.; Aitken, R.; Watkins, R. Food Addit. Contam.
2008, 25, 241.
13. Duncan, T. V.; Pillai, K. ACS Appl. Mater. Interfaces 2015, 7, 2.
14. Duncan, T. V. ACS Appl. Mater. Interface 2015, 7, 20.
15. Schmidt, B.; Petersen, J. H.; Koch, C. B.; Plackett, D.;
Johansen, N.; Katiyar, V.; Larsen, E. Food Addit. Contam.
Part A 2011, 28, 956.
16. Lalanne, A.; Espino, E.; Salazar, R.; Domenek, S.; Ducruet,
V. Ital. J. Food Sci. (Special Issue) SLIM 2010, 63.
17. Mattiolia, S.; Peltzerc, M.; Fortunatia, E.; Armentanoa, I.;
Jimenezc, A.; Kenny, J. M. Carbon 2013, 63, 274.
18. Conn, R. E.; Kolstad, J. J.; Borzelleca, J. F.; Dixler, D. S.;
Filer, L. J.; La Du, B. N.; Pariza, M. W. Food Chem. Toxicol.
1995, 33, 273.
19. Mutsuga, M.; Kawamura, Y.; Tanamoto, K. Food Addit. Con-
tam. Part A Chem. 2008, 25, 1283.
20. Chemical Compatibility Guide. Thermo Scientific.http://sev-
ierlab.vet.cornell.edu/resources/Chemical-Resistance-Chart-
Detail.pdf (accessed February 24, 2017).
21. Barson, C. A.; Dong, Y. M. Eur. Polym. J. 1990, 26, 4, 449.
22. Standard EN-1186-2002: Migration Testing on Food Contact
Materials, 2002.
23. Commission Regulation (EC) No. 450/2009 on Active and
Intelligent Materials and Articles Intended to Come into
Contact with Food; Official Journal of the European Union
2009, L135, pp 3–11.
24. Commission Regulation (EU) No. 10/2011 on Plastic Mate-
rials and Articles Intended to Come into Contact with
Food; Official Journal of the European Union 2011, L12, pp
1–89.
25. Arvidsson, B.; Molander, S.; Sanden, B. A. Hum. Ecol. Risk
Assess. 2013, 19, 873.
26. Bhunia, K.; Sablani, S. S.; Tang, J.; Rasco, B. Compr. Rev.
Food Sci. Food Saf. 2013, 12, 523.
27. Kavanagh, N.; Corrigan, O. I. Int. J. Pharmaceutics 2004,
279, 141.
28. Mitaya, T.; Masuko, T. Polymer 1998, 39, 5515.
29. Huang, J. Y.; Chieng, Y. Y.; Li, X.; Zhou, W. Food Bioprocess.
Technol. 2015, 8, 382.
30. Rodriguez, E.; Marcos, B.; Huneault, M. J. Appl. Polym. Sci.
2016, 133, 44, 44152.
31. Ndazi, B. S.; Karlsson, S. eXPRESS Polymer Lett. 2011, 5,
119.
32. Miller-Choi, B. A.; Koenig, J. K. Prog. Polym. Sci. 2003, 28,
1223.
33. De Meulenaer, B. In Predictive Modeling and Risk Assess-
ment; Costa, R., Kristbergsson, K., Eds.; Springer, 2009;
Chapter 8, pp 139–154. AQ16
34. Ferrara, G.; Bertolodo, M.; Scoponi, M.; Ciardelli, F. Polym.
Degrad. Stab. 2001, 73, 411.
35. Brandsch, J.; Mercea, P.; Ruter, M.; Tosa, V.; Piringer, O.
Food Addit. Contam. 2002, 19, 29.
36. Simoneau, C. JRC Scientific and Technical Reports, JRC
59476, EUR 24514 EN, 2010.
37. Helmroth, I. E.; Dekker, M.; Hamkemeier, A. J. Appl. Polym.
Sci. 2003, 90, 1609.
38. Crank, J. The Mathematics of Diffusion, 2nd ed.; Clarendon
Press: London, 1975.
39. Haldimann, M.; Alt, A.; Blanc, A.; Brunner, K.; Sager, F.;
Dudler, V. Food Addit. Contam. Part A 2013, 30, 3, 587.
40. Lyu, S. P.; Untereker, D. Int. J. Molecular Sci. 2009, 10, 9,
4033.
J_ID: z8e Customer A_ID: APP45469 Cadmus Art: APP45469 Ed. Ref. No.: 20170926 Date: 7-July-17 Stage: Page: 12
ID: vedhanarayanan.m Time: 20:10 I Path: //chenas03/Cenpro/ApplicationFiles/Journals/Wiley/APP#/Vol00000/170623/Comp/APPFile/JW-APP#170623
ARTICLE WILEYONLINELIBRARY.COM/APP
WWW.MATERIALSVIEWS.COM J. APPL. POLYM. SCI. , DOI: 10.1002/APP.4546945469 (12 of 12)

SGML and CITI Use OnlyDO NOT PRINT
J_ID: z8e Customer A_ID: APP45469 Cadmus Art: APP45469 Ed. Ref. No.: 20170926 Date: 7-July-17 Stage: Page: 13
ID: vedhanarayanan.m Time: 20:10 I Path: //chenas03/Cenpro/ApplicationFiles/Journals/Wiley/APP#/Vol00000/170623/Comp/APPFile/JW-APP#170623

AQ1: Please provide the name and location of the manufacturer Graphene 3D Lab (city and state in the United States).
AQ2: Please provide the name and location of the manufacturer NatureWorks (city and state in the United States).
AQ3: Please also provide the city location of the manufacturer Lukoil.
AQ4: Please also provide the city location of the manufacturer Nanocyl S.A.
AQ5: Please provide the location of the manufacturer Fritsch (city and state in the United States or city and country
elsewhere).
AQ6: Please provide the name and location of the manufacturer of the TEM (city and state in the United States or city
and country elsewhere).
AQ7: Please provide the location of the manufacturer Philips (city and state in the United States or city and country
elsewhere).
AQ8: Please provide the location of the manufacturer TA Instruments (city and state in the United States or city and
country elsewhere).
AQ9: “graphene nanoplates of size around 100–1000” Please provide the units for this number.
AQ10: “Meanwhile, carbon nanotubes fixed with organic substances. . .” Please review this sentence to ensure that the
edits have preserved your intended meaning.
AQ11: “Insufficient” means “inadequate,” as in “lacking in a desired quality or quantity.” Did you mean “insignificant” as
in “almost too small to be worth consideration”? There are two instances in the paragraph that starts with “Migrants
from the composite PP/MWCNT films. . .” Please review and correct as necessary.
AQ12: “These results indicated that the time–temperature structural changes were insufficient. . .” “Insufficient” means
“inadequate,” as in “lacking in a desired quality or quantity.” Did you mean “insignificant” as in “almost too small to be
worth consideration”? Please review and correct as necessary.
AQ13: “Hence, small amounts of MWCNTs fixed with. . .” Please review this sentence to ensure that the edits have pre-
served your intended meaning.
AQ14: “The migrated amount of MWCNTs was insufficient.” “Insufficient” means “inadequate,” as in “lacking in a
desired quality or quantity.” Did you mean “insignificant” as in “almost too small to be worth consideration”? Please
review and correct as necessary.
AQ15: For ref. 3,please also provide the place of publication.
AQ16: For ref. 33,please also provide the place of publication.
AQ17: Please confirm that given names (red) and surnames/family names (green) have been identified correctly.
Funding Info Query Form
Please confirm that the funding sponsor list below was correctly extracted from your article: that it includes all funders and that the
text has been matched to the correct FundRef Registry organization names. If a name was not found in the FundRef registry, it
may be not the canonical name form or it may be a program name rather than an organization name, or it may be an organization
not yet included in FundRef Registry. If you know of another name form or a parent organization name for a “not found” item on
this list below, please share that information.
J_ID: z8e Customer A_ID: APP45469 Cadmus Art: APP45469 Ed. Ref. No.: 20170926 Date: 7-July-17 Stage: Page: 14
ID: vedhanarayanan.m Time: 20:10 I Path: //chenas03/Cenpro/ApplicationFiles/Journals/Wiley/APP#/Vol00000/170623/Comp/APPFile/JW-APP#170623
FundRef name FundRef Organization Name
Bulgarian “Science Fund”
[NOT FOUND IN FUNDREF REGISTRY]
OST CA15114-AMICI
[NOT FOUND IN FUNDREF REGISTRY]
J_ID: z8e Customer A_ID: APP45469 Cadmus Art: APP45469 Ed. Ref. No.: 20170926 Date: 7-July-17 Stage: Page: 15
ID: vedhanarayanan.m Time: 20:10 I Path: //chenas03/Cenpro/ApplicationFiles/Journals/Wiley/APP#/Vol00000/170623/Comp/APPFile/JW-APP#170623