influence of peripheral velocity on measurements of ... strength for an artificial soil ... render...
TRANSCRIPT
Symbol Reference Soil
0.0
0.5
1.0
1.5
2.0
0.0100 0.100 1.00 10.0 100 103
This Work Bentonite-Kaolinite MixPerlow & Richards, 1977 San Diego Clay Wiesel, 1973 Ska EdebyTortensson, 1977 BackebolTortensson, 1977 AskimSchapery & Dunlap, 1978 Gulf Mexico
0.11101001000104
Nor
m. U
ndra
ined
She
ar S
treng
th, s
u/su0
Peripheral Velocity, vp (mm/min)
Reference Rate~ 3.4 mm/min
Rate Effect Model
su/s
u0 = (v
p/v
p0) β
Typical Range of
Interest for Earthquake
Loading
Typical Range of Interest for Wave& Storm Loading
0.05
0.10β =
Estimated Time to Failure, tf (minutes)
INFLUENCE OF PERIPHERAL VELOCITY ON UNDRAINED SHEARSTRENGTH AND DEFORMABILITY CHARACTERISTICS OF A BENTONITE-
KAOLINITE MIXTURE
by
Giovanna Biscontin and Juan M. Pestana
Geotechnical Engineering Report No UCB/GT/99-19
November 1999Revised in December 2000
GEOTECHNICAL ENGINEERING.Department of Civil and Environmental Engineering
University of California, Berkeley
ii
BISCONTIN AND PESTANA (1999) INFLUENCE OF PERIPHERAL VELOCITY ON UNDRAINED SHEAR STRENGTH …
TABLE OF CONTENTSLIST OF TABLES......................................................................................................................................................IILIST OF FIGURES....................................................................................................................................................IIINFLUENCE OF PERIPHERAL VELOCITY ON MEASUREMENTS OF UNDRAINED SHEARSTRENGTH FOR AN ARTIFICIAL SOIL..............................................................................................................1
ABSTRACT .............................................................................................................................................................1INTRODUCTION ....................................................................................................................................................2TIME EFFECTS- EFFECT OF PERIPHERAL VELOCITY...................................................................................................3
EXPERIMENTAL PROGRAM.................................................................................................................................4MATERIAL .................................................................................................................................................................4PREPARATION AND TESTING......................................................................................................................................4RESULTS AND ANALYSIS ...........................................................................................................................................5PARTIAL DRAINAGE EFFECTS....................................................................................................................................7DEFORMABILITY OF SOIL- ESTIMATION OF SHEAR MODULUS...................................................................................8
CONCLUSIONS..........................................................................................................................................................9ACKNOWLEDGEMENTS ........................................................................................................................................9REFERENCES ..........................................................................................................................................................10NOTATION ...............................................................................................................................................................12
Figure 1: Schematic of Sampling Locations and Vertical Soil Profile. .............................................................13Figure 2: Schematic of Shear Vane Testing.......................................................................................................14Figure 3: Peak and Undrained Residual Strength Measured from Vane Tests. ................................................15Figure 4: Summary of Peak Conditions for Shear Vane Tests...........................................................................16Figure 5: Normalized Undrained Shear Strength as a function of Peripheral Velocity. ...................................17Figure 6: Recommended Vane Rotation Rates for a Standard Peripheral Velocity of 0.057 mm/min (modifiedfrom Perlow & Richards, 1976).........................................................................................................................18Figure 7: Verification of Undrained Behavior Condition..................................................................................19Figure 8: Typical Shear Stress-Deformation Behavior for Vane Tests on Batches II & III .............................20Figure 9: Determination of Shear Modulus Based on Shear Vane Measurements............................................21Figure 10: Equivalent Shear Modulus as a function of Peripheral Velocity. ....................................................22
APPENDIX A: SHEAR MODULUS ESTIMATION. ...........................................................................................23APPENDIX B: SUMMARY OF RESULTS ..........................................................................................................24
LIST OF TABLESTABLE 1: PREVIOUS STUDIES OF RATE EFFECT ON UNDRAINED SHEAR STRENGTH FROM FIELD VANE TESTS .......12
LIST OF FIGURESFigure 1: Schematic of Sampling Locations and Vertical Soil Profile. .............................................................13Figure 2: Schematic of Shear Vane Testing.......................................................................................................14Figure 3: Peak and Undrained Residual Strength Measured from Vane Tests. ...............................................15Figure 4: Summary of Peak Conditions for Shear Vane Tests...........................................................................16Figure 5: Normalized Undrained Shear Strength as a function of Peripheral Velocity. ...................................17Figure 6: Recommended Vane Rotation Rates for a Standard Peripheral Velocity of 0.057 mm/min (modified from Perlow & Richards, 1976).........................................................................................18Figure 7: Verification of Undrained Behavior Condition..................................................................................19Figure 8: Typical Shear Stress-Deformation Behavior for Vane Tests on Batches II & III .............................20Figure 9: Determination of Shear Modulus Based on Shear Vane Measurements............................................21Figure 10: Equivalent Shear Modulus as a function of Peripheral Velocity. ....................................................22
1
BISCONTIN AND PESTANA (1999) INFLUENCE OF PERIPHERAL VELOCITY ON UNDRAINED SHEAR STRENGTH …
INFLUENCE OF PERIPHERAL VELOCITY ON MEASUREMENTS OF UNDRAINEDSHEAR STRENGTH FOR AN ARTIFICIAL SOIL
Giovanna Biscontin and Juan M. PestanaDepartment of Civil and Environmental EngineeringUniversity of California, Berkeley, CA 94720-1710
ABSTRACTThe rate of rotation is among the most important factors affecting the measurements of undrainedstrength. In particular, for seismic or fast wave loading conditions, the shear rate is much higherthan that used in many common laboratory tests, let alone standard procedures for field tests. Thetesting program described here evaluates the effect of peripheral velocity on the undrainedstrength and deformability characteristics inferred from the shear vane test. The peripheralvelocities used in this study correspond to rotation rates ranging from approximately 2o/min to3000 o/min. The study was conducted on a slightly cemented bentonite-kaolinite soil mixturemanufactured in the laboratory that possesses many characteristics similar to those of naturalmaterials. Results show that the shear strength increases with increasing peripheral velocity andis similar to that reported for many soils in the literature while the residual shear strength seemsto be nearly independent of rotation rate. The ‘torque-rotation’ curves obtained from the shearvane test can be used to estimate qualitatively the value of the secant shear modulus as a functionof the shear deformation. The stiffness at small strains is nearly constant, regardless of rotationrate, while at higher angles of rotation the stiffness increases with increasing peripheral velocitybut these changes are, by and large, controlled by the increases in the undrained strength.

2
BISCONTIN AND PESTANA (1999) INFLUENCE OF PERIPHERAL VELOCITY ON UNDRAINED SHEAR STRENGTH …
INTRODUCTIONThe problem of relating undrained shear strength measured in the laboratory to that measured inthe field and, ultimately, to the actual resistance of the soil has been a permanent concern ingeotechnical engineering. Among all the insitu techniques available today, the field vane isprobably the most widely used method to estimate the undrained strength of soft clays. Its usefollows the original conception and development in Sweden in late 1919, and initial intenseresearch work by Cadling and Odenstad (1948), Carlsson (1948) and Skempton (1948). Flodinand Broms (1981) have presented a detailed history of its use since 1950.
Field vane shear testing are widely used for their simplicity, speed and relative low cost, whichallow the gathering of extensive information during a site investigation program. Nevertheless,the results of these tests are affected by many factors such as rate of rotation of the vane, setuptime (i.e., time elapsed between the insertion of the vane and the beginning of the test), shapeand aspect ratio of the vane blade, drainage conditions, disturbance effects and non-uniformstress distribution leading to progressive failure and strength anisotropy. There have been manystudies to evaluate the significance of these factors (e.g., Aas, 1965; Flaate, 1966; Wiesel, 1973;Arman et al., 1975; Menzies and Mailey, 1976; Torstensson, 1977; Menzies and Merrifield,1980; Roy and LeBlanc, 1988). Chandler (1988) presented a comprehensive summary anddiscussion of these elements and their influence in the interpretation of the vane test results,which is still valid today. Some of these issues have been, to some extent, resolved bystandardization of the technique. Currently, the standard field vane is rectangular with adiameter of approximately 65mm (or 55mm), an aspect ratio of height to diameter, H/D, of 2, a1.95mm thick blade and an area ratio less than 12% in order to minimize disturbance. Inaddition, the rate of loading is generally chosen as 0.1o/sec (i.e., 6o/min) with minimal delaytimes after vane insertion ranging from 1 minute to less than 5 minutes. These specifications,with minor variations, are common to many standards for Field Vane Testing including theBritish, Swedish, Norwegian, European, Indian and ASTM among others (Lunne, 1999).Additional precautions, such as minimization- elimination or the measurement of rod frictionrender the new estimates of shear strength more consistent and reliable.
The rate of rotation is among the most important factors affecting the measurements of undrainedstrength (e.g., Leroueil and Marques, 1996) and its relevance was recognized early in thedevelopment of the vane shear tests. (i.e., Cadling and Odenstad, 1950). Historically, evaluationof rate effects for vane testing has been directed to estimate the undrained shear strength for‘static’ problems where the straining rate is much slower than that of conventional testing.Based on numerous cases studies, Bjerrum proposed a reduction factor for su measured with thevane to account for the longer time to failure in the field, which has been typically assumed tooccur within 7 days (i.e., 10,000 minutes) (e.g., Bjerrum, 1972; Torstensson, 1977; Chandler,1988). The original correction was a function of plasticity index, recognizing that more plasticsoils will exhibit a higher rate dependent behavior. More recently, additional considerationssuch as stress history (i.e., OCR related to su/σvo) and ageing conditions (i.e., young vs. aged)have been incorporated in the interpretation (e.g., Aas et al., 1986).
For seismic or wave loading conditions, on the other hand, the shear rate is much faster than thatin many common laboratory tests, let alone standard procedures for field tests. In particular, theevaluation of the response of laterally loaded pile foundations in soft clays under cyclic andseismic excitation requires an accurate assessment of both the stiffness and the undrainedstrength of the soil at higher rates of loading than that for which the traditional field vanecorrection was developed. The testing program described here was developed in conjunction
3
BISCONTIN AND PESTANA (1999) INFLUENCE OF PERIPHERAL VELOCITY ON UNDRAINED SHEAR STRENGTH …
with a coordinated testing and analytical effort to evaluate seismic soil-pile-superstructureinteraction of single piles and pile groups in soft clays on the large shaking table at RichmondField Station (i.e., Meymand, 1998; Lok, 1999).
Time Effects- Effect of Peripheral VelocityIt is generally recognized that an increase in the rate of shear results in an increase in undrainedshear strength, su. This observation is supported by a large database from several test types, otherthan the shear vane test, such as cone penetration tests (e.g., Powell and Quatermann, 1988) andstandard triaxial tests (e.g., Kulhawy and Mayne, 1990). The dependence between the two hasbeen traditionally interpreted according to a power or a logarithmic law in terms of the angularrotation rate, w& , or time to failure, tf:
( ) ( )ffuu ttwwss 000 log.1log.1 αα +≈+= && ; semi-logarithmic law (1a)
( ) ( )ββffuu ttwwss 000 ≈= && ; power law (1b)
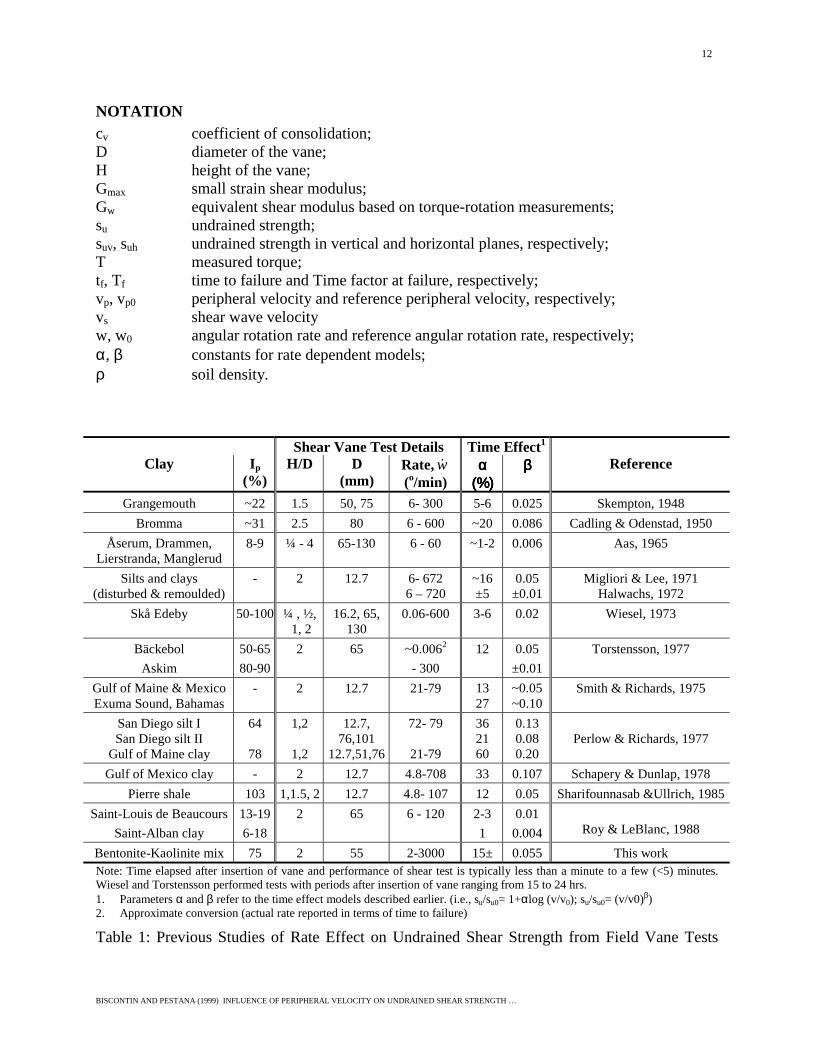
where su0 is the undrained strength corresponding to the reference time to failure, tf0, or thereference angular rotation rate, 0w& , and α and β are soil dependent material parameters. Foruncemented and lightly cemented silts and clays, several researchers report values of α rangingfrom 1 and 2% (e.g., Aas, 1965, Roy and LeBlanc, 1988) up to a maximum of 20-30% for 1 logcycle increase in angular rotation rates (o/min) (e.g., Smith and Richards, 1975, Perlow andRichards, 1977). In general, the lower values are reported for disturbed specimens andlaboratory test programs using miniature vanes. In particular, the latter may result in ambiguousinterpretations due to partial drainage effects as will be discussed latter. Higher values tend to berepresentative of cemented or carbonatic materials (e.g., Perlow and Richards, 1977) andexcellent quality "undisturbed" specimens. Although there has been a large research effort inthis area over the last 40-50 years, direct comparison is difficult because of the difference in testtype (i.e., field vs. laboratory), vane sizes, shapes and the setup time (ranging from a few minutesto 24 hr after insertion, e.g., Torstensson, 1977) used among different testing programs. Asummary of previous investigations is shown in Table 1 along with reported or computed valuesof parameters α and β for the different soils.
Perlow and Richards (1977) were the first to recognize and document the significance of bothvane size (i.e., diameter, D) and rotation rate. They introduced a new parameter referred to asangular shear velocity, which is simply the velocity at the edge of the blade (i.e., vp = w& .D/2).The term was later corrected to the more appropriate peripheral velocity. Their work includedextensive in situ and laboratory vane shear testing at three different sites. The field vane resultscorresponded to shallow offshore sediments (depth < 1-2m) while laboratory testing wasperformed on retrieved specimens up to a depth of 10 m. They concluded that peripheralvelocity uniquely characterizes viscous effects and suggested the use of a standard rotation rateresulting in a 9 mm/minute peripheral velocity for all tests, since this rate typically guaranteesundrained response for most soil types. For a 65mm vane this corresponds to approximately16o/min which is slightly higher than the typical range of 6o/min to 12 o/min.
Most of the previous investigations used rates of rotation between 6°/min and 90°/min whichresulted in peripheral velocities lower than 1mm/second. Vane sizes and shapes variedconsiderably and testing procedures or equipment not always allowed a constant rate, makingmore difficult to estimate these quantities. It must be stressed that a significant portion of theexisting database is not internally consistent since researchers have used different measures, such
4
BISCONTIN AND PESTANA (1999) INFLUENCE OF PERIPHERAL VELOCITY ON UNDRAINED SHEAR STRENGTH …
as time to failure (e.g., Torstensson, 1977) or reported results for the same rotation rate but useddifferent vane diameters. In addition some of these results include the use of miniature vanes,which in some cases lead to partially drainage conditions, making the conclusions somewhatunclear (e.g., Blight, 1968, 1977). This situation has also been observed in cone penetrationtesting at low insertion rates (e.g., Campanella and Robertson, 1981).
The following sections describe a laboratory testing program at the University of California atBerkeley directed at assessing the stress-deformation response of a soft cohesive "model" soilfrom shear vane testing at angular rotation rates ranging from 0.04o/sec to 48o/sec (~ 2 to 3000o/min). The rates of rotation were chosen to obtain the widest range of peripheral velocities (0.02and 20 mm/sec) within the limitations of the testing setup.
EXPERIMENTAL PROGRAM
Material"Model" (i.e., artificial) soils have been used extensively at the University of California atBerkeley since the late 60's to investigate soil behavior in combination to "static and dynamic"1g scale modeling in the shaking table (e.g., Seed and Clough, 1963). Most recently, a largecoordinated research program to evaluate the seismic soil-pile-superstructure interaction(Meymand, 1998; Lok, 1999) and seismic slope stability (Wartman, 1999) has been conductedusing two small shaking tables in Davis Hall and the large shaking table at the Richmond FieldStation. In these studies, a suitable mix was developed to simultaneously match the scaledundrained strength, su, and small strain shear stiffness, Gmax, for a representative profile of softSan Francisco Bay Mud. After numerous tests, the following mix was selected: 72% kaolinite,24% bentonite and 4% type C fly ash. The mixture has a liquid limit of 115, plastic limit 40 andplasticity index of 75. The soil was mixed at a target water content of 130% with acorresponding unit weight is about 14.8 kN/m3 (94 pcf). The addition of fly ash to the mixtureprovided a slight cementation which increased the shear wave velocity (and thus the small strainshear stiffness Gmax) from 16-18 m/sec to approximately 30 m/sec after a curing period of 5 days.There was no significant increase in the shear strength and increases in shear velocity wereminimal after a period of 5-7 days. The target undrained shear strength was approximately 4.3kPa (90±10 psf) and a shear wave velocity of approximately 30-32 m/sec (~100-105 ft/sec) aftera curing period of 5 days, which was the typical time interval between model soil placement andtesting or between successive tests (Wartman, 1996; Meymand, 1998).
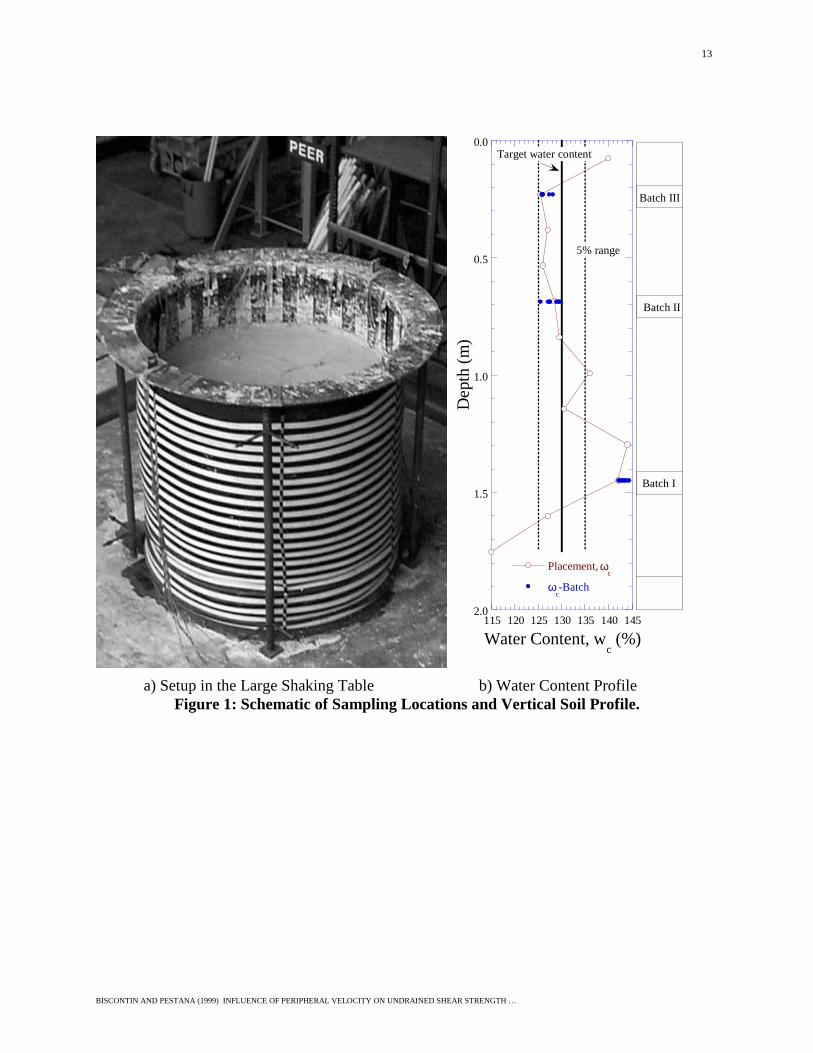
Preparation and TestingThe testing program in the laboratory was conducted parallel to the shaking table tests tominimize small differences in composition of the mix bound to vary from batch to batch, and inthe curing period, both of which influence the properties of the model soil. The soil wascarefully mixed and pumped to a flexible-walled container of 2.3m in diameter andapproximately 2m in height placed on large shaking table as shown in figure 1a. During fillingof the container, four 10 gallons plastic buckets were filled with model soil directly from themixing batch. Three batches at nominal depths of 0.25m, 0.70m and 1.45m were used and a totalof 12 containers were stored in the wet room for the curing period to ensure that the watercontent would be preserved. Water content determination of the soil placed was conducted aspart of the characterization program and is shown in figure 1b. The measured water content waswithin 5-10% of the target for most of the vertical soil profile. Water content determination

5
BISCONTIN AND PESTANA (1999) INFLUENCE OF PERIPHERAL VELOCITY ON UNDRAINED SHEAR STRENGTH …
performed for each batch yielded results which are representative of those in the container. Thetesting program had to be completed in less than a week following the 5 days of curing time.First a pot test was performed in the middle of each bucket (Lok, 1999) and then four vane sheartests were carried out in the remaining soil.
Since the scope of this study was to characterize the influence of “shearing rate” on su , carefulattention was given to eliminate all possible causes for discrepancies among different tests. Thesoil was obviously as standardized and homogenous as it is realistically possible to obtain fromsuch a large scale mixing procedure (~ 6 m3). In order to achieve the large range of peripheralvelocities required for this study, the selection of the vane was a key process. A single standardfield vane was used throughout the program, with 55mm in diameter, aspect ratio H/D of 2,blade thickness less than 2mm, with an area ratio less than 12%. The size of the bucket was alsochosen to insure that the vane could penetrate for twice its height (~4D), still leaving suitabledistance between the tip of the vane and the bottom of the bucket. During vane shear laboratorytesting, consolidation after the initial insertion is often allowed to be completed before testingbegins. This is not standard practice in the field and would prolong the testing programunnecessarily, thus only a couple of minutes were allowed between insertion and testing. Thedevice consisted of a small variable speed electrical motor connected to a set of gears, whichwould further widen the range of rotation rates attainable. The torque was measured by straingages attached to a thin bar of metal on the vane rod (cf., figure 2). The vane was inserted byslowly and carefully rising the bucket with a jack to minimize swinging and disturbance. Fulldetail of these tests are provided by Biscontin and Pestana (1999).
Results and AnalysisThe undrained shear strength can be determined from measurement of torque and assuming aprescribed shear stress profile along the potential cylindrical failure surface. The shearmechanism is relatively complex and the distribution of shear stresses in the periphery of thepotential shear surface has been investigated theoretically through 3D finite element studiesusing an elastic (Donald et al., 1977) as well as elastoplastic with strain softening constitutivemodels (De Alencar et al., 1988) in order to capture the progressive failure mechanism. Menziesand Merrifield (1980) have found these analyses in good agreement with experimentalmeasurements on a carefully instrumented vane. The most general expression for the undrainedstrength in the vertical plane is given by:
+
+=
uv
uhuv
ss
nDHDx
Ts
)3(1
2
3π(2)
where T is the maximum torque measured, H/D is the aspect ratio of the vane, D is the diameterof the vane, suh/suv is the ratio of the undrained strength in both vertical and horizontal planesdescribing anisotropy, x is a factor describing the location of the failure surface with respect tothe diameter of the vane (~1.05, Skempton 1948) and is typically considered as 1, and n is thepower law describing the shear stress distribution on the horizontal planes (e.g., Donald et al.,1977). The later is taken as zero in many cases (e.g., full mobilization, ASTM standards) whilecareful measurement indicate n is approximately 4-5 (e.g., Menzies and Merrifield, 1980). Thisdifference is expected to be small and will only introduce a consistent bias in the results but willnot affect the conclusions regarding the rate of increase in shear strength at faster rates. In ourcase, we use a standard aspect ratio of 2 and the soil was placed (and not deposited) and thus

6
BISCONTIN AND PESTANA (1999) INFLUENCE OF PERIPHERAL VELOCITY ON UNDRAINED SHEAR STRENGTH …
anisotropic conditions are expected to be negligible (suh/suv ~ 1). The undrained strength can beestimated as:
33 .857.0~
.76
DT
DTsu ππ
= (3)
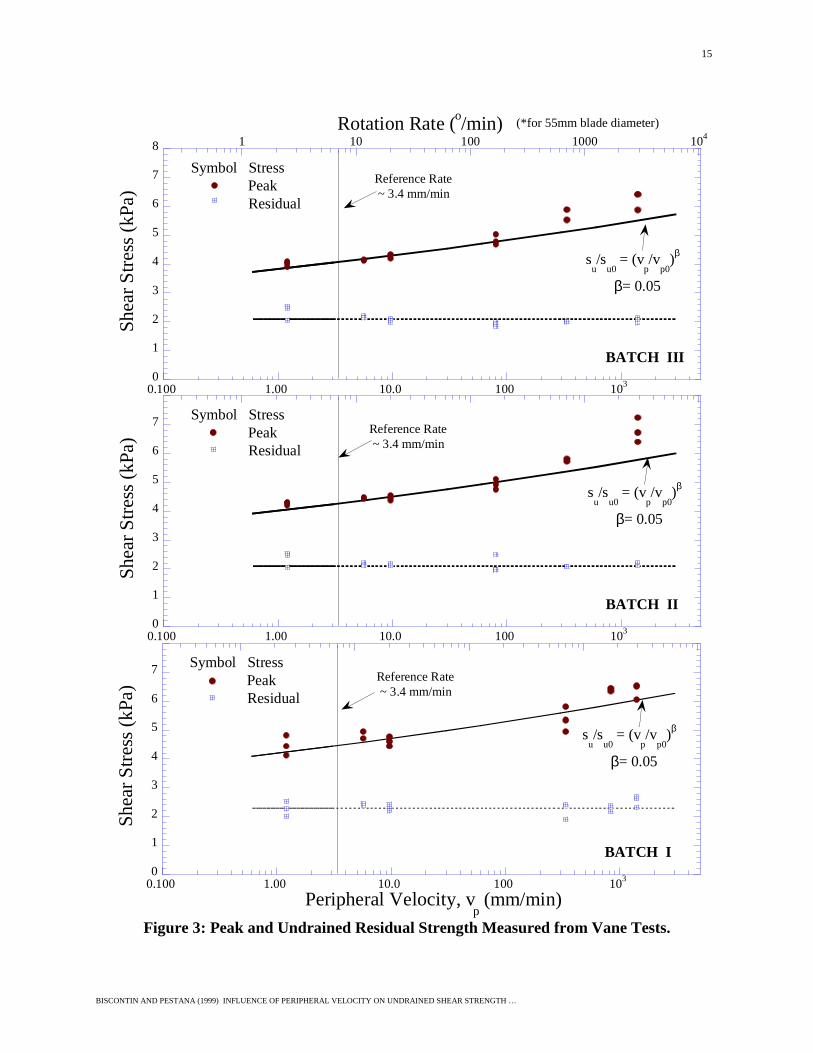
Maximum torque was determined as the highest value recorded while the “residual” strength wasdetermined based on the lowest value in the record. ASTM Standard D4648 recommends five toten fast rotations before repeating the test. The peripheral velocity achievable with our testingsetup ranges from a low value of approximately 1 mm/min to an upper bound of 1500 mm/min.The standard peripheral velocity, vp0, was chosen as approximately 3.4 mm/min corresponding toan angular rotation rate of 6o/min for a field vane of 65 mm. Equations 1a and 1b can be thenwritten in terms of peripheral velocity:
( )00 log.1 ppuu vvss α+= ; semi-logarithmic law (4a)
( )β00 ppuu vvss = ; power law (4b)
Figure 3 shows measurements of peak and residual shear strength for the three batches of modelsoil. It can be clearly seen that the undrained shear strength increases significantly with increasesin peripheral velocity and this effect becomes more pronounced as the velocity becomes closer toexpected earthquake values. For the highest peripheral velocity (~ 1500 mm/min) the measuredshear strength was in the order of 45 to 65% higher than that determined at the standard shearingrate. These results are in excellent agreement with Seed and Clough recommendation of anincrease of 60% in undrained strength for a similar soil mixture for earthquake engineeringanalyses (Seed and Clough, 1963). The graphs also show, for reference, estimated changes instrength based on the power law expression with β of 0.05 which has been observed by otherresearchers (e.g., Wiesel, 1973; Torstensson, 1977). On the other hand, the residual strength hasno statistical dependence on peripheral velocity for all three batches and can be considered, formost practical purposes, independent of peripheral velocity (or rotation rate). In contrast,Skempton (1948) reports increases in the remoulded strength of about 1.5-2% for approximaterotation rates of 0.1o/sec to 1o/sec.
Batch I shows the highest scatter in the measured values of strength which has been associatedwith initial operation of the mixing equipment and small differences in the fraction of theconstituents (Meymand, 1998; Lok, 1999). The vertical profile of water content (cf., figure 1)also shows the highest variation in the initial state in the first 40-50 cm of placed soil. This iscorroborated further by the fact that batch I having a higher initial water content than batches IIand III, has an undrained strength about 10% higher than the others. In contrast, Wartman(1996) shows that for a given soil mixture, the undrained shear strength and shear wave velocitydecreases with increasing water content. The remainder of the paper will concentrate primarilyon the results of batches II and III and treat them as the same soil.
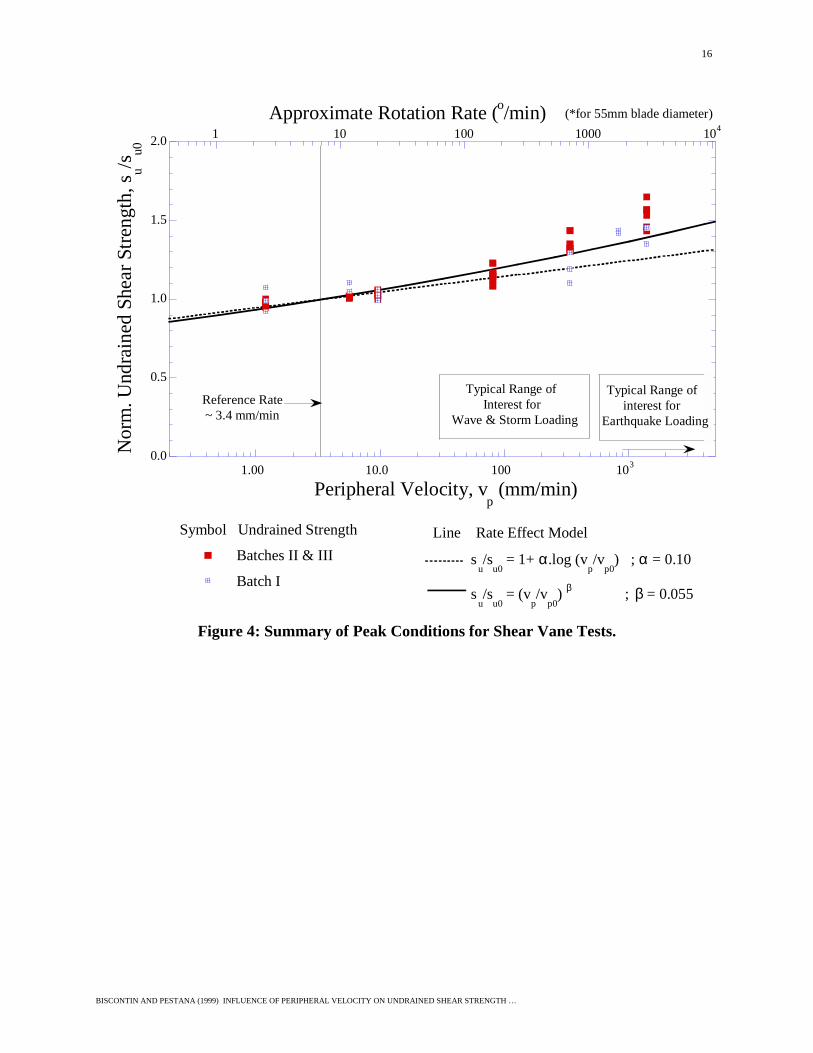
Figure 4 shows a summary of normalized undrained strengths as a function of peripheral velocityfor bentonite-kaolinite mixture used in this study. The figure also shows the predicted changesin undrained strength by the two laws described earlier. The data used for the regression analysisonly included data for equivalent rotation rates less than 700o/min, corresponding to the fastestrate reported in the literature to date. This was done to evaluate the predictive capabilities forrotation rates corresponding to those estimated using numerical analysis for earthquake typeloading. The "rounded-off" values for parameters α and β corresponded to 0.10 and 0.055respectively. It can be seen that both the power law and the semi-logarithmic law givepractically identical predictions with excellent description of the measured "average" strength in
7
BISCONTIN AND PESTANA (1999) INFLUENCE OF PERIPHERAL VELOCITY ON UNDRAINED SHEAR STRENGTH …
the range of 1 to 100 mm/min, but underpredict the increase in strength for higher values ofperipheral velocity. In particular, the power law gives a closer description over the completerange of peripheral velocity underestimating the shear strength at 1400 mm/min by only 15%.The figure shows, for reference, the estimated range in shearing rate for wave/storm loading(used in offshore applications) and earthquake loading based on extensive numerical simulationsof seismic pile foundation performance.
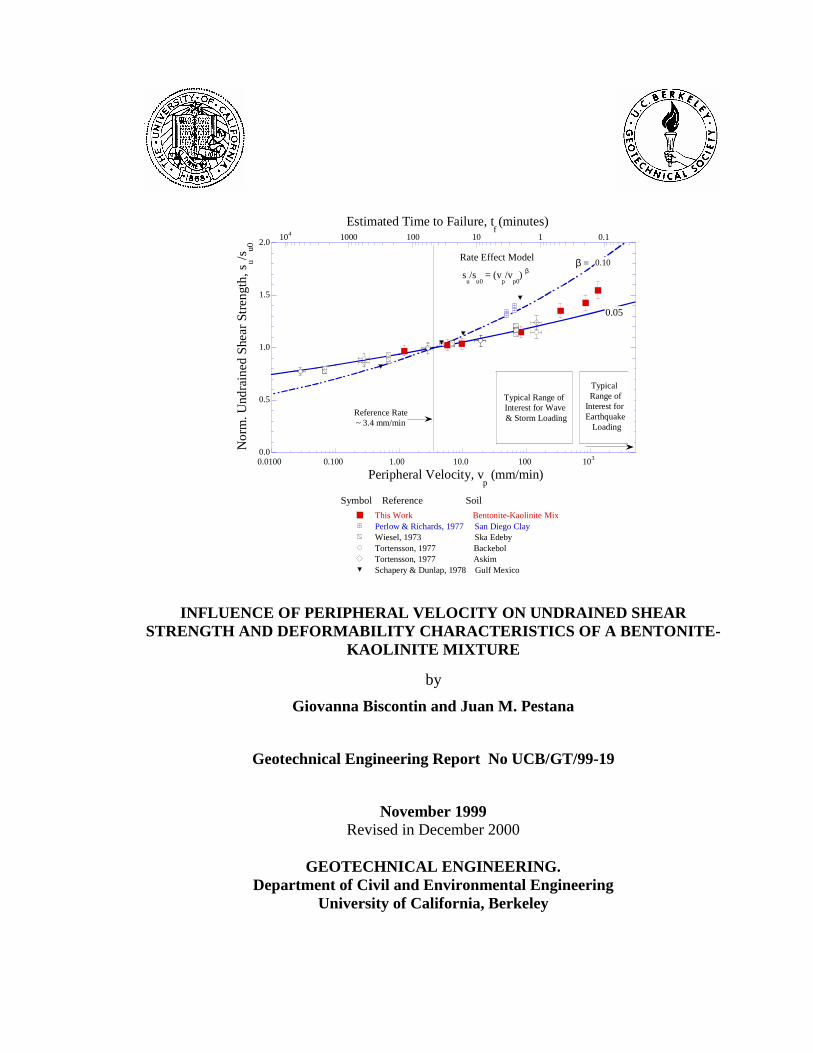
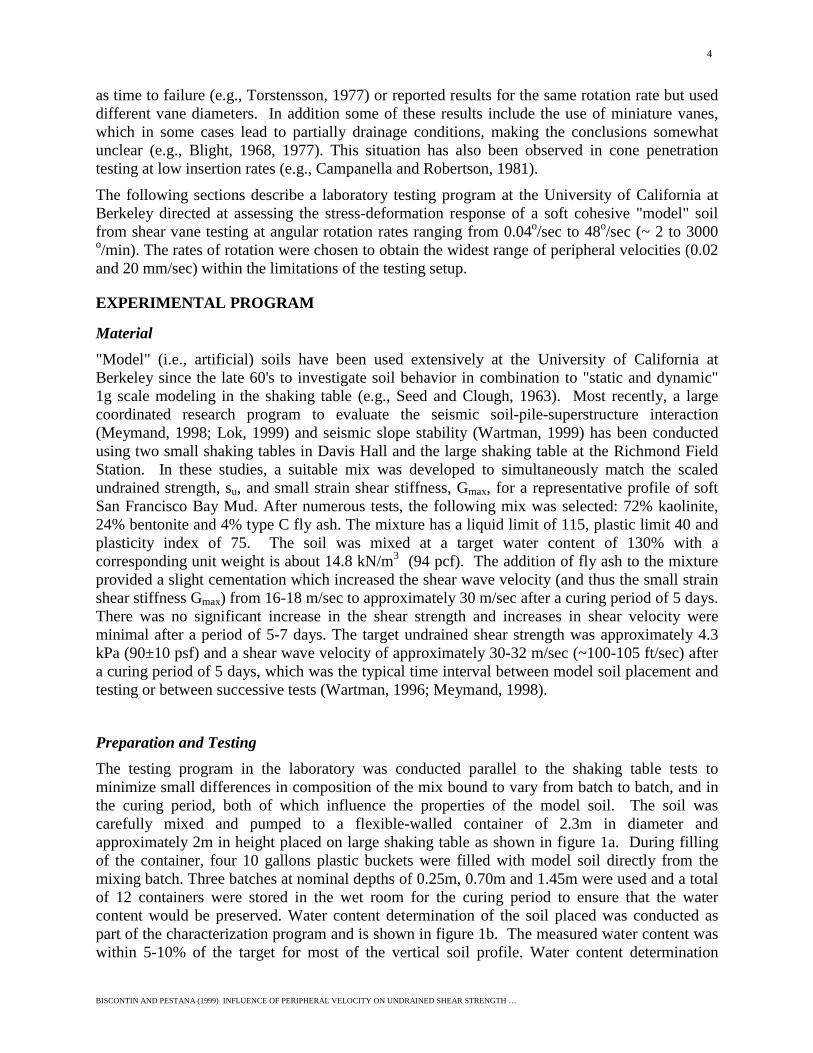
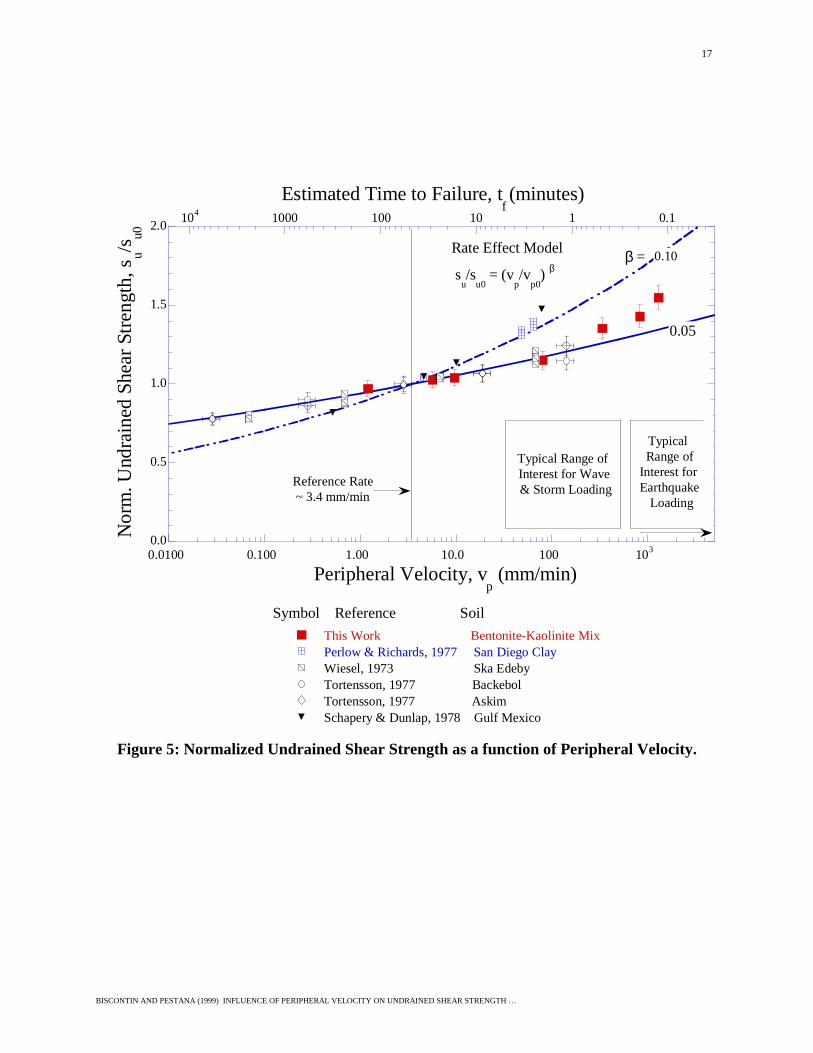
Figure 5 shows a summary of existing data documenting changes in undrained shear strength forsoft soils as a function of peripheral velocity. A significant effort was dedicated to correctlysummarize previous results in terms of peripheral velocity, as appropriate. For the sake ofclarity, experimental data that may have included partial drainage effects, excessive disturbanceor very limited range in shear rate were omitted. It can be seen that most existing data fall withinthe limits established by a power law with β = 0.05 and 0.10 over a wide range of shearing rates(~ 5 orders of magnitude). In particular, the power law with β = 0.05 predicts a decrease inundrained strength of 25 to 30% (su/su0 = 0.70-0.75) for the lowest rates of shearingcorresponding (approximately) to a time to failure of 10,000 minutes which is in good agreementwith correction values by Bjerrum (1972).
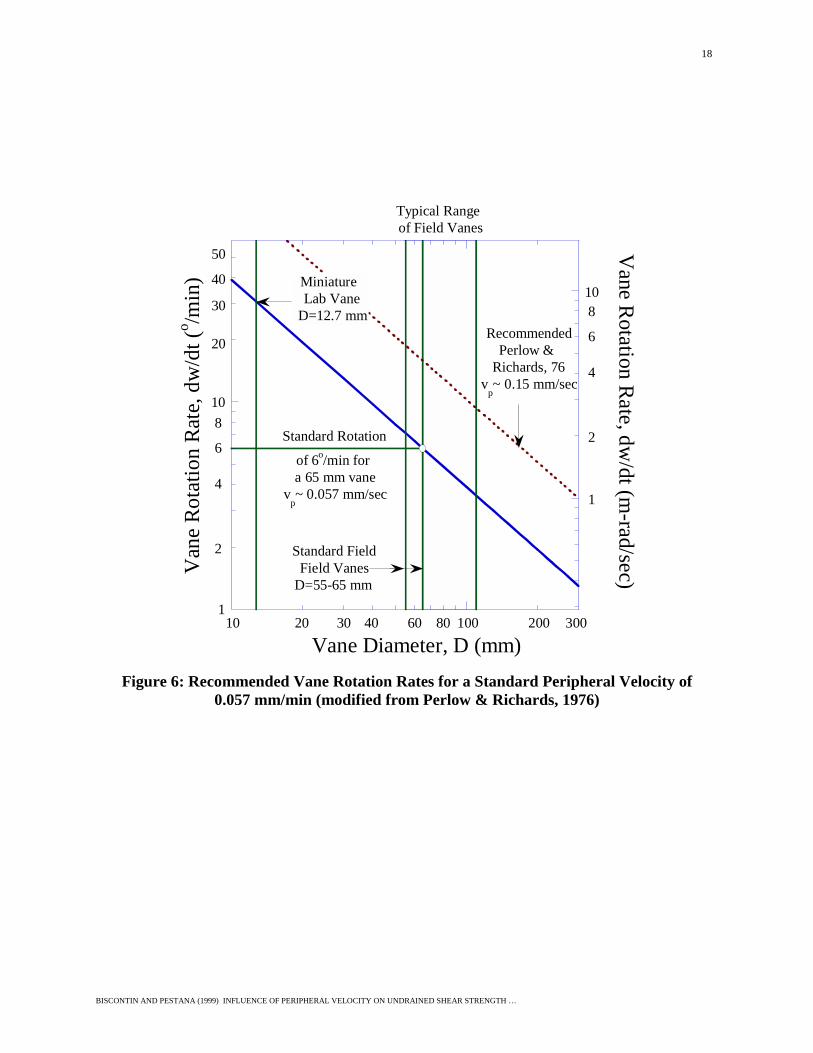
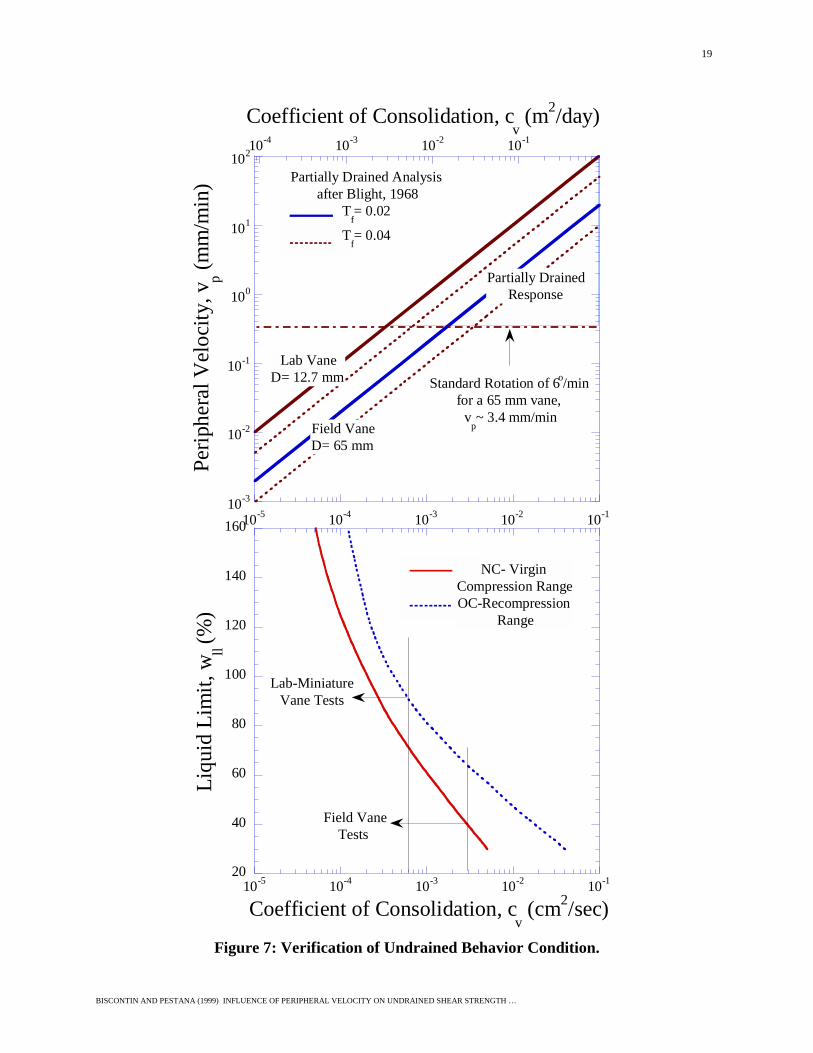
Partial Drainage EffectsFigure 6 shows the values of angular velocity as a function of vane diameter required to achievea standard peripheral velocity of 3.4 mm/min (~ 0.057 mm/sec). The figure also shows therecommended relationship by Perlow and Richards (1977) for a standard peripheral velocity of 9mm/min (0.15 mm/sec). The faster rate was proposed with the objective of achieving andmaintaining undrained response during testing for most soil types. Nevertheless, most of thecorrelations, including Bjerrum's correction for field vane results are based on a large databaseobtained at the conventional rate of 6o/min. Blight (1968) proposed a practical criterion to verifythat the degree of drainage is less than 10%:
04.002.0/ . 2 −<= DtcT fvf for essentially undrained conditions (5)
where Tf is the time factor at failure, tf is the time to failure and cv is the coefficient ofconsolidation. The problem of partial drainage arises especially in miniature vane tests, where Dis small and the drainage path becomes short, allowing consolidation to occur. For field vanesthe diameter is such that for the typical ranges of coefficient of consolidation and rotation ratesthe tests are always undrained. For the model soil used in this work, the cv was estimated to beapproximately 1.8 x10⁻⁵ m2/day (10 in2/yr) which ensures that tests are undrained for a time tofailure lower than 80 hours (Wartman, 1996). This criterion is illustrated in figure 7, where therate of peripheral velocity required to achieve a given time factor is related to the coefficient ofconsolidation of the soil, and is referred to as critical peripheral velocity. The figure containstwo sets of curves for a typical field vane (i.e., D= 65mm) and the laboratory miniature vane(i.e., D=12.7mm) and time factors of 0.02 and 0.04. These curves were obtained assuming anaverage angle of rotation at failure of 5o which has been reported by many authors and seems tobe conservative in this particular case. When the critical peripheral velocity exceeds the standardvelocity of 3.4 mm, partial drainage will affect the results of shear strength obtained with thevane apparatus. This will occur for coefficients of consolidation higher than 7x10⁻⁴ cm2/sec forminiature vanes and 3x10⁻³ cm2/sec for field vane tests. These limits will correspond(approximately) to liquid limits of 70 and 35-40% respectively for normally consolidated soilsbased on accepted correlations between this index property and cv. As can be seen from the
8
BISCONTIN AND PESTANA (1999) INFLUENCE OF PERIPHERAL VELOCITY ON UNDRAINED SHEAR STRENGTH …
figure, increases in peripheral velocity to 9 mm/min, as suggested by Perlow and Richards(1977), will only produce marginal benefits and it is not warranted.
Deformability of Soil- Estimation of Shear Modulus. Examples of the measured torque, T, versus angle of rotation, w, for the full range of peripheralvelocities are shown in figure 8. In general, peak condition of shear stress was reached for alltests between 3.5° to 5° with a very slight increase in the angle of rotation at failure withincreases in peripheral velocity. Time to failure was proportional to these values, approximatelybetween 0.1 seconds and 2 minutes. After peak the "stress-strain" curve shows an increase instrain softening response since the residual shear stress was approximately constant in all cases.
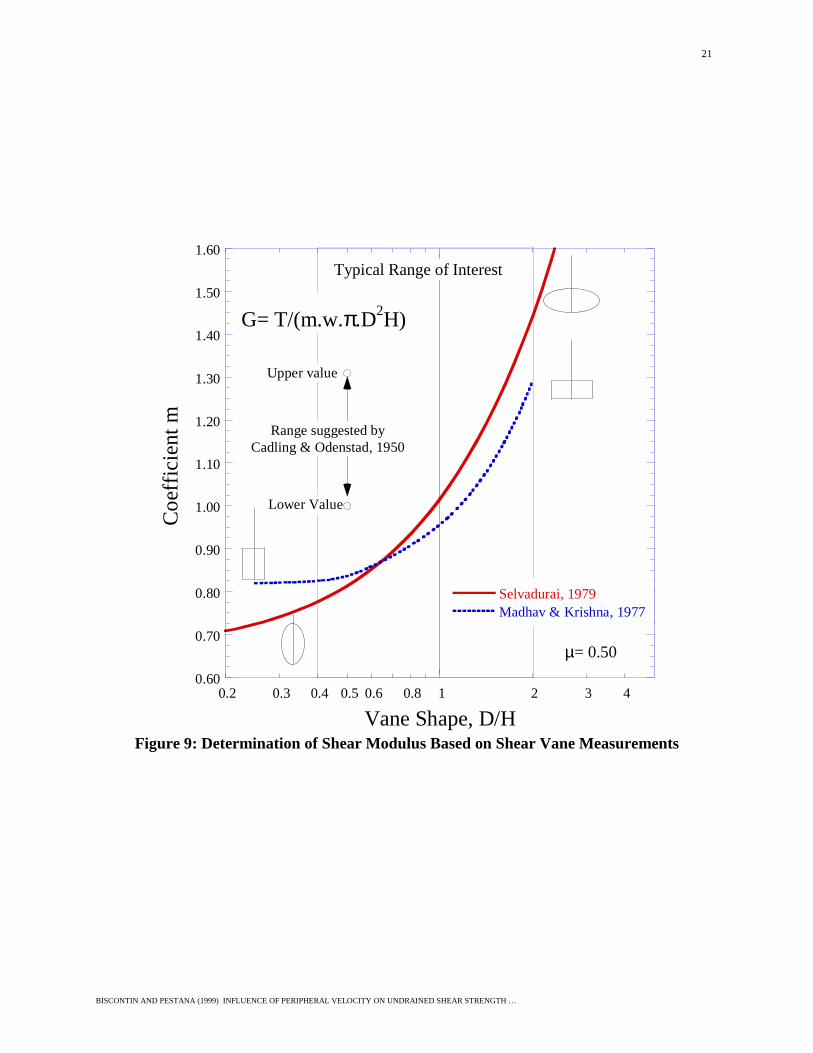
Several researchers have been advocating the use of torque vs. angle of rotation curves forestimating the shear modulus of the soil (Cadling and Odenstad,1950; Madhav and Krishna,1977; Selvadurai, 1979; Pamukcu and Suhayda, 1988). A detailed discussion of the differentmethods used is presented in appendix A. In general, the equivalent "secant" shear modulus, Gw,can be estimated as:
..)../(
DwmHDTG π= (6)
where w is the angle of rotation in radians and m is a coefficient function of the vane shape.Figure 9 compares predicted values of m using rectangular vanes (i.e., Madhav and Krishna,1977) and elliptical vanes (i.e., Selvadurai, 1979). As can be seen, m decreases from a value of0.95-1 for H/D=1 to a value of 0.80-85 for the common aspect ratio of H/D=2. The figure alsoshows the empirically estimated value originally proposed by Cadling and Odenstad (1950) forthe field vane and the typical range of interest for vanes used both in the lab and in the field.Based on these results a value of 0.80 was used in our analyses.
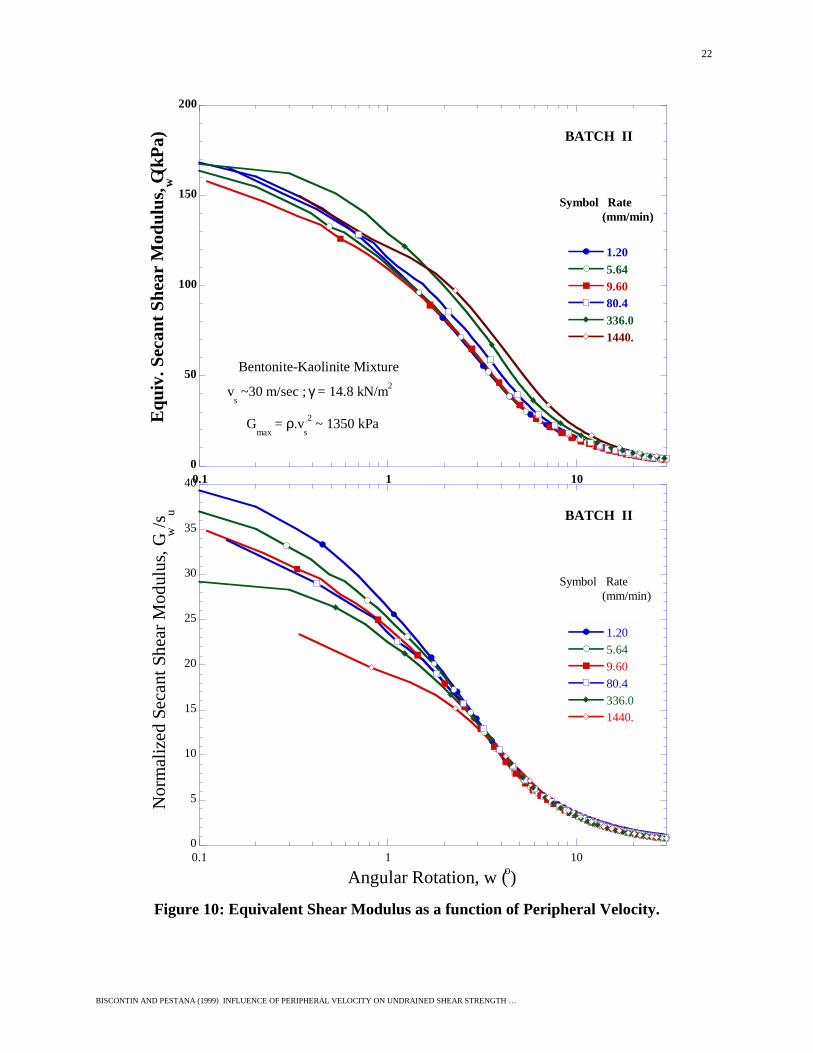
Figure 10a shows the equivalent "secant" shear modulus computed for batch II as a function ofthe angular rotation rate, w. Similar results were obtained for batch III. At small angles ofrotation, the estimated shear modulus was approximately constant with values ranging from 160to 170 kPa, which is much lower than the values estimated for the small strain shear modulus.Measurements of shear wave velocity using bender elements and estimated from the verticalarray in the soil profile in the shaking table (cf., figure 1) gave very consistent results rangingfrom 28-30 m/sec (~95-100 ft/sec) for batches II and III. These values of vs correspond to valuesof the small strain shear modulus, Gmax, in the order of 1400-1500 kPa. While the soil used inthis study is primarily a mixture of bentonite and kaolinite, a small fraction of "reactive" fly ashwas added in order to increase the shear wave velocity (with minimal increases in shear strength)and thus achieve the correct 1-g scaling of relevant soil properties for the shaking table (cf.,Meymand, 1998). The addition of fly ash results in a slight cementation in the soil whichincreases the shear wave velocity from about 16.5-18 m/sec (i.e., Gmax ~ 500 kPa, no fly ashadded) to approximately 30 m/sec achieved after 5 days of curing time. The low value of shearmodulus obtained can be partially explained by the disturbance (i.e., complete destruction of thecementation in the vicinity of the blades) caused by the insertion of the vane, corresponding tothe lowest value of Gmax of approximately 500 kPa, and by the inherent difficulty of measuringsmall angles of rotation (system compliance), particularly at the higher rates of rotation.Pamukcu and Suhayda (1988) used a similar expression (cf., equation 6, m=1) for a miniaturelaboratory shear vane with H/D=1 and report good correlation of their measurements withestimation of the small strain shear modulus, Gmax. They used a laser to obtain very precise

9
BISCONTIN AND PESTANA (1999) INFLUENCE OF PERIPHERAL VELOCITY ON UNDRAINED SHEAR STRENGTH …
rotation measurements but their technique required small rotation rates and therefore it was notapplicable for the range of rates used in this study.
For larger angles of rotation (w > 1o), on the other hand, it can be clearly seen that the equivalentshear modulus increases with increases in the values of peripheral velocity. Figure 10b showsthe equivalent secant shear modulus normalized by the undrained shear strength corresponding tothe respective value of vp. It is observed that for larger angles of rotation, the normalizedmodulus, Gw/su, is independent of the peripheral velocity and increases in secant stiffness are, byand large, accounted for by increases in the undrained strength. Since the secant stiffness atsmall strains is nearly constant, values of Gw/su decrease monotonically with increases inperipheral velocity.
CONCLUSIONS
The peripheral velocity in the vane test has a significant influence on measurements of undrainedstrength, su, especially at very high shearing rates representative to fast storm-wave loading andearthquake loading. For peripheral velocities less than 500-700 mm/min, the increase in su canbe described by either a power law or semi-logarithmic law in terms on the peripheral velocity.For the artificial clay used in this study, the increase in undrained strength per log cycle isapproximately 10% (α ~ 0.10, β ~ 0.055) and is similar to that reported for many soils in theliterature. For values of peripheral velocity higher than 600 mm/min, the undrained strengthincreases faster than that predicted by either model. The power law underestimates the changeby 10-20% for peripheral velocities of 1400 mm/minute, but gives a slightly better fit over theentire range. In contrast, the residual shear strength appears to be nearly independent of shearingrate. More testing in the same range of rotation rates is required for natural materials in order toextend the validity of these observations.
The 'torque-rotation’ curves obtained from the shear vane test can be used to estimatequalitatively the value of the secant shear modulus as a function of the shear deformation. Thestiffness at small strains is nearly constant, regardless of rotation rate, and it appears to representthe remoulded state of the soil after the insertion of the shear vane. As a result, the correspondingshear stiffness at small strains can be significantly lower that that estimated from shear wavevelocity measurements, especially for cemented materials. At higher angles of rotation thestiffness increases with increasing peripheral velocity but the normalized modulus, Gw/su, isnearly independent of the peripheral velocity. This observation suggests that changes in thesecant shear stiffness are, by and large, controlled by the increases in the undrained strength (i.e.,peak shear conditions).
ACKNOWLEDGEMENTS
Support for this research was provided by the second author's National Science FoundationCAREER award and by the research grant from the California Department of Transportationunder contract number DOT-RTA59A130, which are gratefully acknowledged. The authorsthank Professors Seed and Riemer for their help during the testing program.
10
BISCONTIN AND PESTANA (1999) INFLUENCE OF PERIPHERAL VELOCITY ON UNDRAINED SHEAR STRENGTH …
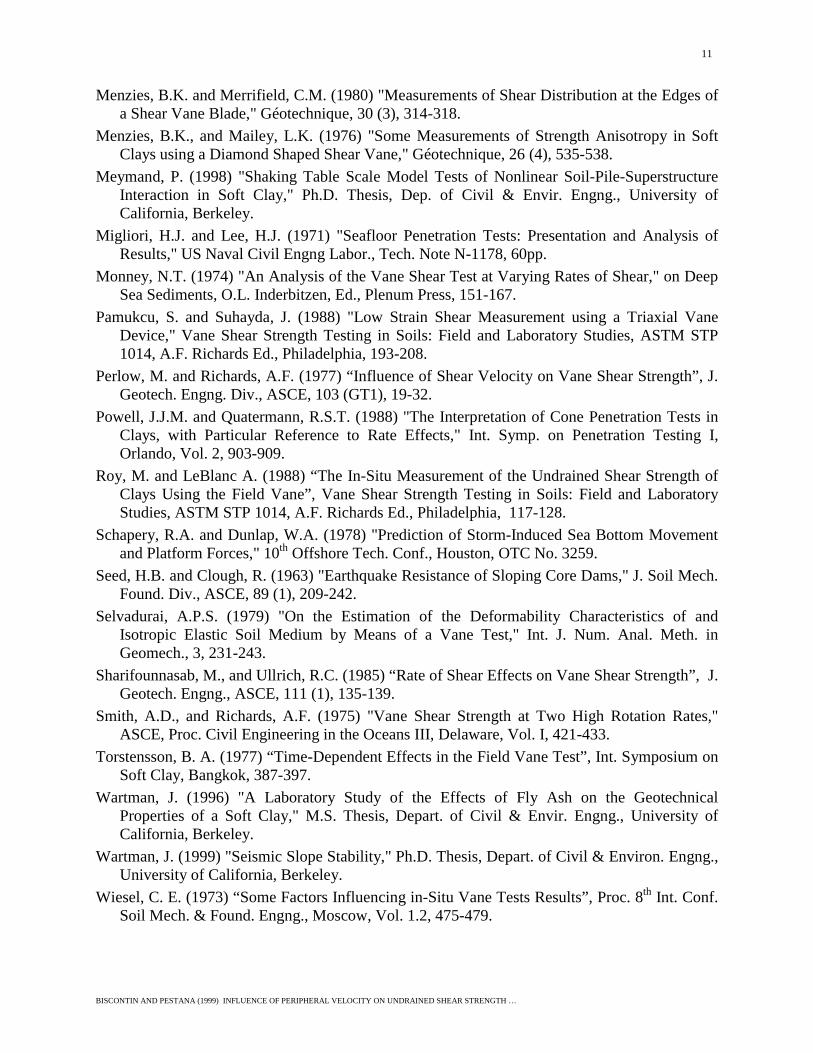
REFERENCESAas, G. (1965) “Study of the Effect of Vane Shape and Rate of Strain on Measured Values of In
Situ Shear Strength of Clays,” Proc. 6th Int. Conf. on Soil Mech. Found. Engng., Montreal,Vol. I., 141-145.
Aas, G., Lacasse, S., Lunne, T. and Høeg, K. (1986) "Use of In Situ Tests for Foundation Designon Clay,” Proc. ASCE Specialty Conf. In Situ, Blacksburg, Virginia, 1-30.
Arman, A., Poplin, J.K. and Ahmad, N. (1975) "Study of the Vane Shear," Proc. ASCE SpecialtyConf. on In Situ Measurements of Soil Properties, Rayleigh, North Carolina, Vol. I, 93-120.
Bjerrum, L. (1972) "Embankments on Soft Ground," Proc. Specialty Conf. of Earth and EarthSupported Structures, ASCE, Vol. II, 1-54.
Blight, G.E. (1968) "A Note on Field Vane Testing of Silty Soils", Can. Geotech. J., 5(3), 142-149.
Blight, G.E. (1977) "Influence of Shear Velocity on Vane Shear Strength”, J. Geotech. Engng.Div., ASCE, 103 (GT11), 1349-1350.
Cadling, L. and Odenstad, S. (1950) "The Vane Borer: an Apparatus for Determining the ShearStrength of Clay Soils Directly in the Ground," Royal Swedish Geotechnical Institute,Proceedings, Vol. 2, 1-87.
Campanella, R.G., and Robertson, P.K. (1981) "Applied Cone Research," ASCE NationalConvention. Cone Penetration Testing and Experience, St. Louis, 342-362.
Chandler R. J. (1988) “The In-Situ Measurement of the Undrained Shear Strength of ClaysUsing the Field Vane”, Vane Shear Strength Testing in Soils: Field and Laboratory Studies,ASTM STP 1014, A.F. Richards Ed., Philadelphia, 13-44.
DeAlencar, J.A., Chan, D.H. and Morgenstern N.R. (1988) "Progressive Failure in the VaneTest," Vane Shear Strength Testing in Soils: Field and Laboratory Studies, ASTM STP 1014,A.F. Richards, Ed., Philadelphia, 150-165.
Donald, I.B., Jordan, D.O., Parker, R.J., and Toh, C.T. (1977) "The Vane Test- A CriticalAppraisal," Proc. 9th Int. Conf. Soil Mech. & Found. Engng., Vol. I, 81-88.
Flaate, K. (1966)"Factors Influencing the Results of Vane Tests," Can. Geotech. J., 3(1), 18-31.Flodin, N. and Broms, B. (1981) "Historical Development of Civil Engineering in Soft Clays,"
Soft Clay Engineering, Brand and Brenner, Eds., Elsevier, 25-156.Halwachs, J.E. (1972) "Analysis of Sediment Shear Strength at Varying Rates of Shear," US.
Naval Academy, Trident Scholar Project Report, TSPR 28, 24 pp.Kulhawy, F.H. and Mayne, P.W. (1990) “Manual of Estimating Soil Properties for Foundation
Design,” Geotech. Engng. Group, Cornell University, Ithaca.Leroueil, S. and Marques, M.E.S. (1996) "Importance of Strain Rate and Temperature Effects in
Geotechnical Engineering," in Measuring and Modeling Time Dependent Soil Behavior,ASCE GSP 61, Sheahan, T.C. and Kaliakin, V.N. (Eds.), Washington D.C., 1-60.
Lok, T.M-H (1999) "Numerical Modeling of Seismic Soil-Pile-Superstructure Interaction in SoftClay," Ph.D. Thesis, Depart. of Civil & Envir. Engng., University of California, Berkeley.
Lunne, T. (1999) Personal Communication.Madhav, M.R., and Krishna, K.S.R. (1977) "Undrained Modulus from Vane Shear Tests," J.
Geotech. Engng. Div., ASCE, 103 (GT11), 1337-1340.
11
BISCONTIN AND PESTANA (1999) INFLUENCE OF PERIPHERAL VELOCITY ON UNDRAINED SHEAR STRENGTH …
Menzies, B.K. and Merrifield, C.M. (1980) "Measurements of Shear Distribution at the Edges ofa Shear Vane Blade," Géotechnique, 30 (3), 314-318.
Menzies, B.K., and Mailey, L.K. (1976) "Some Measurements of Strength Anisotropy in SoftClays using a Diamond Shaped Shear Vane," Géotechnique, 26 (4), 535-538.
Meymand, P. (1998) "Shaking Table Scale Model Tests of Nonlinear Soil-Pile-SuperstructureInteraction in Soft Clay," Ph.D. Thesis, Dep. of Civil & Envir. Engng., University ofCalifornia, Berkeley.
Migliori, H.J. and Lee, H.J. (1971) "Seafloor Penetration Tests: Presentation and Analysis ofResults," US Naval Civil Engng Labor., Tech. Note N-1178, 60pp.
Monney, N.T. (1974) "An Analysis of the Vane Shear Test at Varying Rates of Shear," on DeepSea Sediments, O.L. Inderbitzen, Ed., Plenum Press, 151-167.
Pamukcu, S. and Suhayda, J. (1988) "Low Strain Shear Measurement using a Triaxial VaneDevice," Vane Shear Strength Testing in Soils: Field and Laboratory Studies, ASTM STP1014, A.F. Richards Ed., Philadelphia, 193-208.
Perlow, M. and Richards, A.F. (1977) “Influence of Shear Velocity on Vane Shear Strength”, J.Geotech. Engng. Div., ASCE, 103 (GT1), 19-32.
Powell, J.J.M. and Quatermann, R.S.T. (1988) "The Interpretation of Cone Penetration Tests inClays, with Particular Reference to Rate Effects," Int. Symp. on Penetration Testing I,Orlando, Vol. 2, 903-909.
Roy, M. and LeBlanc A. (1988) “The In-Situ Measurement of the Undrained Shear Strength ofClays Using the Field Vane”, Vane Shear Strength Testing in Soils: Field and LaboratoryStudies, ASTM STP 1014, A.F. Richards Ed., Philadelphia, 117-128.
Schapery, R.A. and Dunlap, W.A. (1978) "Prediction of Storm-Induced Sea Bottom Movementand Platform Forces," 10th Offshore Tech. Conf., Houston, OTC No. 3259.
Seed, H.B. and Clough, R. (1963) "Earthquake Resistance of Sloping Core Dams," J. Soil Mech.Found. Div., ASCE, 89 (1), 209-242.
Selvadurai, A.P.S. (1979) "On the Estimation of the Deformability Characteristics of andIsotropic Elastic Soil Medium by Means of a Vane Test," Int. J. Num. Anal. Meth. inGeomech., 3, 231-243.
Sharifounnasab, M., and Ullrich, R.C. (1985) “Rate of Shear Effects on Vane Shear Strength”, J.Geotech. Engng., ASCE, 111 (1), 135-139.
Smith, A.D., and Richards, A.F. (1975) "Vane Shear Strength at Two High Rotation Rates,"ASCE, Proc. Civil Engineering in the Oceans III, Delaware, Vol. I, 421-433.
Torstensson, B. A. (1977) “Time-Dependent Effects in the Field Vane Test”, Int. Symposium onSoft Clay, Bangkok, 387-397.
Wartman, J. (1996) "A Laboratory Study of the Effects of Fly Ash on the GeotechnicalProperties of a Soft Clay," M.S. Thesis, Depart. of Civil & Envir. Engng., University ofCalifornia, Berkeley.
Wartman, J. (1999) "Seismic Slope Stability," Ph.D. Thesis, Depart. of Civil & Environ. Engng.,University of California, Berkeley.
Wiesel, C. E. (1973) “Some Factors Influencing in-Situ Vane Tests Results”, Proc. 8th Int. Conf.Soil Mech. & Found. Engng., Moscow, Vol. 1.2, 475-479.
12
BISCONTIN AND PESTANA (1999) INFLUENCE OF PERIPHERAL VELOCITY ON UNDRAINED SHEAR STRENGTH …
NOTATIONcv coefficient of consolidation;D diameter of the vane;H height of the vane;Gmax small strain shear modulus;Gw equivalent shear modulus based on torque-rotation measurements;su undrained strength;suv, suh undrained strength in vertical and horizontal planes, respectively;T measured torque;tf, Tf time to failure and Time factor at failure, respectively;vp, vp0 peripheral velocity and reference peripheral velocity, respectively;vs shear wave velocityw, w0 angular rotation rate and reference angular rotation rate, respectively;α, β constants for rate dependent models;ρ soil density.
Shear Vane Test Details Time Effect1
Clay Ip(%)
H/D D(mm)
Rate, w&(o/min)
αααα(%)(%)(%)(%)
ββββ Reference
Grangemouth ~22 1.5 50, 75 6- 300 5-6 0.025 Skempton, 1948Bromma ~31 2.5 80 6 - 600 ~20 0.086 Cadling & Odenstad, 1950
Åserum, Drammen,Lierstranda, Manglerud
8-9 ¼ - 4 65-130 6 - 60 ~1-2 0.006 Aas, 1965
Silts and clays(disturbed & remoulded)
- 2 12.7 6- 6726 – 720
~16±5
0.05±0.01
Migliori & Lee, 1971Halwachs, 1972
Skå Edeby 50-100 ¼ , ½, 1, 2
16.2, 65,130
0.06-600 3-6 0.02 Wiesel, 1973
BäckebolAskim
50-6580-90
2 65 ~0.0062
- 30012 0.05
±0.01Torstensson, 1977
Gulf of Maine & MexicoExuma Sound, Bahamas
- 2 12.7 21-79 1327
~0.05~0.10
Smith & Richards, 1975
San Diego silt ISan Diego silt II
Gulf of Maine clay
64
78
1,2
1,2
12.7,76,101
12.7,51,76
72- 79
21-79
362160
0.130.080.20
Perlow & Richards, 1977
Gulf of Mexico clay - 2 12.7 4.8-708 33 0.107 Schapery & Dunlap, 1978Pierre shale 103 1,1.5, 2 12.7 4.8- 107 12 0.05 Sharifounnasab &Ullrich, 1985
Saint-Louis de BeaucoursSaint-Alban clay
13-196-18
2 65 6 - 120 2-31
0.010.004 Roy & LeBlanc, 1988
Bentonite-Kaolinite mix 75 2 55 2-3000 15± 0.055 This workNote: Time elapsed after insertion of vane and performance of shear test is typically less than a minute to a few (<5) minutes.Wiesel and Torstensson performed tests with periods after insertion of vane ranging from 15 to 24 hrs.1. Parameters α and β refer to the time effect models described earlier. (i.e., su/su0= 1+αlog (v/v0); su/su0= (v/v0)β)2. Approximate conversion (actual rate reported in terms of time to failure)
Table 1: Previous Studies of Rate Effect on Undrained Shear Strength from Field Vane Tests
13
BISCONTIN AND PESTANA (1999) INFLUENCE OF PERIPHERAL VELOCITY ON UNDRAINED SHEAR STRENGTH …
115 120 125 130 135 140 145
0.0
0.5
1.0
1.5
2.0
Placement, ωc
ωc-Batch
Water Content, wc (%)
Dep
th (m
)Batch I
Batch II
Batch III
Target water content
5% range
a) Setup in the Large Shaking Table b) Water Content ProfileFigure 1: Schematic of Sampling Locations and Vertical Soil Profile.

14
BISCONTIN AND PESTANA (1999) INFLUENCE OF PERIPHERAL VELOCITY ON UNDRAINED SHEAR STRENGTH …
Figure 2: Schematic of Shear Vane Testing
15
BISCONTIN AND PESTANA (1999) INFLUENCE OF PERIPHERAL VELOCITY ON UNDRAINED SHEAR STRENGTH …
Symbol Stress Peak Residual
0
1
2
3
4
5
6
7
8
0.100 1.00 10.0 100 103
1 10 100 1000 104Sh
ear S
tress
(kPa
)
BATCH III
Rotation Rate (o/min) (*for 55mm blade diameter)
Reference Rate~ 3.4 mm/min
su/s
u0 = (v
p/v
p0)β
β= 0.05
Symbol Stress Peak Residual
0
1
2
3
4
5
6
7
0.100 1.00 10.0 100 103
Shea
r Stre
ss (k
Pa)
BATCH II
Reference Rate~ 3.4 mm/min
su/s
u0 = (v
p/v
p0)β
β= 0.05
Symbol Stress Peak Residual
0
1
2
3
4
5
6
7
0.100 1.00 10.0 100 103
Shea
r Stre
ss (k
Pa)
Peripheral Velocity, vp (mm/min)
BATCH I
Reference Rate~ 3.4 mm/min
su/s
u0 = (v
p/v
p0)β
β= 0.05
Figure 3: Peak and Undrained Residual Strength Measured from Vane Tests.
16
BISCONTIN AND PESTANA (1999) INFLUENCE OF PERIPHERAL VELOCITY ON UNDRAINED SHEAR STRENGTH …
Symbol Undrained Strength
Batches II & III
Batch I
0.0
0.5
1.0
1.5
2.0
1.00 10.0 100 103
1 10 100 1000 104N
orm
. Und
rain
ed S
hear
Stre
ngth
, su/s
u0
Peripheral Velocity, vp (mm/min)
Approximate Rotation Rate (o/min) (*for 55mm blade diameter)
Reference Rate~ 3.4 mm/min
Line Rate Effect Model
su/s
u0 = 1+ α.log (v
p/v
p0) ; α = 0.10
su/s
u0 = (v
p/v
p0) β ; β = 0.055
Typical Range of Interest for
Wave & Storm Loading
Typical Range of interest for
Earthquake Loading
Figure 4: Summary of Peak Conditions for Shear Vane Tests.
17
BISCONTIN AND PESTANA (1999) INFLUENCE OF PERIPHERAL VELOCITY ON UNDRAINED SHEAR STRENGTH …
Symbol Reference Soil
0.0
0.5
1.0
1.5
2.0
0.0100 0.100 1.00 10.0 100 103
This Work Bentonite-Kaolinite MixPerlow & Richards, 1977 San Diego Clay Wiesel, 1973 Ska EdebyTortensson, 1977 BackebolTortensson, 1977 AskimSchapery & Dunlap, 1978 Gulf Mexico
0.11101001000104
Nor
m. U
ndra
ined
She
ar S
treng
th, s
u/su0
Peripheral Velocity, vp (mm/min)
Reference Rate~ 3.4 mm/min
Rate Effect Model
su/s
u0 = (v
p/v
p0) β
Typical Range of
Interest for Earthquake
Loading
Typical Range of Interest for Wave& Storm Loading
0.05
0.10β =
Estimated Time to Failure, tf (minutes)
Figure 5: Normalized Undrained Shear Strength as a function of Peripheral Velocity.
18
BISCONTIN AND PESTANA (1999) INFLUENCE OF PERIPHERAL VELOCITY ON UNDRAINED SHEAR STRENGTH …
1
10
10 100
1
10
Van
e R
otat
ion
Rat
e, d
w/d
t (o /m
in)
Vane Diameter, D (mm)
Vane R
otation Rate, dw
/dt (m-rad/sec)
Miniature Lab Vane
D=12.7 mm
Standard FieldField Vanes
D=55-65 mm
Typical Range of Field Vanes
Standard Rotation
of 6o/min for a 65 mm vane
vp~ 0.057 mm/sec
RecommendedPerlow &
Richards, 76v
p~ 0.15 mm/sec
20
30
40
50
6
4
8
2
20 30 40 60 80 200 300
6
4
8
2
Figure 6: Recommended Vane Rotation Rates for a Standard Peripheral Velocity of0.057 mm/min (modified from Perlow & Richards, 1976)
19
BISCONTIN AND PESTANA (1999) INFLUENCE OF PERIPHERAL VELOCITY ON UNDRAINED SHEAR STRENGTH …
10-5 10-4 10-3 10-2 10-120
40
60
80
100
120
140
160
NC
OC
Coefficient of Consolidation, cv (cm2/sec)
Liqu
id L
imit,
wll
(%)
NC- Virgin Compression RangeOC-Recompression
Range
Field VaneTests
Lab-MiniatureVane Tests
10-3
10-2
10-1
100
101
102
10-5 10-4 10-3 10-2 10-1
10-4 10-3 10-2 10-1
Perip
hera
l Vel
ocity
, vp (m
m/m
in)
Coefficient of Consolidation, cv (m2/day)
Standard Rotation of 6o/minfor a 65 mm vane,
vp~ 3.4 mm/min
Field VaneD= 65 mm
Lab VaneD= 12.7 mm
Partially DrainedResponse
Partially Drained Analysisafter Blight, 1968
Tf= 0.02
Tf= 0.04
Figure 7: Verification of Undrained Behavior Condition.

20
BISCONTIN AND PESTANA (1999) INFLUENCE OF PERIPHERAL VELOCITY ON UNDRAINED SHEAR STRENGTH …
0.0
0.5
1.0
1.5
2.0
2.5
3.0
3.5
4.0
0.0 2.5 5.0 7.5 10.0 12.5 15.0 17.5 20.0
1.205.649.6080.4336.01440.
Mea
sure
d To
rque
, T (N
.m)
Symbol Rate (mm/min)
BATCH II
0.0
0.5
1.0
1.5
2.0
2.5
3.0
3.5
4.0
0.0 2.5 5.0 7.5 10.0 12.5 15.0 17.5 20.0
1.205.649.6080.4336.01400
Mea
sure
d To
rque
, T (N
.m)
Angular Rotation, w ( o )
Symbol Rate (mm/min)
BATCH III
Figure 8: Typical Shear Stress-Deformation Behavior for Vane Tests on Batches II & III
21
BISCONTIN AND PESTANA (1999) INFLUENCE OF PERIPHERAL VELOCITY ON UNDRAINED SHEAR STRENGTH …
0.60
0.70
0.80
0.90
1.00
1.10
1.20
1.30
1.40
1.50
1.60
0.2 0.3 0.4 0.5 0.6 0.8 1 2 3 4
Selvadurai, 1979Madhav & Krishna, 1977
Coe
ffic
ient
m
Vane Shape, D/H
G= T/(m.w.π.D2H)
Upper value
Lower Value
Range suggested byCadling & Odenstad, 1950
Typical Range of Interest
µ= 0.50
Figure 9: Determination of Shear Modulus Based on Shear Vane Measurements
22
BISCONTIN AND PESTANA (1999) INFLUENCE OF PERIPHERAL VELOCITY ON UNDRAINED SHEAR STRENGTH …
0
50
100
150
200
0.1 1 10
1.205.649.6080.4336.01440.
Equi
v. S
ecan
t She
ar M
odul
us, G w
(kPa
)
Symbol Rate (mm/min)
BATCH II
Bentonite-Kaolinite Mixture
vs ~30 m/sec ; γ = 14.8 kN/m2
Gmax
= ρ.vs2 ~ 1350 kPa
0
5
10
15
20
25
30
35
40
0.1 1 10
1.205.649.6080.4336.01440.
Nor
mal
ized
Sec
ant S
hear
Mod
ulus
, Gw/s
u
Angular Rotation, w (o)
Symbol Rate (mm/min)
BATCH II
Figure 10: Equivalent Shear Modulus as a function of Peripheral Velocity.
23
BISCONTIN AND PESTANA (1999) INFLUENCE OF PERIPHERAL VELOCITY ON UNDRAINED SHEAR STRENGTH …
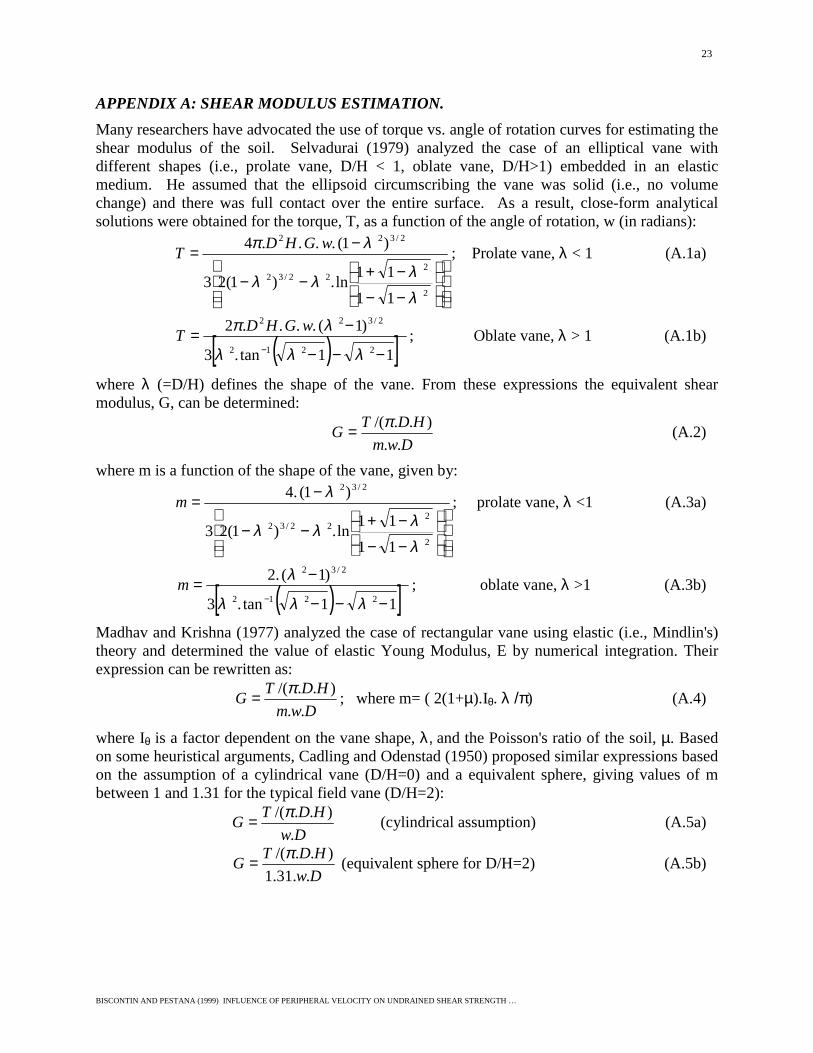
APPENDIX A: SHEAR MODULUS ESTIMATION.Many researchers have advocated the use of torque vs. angle of rotation curves for estimating theshear modulus of the soil. Selvadurai (1979) analyzed the case of an elliptical vane withdifferent shapes (i.e., prolate vane, D/H < 1, oblate vane, D/H>1) embedded in an elasticmedium. He assumed that the ellipsoid circumscribing the vane was solid (i.e., no volumechange) and there was full contact over the entire surface. As a result, close-form analyticalsolutions were obtained for the torque, T, as a function of the angle of rotation, w (in radians):
−−
−+−−
−=
2
222/32
2/322
11 11ln. ) 1(23
) 1( . . ..4
λλλλ
λπ wGHDT ; Prolate vane, λ < 1 (A.1a)
( )[ ] 2212
2/322
1 1 tan. 3
)1 ( . . ..2
−−−
−=− λλλ
λπ wGHDT ; Oblate vane, λ > 1 (A.1b)
where λ (=D/H) defines the shape of the vane. From these expressions the equivalent shearmodulus, G, can be determined:
..)../(
DwmHDTG π= (A.2)
where m is a function of the shape of the vane, given by:
−−
−+−−
−=
2
222/32
2/32
11 11ln. ) 1(23
) 1( .4
λλλλ
λm ; prolate vane, λ <1 (A.3a)
( )[ ] 2212
2/32
1 1 tan. 3
)1 ( .2
−−−
−=− λλλ
λm ; oblate vane, λ >1 (A.3b)
Madhav and Krishna (1977) analyzed the case of rectangular vane using elastic (i.e., Mindlin's)theory and determined the value of elastic Young Modulus, E by numerical integration. Theirexpression can be rewritten as:
..)../(
DwmHDTG π= ; where m= ( 2(1+µ).Iθ. λ /π) (A.4)
where Iθ is a factor dependent on the vane shape, λ, and the Poisson's ratio of the soil, µ. Basedon some heuristical arguments, Cadling and Odenstad (1950) proposed similar expressions basedon the assumption of a cylindrical vane (D/H=0) and a equivalent sphere, giving values of mbetween 1 and 1.31 for the typical field vane (D/H=2):
.)../(
DwHDTG π= (cylindrical assumption) (A.5a)
..31.1)../(
DwHDTG π= (equivalent sphere for D/H=2) (A.5b)
24
BISCONTIN AND PESTANA (1999) INFLUENCE OF PERIPHERAL VELOCITY ON UNDRAINED SHEAR STRENGTH …
APPENDIX B: SUMMARY OF RESULTS
TestPeripheralvelocity su (peak) su (residual)
Peripheralvelocity su (peak) su (residual)
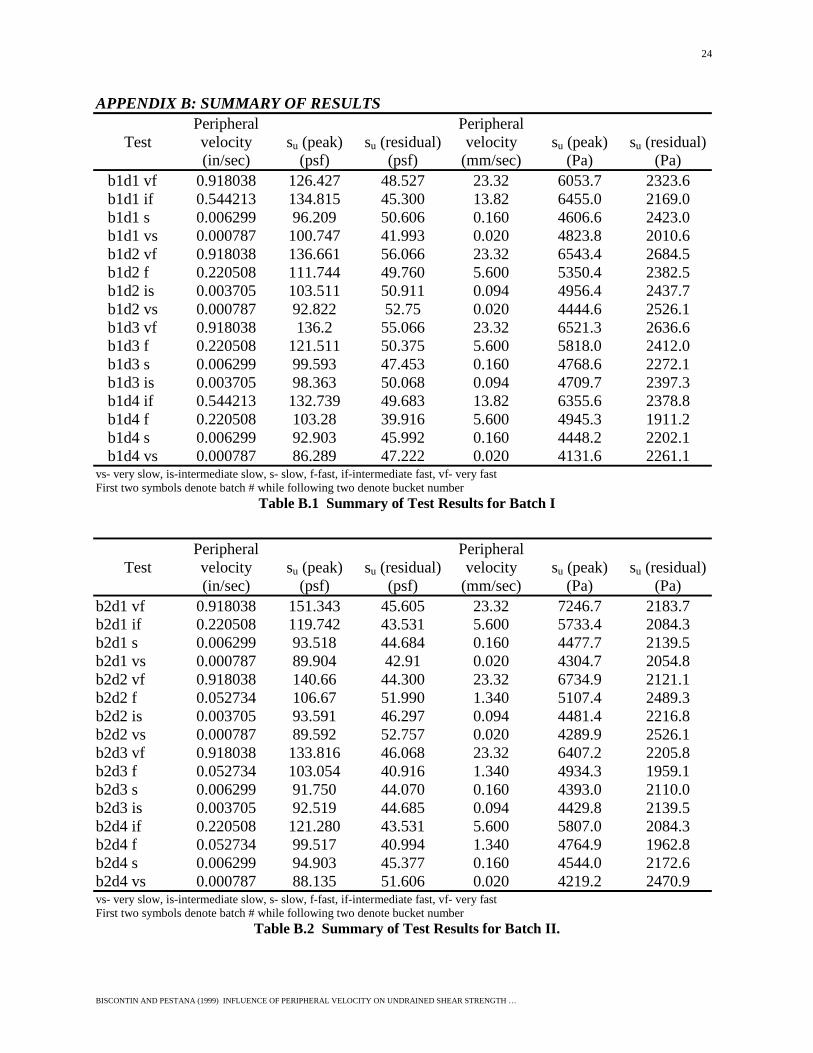
(in/sec) (psf) (psf) (mm/sec) (Pa) (Pa)b1d1 vf 0.918038 126.427 48.527 23.32 6053.7 2323.6b1d1 if 0.544213 134.815 45.300 13.82 6455.0 2169.0b1d1 s 0.006299 96.209 50.606 0.160 4606.6 2423.0b1d1 vs 0.000787 100.747 41.993 0.020 4823.8 2010.6b1d2 vf 0.918038 136.661 56.066 23.32 6543.4 2684.5b1d2 f 0.220508 111.744 49.760 5.600 5350.4 2382.5b1d2 is 0.003705 103.511 50.911 0.094 4956.4 2437.7b1d2 vs 0.000787 92.822 52.75 0.020 4444.6 2526.1b1d3 vf 0.918038 136.2 55.066 23.32 6521.3 2636.6b1d3 f 0.220508 121.511 50.375 5.600 5818.0 2412.0b1d3 s 0.006299 99.593 47.453 0.160 4768.6 2272.1b1d3 is 0.003705 98.363 50.068 0.094 4709.7 2397.3b1d4 if 0.544213 132.739 49.683 13.82 6355.6 2378.8b1d4 f 0.220508 103.28 39.916 5.600 4945.3 1911.2b1d4 s 0.006299 92.903 45.992 0.160 4448.2 2202.1b1d4 vs 0.000787 86.289 47.222 0.020 4131.6 2261.1
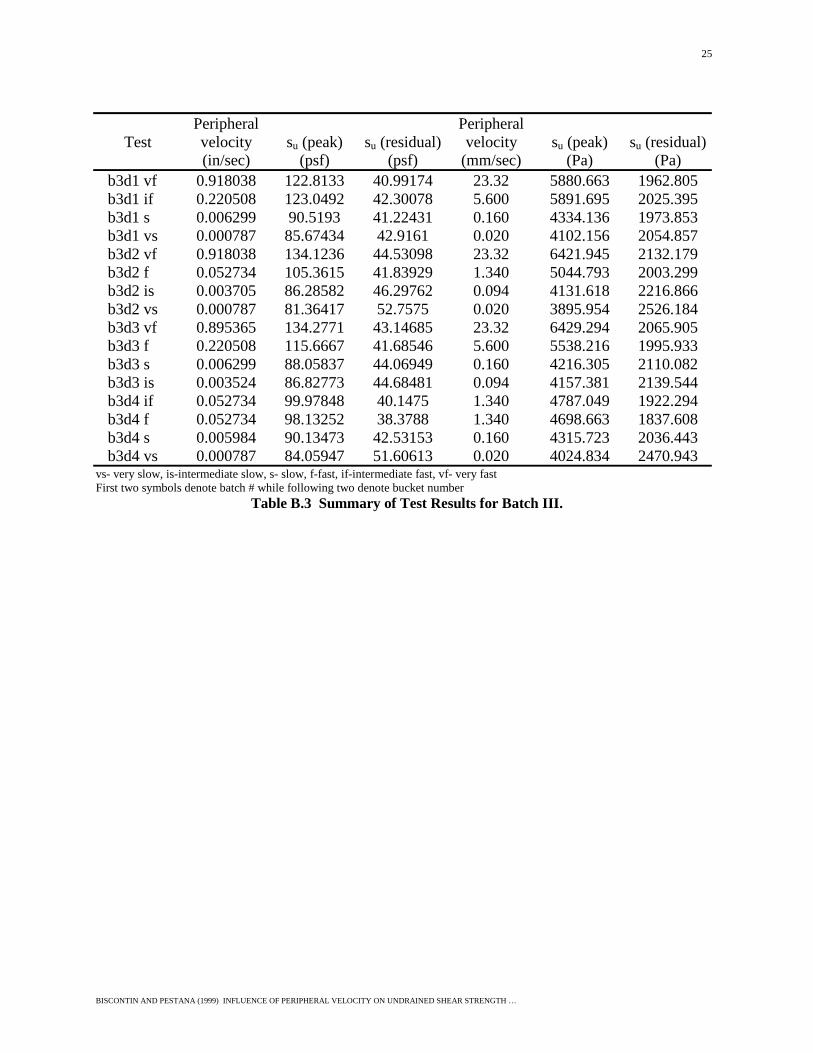
vs- very slow, is-intermediate slow, s- slow, f-fast, if-intermediate fast, vf- very fastFirst two symbols denote batch # while following two denote bucket number
Table B.1 Summary of Test Results for Batch I
TestPeripheralvelocity su (peak) su (residual)
Peripheralvelocity su (peak) su (residual)
(in/sec) (psf) (psf) (mm/sec) (Pa) (Pa)b2d1 vf 0.918038 151.343 45.605 23.32 7246.7 2183.7b2d1 if 0.220508 119.742 43.531 5.600 5733.4 2084.3b2d1 s 0.006299 93.518 44.684 0.160 4477.7 2139.5b2d1 vs 0.000787 89.904 42.91 0.020 4304.7 2054.8b2d2 vf 0.918038 140.66 44.300 23.32 6734.9 2121.1b2d2 f 0.052734 106.67 51.990 1.340 5107.4 2489.3b2d2 is 0.003705 93.591 46.297 0.094 4481.4 2216.8b2d2 vs 0.000787 89.592 52.757 0.020 4289.9 2526.1b2d3 vf 0.918038 133.816 46.068 23.32 6407.2 2205.8b2d3 f 0.052734 103.054 40.916 1.340 4934.3 1959.1b2d3 s 0.006299 91.750 44.070 0.160 4393.0 2110.0b2d3 is 0.003705 92.519 44.685 0.094 4429.8 2139.5b2d4 if 0.220508 121.280 43.531 5.600 5807.0 2084.3b2d4 f 0.052734 99.517 40.994 1.340 4764.9 1962.8b2d4 s 0.006299 94.903 45.377 0.160 4544.0 2172.6b2d4 vs 0.000787 88.135 51.606 0.020 4219.2 2470.9vs- very slow, is-intermediate slow, s- slow, f-fast, if-intermediate fast, vf- very fastFirst two symbols denote batch # while following two denote bucket number
Table B.2 Summary of Test Results for Batch II.
25
BISCONTIN AND PESTANA (1999) INFLUENCE OF PERIPHERAL VELOCITY ON UNDRAINED SHEAR STRENGTH …
TestPeripheralvelocity su (peak) su (residual)
Peripheralvelocity su (peak) su (residual)
(in/sec) (psf) (psf) (mm/sec) (Pa) (Pa)b3d1 vf 0.918038 122.8133 40.99174 23.32 5880.663 1962.805b3d1 if 0.220508 123.0492 42.30078 5.600 5891.695 2025.395b3d1 s 0.006299 90.5193 41.22431 0.160 4334.136 1973.853b3d1 vs 0.000787 85.67434 42.9161 0.020 4102.156 2054.857b3d2 vf 0.918038 134.1236 44.53098 23.32 6421.945 2132.179b3d2 f 0.052734 105.3615 41.83929 1.340 5044.793 2003.299b3d2 is 0.003705 86.28582 46.29762 0.094 4131.618 2216.866b3d2 vs 0.000787 81.36417 52.7575 0.020 3895.954 2526.184b3d3 vf 0.895365 134.2771 43.14685 23.32 6429.294 2065.905b3d3 f 0.220508 115.6667 41.68546 5.600 5538.216 1995.933b3d3 s 0.006299 88.05837 44.06949 0.160 4216.305 2110.082b3d3 is 0.003524 86.82773 44.68481 0.094 4157.381 2139.544b3d4 if 0.052734 99.97848 40.1475 1.340 4787.049 1922.294b3d4 f 0.052734 98.13252 38.3788 1.340 4698.663 1837.608b3d4 s 0.005984 90.13473 42.53153 0.160 4315.723 2036.443b3d4 vs 0.000787 84.05947 51.60613 0.020 4024.834 2470.943
vs- very slow, is-intermediate slow, s- slow, f-fast, if-intermediate fast, vf- very fastFirst two symbols denote batch # while following two denote bucket number
Table B.3 Summary of Test Results for Batch III.