influence of peat soils on runoff process: case study of...
TRANSCRIPT

Influence of peat soils on runoff process:case study of Vydra River headwaters, Czechia
lukáš vlček¹, jan kocum¹, bohumír janský¹,luděk šefrna¹, šárka blažková²
geografie 121/2 (2016)
¹ Charles University in Prague, Faculty of Science, Department of Physical Geography and Geo-ecology, Prague, Czechia; e-mail: [email protected], [email protected]² T.G. Masaryk Water Research Institute, Prague, Czechia
abstract This paper summarizes findings from the hydrological research in the Vydra River headwaters, the Šumava Mts., s-w Czechia, dealing with the hydrological function of local peat soils and their effect on the outflow from the basin. This study represents a part of a long-term research carried out at the Faculty of Science, Charles University in Prague. The paper shows how important it is to study the groundwater level in peat soils and its area in a catchment as well as to predict the outflow in distinct weather conditions. There were chosen four small experimental catchments with different peat and waterlogged forest coverage. Rainfall events were selected in various periods within a year with a varying groundwater level (maximum and minimum) in the peat bog. Within these situations flood wave volumes were calculated and all of them were compared regarding the peat bog extension. The presented research also compares various sources of data about peat soils areas and areas of waterlogged forest.
key words peat soils – Vydra River headwaters – soil saturation – groundwater level – Šumava Mts.
vlček, l., kocum, j., janský, b., šefrna, l., blažková, š. (2016): Influence of peat soils on runoff process: case study of Vydra River headwaters, Czechia. Geografie, 121, 2, 235–253.Received August 2014, accepted December 2015.
© Česká geografická společnost, z. s., 2016

236 geografie 121/2 (2016) / l. vlček, j. kocum, b. janský, l. šefrna, š. blažková
1. Introduction
Hydrological extremes occurring during last years have resulted in an increased discussion in professional spheres and they have been related to an urgent need to gradually solve them. The question of the influence of a peat and waterlogged soils on the hydrological regime of streams in Šumava Mts. has not been success-fully answered yet, regardless a number of projects and numerous arguments conducted in the professional spheres (Janský, Kocum 2008).
The headwaters of Otava River, Šumava Mts., and its source Vydra River are characterized by the occurrence of vast areas of mountain peat soils supplied predominantly by rain water. The phenomenon of presence of a particular type of a peat bog and peat soils in a particular area greatly influences the outflow forming. Therefore, the objective of a long-term research in the area logically has to be a detailed monitoring of rainfall – runoff processes and of processes occur-ring in the soil environment, for the purpose of understanding the complicated mechanism of outflow transformation.
The first hydrological survey in this area was done by Ferda et al. (1971), who was followed by Vlasák (2008) and Kocum (2012). These papers compared Vydra and Křemelná River catchments in terms of the runoff process and their differences were attributed into a role of a peat coverage. A more precise answer to the peat bog influence of the outflow in Vydra River catchment was given by Čurda, Janský, Kocum (2011), who described the effects of physical-geographical factors on a flood episode extremity in Vydra River basin. He compared two main sources of Vydra River – Modravský and Roklanský Brooks and confirmed the adverse effect of a peat bog. Also Hruška et al. (1996) focused on peat and its effect on the chemi-cal parameters of stream water in Czechia. However, none of them studied the distinct influence of saturated and unsaturated peat bogs in detail, everything was considered as a whole, mostly covering the area of 100 km². This study analyses basins of about 4 km² in area and focuses on runoff description in periods of the maximal and thr potentially lowest saturation of waterlogged areas.
Šumava Mts. have the largest peat bog areas not only in Czechia but in Central Europe as well, mostly due to its specific geology and morphology. All necessary conditions for upland peat bogs development can rather be found in Scotland or Scandinavia. Waterlogged areas in Central Europe are formed mostly in flat areas or valleys, for example in Biebrza in Poland (Wasser 1995) or in Western Slovakia (Juráková 2003), where hydrological and climatic conditions are different from the mountainous peat bogs. Therefore, hydrological processes in the peat bog areas in Šumava Mts. are rather to be compared with the Scotland or the Scandinavian peaty areas.
The dynamics of groundwater level in a peat and its interaction with the out-flow system has already been analyzed by other authors. Evans et al. (1999), who

influence of peat soils on runoff process: vydra river headwaters 237
studied blanked peat in the United Kingdom, says that the rapid generation of runoff occurs when water table levels at the monitoring side are within 5 cm of the surface and that the storm flow is generated above saturated catotelm. However, the whole catchment was covered just by blanked peat. Peat covers also the whole Scottish experimental catchment presented by Bragg (2002), where he focused on how local mires contribute to the outflow.
Many waterlogged areas in Europe have been drained for various agriculture purposes. The artificial impact has a distinct influence on water table fluctua-tion and on outflow from the catchment (Burke 1967; Holden, Wallage, McDonald 2001). Peat bogs in Vydra River basin were drained rarely and just unaffected catchments were used for the purpose of this study.
The hydrological behavior of a catchment has been described by several au-thors such as by Conway, Millar (1960). Such studies were carried out mainly in a blanked peat area with a specific hydrological regime. Similar type of catchment analysis in Šumava Mts. is still missing.
Therefore, this paper follows previous research in this area and focuses more in detail on the answers of the runoff behavior during rainfall events by using peat bog coverage or groundwater level data. The main aim of this study is to describe the be-havior of the outflow in diversely saturated conditions considering a different peat soils area. An emphasis is put on hydrological extreme periods, either extremely wet or extremely dry. The question of the hydrological function of present peat soils and waterlogged areas is essential to answer in order to correctly evaluate water retention possibilities in Šumava Mts. Several classifications and characteristics of a peat has been presented by a number of scientists (Němeček 2011, Bridges, Batjes, Nachergale 2006). In this study, the data of peat deposits coverage from the Research Institute for Soil and Water Conservation (RISWC) were used.
Various rainfall events in different peat saturation conditions were selected and four experimental basins within Vydra River basin were chosen as well to evaluate the influence of peat soils on hydrological environment: Ptačí Brook, Roklanský Brook, Rokytka Brook and Tmavý Brook. Within the scope of the research, avail-able data of groundwater level in peat bogs and data from automatic water stage recorders of the Faculty of Science, Charles University in Prague, in the profile under studied peat bog complex in 2008–2013 period, were used. The paper is also focused on a detailed monitoring of soil moisture and groundwater level in one of the chosen catchments.
2. Description of the experimental basins
The basins are situated in various parts of Vydra River headwaters. It is the basin of Ptačí Brook (A), Roklanský Brook (B), Rokytka Brook (C), and Tmavý Brook (D),

238 geografie 121/2 (2016) / l. vlček, j. kocum, b. janský, l. šefrna, š. blažková
see Figure 1. From the geological point of view, according to the tectonic zoning, the basins belong both to the area of Moldau-Danube elevation (moldanubikum, Svoboda et al. 1964). The bedrock consists of weathered metamorphic rock such as gneisses and of igneous rocks, represented mostly by granit. Quaternary sedi-ments can be found in valleys.
The basins are located at an elevation of approximately 1,100–1,300 meters above sea level. Their area and slope are similar with the exception of the Rokytka basin which is slightly flatter, see Table 1. The basins have similar soil and vegeta-tive conditions and most of the area was influenced by a bark beetle infestation. The biggest difference is the extent of peat soils.
2.1. Soil Conditions
Soils of experimental basins are typical examples of Šumava Mts. soils where a vertical sequence of several types of soil with Histosols on the ridges and basins
precipitation gaugeautomatic water level gaugewater course
experimental catchment boundary
subcatchment boundary
Tmavý p. (D)
Rokytka (C)
Roklanský p. (B)
Ptačí p. (A)
C Z E C H I A
0 4 km
Fig. 1 – Experimental catchment areas within the Vydra River basin

influence of peat soils on runoff process: vydra river headwaters 239
is typical. The basin is mostly covered by entic Podzol and organic soils. In certain lower parts of the basin, bogged Gley can be found. In the basin of Ptačí brook (A), even haplic Podzol is present. The area of waterlogged areas or other types of soils that are periodically saturated by water is an important variable in these parts of Šumava Mts. (as in other mountains in Czechia). These types of soils are mainly organic soils and their subtypes or their varieties.
2.2. Climatic Conditions
Climate in the area is variable, influenced both by the oceanic and the continental effect. The highest rainfall has been documented in the central part of Šumava Mts. (Březník 1,486–1,552 mm average during the last thirty years) and it is dis-tinctively different at the windward and the leeward side of the mountains due to the orographic effect (NP Šumava 2011). At the point of outlet of the Rokytka Brook basin, a climatic station has been established. In this article, the data about precipitation from 2008 to 2013 were used. The year of 2013 was drier than the others with daily precipitation about 3.4 mm, see Figure 2.
Tab. 1 – The basic description of the experimental catchments
Catchment Area (km²) Mean slope (°) Mean annual disch. (m³/s)
Ptačí (A) 4.09 5.59 0.15Roklanský (B) 3.39 5.36 0.19Rokytka (C) 3.82 3.58 0.18Tmavý (D) 4.77 5.79 0.20
−20
−15
−10
−5
0
5
10
15
20
25
0
10
20
30
40
50
60
70
1.11 1.12 1.1 1.2 1.3 1.4 1.5 1.6 1.7 1.8 1.9 1.10
(°C)
(mm
)
precipitationair temperature
Fig. 2 – Daily precipitation and mean temperature in the year of 2013 in Modrava village. The gauging station is heated so snow precipitation is also included during winter time.

240 geografie 121/2 (2016) / l. vlček, j. kocum, b. janský, l. šefrna, š. blažková
2.3. Vegetative Conditions
Basins are situated within Šumava National Park, more precisely they almost entirely belong to the park’s 1st zone of protection (NP Šumava 2011). The vegeta-tion can be divided into peat bog and forest (other). In the peat bog vegetation, mountain type of peat bogs are easily distinguishable. They are surrounded by wa-terlogged spruce forest and minerotrophic sedge peat soils. In the central parts of peat bogs, naturally non-forested areas are preserved. Their vegetation is formed by moss, cotton grass, mud sedge, or pod grass. Towards the edge of a peat bog, there are pine covers occuring on almost one third of peat bog areas. At the edge of peat bogs, smaller areas of waterlogged spruce forest are situated (Bufková 2009). The rest of the forest vegetation is mainly composed of spruce with the admixture of fir and beech, which is presented predominantly at the south-facing slopes. The forest is influenced by bark beetle. Due to keeping wood for decomposition, a “dead forest” is being slowly filled mainly by spruce self-seeding seedlings and grasses. The role of bark beetle calamity on the outflow is not confirmed.
3. Material and methods
3.1. Data Sources
Groundwater level data were recorded hourly in three most common types of saturated areas namely waterlogged spruce forest, peat covered with pine and peat covered with moss. The groundwater levels were measured by probes of Faculty of Science, Charles University in Prague (waterlogged forest, pine) and probe of Botany institute, AS Czechia (moss). These probes were installed in Rokytka Brook basin in the local peat bog. Discharges were measured by ultrasound probes installed at each outlet of the profile. Monitoring of water levels at the outlet of experimental basins is based on a system of automatic measuring stations by the company Fiedler-Mágr. The set comprises of control and registering units of the type M4016 and an ultra-sound or a pressure transducer with the connection to an appropriate measuring channel (Česák et al. 2008). The stations measure water levels every 10 minutes with an accuracy of 1 mm. Precipitation data were taken from four precipitation gauges in 10-min step, which were installed in various parts of the Vydra River catchment.
3.2. Applied Methods
Mapping of Waterlogged Areas: A determination of the spatial extent of water-logged areas is very complicated. A detailed field investigation yields the most

influence of peat soils on runoff process: vydra river headwaters 241
accurate results. Such investigations were reported for Rokytka Brook in Šumava Mts. (Vlček et al. 2012) and the same fieldwork was done in Ptačí Brook catchment. Due to the time demand, indirect methods need to be applied. In this case, data from the Research Institute for Soil and Water Conservation – VUMOP database of peat deposits were used. Data from the Typological Classification System of the Forest Management Institut – UHUL (Plíva 1987) were used for comparison only. A peat deposit (VUMOP data) is defined as having minimal depth of 30 cm. From the typological classification (UHUL data), waterlogged and peat bog ecological ranges were selected (T, G, R from Typological Classification) because they correlate with pedological studies of peat soils in the best way. Data from VUMOP were compared with field survey and they were well comparable, almost identical, so it is possible to use it as a data source of peat soil coverage.
Selection of Rainfall Events during Maximal and Minimal Saturation: Rainfall events were selected since year 2008 where all monitoring stations were installed. Continuous measuring of groundwater level (GWL) is only being performed in peat bogs in the Rokytka Brook basin, but the same occurrence of minima and maxima is anticipated in other basins. During the years of 2010, 2012 and 2013, the events were chosen easily due to the knowledge of GWL. During the years of 2008, 2009 and 2011 there was no GWL measuring, but the situation was solvable. The maximum catchment saturation was estimated from previous precipitation when there were events in a long-term rainfall period or after snow melting in spring. The estimation of minimal saturation was slightly complicated but it was solvable from GWL behavior as well. The events were chosen on the basis of duration for more than five days from the previous event, because between May and October it takes less than five days to empty a peat bog due to the evapotranspiration process. A problem occurs only with the upper small part of the peat bog where GWL may reach the bottom of the retention part only once a year and sometimes even not. However, ten events were selected during maximum saturation of the peat soil and nine during minimal saturation. Consquently, it was satisfying enough to find a trend.
4. Results
4.1. Mapping of Peat Soil Areas
In the basins of Ptačí (A) and Rokytka Brooks (C), a pedological study has been performed and the resulting retention potential of particular soil profiles was then interpolated onto the whole basin (Vlček et al. 2012). These results served as a basis for a selection of waterlogged areas from particular databases. The percentage representation is shown in Figure 3. Logically, the differences arise from the used

242 geografie 121/2 (2016) / l. vlček, j. kocum, b. janský, l. šefrna, š. blažková
methods of area mapping. The basin of Rokytka Brook (C) has potentially the big-gest peat soils area; the basin of Tmavý Brook (D) potok has the smallest one. Only within the VUMOP data Ptačí Brook (A) has the smallest area of a peat (Fig. 3).
The disposition of peat soil areas is better visible in Figure 4. Particular cat-egories correlate the best way in the basin of Roklanský Brook (B); the biggest difference in peat soil coverage is then in the basin of Ptačí Brook (A). It has been already mentioned, that the data from VUMOP were used for analysis. The basins are graphically zoomed together but their relative sizes are preserved.
4.2. Rainfall Events during Minimal Saturation
All rainfall events during minimal saturation and flood waves are shown in Figure 5. The chart describes flood wave volumes which occurred after a rainfall event in four experimental basins. In Šumava Mts., an event up to 10 mm is quite common in the whole area but it is very hard to find rainfall which covers all the catchments in the same time and starts after a long period without any rain. It occurs usually during summer like a storm event. Storms are mostly local covering only two catchments or there are some differences in the amount of precipitation. In that case, the precipitation gauge net helps. However, in the Figure 5 a different trend is shown: small areas covered with peat soils (basins A, D) result in higher flood wave (volume) than basins with peat soils coverage about 30%. The outflow is more or less similar up to 10–15 mm but at about 40 mm precipitation Roklanský (B) and Rokytka Brooks (C) produce higher flood wave volumes than Ptačí (A) and Tmavý Brooks (D).
0
10
20
30
40
50
60
Ptačí (A) Roklanský (B) Rokytka (C) Tmavý (D)
OR
R
G, R, T
(%)
Fig. 3 – Percentage of peat soil areas in experimental basins. OR means Organosol within the Re-search Institute for Soil and Water Conservation (VUMOP) database, R, G, T are ecological ranges taken from Typological Classification System of the Forest Management Institut (UHUL) database.

influence of peat soils on runoff process: vydra river headwaters 243
As an example of the minimal groundwater level, an event in August 2012, when the evapotranspiration is the highest, was chosen. For more detailed analysis, an event from the 21st August 2012 was chosen, when the GWL in the probe reached about 15 cm below the surface before the rain began and it had been 14 days since the last rainfall occurred. The whole monthly situation can be seen in Figure 6. For a better illustration, only the data from Rokytka (C) and Tmavý Brooks (D), which are examples of the largest and of the smallest waterlogged areas, are shown. At the first sight, the difference is obvious; Tmavý Brook (D) creates a wave but in the case of Rokytka Brook (C) the wave is almost unnoticeable (Fig. 6).
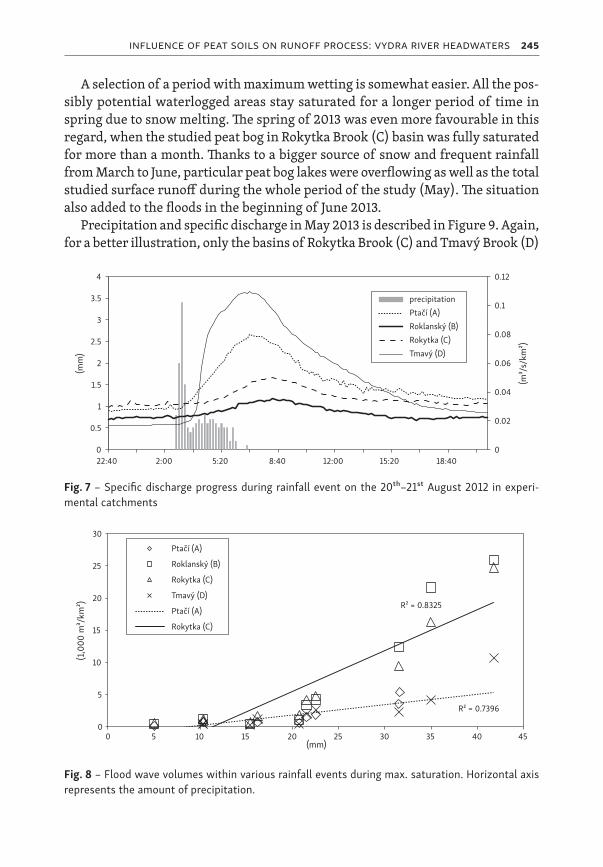
A more detailed analysis of the situation is presented in Figure 7. During this event, the rainfall amount was approximately 17 mm in total in about 6 hours after 14 days of drought. It is visible that the basins of Ptačí (A) and Tmavý Brooks (D) create a flood wave, where the specific discharge at the peak flow rate
catchment boundary
R ÚHUL
T, G ÚHUL
OR VÚMOP
Rokytka (C)
Roklanský p. (B)
Tmavý p. (D)
Ptačí p. (A)
0 1 km
Fig. 4 – Waterlogged areas from VUMOP and UHUL databases

244 geografie 121/2 (2016) / l. vlček, j. kocum, b. janský, l. šefrna, š. blažková
is considerably higher than before the beginning. On the contrary, the basins of Rokytka (C) and Roklanský Brooks (B) barely create a flood wave.
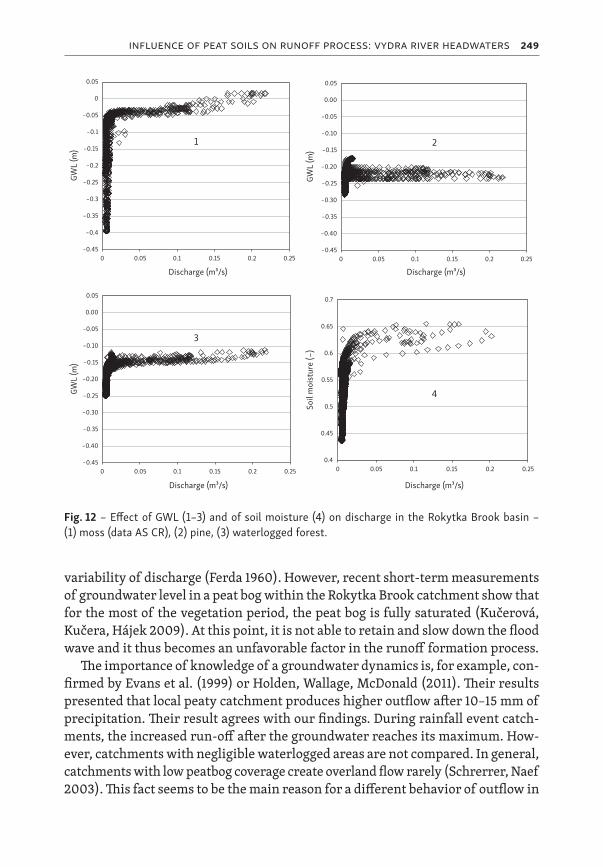
4.3. Rainfall Events during Maximal Saturation
Differences in flood wave volume during maximum saturation are visible in Figure 8. It is easy to see that the retention ability begins to vary from 15–20 mm of a rainfall amount but quite early the difference is doubled.
R² = 0.8832
R² = 0.9071
0
5
10
15
20
25
30
0 5 10 15 20 25 30 35 40 45
(1,0
00 m
³/km
²)
(mm)
Ptačí (A)
Roklanský (B)
Rokytka (C)
Tmavý (D)
Ptačí (A)
Rokytka (C)
Fig. 5 – Flood wave volumes during various rainfall events during min. saturation. Horizontal axis represents the amount of precipitation.
0
0.5
1
1.5
2
2.5
3
3.5
40
0.1
0.2
0.3
0.4
0.5
0.6
0.7
0.8
6.8 11.8 16.8 21.8 26.8 31.8 5.9
(mm
)
(m³/s
/km
²)
Rokytka (C)
Tmavý potok (D)
precipitation
Fig. 6 – Specific discharge of Rokytka (C) and Tmavý Brooks (D) in August 2012
influence of peat soils on runoff process: vydra river headwaters 245
A selection of a period with maximum wetting is somewhat easier. All the pos-sibly potential waterlogged areas stay saturated for a longer period of time in spring due to snow melting. The spring of 2013 was even more favourable in this regard, when the studied peat bog in Rokytka Brook (C) basin was fully saturated for more than a month. Thanks to a bigger source of snow and frequent rainfall from March to June, particular peat bog lakes were overflowing as well as the total studied surface runoff during the whole period of the study (May). The situation also added to the floods in the beginning of June 2013.
Precipitation and specific discharge in May 2013 is described in Figure 9. Again, for a better illustration, only the basins of Rokytka Brook (C) and Tmavý Brook (D)
0
0.02
0.04
0.06
0.08
0.1
0.12
0
0.5
1
1.5
2
2.5
3
3.5
4
22:40 2:00 5:20 8:40 12:00 15:20 18:40
(m³/s
/km
²)
(mm
)
precipitationPtačí (A)Roklanský (B)Rokytka (C)Tmavý (D)
Fig. 7 – Specific discharge progress during rainfall event on the 20th–21st August 2012 in experi-mental catchments
R² = 0.7396
R² = 0.8325
0
5
10
15
20
25
30
0 5 10 15 20 25 30 35 40 45
(1,0
00 m
³/km
²)
(mm)
Ptačí (A)
Roklanský (B)
Rokytka (C)
Tmavý (D)
Ptačí (A)
Rokytka (C)
Fig. 8 – Flood wave volumes within various rainfall events during max. saturation. Horizontal axis represents the amount of precipitation.

246 geografie 121/2 (2016) / l. vlček, j. kocum, b. janský, l. šefrna, š. blažková
are shown. A totally different behavior of specific discharge is visible and Rokytka Brook (C), the basin with the most waterlogged areas, exhibits the greatest change (Fig. 9).
For more detailed analysis, an event from the 10th May 2013 was chosen (see Fig. 10). Snow has melted approximately a week before this event. The total pre-cipitation was about 16 mm. Even here, different behavior is seen compared to the period of drought. In regard of the volume, both Roklanský (B) and Rokytka Brooks (C) show a bigger increase of the specific discharge, while Tmavý and Ptačí Brooks show similar discharges as in the period of drought. For better imagination, the difference between the basins, the volumes of the flood wave are shown in Table 2, where Vd means flood wave volume during dry event and Vsa during maximal
0
0.5
1
1.5
2
2.5
30
0.1
0.2
0.3
0.4
0.5
0.6
0.7
3.5 8.5 13.5 18.5 23.5 28.5 2.6
(mm
)
(m³/s
/km
²)
Rokytka (C)
Tmavý potok (D)
precipitation
Fig. 9 – Specific discharge of Rokytka Brook (C) and Tmavý Brook (D) in May 2013
0
0.04
0.08
0.12
0.16
0.2
0
0.2
0.4
0.6
0.8
1
1.2
7:00 10:20 13:40 17:00 20:20 23:40 3:00 6:20(m
³/s/k
m²)
(mm
)
precipitationPtačí (A)Roklanský (B)Rokytka (C)Tmavý (D)
Fig. 10 – Specific discharge progress during rainfall event on the 10th–11th May 2013 in experimental catchments

influence of peat soils on runoff process: vydra river headwaters 247
saturation. Moreover, there are specific volumes (m³/km²) as well. The volume of the rainfall was estimated to be 17 mm and multiplied by the area of each basin (events 20.8.2012 and 10.5.2013).
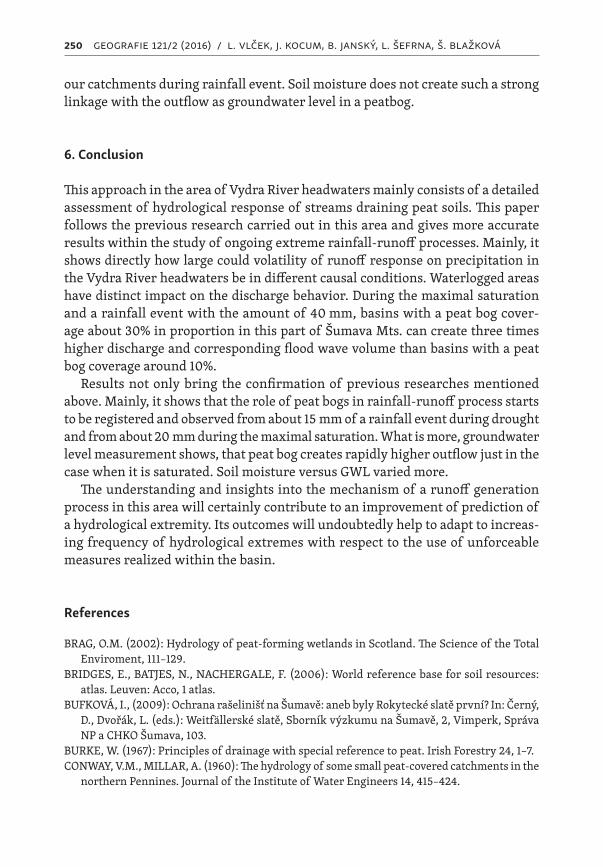
To confirm the influence of peat bog in small catchment, three groundwater level probes in peat bog and two tensiometers in two depths (20 and 60 cm) in terrestrial soil were installed in the Rokytka Brook (C) catchment, see Figure 11. In this basin, the groundwater level and soil moisture are measured.
Results from the Rokytka Brook (C) catchment are shown below in Figure 12. The relationship of groundwater level in a peat bog (Fig. 12-1, 2, 3) and soil moisture (Fig. 12-4) with discharge from the Rokytka Brook (C) catchment, is shown there. GWL probes are installed in the peat bog in three sites with different land-cover. Probe 1 (Fig. 12-1) is situated in the upper part of the peat bog covered with moss and cotton grass, middle part 2 (Fig. 12-2) with pine, and lower part 3 (Fig. 12-3)
Tensiometer
GWL measurement, probe 1
Discharge measurement
Stream
Peat soil area
1
12
3
Fig. 11 – The scheme of Rokytka Brook catchment with installed measuring devices

248 geografie 121/2 (2016) / l. vlček, j. kocum, b. janský, l. šefrna, š. blažková
with spruce waterlogged forest. The effect of different vegetation on GWL (or vice versa) was studied by Kučerová, Kučera, Hájek (2009) but only in upper part 1, and with the focuse on evapotranspiration. It is possible to see, that the relationship of the outflow with groundwater level is closer than with soil moisture. Each of the peat bog’s part has its own value (border) of GWL, when it causes volatility of the outflow. The most direct border line is presented in the upper part 1. If we focus on the soil moisture, it gives us more varied response. Moreover, from laboratory pF curves measurement, Θs (saturated moisture) was 0.675 in average and many high discharges occured in non-saturated period.
5. Discussion
Waterlogged areas in Central Europe are mostly formed in valleys or in flat areas generally, e.g. in Biebrza locality in Poland (Wasser 1995) or in Western Slovakia (Juráková, Klementová 2003). However, climatic and hydrological conditions are very different from the mountainous peat bog localities. Moreover, they worked only at one catchment. Outcomes from different studies within a literature must be comparable in order to discuss the topic properly. From a narrow comparable literature review, diverse opinions on the influence of peat bogs and waterlogged areas on the formation of runoff are apparent (Ferda et al. 1971). From the older articles (Spirhanzl 1951, Ferda 1960), the reason seems to be the ignorance of dy-namics of groundwater level within the peat bogs, which determines significantly the behavior of flood waves or water supply during a period of drought. Results in this paper confirm unfavourable impact of waterlogged areas on discharge in this area.
This paper gives a comparison of two “extreme” periods in terms of a ground-water level. It proves that when the level of groundwater is low, a peat bog is able to hold a great amount of water and thus to reduce the development of a flood wave. This fact confirms Ferda’s theory which states that bogs reduce the
Tab. 2 – Flood wave volumes during 2 different events regarding maximal and minimal level of peat saturation
Catchment Area(km²)
V prec.(m³)
Vd(m³)
Vd(m³/km²)
Vsa(m³)
Vsa(m³/km²)
Ptačí (A) 4.09 71,606 12,467 3,048 24,595 6,014Roklanský (B) 3.38 59,267 984 258 31,935 9,448Rokytka (C) 3.81 66,770 1,676 496 35,649 9,357Tmavý (D) 4.76 83,466 5,224 1,098 23,304 4,896
Note: Vd –flood wave volume during dry event, Vsa – flood wave volume during maximal saturation.
influence of peat soils on runoff process: vydra river headwaters 249
variability of discharge (Ferda 1960). However, recent short-term measurements of groundwater level in a peat bog within the Rokytka Brook catchment show that for the most of the vegetation period, the peat bog is fully saturated (Kučerová, Kučera, Hájek 2009). At this point, it is not able to retain and slow down the flood wave and it thus becomes an unfavorable factor in the runoff formation process.
The importance of knowledge of a groundwater dynamics is, for example, con-firmed by Evans et al. (1999) or Holden, Wallage, McDonald (2011). Their results presented that local peaty catchment produces higher outflow after 10–15 mm of precipitation. Their result agrees with our findings. During rainfall event catch-ments, the increased run-off after the groundwater reaches its maximum. How-ever, catchments with negligible waterlogged areas are not compared. In general, catchments with low peatbog coverage create overland flow rarely (Schrerrer, Naef 2003). This fact seems to be the main reason for a different behavior of outflow in
−0.45
−0.40
−0.35
−0.30
−0.25
−0.20
−0.15
−0.10
−0.05
0.00
0.05
0 0.05 0.1 0.15 0.2 0.25
GWL
(m)
Discharge (m³/s)
2
−0.45
−0.4
−0.35
−0.3
−0.25
−0.2
−0.15
−0.1
−0.05
0
0.05
0 0.05 0.1 0.15 0.2 0.25
GWL
(m)
Discharge (m³/s)
1
−0.45
−0.40
−0.35
−0.30
−0.25
−0.20
−0.15
−0.10
−0.05
0.00
0.05
0 0.05 0.1 0.15 0.2 0.25
GWL
(m)
Discharge (m³/s)
3
0.4
0.45
0.5
0.55
0.6
0.65
0.7
0 0.05 0.1 0.15 0.2 0.25
Soil
moi
stur
e (–
)
Discharge (m³/s)
4
Fig. 12 – Effect of GWL (1–3) and of soil moisture (4) on discharge in the Rokytka Brook basin – (1) moss (data AS CR), (2) pine, (3) waterlogged forest.
250 geografie 121/2 (2016) / l. vlček, j. kocum, b. janský, l. šefrna, š. blažková
our catchments during rainfall event. Soil moisture does not create such a strong linkage with the outflow as groundwater level in a peatbog.
6. Conclusion
This approach in the area of Vydra River headwaters mainly consists of a detailed assessment of hydrological response of streams draining peat soils. This paper follows the previous research carried out in this area and gives more accurate results within the study of ongoing extreme rainfall-runoff processes. Mainly, it shows directly how large could volatility of runoff response on precipitation in the Vydra River headwaters be in different causal conditions. Waterlogged areas have distinct impact on the discharge behavior. During the maximal saturation and a rainfall event with the amount of 40 mm, basins with a peat bog cover-age about 30% in proportion in this part of Šumava Mts. can create three times higher discharge and corresponding flood wave volume than basins with a peat bog coverage around 10%.
Results not only bring the confirmation of previous researches mentioned above. Mainly, it shows that the role of peat bogs in rainfall-runoff process starts to be registered and observed from about 15 mm of a rainfall event during drought and from about 20 mm during the maximal saturation. What is more, groundwater level measurement shows, that peat bog creates rapidly higher outflow just in the case when it is saturated. Soil moisture versus GWL varied more.
The understanding and insights into the mechanism of a runoff generation process in this area will certainly contribute to an improvement of prediction of a hydrological extremity. Its outcomes will undoubtedly help to adapt to increas-ing frequency of hydrological extremes with respect to the use of unforceable measures realized within the basin.
References
BRAG, O.M. (2002): Hydrology of peat-forming wetlands in Scotland. The Science of the Total Enviroment, 111–129.
BRIDGES, E., BATJES, N., NACHERGALE, F. (2006): World reference base for soil resources: atlas. Leuven: Acco, 1 atlas.
BUFKOVA, I., (2009): Ochrana rašelinišť na Šumavě: aneb byly Rokytecké slatě první? In: Černý, D., Dvořák, L. (eds.): Weitfällerské slatě, Sborník výzkumu na Šumavě, 2, Vimperk, Správa NP a CHKO Šumava, 103.
BURKE, W. (1967): Principles of drainage with special reference to peat. Irish Forestry 24, 1–7.CONWAY, V.M., MILLAR, A. (1960): The hydrology of some small peat-covered catchments in the
northern Pennines. Journal of the Institute of Water Engineers 14, 415–424.

influence of peat soils on runoff process: vydra river headwaters 251
ČESAK, J., KOCUM, J., KLIMENT, Z., JENÍČEK M. (2008): Monitoring odtokového režimu v pra-menných oblastech toků. In: Langhammer, J. (ed.): Změny v krajině a povodňové riziko. Sborník příspěvků semináře Povodně a změny v krajině. PřF UK, Praha, 80–85.
ČURDA, J., JANSKÝ, B., KOCUM, J. (2011): Vliv fyzickogeografických faktorů na extremitu po-vodní v povodí Vydry. Geografie, 116, 3, 335–353.
EVANS, M.G., BURT, T.P., HOLDEN, J., ADAMSON, J.K. (1999): Runoff generation and water table fluctuations in blanket peat: evidence from UK data spanning the dry summer of 1995. Journal of Hydrology, 221, 141–160.
FERDA, J. (1960): Hydrologický význam horských vrchovištních rašelinišť. Sborník ČSAZV – Lesnictví, Praha, 10, 835–856.
FERDA, J., HLADNÝ, J., BUBENÍČKOVA, L., PEŠEK, L. (1971): Odtokový režim a chemismus vod v povodí Horní Otavy se zaměřením na výskyt rašelinišť. Sborník prací HMÚ, 17, HMÚ, Praha, 22–126.
HOLDEN, J., WALLAGE Z.E., McDONALD, A.T. (2001): Water table dynamics in undisturbed, drained and restored blanket peat. Journal of Hydrology, 15, 103–114.
HRUŠKA, J. et al. (1996): Role of organic solutes in the chemistry of acid-impacted bog waters of the western Czech Republic. Water Resources Reasearch, 32, 9, 2841–2851.
JANSKÝ, J., KOCUM, J. (2008): Peat bogs influence on runoff process: case study of the Vydra and Křemelná River basins in the Šumava Mountains, southwestern Czechia. Geografie, 113, 4, 383–399.
JURAKOVA, M., KLEMENTOVA, E. (2003): Status and trends of the wetlands in west Slovakia. Slovac Journal of Civil Ingeneering, 3, 1–8.
KOCUM, J. (2012): Tvorba odtoku a jeho dynamika v pramenné oblasti Otavy. Praha. PhD. Thesis. Charles University in Prague, Faculty of Science.
KUČEROVA, A., KUČERA, T., HAJEK, T. (2009): Mikroklima a kolísání hladiny podzemní vody v centrální části Rokytecké slati. In: Černý, D., Dvořák, L. (eds.): Weitfällerské slatě. Sborník z výzkumu na Šumavě, 2. Správa NP, CHKO Šumava, Vimperk, 103.
NĚMEČEK, J. (2011): Taxonomický klasifikační systém půd České republiky. ČZU, Praha.NP Šumava (2011): www.npsumava.cz (20.1.2011).PLÍVA, K. (1987): Typologický klasifikační systém ÚHUL. ÚHUL Brandýs nad Labem.SCHRERRER, S., NAEF, F. (2003): A dicision scheme to indicate dominant hydrological flow
processes on temperate grassland. Hydrological processes, 17.SPIRHANZL, J. (1951): Rašelina: její vznik, těžba a využití. Přírodovědecké nakladatelství, Praha.SVOBODA, J. et al. (1964): Regionální geologie ČSSR. Český masív. Nakladatelství České akademie
věd, Praha.VLASAK, T. (2008): Návrh databanky v povodí Otavy a její využití v protipovodňové ochraně.
PhD. Thesis. KFGG, Přírodoědecká fakulta UK, Praha, 144.VLČEK, L. et al. (2012): Retenční potenciál a hydrologická bilance horského vrchoviště: případo-
vá studie Rokytecké slatě, povodí horní Otavy, jz Česko. Geografie, 117, 4, 371–395.WASSER, M.J. (1995): Hydrology, water chemistry and nutrient accumulation in the Biebrza fens
and floodplains (Poland). Wetlands Ecology and Management. 2, 125–137.

252 geografie 121/2 (2016) / l. vlček, j. kocum, b. janský, l. šefrna, š. blažková
shrnutí
Vliv rašelinných půd na odtokový process: případová studie pramenná oblast Vydry, Česko
Studium hydrologických extrémů se stalo jedním z prioritních témat světové hydrologie, ze-jména v posledních dvaceti letech, kdy identifikujeme změny odtokového procesu jako jeden z důsledků změny klimatu. Extremita odtoku výrazně narůstá i v podmínkách střední Evropy, a to v případě četnějších povodňový událostí i častějších a hlubších období hydrologického su-cha. Účinná ochrana před těmito jevy spočívá především ve správném pochopení mechanismu srážko-odtokového procesu v daném regionu. Pramenná oblast Otavy reprezentuje zdrojové území formování extrémních odtokových událostí a území s vysokou heterogenitou ve smyslu fyzickogeografických a socioekonomických aspektů. Dlouhodobá izolace této oblasti podmínila současný stav našich poznatků, kdy zde nemohl být proveden podrobný výzkum tohoto typu. Ten byl v minulosti zaměřen pouze na posouzení hydrologické funkce rašelinišť, které před-stavují významný fenomén především v povodí horní Vydry. Příspěvek potvrzuje fakt, že pro pochopení a objasnění procesu tvorby odtoku je klíčové detailně sledovat také hladinu podzemní vody v rašeliništních půdách či podíl tohoto typu půd v povodí, jakož i predikovat odtokovou odezvu při různých příčinných situacích.
Hlavním cílem práce je porovnat, jakým způsobem dochází v povodích s různou plochou rašelinišť k formování odtoku během minimálního a maximálního nasycení vrchovišť. V rámci studie byla vybrána čtyři malá experimentální povodí s různou rozlohou rašeliništních půd a zamokřených ploch lesa. Srážkové události byly vytipovány v různých částech roku při různé výšce hladiny podzemní vody ve vrchovišti. Během těchto situací byly vypočteny objemy povod-ňových vln a ty byly porovnány ve vztahu k rozloze vrchovišť v daném povodí.
Výstupy dokazují, že při nízké hladině podzemní vody je vrchoviště schopno pojmout velké množství vody a redukovat tak vývoj povodňové vlny. Dále pak poukazují na to, jak velká může být extremita odtokové odezvy na srážkový úhrn ve studované oblasti během různých příčin-ných podmínek. Získané poznatky potvrzují a podporují výsledky nedávných studií (Janský, Kocum 2008; Čurda, Janský, Kocum 2011 a Kocum 2012). Zamokřené plochy mají výrazný dopad na chování odtoku. Měření hladiny podzemní vody ukazuje, že existence vrchoviště rapidně navyšuje odtok pouze v případě, když je nasyceno. Při maximálním nasycení a úhrnu srážek ve výši kolem 40 mm mohou povodí s podílem vrchovišť 30 % a více v této části Šumavy generovat i 3krát vyšší průtok a odpovídající objem povodňové vlny než povodí s 10% pokrytím rašeliništi. Ze současných relativně krátkodobých měření hladiny podzemní vody ve vrchovišti v povodí Rokytky vyplývá, že po většinu vegetačního období jsou ovšem vrchovištní komplexy plně nasyceny (Kučerová, Kučera, Hájek 2009). V tom případě není vrchoviště schopno pojmout a zpomalit vývoj povodňové vlny a proto se tak stává nepříznivým faktorem v procesu tvorby odtoku. Další důležitá proměnná je reprezentována charakteristikami daného vrchoviště, pře-devším stupněm jeho vývoje a zásobováním vodou (Bragg 2002). V povodí horní Vydry lze ve většině případů nalézt rašeliniště plněné srážkovou vodou. Příspěvek rovněž zdůrazňuje, že rozloha zamokřených ploch v povodí je důležitější než jejich morfometrické parametry, jako jsou např. svahové charakteristiky.
Pochopení a objasnění mechanismu tvorby odtoku v této oblasti dokáže zcela určitě pomoci ke zlepšení predikce a ochrany před těmito extrémními jevy. Výsledky takového výzkumu před-stavují klíčový faktor jejich účinné eliminace v souvislosti s využitím nenásilných opatření, která se dají v povodí realizovat.

influence of peat soils on runoff process: vydra river headwaters 253
Obr. 1 Lokalizace experimentálních povodí v rámci povodí Vydry.Obr. 2 Denní úhrny srážek a průměrné denní teploty vzduchu v roce 2013 v obci Modrava.
Vzhledem k vytápění srážkoměru jsou registrovány rovněž sněhové úhrny v zimním období.
Obr. 3 Procentuální podíl vrchovišť v jednotlivých experimentálních povodích. OR – organosol (databáze VÚMOP); R, G, T – ekologické stupně (databáze ÚHUL).
Obr. 4 Výskyt zamokřených ploch na základě databází VÚMOP a ÚHUL.Obr. 5 Objemy povodňových vln během různých srážkových událostí a minimální saturaci
vrchovišť. Horizontální osa představuje úhrn srážek.Obr. 6 Specifický odtok v profilech na Rokytce (C) a na Tmavém potoce (D) v srpnu 2012.Obr. 7 Vývoj specifického odtoku během srážkové události ve dnech 20.–21. 8. 2012 v jednot-
livých experimentálních povodích.Obr. 8 Objemy povodňových vln během různých srážkových událostí a maximální saturaci
vrchovišť. Horizontální osa představuje úhrn srážek.Obr. 9 Specifický odtok v profilech na Rokytce (C) a na Tmavém potoce (D) v květnu 2013.Obr. 10 Vývoj specifického odtoku během srážkové události ve dnech 10.–11. 5. 2013 v jednotli-
vých experimentálních povodích.Obr. 11 Schéma povodí Rokytky s instalovanými měřícími přístroji.Obr. 12 Vliv hladiny podzemní vody (1–3) a půdní vlhkosti (4) na odtok v profilu Rokytka. 1 –
rašeliník (data AS CR), 2 – kleč, 3 – podmáčený les.
acknowledgments
This article is supported by the Grant Agency of the Czech Republic under the project GAČR 13-32133S “Headwaters retention potential assessment with respect to hydrological extremes” The authors acknowledge the financial assistance on this project.Authors greatly thank to Botany institute AS CR and to Ing. Březina for help and data supply.