influence of oxygen transfer on benzaldehyde lyase...
TRANSCRIPT

INFLUENCE OF OXYGEN TRANSFER ON BENZALDEHYDE LYASE PRODUCTION BY RECOMBINANT Escherichia coli BL21(DE3)
pLySs
A THESIS SUBMITTED TO THE GRADUATE SCHOOL OF NATURAL AND APPLIED SCIENCES
OF MIDDLE EAST TECHNICAL UNIVERSITY
BY
VAHIDEH ANGARDI
IN PARTIAL FULFILLMENT OF THE REQUIREMENTS FOR
THE DEGREE OF MASTER OF SCIENCE IN
CHEMICAL ENGINEERING
SEPTEMBER 2007
i

Approval of thesis: INFLUENCE OF OXYGEN TRANSFER ON BENZALDEHYDE LYASE PRODUCTION BY RECOMBINANT Escherichia coli BL21(DE3) pLySs Submitted by Vahideh Angardi in partial fulfillment of the requirements for
the degree of Master of Science in Chemical Engineering Department,
Middle East Technical University by,
Prof. Dr. Canan Özgen ________
Dean, Graduate School of Natural and Applied Sciences
Prof. Dr. Nurcan Baç ________
Head of Department, Chemical Engineering
Prof. Dr. Pınar Çalık ________
Supervisor, Chemical Engineering Dept., METU
Prof. Dr. Tunçer H. Özdamar ________
Co-Supervisor, Chemical Engineering Dept., Ankara University
Examining Committee Members:
Prof. Dr. Tunçer H. Özdamar _____________________
Chemical Engineering Dept., Ankara University
Prof. Dr. Pınar Çalık _____________________
Chemical Engineering Dept., METU
Prof. Dr. Timur Doğu _____________________
Chemical Engineering Dept., METU
Prof.Dr.Dilek Sanin _____________________
Environmental Engineering Dept., METU
Assoc.Prof.Dr. Nihal Aydoğan ____________________
ii
Chemical Engineering Dept., Hacettepe University
Date: 05.09.2007
I hereby declare that all information in this document has been obtained and presented in accordance with academic rules and ethical conduct. I also declare that, as required by these rules and conduct, I have fully cited and referenced all material and results that are not original to this work. Name, Last name : Vahideh ANGARDI Signature :
iii
iv
ABSTRACT
INFLUENCE OF OXYGEN TRANSFER ON BENZALDEHYDE LYASE
PRODUCTION BY RECOMBINANT Escherichia coli BL21(DE3)
pLySs
Angardi, Vahideh
M.S., Department of Chemical Engineering
Supervisor : Prof. Dr. Pınar Çalık
Co-Supervisor : Prof. Dr. Tunçer H. Özdamar
September 2007, 95 pages
In this study, the effects of oxygen transfer conditions on the synthesis of the
enzyme benzaldehyde lyase as intracellular in recombinant E. coli BL21 (DE3)
pLysS was investigated sistematically and a comprehensive model was
developed to determine benzaldehyde lyase activity. For this purpose, the
research program was carried out in mainly two parts. In the first part of
study, the effects of oxygen transfer together with the mass transfer
coefficient (KLa), enhancement factor E (=KLa/KLao), volumetric oxygen
transfer rate, volumetric and specific oxygen uptake rates, mass transfer and
biochemical reaction resistances; moreover, the variation in product and by-
product distribution, specific substrate uptake rates, yield and maintenance
coefficient were investigated in the pilot scale batch bioreactor at QO/VR = 0.5
vvm and agitation rates of N= 250, 500, 625, and 750 min-1, and dissolved
oxygen levels DO= 20%, 40% conditions, while medium components were
CGlucose= 8.0 kg m-3, C(NH4)2HPO4= 5.0 kg m-3 and salt solution at controlled
pHc=7.2. The highest cell concentration and benzaldehyde lyase activity were
obtained at DO=40% condition as 3.0 kg m-3 and A=1095 Ucm-3, respectively.

v
Then a mathematical model was proposed to estimate benzaldehyde
lyase activity as function of time, agitation rate, cell concentration, dissolved
oxygen concentration, and by-product concentration with reasonable accuracy.
Keywords: Benzaldehyde Lyase, Production, Recombinant E. coli, Oxygen
Transfer, Mathematical Model.

vi
ÖZ
REKOMBİNANT Escherichia coli BL21(DE3) pLySs İLE OKSİJEN AKTARIMININ BENZALDEHİT LİYAZ ÜRETİMİNE ETKİSİ
Angardi, Vahideh
Yüksek Lisans, Kimya Mühendisliği
Tez Yöneticisi : Prof. Dr. Pınar Çalık
Ortak Tez Yöneticisi : Prof. Dr. Tunçer H. Özdamar
Eylül 2007, 95 Sayfa
Bu çalışmada rekombinant Eschericihia coli BL21 (DE3) pLysS ile oksijen
aktarımının benzaldehit liyaz üretime etkisi araştırılmıştır ve modellenmiştir.
Araştırmanın birinci alt-propgramında laboratuvar ölçekte bulunan en uygun
koşullarda, VR=1.65 dm3 hacimli, mekanik karıştırmalı, pH, sıcaklık,
çözünmüş oksijen ve karıştırma hızı kontrollü pilot-ölçek kesikli
biyoreaktörlerde QO/VR = 0.5 vvm hava giriş hızında ve N= 250, 500, 625,
and 750 dk-1 karıştırma hızlarında ve çözünmüş oksijen DO= 20%, 40%
koşullarında oksijen aktarım etkileri yan ürün dağılımları ile birlikte incelenmiş,
oksijen aktarımı ve biyoproses karakteristikleri belirlenmiştir. En yüksek hücre
derişimi ve benzaldehit liyaz üretimi CGlukoz= 8.0 kg m-3, C(NH4)2HPO4= 5.0 kg m-
3 ; pHc=7.2 ve DO=40%’da sırasıyla 3.0 kg m-3 ve A=1095 Ucm-3 olarak
bulunmuştur. İkinci alt-programda, benzaldehit liyaz aktivitesi zaman,
karıştırma hızına, hücre derişimi çözünmüş oksijen derişimi ve yan ürün
derişimlerine bağlı matematik modelle ifade edilmiştir.
Anahtar Kelimeler: Benzaldehit Liyaz, Üretim, Rekombinant E. coli, Oksijen
Aktarımı, Matematik Model.

vii
To My Family
And
My Husband

viii
ACKNOWLEDGEMENTS
I would like to express my sincere appreciation and deepest gratitude to Prof.
Dr. Pınar Çalık who is my scientific advisor and philosophical mentor for her
guidance, encouragement and patience through my graduate school years. I
cannot thank her enough for all the support she has provided me for the
successful completion of this present work.
I wish to thank to Prof. Dr. H. Tunçer Özdamar and Prof. Dr. Güzide Çalık for
their valuable comments and for giving me the opportunity to perform the
HPCE analysis in Ankara University.
I am grateful to my friends and laboratory members, Mahmet Ali Orman, Işik
Haykir, Nuriye Korkmaz, Hande Levent, Arda Büyüksungur, Hande Kaya, Eda
Çelik and also to Ayşegül Ersayın Yaşınokfor for all their support, great
friendship, advice and encouragement throughout my graduate program.
My deepest appreciation goes to my family and my husband for their endless
love, support, patience and understanding throughout my life.

ix
TABLE OF CONTENTS
ABSTRACT .............................................................................................. iv
ÖZ .........................................................................................................vi
DEDICATION .......................................................................................... vii
ACKNOWLEDGEMENTS............................................................................ viii
TABLE OF CONTENTS................................................................................ ix
LIST OF TABLES...................................................................................... xii
LIST OF FIGURES................................................................................... xiii
NOMENCLATURE ..................................................................................... xv CHAPTER
1. INTRODUCTION ................................................................................... 1
2. LITERATURE SURVEY ............................................................................ 7
2.1 Enzymes ........................................................................................ 7
2.1.1 General Characteristics ............................................................. 7
2.1.2 Classification of Enzymes .......................................................... 8
2.1.3 Enzyme Activity ....................................................................... 9
2.1.4 Enzyme Kinetics......................................................................10
2.2 Benzaldehyde Lyase........................................................................11
2.3 Bioprocess Parameters in Enzyme Production .....................................16 2.3.1 Microorganism ........................................................................17 2.3.1.1 Escherichia coli.............................................................17 2.3.1.2 Cell Growth, Kinetics and Yield Factors.............................18 2.3.2 Medium Composition ...............................................................25 2.3.3 Bioreactor Operation Parameters ...............................................27

x
2.3.3.1 Temperature ................................................................27 2.3.3.2 pH..............................................................................28 2.3.3.3 Oxygen Transfer...........................................................29
2.3.3.3.1 Measurement of kLa .........................................30
2.3.3.3.2 The Oxygen Transfer Characteristics ..................33
3. MATERIALS AND METHODS...................................................................36
3.1 Chemicals......................................................................................36
3.2 The Microorganism .........................................................................36
3.3 The Solid Medium...........................................................................36
3.4 The Precultivation Medium ...............................................................37
3.5 The Production Medium ...................................................................38
3.6 Analysis ........................................................................................39 3.6.1 Cell Concentration ...................................................................39 3.6.2 Benzaldehyde Lyase Activity .....................................................39 3.6.3 Reduced Sugar Concentration ...................................................40 3.6.4 Organic Acids Concentrations....................................................41
3.6.5 Amino Acids Concentrations......................................................42
3.6.6 Liquid Phase Mass Transfer Coefficient and Oxygen Uptake Rate ....43
3.6.7 Saturation oxygen concentrations..............................................43
4. RESULTS AND DISCUSSION.................................................................44
4.1 Oxygen Transfer Effects...................................................................44 4.1.1 Dissolved Oxygen....................................................................45
4.2 Cell Growth Profiles ........................................................................48 4.3 Glucose Concentration Profiles .........................................................49
4.4 Benzaldehyde Lyase Activity Profiles .................................................51
4.5 Organic Acid Concentration Profiles............................................... ....52
4.6 Amino Acid Concentration Profiles.....................................................57
4.7 Oxygen transfer characteristics ........................................................59 4.8 Specific Growth Rate, Yield and Maintenance Coefficients .....................66
4.9 mathematical Modeling to Estimate Benzaldehyde Lyase Activity...........71 4.9.1 The Dimensionless Analysis to calculate Cx, Co2, and CBP ................73
4.9.2 Development of the Proposed Model ..........................................74

xi
4.9.2.1 Selecting and sorting relevant and proper data .................74
4.9.2.2 Multiple Regression Analysis ...........................................74
4.9.3 Model Application ....................................................................77
5. CONCLUSION......................................................................................82
REFERENCES..........................................................................................87
APPENDICES ..........................................................................................94
A. Calibration of Escherichia coli concentration ............................................94
B. Calibration of Reduced Sugar Concentration ............................................95
xii
LIST OF TABLES
TABLE
2.1 International classification of enzymes................................................... 9
2.2 Definition of yield coefficients ..............................................................21
3.1 The composition of solid medium. ........................................................37
3.2 The composition of the precultivation medium .......................................37
3.3 The composition of BAL production medium...........................................38
4.1 Oxygen transfer conditions and their abbreviations.................................45
4.2 Organic acids detected in the fermentation broth with the cultivation
time at the oxygen transfer conditions applied.......................................53
4.3 Amino acids detected in the fermentation broth with the cultivation
time at the oxygen transfer conditions applied.......................................57
4.4 The variations in oxygen transfer parameters ........................................61
4.5 The variations in Leudeking-Piret constants ...........................................68
4.6 The variations in specific growth rate and yield coefficients......................69
4.7 The result of Analysis for Experiment’s Data ..........................................80
xiii
LIST OF FIGURES
FIGURE
1.1 R- and S- Enantiomers of penicillamine molecule................................... 3
1.1 R- and S- Enantiomers of benzoin molecule. ........................................... 4
2.1 Lineweaver-Burk plot .......................................................................11
2.2 Benzaldehyde Lyase catalyzed cleavage and synthesis of benzoin. ..........13
2.3 Typical growth curve for a bacterial population......................................20
2.4 Schematic diagram of steps involved in transport of oxygen from a
gas bubble to inside a cell.................................................................30
2.5 Variation of dissolved oxygen concentration with the dynamic
measurement of K aL ........................................................................32
2.6 Evaluating K a using the Dynamic MethodL ...........................................32
2.7 Variation of dissolved oxygen concentration with time in dynamic
measurement of KLa0 using the Dynamic ..........................................33
4.1 The variations in dissolved oxygen concentration with the cultivation
time, agitation and air inlet rates.......................................................47
4.2 The variations in air flow rate with the cultivation time..........................47
4.3 The variations in cell concentration with the cultivation time, agitation
and air inlet rates............................................................................49
xiv
4.4 The variations in glucose concentration with the cultivation time,
agitation and air inlet rates...............................................................50
4.5 The variations in BAL volumetric activity with the cultivation time,
agitation and air inlet rates...............................................................51
4.6 The variations in acetic acid concentration with the cultivation time,
agitation and air inlet rates...............................................................56
4.7 The variations in total organic acid concentration with the cultivation
time, agitation and air inlet rates.......................................................56
4.8 The variation of OUR with cell concentration, agitation and air inlet
rates..............................................................................................64
4.9 The variation of Da (OD/OTRmax) with cell concentration, agitation
and air inlet rates ............................................................................64
4.10 The variation of η (OUR/OD) with cell concentration, agitation and air
inlet rates ......................................................................................65
4.11 The relationship between Da and η at different oxygen transfer
conditions ......................................................................................65
4.12 The variations in specific growth rate with the cultivation time,
agitation and air inlet rates...............................................................68
4.13 Calculated C vs Observed C x x ............................................................78
4.14 Calculated Co2 versus Observed Co2 ....................................................79
4.15 Calculated CBP versus Observed CBP.....................................................79
4.16 Calculated Activity versus Observed Activity ........................................81
A.1 Calibration Curve for Escherichia coli Concentration ...............................94
B.1 Calibration Curve of Reduced Sugar Concentration ................................95

xv
NOMENCLATURE
A Benzaldehyde lyase activity, U cm-3
COA Organic acid concentration, kg m-3
CO Dissolved oxygen concentration, mol m-3; kg m-3
CO* Oxygen saturation concentration, mol m-3; kg m-3
CG Glucose concentration, kg m-3
CP Product concentration, kg m-3
CS Concentration of the substrate, mM; kg m-3
CX Cell concentration, kg dry cell m-3
Da Damköhler number (=OD / OTRmax; Maximum possible oxygen
utilization rate per maximum mass transfer rate)
E Enhancement factor (=KLa / KLao); mass transfer coefficient with
chemical reaction per physical mass transfer coefficient
KLa0 Physical overall liquid phase mass transfer coefficient; s-1
KLa Overall liquid phase mass transfer coefficient; s-1
Km Michealis constant, mM
N Agitation rate, min–1
m0 Rate of oxygen consumption for maintenance, kg oxygen kg-1
dry cell weight h-1
mS Maintenance coefficients for substrate, kg substrate kg-1 dry cell
weight h-1
pH0 Initial pH
Qo Volumetric air feed rate, m3 min-1
qo Specific oxygen uptake rate, kg kg –1 DW h-1
qs Specific substrate consumption rate, kg kg –1 DW h-1
r Volumetric rate of reaction, mol m-3 s-1
rmax Maximum rate of reaction, mol m-3 s-1
r0 Oxygen uptake rate, mol m-3 s-1; kg m-3 h-1
rX Rate of cell growth, kg m-3 h-1
T Bioreaction medium temperature, oC

xvi
t Bioreactor cultivation time, h
U One unit of an enzyme
VR Volume of the bioreaction medium, m3
YX/S Yield of cell on substrate, kg kg-1
YX/O Yield of cell on oxygen, kg kg-1
YS/O Yield of substrate on oxygen, kg kg-1
YP/X Yield of product on cell, kg kg-1
YP/S Yield of product on substrate, kg kg-1
YP/O Yield of product on oxygen, kg kg-1
Greek Letters
α, β Leudeking-Piret constants
η Effectiveness factor (=OUR/OD; the oxygen uptake rate per
maximum possible oxygen utilization rate)
µ Specific cell growth rate, h-1
µmax Maximum specific cell growth rate, h-1
λ Wavelength, nm
Abbreviations
ATCC American Type Culture Collection
BAL Benzaldehyde lyase
DO Dissolved oxygen
EC Enzyme Commission
OD Oxygen demand (=μmax CX / YX/O; mol m-3 s-1)
OUR Oxygen uptake rate, mol m-3 s-1
OTR Oxygen transfer rate, mol m-3 s-1
OTRmax Maximum possible mass transfer rate (=KLaCO*; mol m-3 s-1)
TCA Tricarboxylic acid
1
CHAPTER 1
INTRODUCTION
Biocatalysts (enzymes) are usually proteins or RNA molecules that act as
catalysts. Enzymes are specific, versatile, and very effective biological
catalysts, resulting in much higher reaction rates as compared to chemically
catalyzed reactions under ambient conditions (Shuler and Kargi, 1992). They
are used in a multitude of processes, in industry as well as in the daily
household, and enzymatically based processes are replacing many classical
processes due to their mild reaction conditions and environmentally friendly
outcome. The market (approximately 1.5 billion USD in 2000) is expanding,
and new applications of enzymes are constantly being explored (Nielsen,
Villadsen, Liden, 2003).
The advantages of biocatalysts when compared with chemical catalysts
can be summarized as:
1. Enzymes are very efficient catalysts. Typically the rates of enzyme-
mediated processes are accelerated, compared to those of the
corresponding non-enzymatic reactions, by a factor of 108-1010.
2. Enzymes are environmentally acceptable. Unlike heavy metals,
biocatalysts are environmentally benign reagents since they are
completely degradable.
3. Enzymes act under mild conditions. Enzymes act in a pH range of about
5-8, typically around 7, and in a temperature range of 20–40oC,
preferably at around 30oC. This minimizes problems of undesired side-
reactions such as decomposition, isomerization, racemization and
rearrangement, which often plague traditional methodology.

2
4. Enzymes are compatible with each other. Since enzymes generally
function under the same or similar conditions, several biocatalytic
reactions can be carried out in a reaction cascade in one flask. Thus
sequential reactions are feasible by using multi-enzyme systems in
order to simplify reaction processes (Faber, 2000).
5. Enzymes can catalyze a broad spectrum of reactions. Like all catalysts,
enzymes only accelerate a reaction, but they have no impact on the
position of the thermodynamic equilibrium of the reaction. Thus, in
principle, some enzyme-catalyzed reactions can be run in both
directions.
The unique catalytic property of enzyme is based on its three-
dimensional structure and on an active site whose chemical groups may be
brought into close proximity from different regions of the polypeptide chain.
The stereospecificity of an enzyme for substrate has been compared to a lock-
and-key relationship. This analogy implies that enzyme has an active site that
fits the exact attachment of substrate, the enzyme may undergo
conformational changes that provide a more perfect fit between it and the
substrate (Bhagavan, 2001).
Enzymes display three major types of selectivities:
1. Chemoselectivity: Since the purpose of an enzyme is to act on a single
type of functional group, other sensitive functionalities, which would
normally react to certain extent under chemical catalysis, do survive.
As result, reaction generally tend to be 'cleaner' and laborious
purification of product(s) from impurities can largely be omitted.
2. Regioselectivity and Diastereoselectivity: Due to their complex three-
dimensional structure, enzymes may distinguish between functional
groups, which are chemically situated in different region of the same
substrate molecule.

3. Enantioselectivity: Almost all enzyme are made of form L-amino acids
and thus are cherial catalysts. As a consequence, any type of chirality
present in the substrate molecule is 'recognized' upon the formation of
the enzyme-substrate complex. Thus a prochiral substrate may
transformed into an optically active product through an
asymmetrization process.
One of the important and unique properties of enzyme is
enantioselsectivity and the use of enantionerically pure compounds are
becoming increasingly more important in the production of pharmaceuticals,
agrochemicals (e.g., pesticides, fungicides, herbicides), and flavors (Adam et
al., 1999). Since the majority of enzymes are highly selective with respect to
the chirality of a substrate, it is obvious that the enantiomers of a given
bioactive compound such as pharmaceutical or an agrochemical cause
different biological effects. consequently, they must be regarded as two
distinct species. The isomer with the highest activity is denoted as the
'eutomer', whereas its enantiomeric counterpart, possessing less or even
undesired activities, is termed as the 'distomer'. The range of effects derived
from the distomer can extend from lower activity, no response or toxic events.
A representive example of different biological effects is given in scheme 1.1.
S-Enantiomer
toxic
HO2C Penicillamine
SH
R-Enantiomer
CO2H
HS
antiarthritic
NH2 NH2
Figure 1.1 R- and S- enantiomers of penicillamine molecule.
3

Of the alternative ways of obtanining enantiomerically pure compounds,
the enzymatic methods are becoming more and more popular for the
asymmetic synthesis of fine chemicals (Faber, 2000).
Benzaldehyde lyase (BAL, EC 4.1.2.38), a thiamin diphosphate (ThDP)
dependent enzyme, is a valuable tool for chemo-enzymatic syntheses beacuse
it generates various enantiomerically pure 2-hydroxyketones through aldehyde
ligation or by partial decomposition of racemic mixtures. The (R)- and (S)-
enantiomers of benzoin are shown in Figure 1.2.
Figure 1.2 R- and S- enantiomers of benzoin molecule.
In the literature, BAL was firstly reported by Gonzales and Vicuna (1989)
who isolated it from the strain Pseudomonas Fluorescens Biovar I, which was
found in wood scraps in a cellulose factory. They showed that this strain can
grow on lignin-like substrate, beacuse the endogenous BAL can cleave the
acyloin linkage of R-benzoin and R-anision to use these compounds as a
carbon and energy source. Thereafter, the gene encoding banzaldehyde lyase
was cloned to Escherichia coli HB101 by Hinrichsen et al. (1994). Then Pohl et
al. (2002) corrected and re-submitted the DNA sequence which was published
by Hinrichsen; and for easier purification, fused hexa-histidine tag to the C-
terminus of the enzyme and expressed in E. coli SG130009.
The mechanism of the reaction catalyzed by benzaldehyde lyase and
substrate range of the enzyme was described by Demir et al., (2001, 2002,
4
5
2003, 2004). The ability of BAL to asymmetrically synthesize mixed benzoins
was also reported by Dünkelmann et al. (2002).
Recently, modeling of benzaldehyde lyase structure and active site
identification of the enzyme (Keen et al., 2005) together with obtaining
information about homotetramer structure of BAL (Mosbacher et al., 2005)
provided a useful knowledge for future studies. Finally, Maria et al. (2005)
investigated the effects of parameters such as cofactors, cosolvents, and pH,
on the stability and the activity of the BAL.
The reaction engineering of benzaldehyde lyase was presented by Stillger
et al. (2006); based on kinetic studies a continuous process was developed
and by the application of a continuous process in combination with membrane
technology, high space time yields (1120 g L-1 d-1, ee > 99%) of the product
as well as high total turnover numbers of the biocatalyst (mol of product/mol
of biocatalyst 188.000) were obtained.
The stability of BAL with respect to pH, temperature, buffer salt,
cofactors and organic cosolvents was studied by Janzen et al. (2006). In this
study reported that the reaction temperature should not exceed 37 Co and the
enzyme was stable between pH 6 and 8, with pH 8 being the pH-optimum of
both the lyase and the ligase reactions.
In the more recent study, Mikolajek et al. (2007) was investigated a
carboligation for the first time as an enzymatic gas phase reaction, where
benzaldehyde was converted to benzoin using thiamine diphosphate (ThDP)-
dependent enzymes, namely benzaldehyde lyase (BAL) and benzoylformate
decarboxylase (BFD).
The effects of bioprocess operation parameters on benzaldehyde lyase
production was firstly reported by Çalık et al. (2004, 2006); using the
recombinant E. coli K12 carrying modified pUC18::bal plasmid on a defined
medium with glucose and (NH4)2HPO4 as the sole carbon and nitrogen sources,
respectively. The highest BAL activity was obtained at 0.5 vvm, 500 min-1 as
860 Ucm-3 with a cell concentration of 2.3 kg m-3 at uncontrolled pH of 7.2.

6
In the study of Kaya, (2006), T7 regulated system was chosen in order
to increase the productivity of BAL as an alternative to trc promoter, which
was present in modified pUC18::bal plasmid. For this purpose, the gene
encoding benzaldehyde lyase, bal, was cloned into pUC derived pRSETA (under
the control of T7 promoter) and as the host cell E. coli BL21 (DE3) pLySs
strain was utilized, which was specifically designed for T7 regulated genes.
Thereafter, by using the developed recombinant E. coli BL21 (DE3) pLySs
cells, the effect of glucose and (NH4)2HPO4 and their concerted effects were
investigated in the production of recombinant benzaldehyde lyase.
The only study about the effect of oxygen transfer on cell physiology of
E. coli BL21 cells was performed by Kaya, (2006). However, the oxygen
transfer conditions investigated as bioreactor operation parameters showed
similar trends and at all conditions oxygen transfer was the rate limiting step.
As a result lower BAL expression was observed.
Therefore, in this study, it was aimed to investigate the effects of oxygen
transfer conditions on the synthesis of benzaldehyde lyase by the recombinant
E. coli BL21 (DE3) pLySs in a systematic way and in detail to explain the
variations in cell physiology in terms of product and by-product distributions
and biomass formation. Moreover, the oxygen transfer characteristics like
mass transfer coefficient (KLa), enhancement factor E (=KLa/KLao), volumetric
oxygen transfer rate, volumetric and specific oxygen uptake rates, mass
transfer; and biochemical reaction resistances like specific substrate uptake
rates, yield and maintenance coefficients were reported . Also, in this study,
by using multiple regression technique, mathematical model was proposed to
estimate the benzaldehyde activity as fuction of time, agitation rate, cell
concentration, dissolved oxygen concentration, and by- product concentration.

7
CHAPTER 2
LITERATURE SURVEY
2.1 Enzymes
2.1.1 General Characterisatics
Enzymes are catalysts and are functional units of cellular metabolism.
They are usually proteins but may include RNA molecules as well (Bhagavan,
2001). The main function characterisatics of enzymes compared with chemical
catalysts are their high efficiency, their specificity and their capacity for
regulation (Matthews,1997).
An enzyme- catalyzed reaction is initiated when the enzyme binds to its
substrate to form an enzyme-substrate complex. Substrate binding to the
enzyme occurs at a specific and specialized region known as the active site, a
cleft or pocket in the surface of the enzyme that constitues only a small
portion of the enzyme molecule. Catalytic function is accomplished at this site
beacuse various chemical groups important in substrate binding are brougth
together in a spatial arrangment that confers specificity on the enzyme. Thus,
the unique catalytic property of an enzyme is based on its three-dimentional
structure and on an active site whose chemical groups may be brougth into
close proximity from different regions of the polypeptide chain (Bhagavan,
2001).
Each enzyme has a specific temperature and pH range where it functions
to its optimal capacity, the optima for these proteins usually lie between 37-47 ◦C, and pH optima range from acidic, i.e., 1.0, to alkaline, i.e., 10.5 (Krik and
Othmer, 1994). The pH dependence of enzyme activity is the result of several
effects. Ionizable groups in the active site of the enzyme (or elsewhere), in the
8
substrate, or in the enzyme- substrate complex can effect catalysis depending
on whether the protons on the reactive groups are dissociated or undissociated
(Bhagavan, 2001). Another distinguishing characteristic of enzymes is their
frequent need for cofactors. A cofactor is a non-protein compound which
combines with an other- wise inactive protein to give a catalytically active
complex. The simplest cofactors are metal ions like Ca2+, Zn2+, Co2+, etc
(Bailey, 1986).
Most of the enzymes used on an industrial scale are derived from
microbial sources. Enzymes isolated from microorganisims have impressive
credentials as catalysts for the synthesis of industrial chemicals. Among the
advantages derived from using microbial cells are: 1) potential for reduced
catalyst cost; 2) increased enzyme stability; 3) ease of running multi-
catalystic processes; and 4) decreased time for catalyst production (moses
and Cape, 1991).
2.1.2 Classification of Enzymes
Enzymes are generally named for the substrate or chemical group on
which they act, and the name takes the suffix –ase. Systematic nomenclature
for the enzymes has been developed by the Enzyme Commission of the
International Union of Biochemistry (Bhagavan, 2001). This enzyme
commission assiged each enzyme a recommended name and four-part
distinguishing number (Chaplin, 1990). In this system, enzymes are divided
into six main groups (Table 2.1) according to the type of reaction catalyzed
(Faber, 2000). Each of the major classes is futher divided into numerical
subclasses and sub-subclasses according to the individual reactions involved.
The forth number in the classification is the serial number of the enzyme
within a subclass (Atkinson and Mavituna, 1991).
9
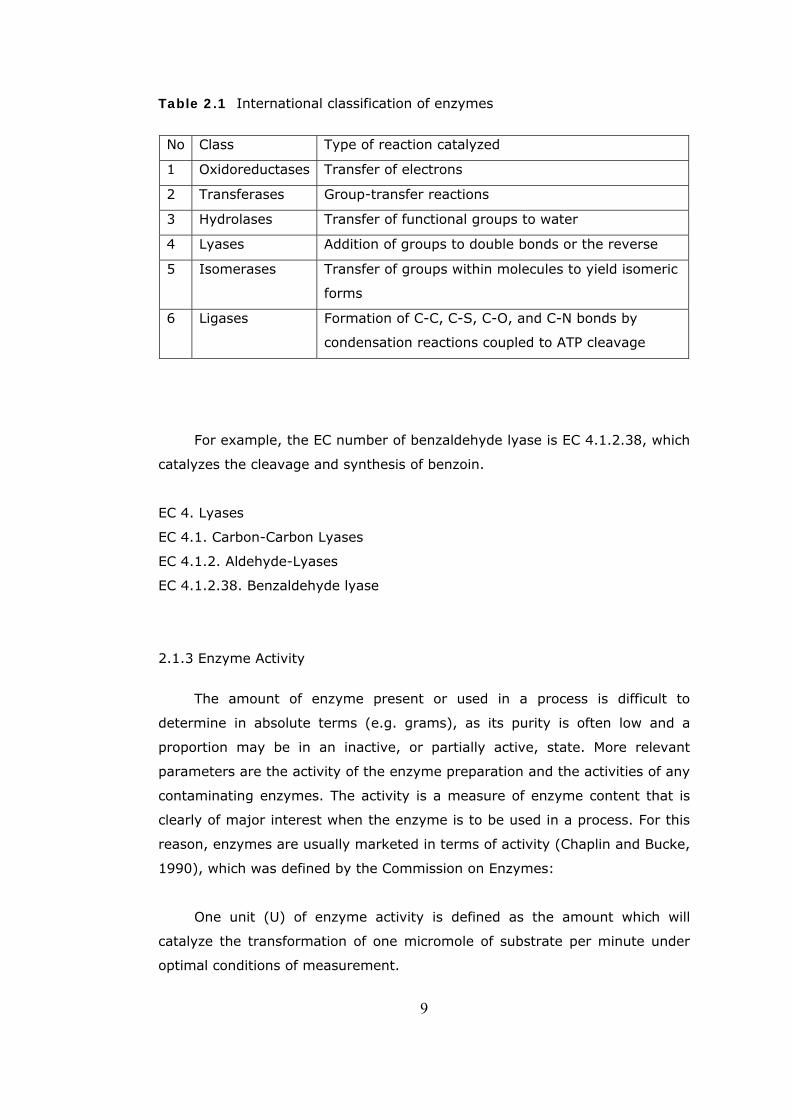
Table 2.1 International classification of enzymes
No Class Type of reaction catalyzed
1 Oxidoreductases Transfer of electrons
2 Transferases Group-transfer reactions
3 Hydrolases Transfer of functional groups to water
4 Lyases Addition of groups to double bonds or the reverse
5 Isomerases Transfer of groups within molecules to yield isomeric
forms
6 Ligases Formation of C-C, C-S, C-O, and C-N bonds by
condensation reactions coupled to ATP cleavage
For example, the EC number of benzaldehyde lyase is EC 4.1.2.38, which
catalyzes the cleavage and synthesis of benzoin.
EC 4. Lyases
EC 4.1. Carbon-Carbon Lyases
EC 4.1.2. Aldehyde-Lyases
EC 4.1.2.38. Benzaldehyde lyase
2.1.3 Enzyme Activity
The amount of enzyme present or used in a process is difficult to
determine in absolute terms (e.g. grams), as its purity is often low and a
proportion may be in an inactive, or partially active, state. More relevant
parameters are the activity of the enzyme preparation and the activities of any
contaminating enzymes. The activity is a measure of enzyme content that is
clearly of major interest when the enzyme is to be used in a process. For this
reason, enzymes are usually marketed in terms of activity (Chaplin and Bucke,
1990), which was defined by the Commission on Enzymes:
One unit (U) of enzyme activity is defined as the amount which will
catalyze the transformation of one micromole of substrate per minute under
optimal conditions of measurement.
A comparison of the activity of different enzyme preparations was only
possible if the assay procedure is performed exactly in the same way (Faber,
2000). However, these so-termed optimal conditions vary even between
laboratories and suppliers (Chaplina and Bucke, 1990). Therefore, the
parameters such as temperature, pH, and/or substrate concentration that
affects the reaction rate must be carefully controlled in order to achieve
reproducible results (Kirk and Othmer, 1994).
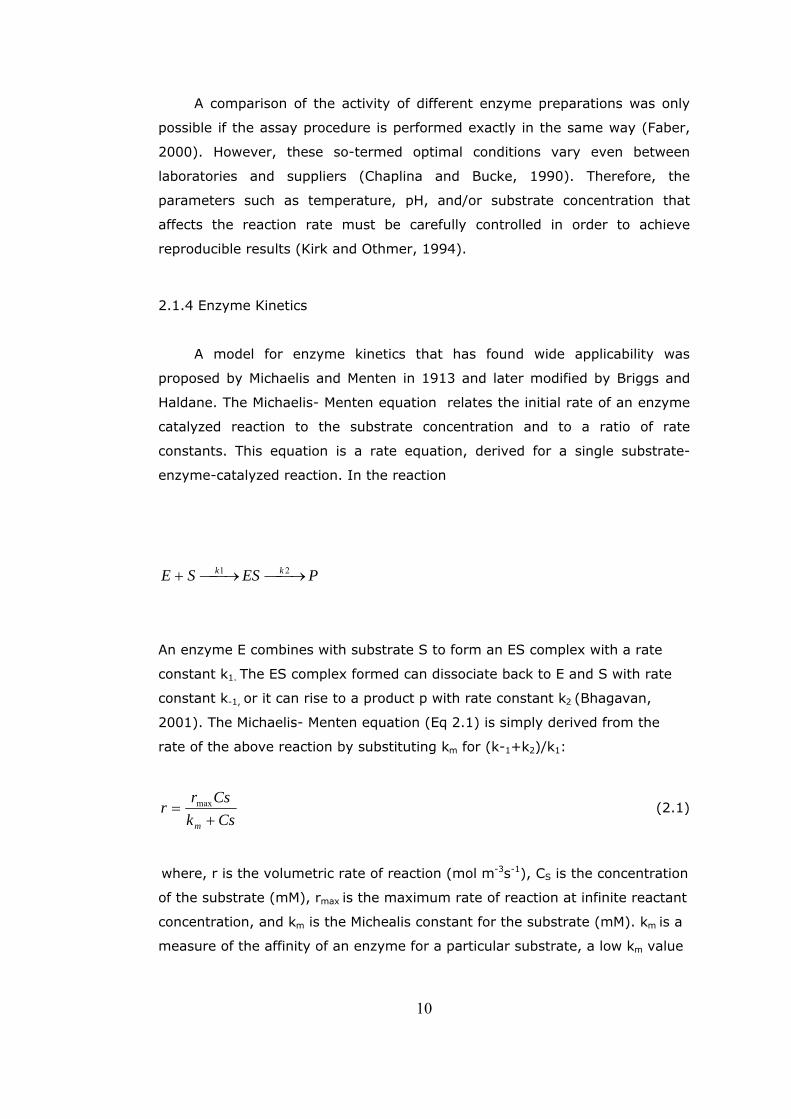
2.1.4 Enzyme Kinetics
A model for enzyme kinetics that has found wide applicability was
proposed by Michaelis and Menten in 1913 and later modified by Briggs and
Haldane. The Michaelis- Menten equation relates the initial rate of an enzyme
catalyzed reaction to the substrate concentration and to a ratio of rate
constants. This equation is a rate equation, derived for a single substrate-
enzyme-catalyzed reaction. In the reaction
PESSE kk ⎯→⎯⎯→⎯+ 21
An enzyme E combines with substrate S to form an ES complex with a rate
constant k1. The ES complex formed can dissociate back to E and S with rate
constant k-1, or it can rise to a product p with rate constant k2 (Bhagavan,
2001). The Michaelis- Menten equation (Eq 2.1) is simply derived from the
rate of the above reaction by substituting km for (k-1+k2)/k1:
CskCsr
rm +
= max (2.1)
where, r is the volumetric rate of reaction (mol m-3s-1), CS is the concentration
of the substrate (mM), rmax is the maximum rate of reaction at infinite reactant
concentration, and km is the Michealis constant for the substrate (mM). km is a
measure of the affinity of an enzyme for a particular substrate, a low km value
10

representing a high affinity and a high km a low affinity (Godfrey and West,
1996).
Rearrangement of equation (2.1) gives
s
m
Crk
rr111
maxmax
⋅+= (2.2)
A plot of 1/r versus 1/CS (known as a Lineweaver-Burk plot, Figure 2.1)
provides a means of determinig the parameters km and rmax from experimental
data (Doran, 1995).
Slope=km/rmax
1/Cs
1/r
1/rmax
Figure 2.1 Lineweaver-Burk plot.
2.2 Benzaldehyde Lyase
The enzymic modification of raw materials has been important
component of industrial processing for centuries (Moses and Cape, 1991). As
cherial materials, enzymes can be used in the synthesis of optically active
substances in high enantiomeric excess from prochiral or racemic substrates
by catalytic asymetric induction or kinetic resolution. Therefore, the
development of enantiometrically pure compounds used in the production of
11
12
pharmeceuticals, agrochemicals, and flavors are recently becoming more
important (Adem et al., 1999).
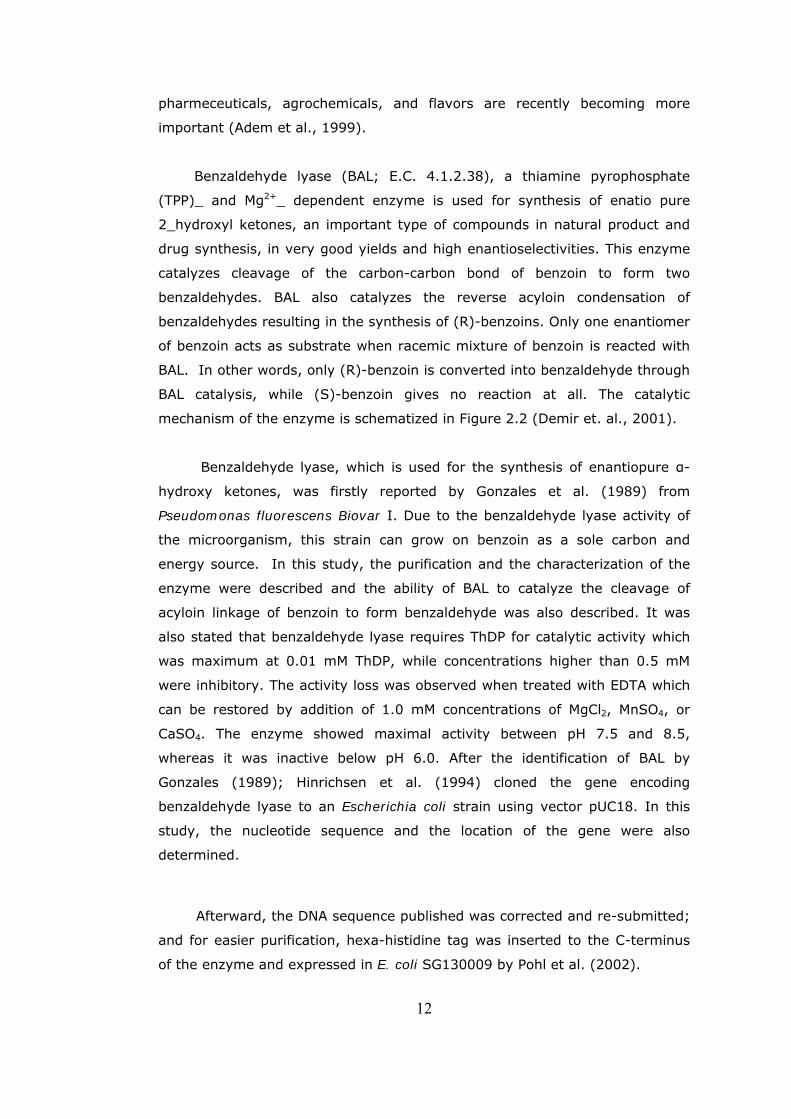
Benzaldehyde lyase (BAL; E.C. 4.1.2.38), a thiamine pyrophosphate
(TPP)_ and Mg2+_ dependent enzyme is used for synthesis of enatio pure
2_hydroxyl ketones, an important type of compounds in natural product and
drug synthesis, in very good yields and high enantioselectivities. This enzyme
catalyzes cleavage of the carbon-carbon bond of benzoin to form two
benzaldehydes. BAL also catalyzes the reverse acyloin condensation of
benzaldehydes resulting in the synthesis of (R)-benzoins. Only one enantiomer
of benzoin acts as substrate when racemic mixture of benzoin is reacted with
BAL. In other words, only (R)-benzoin is converted into benzaldehyde through
BAL catalysis, while (S)-benzoin gives no reaction at all. The catalytic
mechanism of the enzyme is schematized in Figure 2.2 (Demir et. al., 2001).
Benzaldehyde lyase, which is used for the synthesis of enantiopure α-
hydroxy ketones, was firstly reported by Gonzales et al. (1989) from
Pseudomonas fluorescens Biovar I. Due to the benzaldehyde lyase activity of
the microorganism, this strain can grow on benzoin as a sole carbon and
energy source. In this study, the purification and the characterization of the
enzyme were described and the ability of BAL to catalyze the cleavage of
acyloin linkage of benzoin to form benzaldehyde was also described. It was
also stated that benzaldehyde lyase requires ThDP for catalytic activity which
was maximum at 0.01 mM ThDP, while concentrations higher than 0.5 mM
were inhibitory. The activity loss was observed when treated with EDTA which
can be restored by addition of 1.0 mM concentrations of MgCl2, MnSO4, or
CaSO4. The enzyme showed maximal activity between pH 7.5 and 8.5,
whereas it was inactive below pH 6.0. After the identification of BAL by
Gonzales (1989); Hinrichsen et al. (1994) cloned the gene encoding
benzaldehyde lyase to an Escherichia coli strain using vector pUC18. In this
study, the nucleotide sequence and the location of the gene were also
determined.
Afterward, the DNA sequence published was corrected and re-submitted;
and for easier purification, hexa-histidine tag was inserted to the C-terminus
of the enzyme and expressed in E. coli SG130009 by Pohl et al. (2002).

In further studies, the catalytic activity and substrate range of
benzaldehyde lyase like the enantioselective C-C bond cleavage and formation
to generate (R)- and (S)-benzoins and (R)-2hydroxypropiophenone ((R)-2HPP)
derivatives (Demir et al., 2001); C-C bond formation from aromatic aldehydes
and acetaldehyde (Demir et al., 2002) and methoxy- and dimethoxy-
acetaldehydes (Demir et al., 2003) on a preparative scale in buffer/DMSO
solution; asymmetrical synthesis of mixed benzoins (Dünkelmann et al.,
2002); mixed acyloin condensation between methoxy- substituted
benzaldehydes and phenylacetaldehyde (Sanchez et al., 2003); and
hydroxymethylation of aromatic aldehydes with formaldehyde (Demir et al.,
2004) were investigated.
Figure 2.2 Benzaldehyde lyase catalyzed cleavage and synthesis of benzoin. The first step of the catalytic cycle is the attack of ylide form of ThDP on the carbonyl carbon of (R) - benzoin to produce an adduct. The enamine, intermediate product of ThDP dependent enzymes catalyzing the formation of 2-hyroxy ketones, and the first free aldehyde molecule is formed. Protonation of this intermediate then releases the second molecule of aldehyde and restores the cofactor. In the presence of an acceptor aldehyde and enamine intermediate is able to undergo a C-C bond formation
13

14
Recently, to determine the similarities and differences between THDP
dependent enzymes like benzoylformate decarboxylase (BFD) and
benzaldehyde lyase which result in the different catalytic activities, the X-ray
structure of BFD and pyruvate decarboxylase (PDC) were used as template for
modeling benzaldehyde lyase. The model shows that the glutamine residue,
Gln113, present in the active site plays an important role where replacement
with alanine or histidine resulted in 200 fold activity loss (Kneen et al., 2005).
Thereafter, the structure of BAL was determined by X-ray diffraction and
identified that benzaldehyde lyase is a homotetramer, which each subunit
binds one THDP molecule using one Mg2+ ion. It was also founded that the
molecular weight of the enzyme is 4×58919 Da corresponding to 4×563 amino
acid residues. The information obtained from X-ray diffraction exposed the
active center, reaction geometry, and substrate specificity of benzaldehyde
lyase which can later be used to expand the substrate range of the enzyme
(Mosbacher et al., 2005).
Maria et al. (2005) investigated the effects of cofactors, cosolvents, and
pH, on the stability and the activity of the BAL to obtain higher chemical yields
for the synthesis of benzoins by carboligation of benzaldehyde derivatives.
Among the investigated parameters, it was shown that 30% DMSO content in
the presence of potassium phosphate buffer with 0.5mM Mg+2, 0.5 mM ThDP
and 1mM DTT, a well known stabilizer of hyrolases, were the optimal for
enzyme activity and stability. It was shown that the enzyme prepared in
potassium phosphate buffer supplemented with ThDP, Mg2+, DTT as a cofactor
and 30% DMSO as a cosolvent leaded to 50% activity loss after 30 h, while
the enzyme losses its activity almost completely within 3 h in water. It was
also shown that best enzymatic activity appeared when the pH of the reaction
medium was increased from 8.0 to 9.5.
In the other study, Hischer et al. (2005) performed benzoin condensation
using recombinant benzaldehyde lyase. To enable the conversion of
hydrophobic substrates, the enzyme was entrapped in polyvinyl alcohol and
suspended in hexane. Compared to the reported application of the biocatalyst
in an aqueous phase containing 20% DMSO, the productivity of the resulting
gel stabilised two-phase system was 3-fold better. The entrapment process
had an efficiency of >90%, no enzyme or cofactor was lost during reaction or

15
storage. The entrapped enzyme was stable in hexane for 1 week at 4 oC and
more than 1 month at -20 oC.
Stillger et al. (2006), presented the reaction engineering of BAL and
based on kinetic studies a continuous process was developed. By the
application of a continuous process in combination with membrane technology,
high space time yields (1120 g L-1 d-1, ee > 99%) of the product as well as
high total turnover numbers of the biocatalyst (mol of product/mol of
biocatalyst 188.000) were obtained. A kinetic model was developed to
simulate the continuously operated reactor and to determine optimal
production conditions.
Janzen et al. (2006) also studied the stability of BAL with respect to pH,
temperature, buffer salt, cofactors and organic cosolvents. It was shown that
the reaction temperature should not exceed 37 Co and the enzyme was stable
between pH 6 and 8, with pH 8 being the pH-optimum of both the lyase and
the ligase reactions.
Thereafter Mikolajek et al. (2007) investigated a carboligation for the
first time as an enzymatic gas phase reaction, where benzaldehyde was
converted to benzoin using thiamine diphosphate (ThDP)-dependent enzymes,
namely benzaldehyde lyase (BAL) and benzoylformate decarboxylase (BFD).
The biocatalyst was immobilized per deposition on non-porous support. Some
limitations of the gas/solid biocatalysis were discussed based on this
carboligation and it was also demonstrated that the solid/gas system is an
interesting tool for more volatile products.
The studies in the literature reporting the effects of bioprocess operation
parameters on benzaldehyde lyase production from E. coli K12 were published
by Çalık et al. (2004, 2006). The host microorganism having the highest
benzaldehyde lyase productivity was determined as E. coli K12 (ATCC 10798)
carrying modified pUC18::bal plasmid where inducible hybrid trc promoter is
present. Among the investigated media, the highest cell concentration and
benzaldehyde lyase activity were obtained as 1.8 kg m-3 and 745 U cm-3,
respectively, in the medium containing 8.0 kg m-3 glucose, 5.0 kg m-3
(NH4)2HPO4 and the salt solution. Thereafter, the effects of uncontrolled-pH
and controlled pH operations and effects of oxygen transfer conditions on
16
benzaldehyde lyase productivity were systematically investigated using the
recombinant E. coli K12 carrying pUC18::bal plasmid. Among the controlled-
pH operations, the highest cell concentration and BAL activity were obtained
as 2.1 Kg m-3 and 775 U cm-3, respectively at pHc 7.0; whereas they were 2.3
Kg m-3 and 860 U cm-3, respectively at 0.5 vvm, 500 min-1 and uncontrolled
pH 7.2 condition.
2.3 Bioprocess Parameters in Enzyme production
Bioprocess engineering is the application of engineering principles to
design, develop and analyze processes using biocatalyst for the production of
a desirable product or for the destruction of unwanted or hazardous
substances.
In industrial production of enzymes, microorganisms are mainly utilized
for the following basic reasons:
1. Enzyme levels can be increased by environmental and genetic
manipulation;
2. Enzyme fermentation are quite economical on large scale;
3. Screening procedures are simple (Fogarty and Kelly, 1990).
In aerobic bioprocess, there are some important criteria that must be
taken into account in order to have high product yield. These are:
1. Microorganism
2. Medium design
3. Bioreactor operation parameters
i.Oxygen transfer rate
• Air inlet rate (Qo/V)
• Agitation rate (N)
ii. pH and temperature.

17
2.3.1 Microorganism
In bioprocesses the first critical step is to identify the most proper
microbial strain for the production of the product, screening a wide range of
candidate microorganisms. The micoorganism should be able to secrete large
amounts of the desired product using cheaper substrates, be suitable for
industrial fermentations, give sufficient yields, produce a large cell mass per
volume quickly and on cheap media, be considered safe based on historical
experience or evaluation by regulatory authorities, and should not produce
harmful substances or any other undesirable products (Kirk and Othmer,
1994).
Benzaldehyde lyase is naturally produced by wild-type Pseudomonas
fluorescens (Gonzales et al., 1984). The gene encoding benzaldehyde lyase
was firstly cloned to an Escherichia coli by Hinrichsen et al. (1994), and
further studies about the catalysis ability of the enzyme in stereospecific
manner were performed by using E. coli SG130009 as the host microorganism.
In the literature concerning benzaldehyde lyase production, Çalık et al. (2004,
2006) selected E. coli K12 strain as host microorganism among the
investigated E. coli strains, namely E. coli JM109, E. coli XL-1 Blue, E. coli K12
and E. coli GBE 180 (Çalık, 2004, 2006; Kaya, 2006). As an alternative to
these, to achieve extracellular production of BAL recombinant Bacillus species
(Kaya, 2006) and Pichia pastoris (Büyüksungur, 2006) was studied as the
host.
2.3.1.1 Escherichia coli
Escherichia coli is most often chosen as a host for the production of
enzymes and recombinant proteins. Reasons for the popularity of Escherichia
coli are the ease of genetic manipulation and wealth of the availability of
genetic information coupled with fast growth rate, standardized cultivation
techniques and cheap media (Çalık et al., 2002-b)
18
The typical E. coli cell is a rod shaped microorganism with diameter and
length of approximately 1 and 2 micrometers,respectively. It has a wet mass
of 9.5×10⁻¹³ g, or 2.9×10⁻¹³ g dry mass (Neidhardt et al., 1990).
E.coli is a gram-negative bacterium. It has a peptidoglycan layer covered
by an outer membrane. The outer membrane is an asymetric lipid bilayer
membrane: A lipopolysaccharide forms the exterior layer, and phospholipid
forms the inner layer. The presence of the outer membrane on gram negative
bacteria confers a higher resistance to antibiotics, such as penicillin, and to
degradative enzymes, such as lysozyme (Glazer and Nikaido, 1995). The cell
envelope serves to retaine important cellular compounds and to preferentially
exclude undesirable compounds in the environment. The cell envelope is
critical to the transport of selected material in and out of the cell (Schuler and
Kargı, 2002).
The maximum temperature of growth for E.coli is approximately 48oC, its
optimal temperature is 37oC, its minimal temperature is 8oC, and its normal
temperature range extends from about 21oC to 39oC. E. coli grows well near
neutrality at pH value from 6.0 to 8.0. Regardless of the value of the external
pH, within the cell, pH is maintained at a value quite close to 7.6 (Neidhardt et
al., 1990).
In the literature, E. coli BL21 strains were used as a host microorganism
in both batch (Choi et al., 1997; Christensen et al., 2002) and fed batch
(Shiloach et al, 1996; Akesson et al, 2001; Johnston et al., 2003) cultivations.
In this study recombinant E. coli BL21 (DE3) pLySs E.coli (Kaya, 2006) was
selected as a potential producer of benzaldehade lyase beacuse this strain was
reported to be a high BAL and low acetate producer.
2.3.1.2 Cell Growth, Kinetics and Yield Factors
Cellular growth is the net result of the uptake and conversion of nutrients
(substrates) into new cell marerial (biomass). Cellular growth can also be
considered as an increase in the number of individuals in the population as a
result of both replication and change in the cell size due to the chemical
reactions occur inside the cell. Microbial growth is an autocatalytic process, as

one cell is responsible for the synthesis of more cells, and at conditions with
excess nutrients growth is therefore exponential with a certain doubling time
for the number of cells (Nielsen and Villadsen, 2003 ).
The rate of growth is directly related to cell concentration, and cellular
reproduction is the normal out come of this reaction. The rate of cellular
growth is characterized by the specific growth rate, μ, which is defined as,
μ=dt
dCC
x
x
⋅1
(2.3)
Where Cx is the cell mass concentration (Kg m-3), t is time (h), and μ is the
specific growth rate (h-1).
When a liquid nutrient medium is inoculated with a seed culture, the
microorganisms selectively take up dissolved nutrients from the medium and
convert them into biomass.
A typical batch growth curve include the following phases (Shuler and Kargı,
2002):
1. Lag phase; occures immediately after inculation and is a period of
adaptation of cells to a new environment (μ ≈ 0)
2. Exponential growth phase (Log phase); the cells have adjusted to their
new environment. Growth achieves its maximum rate (μ≈μmax).
3. Deceleration phase; growth deceleration due to either depletion of one or
more essentioal nutrients or the accumulation of toxic by-products of
growth (μ‹μmax).
4. Stationary phase; the net rate is zero (no cell division) or the growth rate
is equal to the death rate (μ=0).
5. Death phase; cells lose viability and lyse (μ‹0).
19

The typical growth curve for a bacterial population is schematized in Figure 2.3
Figure 2.3 Typical growth curve for a bacterial population
During the exponential growth period- including lag, acceleration and growth
phases- in batch cultivation, rate of cell growth, rx, is described by the
followimg equation (Shuler and Kargı, 1992):
xx
x Cdt
dCr μ== (2.4)
Similarly, substrate consumption rate, rs, and product formation rate, rp, are
described by the following equations respectively where Cs is the substrate
concentration and Cp is the product concentration:
PPdCr
dt= (2.5)
SS
dCr
dt= (2.6)
To better describe growth kinetics, some stoichiometrically related parameters
are defined. Yield coefficients are defined based on the amount of consumption
of another material (Shuler and Kargi, 2002). A list of frequently used yield
20

coefficients is given in Table 2.2. When yields for fermentation are reported,
the time or time period to which they refer should be stated (Doran, 1995).
Table 2.2 Definition of yield coefficients
Symbol Definition Unit
YX/S Mass of cells produced per unit mass
of substrate consumed
kg cell kg-1 substrate
YX/O Mass of cells produced per unit mass
of oxygen consumed
kg cell kg-1 oxygen
YS/O Mass of substrate utilized per unit
mass of oxygen consumed
kg substrate kg-1 oxygen
YP/X Mass of product formed per unit mass
of substrate consumed
kg product kg-1 cell
YP/S Mass of product formed per unit mass
of substrate consumed
kg product kg-1 substrate
YP/O Mass of product formed per unit mass
of oxygen consumed
kg product kg-1 oxygen
It is important to realize that the yield coefficients are not constant
throughout the growth phase since they change with growth rate due to the
maintenance energy (m) requirement (Scragg, 1988). Cellular maintenance
represents the energy expenditures to repair damaged cellular components, to
transfer some nutrients and products in and out of the cell, for motility, and to
adjust the osmolarity of the cells’ interior volume (Shuler and Kargi, 2002).
Microbial growth, product formation and substrate utilization rates are usually
expressed in the form of specific rates:
P1q P
X
dCC dt
= (2.7)
S1q S
X
dCC dt
= (2.8)
21
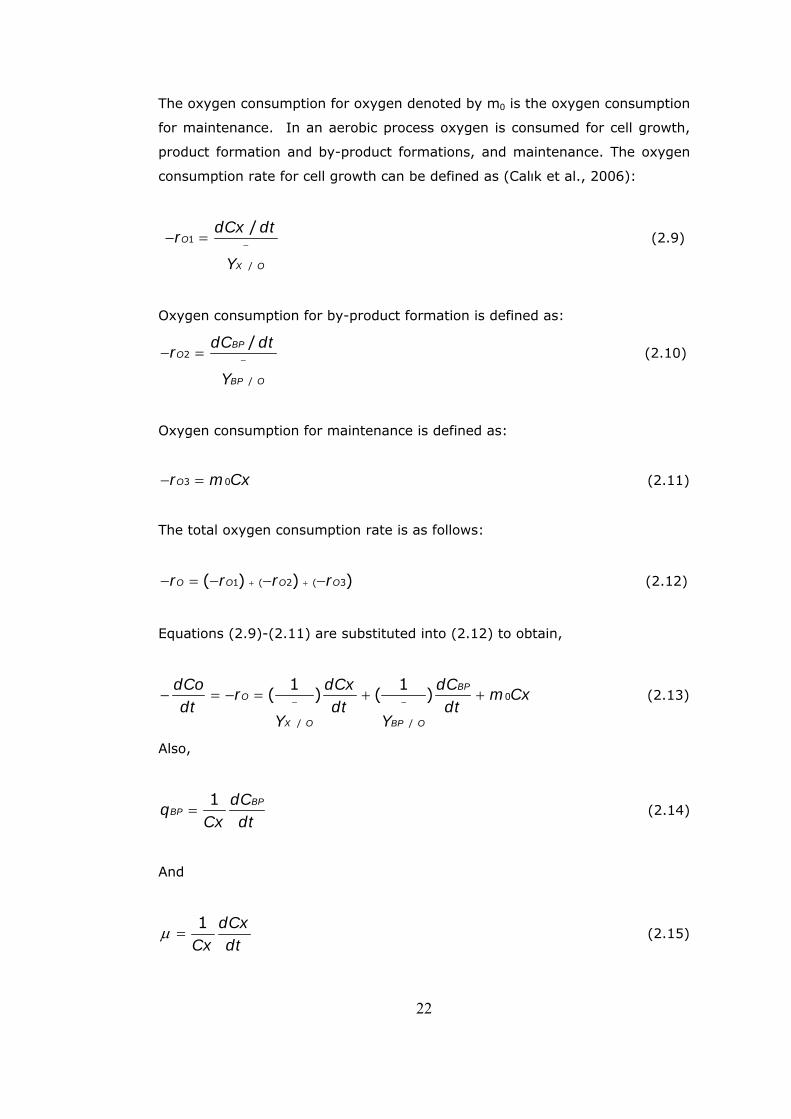
The oxygen consumption for oxygen denoted by m0 is the oxygen consumption
for maintenance. In an aerobic process oxygen is consumed for cell growth,
product formation and by-product formations, and maintenance. The oxygen
consumption rate for cell growth can be defined as (Calık et al., 2006):
−− =1
/
/O
X O
dCx dtr
Y
(2.9)
Oxygen consumption for by-product formation is defined as:
−− =2
/
/BPO
BP O
dC dtr
Y
(2.10)
Oxygen consumption for maintenance is defined as:
− =3 0Or m Cx
)
(2.11)
The total oxygen consumption rate is as follows:
+ +− = − − −1 ( 2 ( 3( ) )O O O Or r r r (2.12)
Equations (2.9)-(2.11) are substituted into (2.12) to obtain,
− −− = − = + + 0
/ /
1 1( ) ( ) BPO
X O BP O
dCo dCx dCr mdt dt dt
Y Y
Cx (2.13)
Also,
=1 BP
BPdCq
Cx dt (2.14)
And
μ =1 dCx
Cx dt (2.15)
22

Substituting (2.14) and (2.15) into (2.13),
μ +− −− = + ) 0
/ /
1 1( )( ) ( )(O
X O BP O
r Cx q Cx
Y Y
BP m Cx (2.16)
Dividing (2.13) by Cx
μ− −
−= + + 0
/ /
O BP
X O BP O
r q mCx
Y Y
(2.17)
qBP can be defined as follows, where α is the term for growth associated
organic acid formation and β is the term for non-growth associated organic
acid formation:
α β= +BPdC dCx Cx
dt dt (2.18)
Dividing (2.18) to Cx,
αμ β= =1 BP
BPdCq
Cx dt+ (2.19)
Substituting (2.19) into (2.17),
μ αμ β− −
− += + + 0
/ /
O
X O BP O
r mCx
Y Y
(2.20)
Dividing (2.20) by μ,
α β μ
μ μ− −
− += + +
0
/ /
1 ( / )O
X O BP O
rCx
Y Y
m (2.21)
Rearranging (2.21),
23

α βμ μ
+− − −
−= + + 0
/ / /
1 1( ) ( )(O
BP O X O BP O
r mCx
Y Y Y
) (2.22)
And,
αμ
+− − −= + + 0/
/ / /
1 1 1( ) ( )(X O
BP O X O BP O
mY
Y Y Y
β ) (2.23)
From the slope of the plot of /
1X OY
versus μ1
, β
+ −0
/
(
BP O
m
Y
)( g oxygen g-1
dry cell )
weight h-1) and from the intercept, α− −+
/ /
1(
BP O X OY Y
) could be determined,
where Y represents the apparent and represents the true yield (Calık et
al., 2006).
−
/X OY
When by-product formation is neglected, equation (2.13) becomes:
0
/
1( )O
X O
dCo dCxr mdt dt
Y−− = − = + Cx (2.24)
If the above equation is reorganized:
0
//
1 1/O
X OX O
rdCx dt Y
Y
mμ−
−= = + (2.25)
is obtained ( Calık et al., 2004). From the slope of /
1X OY
versus μ1
, oxygen
consumption for maintenance is obtained.
From the slope of the plot of 1/Yx/0 versus 1/μ, m0 (kg oxygen kg-1 dry
cell weight h-1), and the intercept, cell yield on oxygen, in the case where
oxygen uptake for product formation is omitted, 0xΥ , could be determined.
24
25
Similarly, the maintenance coefficients for substrate denoted by ms could
be determined. m0 and ms may differ with the change in bioprocess
parameters such as, type of microorganism, type of substrate, PH and
temperature.
2.3.2 Medium Composition
An important aspect in design of a fermentation process is the choice of
fermentation medium, which represents the raw material for the process. The
fermentation medium should fulfill the following criteria:
It should contain a carbon, nitrogen and energy source
It should contain all essential minerals required for growth
It should contain all necessary growth factors to ensure rapid growth
and high yield of the desired product
It should be of a consistent quality and be readily available throughout
the year
It causes a minimum of problems in the downstream processing
It causes a minimum of problems in other aspects related to the
fermentation process, i.e., it has no negative effect on the gas-liquid
mass transfer (Nielsen, Villadsen, Liden, 2003).
Nutrients required by cells can be classified in two categories (Shuler and
Kargı, 2002):
1. Macronutrients: These compounds are needed in the
concentrations of larger than 10-4 M. Carbon, nitrogen, oxygen,
hydrogen, sulfur, phosphorus, Mg+2, and K+ are major
macronutrients, from which living matter is made. These molecules
are the bulk of the cellular components such as proteins, lipids,
membrane structures, and nucleic acids. Microorganisms exhibit
some diversity in utilizing the macronutrients as a source.
26
2. Micronutrients: These compounds are needed in the concentrations
of less than 10-4 M. Trace elements such as Mo2+, Zn2+, Cu2+, Mn2+,
Fe2+, Ca2+, Na+, vitamins, growth hormones, and metabolic
precursors are micronutrients. Microorganisms show diversity in
the usage of micronutrients as a source.
Two major types of growth media are defined and complex media.
Defined media contain specific amounts of pure chemical compounds with
known chemical compositions. Complex media contain natural compounds
whose chemical composition is not exactly known. Often, complex media is
less expensive than defined media. However, the primary advantage of
defined media is that the results are more reproducible and the operator has
better control of the fermentation. Further, recovery and purification of a
product is often easier and cheaper in defined media (Shuler and Kargi, 2002).
The advantages of applying complex media are that they often contain
an organic nitrogen source, essential minerals and different growth factors.
Thus, two frequently applied complex media, corn steep liquor and
paramedical; both contain a very large variety of amino acids, many different
minerals and many different vitamins (Nielsen, Villadsen, Liden, 2003). The
disadvantages of complex media are that:
1) There may be a seasonal variation in the composition,
2) The composition changes with storage
3) There may be compounds present that are undesirable.
In the study of Choi et al. (1997), the effects of various culture
conditions such as medium (LB or M9), temperature, and expression time to
optimize the production of bovine growth hormone (bGH) in E. Coli BL21 were
examined and LB medium was reported slightly better than M9 medium
containing 2.0 kg m-3 casamino acid. In another study performed by
Christensen et al. (2002), glucose and glycerol effects as carbon sources in
batch cultures of E. coli BL21 and recombinant strain were investigated and
lower acetate accumulation was observed in glycerol based medium.

27
Furthermore, Çalık et al. (2004, 2006) designed a glucose based defined
medium containing 8.0 Kg m-3 glucose, 5.0 Kg m-3 (NH4)2HPO4 and salt
solution, and by using this medium they investigated the effects of bioreactor
operation parameters in E. Coli K12 carrying pUC18::BAL plasmid.
2.3.3 Bioreactor Operation Parameters
Oxygen transfer , pH, and temperature, which are the major bioreactor
operation parameters, show divers effects on product formation in aerobic
fermentartion processes by influencing metabolic pathways and changing
metabolic fluxes (Çalık et al., 1999).
2.3.3.1 Temperature
Temperature is an important factor affecting the performance of cells.
According to their temperature optima, organism can be classified in three
groups:
1) Psychrophiles ( Topt< 20oC)
2) Mesophiles ( 20oC≤ Topt < 50oC)
3) Thermophiles (Topt ≥ 50oC).
As the temperature is increased toward optimal growth temperature, the
growth rate approximately doubles for every 10oC increase in temperature.
Above the optimal temperature ranges, the growth rare decreases and thermal
death may occure.
Temperature also effects product formation. However the temperature
optimum for growth and product formation may be different. When
temperature is increased above the optimum value, the maintenance
requirements of cells increase so that yield coefficient is also affected by
temperature (Shuler and Kargi, 1992).
In the literature, the production of E. coli is performed at 37oC, which is
the bacteria’s optimal temperature of growth.
28
2.3.3.2 pH
Hydrogen ion concentation (pH) affects the activity of enzymes and
therefore the microbial growth rate (Shuler and Kargi, 1992). The influence of
pH on cellular activity is determined by the sensitivity of the individual
enzymes to changes in the pH. Enzymes are normally active only within a
certain pH interval, and the total enzyme activity of the cells is therefore a
complex function of the environmental pH (Nielsen, Villadsen, Liden, 2003).
The optimal pH for growth may be different from that for product formation.
Different organisms have different pH ranges optima: the pH optima for many
bacteria ranges from pH=3 to 8 (Shuler and Kargi, 1992).
Although hydrogen ion concentration of the extracellular broth
(fermentation medium) changes according to the metabolic activities of the
cell, the intracellular pH of the cell remains constant. The proton gradient
between extracellular and interacellular medium is necessary for the energy
production through the transport of the materials and also for the
interacellular reaction netwerk (Nielsen and Villadsen, 1994).
In most fermentation, pH can vary substantially. Often the nature of the
nitrogen source can be important. If the ammonia is the sole nitrogen source,
hydrogen ions are released into the medium as a result of the microbial
utilization of ammonia, resulting in a decrease in pH. Also, the pH can change
because of the production of organic acids, the utilization of acids (particularly
amino acids), or the production of bases. The evolution or supply of CO2 can
alter pH greatly in some systems. Thus, pH control by means of a buffer or an
active pH control system is important (Shuler and Kargi, 2002).
In the study by Çalık et al. (2006), the effect of value of pH in the range
of 5.0-7.8 on benzaldehyde lyase production on a defined medium with
glucose as a sole carbon source in batch bioreactors was examined. The pH
value of 7.2 was reported as optimum pH for production of benzaldehyde lyase
by E. coli. Therefore, in the current study pH of the fermentation medium was
arranged as 7.2 with 5M KOH and 5M H3PO4.
29
2.3.3.3 Oxygen Transfer
The transfer of oxygen into microbial cell in aerobic fermentation
processes affects product formation by influencing metabolic pathways and
changing metabolic fluxes. Metabolic pathway analysis and cell growth
conditions show that the oxygen requirement of bioprocesses can be different
so that dissolved oxygen concentration has been accepted as an important
bioreactor operational parameter. Futhermore, in order to design, scale-up,
and operate the bioreactor with adequate mass transfer , the oxygen
consumption rates and oxygen transfer coefficient which are the indicators of
the mass transfer characteristics of a fermentation process are required;
nevertheless, due to the complex composition of the fermentation liquid, it
can be difficult to predict these parameters with reasonable accuracy (Çalık et
al., 1999; Çalık et al., 1998).
To establish optimum conditions for microbial growth, sufficient levels of
oxygen must be supplied to the liquid broth. Often, the oxygen treansfer rate
is the limiting factor of a bioreactor system. The transfer of oxygen from gas
to microorganism takes place in several steps (Figure 2.4), which are 1)
transfer from the interior of the bubble to the gas-liquid interface; 2)
movement across the gas-liquid interface; 3) Diffusion through the relatively
stagnant liquid film surrounding the bubble; 4) Transport through the bulk
liquid; 5) Diffusion through the relatively stagnant liquid film surrounding the
cells; 6) Movement across the liquid-cell interface; 7) If the cells are in a floc,
clump or solid particle, diffusion through the solid to the individual cell; 8)
Transport through the cytoplasm to the site of reaction (Scragg, 1988 and
Bailey, 1986).

Figure 2.4 Schematic diagram of steps involved in transport of oxygen from a
gas bubble to inside a cell (Bailey and Ollis, 1986)
The rate of oxygen transfer from the gas to liquid phase is given by
OTR= (2.26) -*2 L O O=k a(C C )NO
where kL is the oxygen transfer coefficient (cm/h), a is the gas-liquid
interfacial area (cm2/cm3), kLa is the volumetric oxygen transfer coefficient (h-
1), Co* is saturated concentration (mg/L), Co is the actual DO concentration in
the broth (mg/L) and the NO2 is the rate of oxygen transfer (mg O2/l.h)
(Shuler and Kargi, 2002).
The rate of oxygen uptake is denoted as OUR (oxygen uptake rate)
where qO2 is the specific rate of oxygen consumption (mgO2/g dw cells .h)
(Shuler and Kargi, 2002
0 XOUR q C= (2.27)
2.3.3.3.1 Measurement of kLa: Dynamic Method
Dynamic method is a widely used method for the determination of the
value of kLa experimentally, and it can be applied during the fermentation
30

process. This method based on the unsteady-state mass balance for oxygen
given by the following question (Scragg, 1988 and Rainer, 1990):
0( * - ) -L XdCo K a Co Co q Cdt
= (2.28)
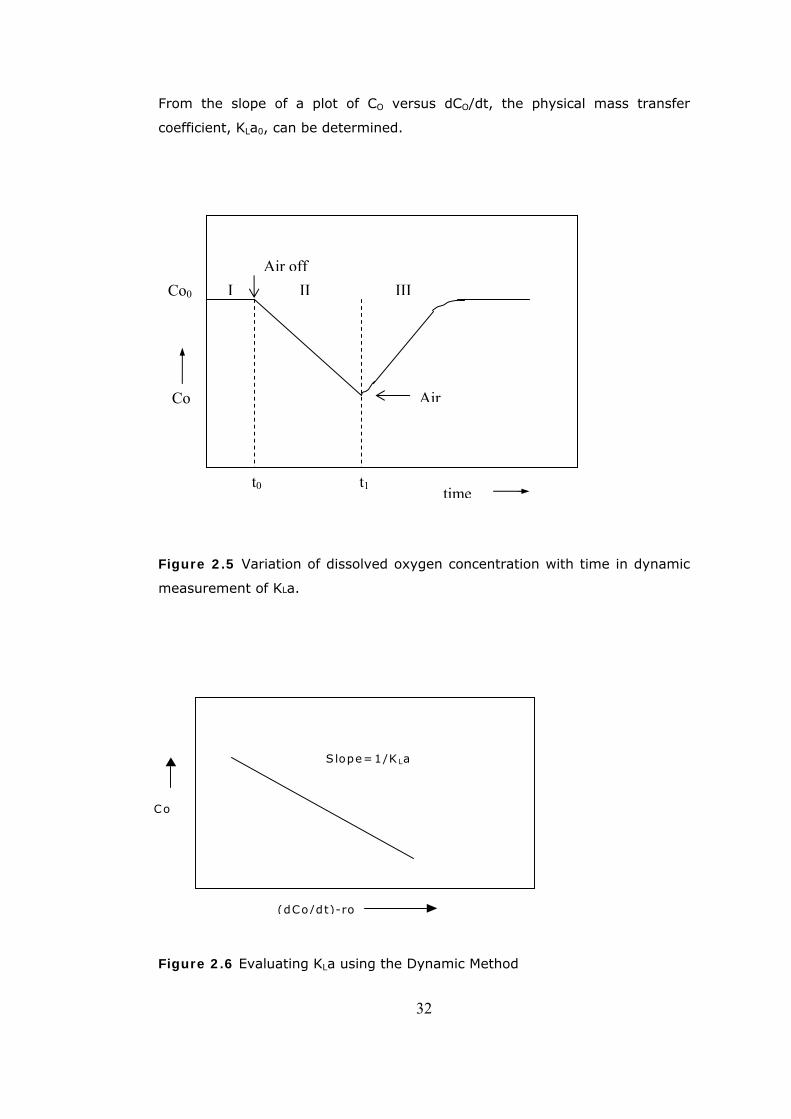
A typical response curve of the dynamic method is given in Figure 2.5. As
shown in Figure 2.5, at some time t0, the broth is de-oxygenated by stopping
the air flow. During this period, dissolved oxygen concentration, Co0, drops,
and since there is no oxygen transfer (region-II), equation reduces to:
0OdC
rdt
= (2.29)
Using equation in region-II of Figure 2.5, oxygen uptake rate, -r0, can be
determined.
Air inlet is then turned back on, and the increase in CO is monitored as a
function of time. In this period, region-III, equation is valid. Combining
equations and rearranging,
*0
1- ( - )OO
L
dCC r
K a dt= OC+ (2.30)
From the slope of a plot of CO versus (dCO/dt – r0), KLa can be determined
(Figure 2.6).
The Dynamic Method can also be applied to conditions under which there
is no reaction, i.e., r0=0 (Nielsen and Villadsen, 1994). In this case, the broth
is de-oxygenated by sparging nitrogen into the vessel. Air inlet is turned back
on and again the increase in Co is monitored as a function of time (Figure
2.7). Modifying equation (2.30):
*1 OO
L
dCC
K a dt= OC+ (2.31)
31
From the slope of a plot of CO versus dCO/dt, the physical mass transfer
coefficient, KLa0, can be determined.
Air off
Air
I II III
Co
Co0
timet0 t1
Figure 2.5 Variation of dissolved oxygen concentration with time in dynamic
measurement of KLa.
Co
(dCo/dt)-ro
S lope=1/K La
Figure 2.6 Evaluating KLa using the Dynamic Method
32

time
Co
Co0
Co
Air on
Figure 2.7 Variation of dissolved oxygen concentration with time in dynamic
measurement of KLa0 using the Dynamic Method
2.3.3.3.2 Oxygen Transfer Characteristics
In order to compare the relative rates of maximum oxygen transfer and
biochemical reactions and find the rate limiting step of the bioprocess, the
maximum possible oxygen utilization rate (OD=oxygen demand) which is
defined as (Çalık et al., 2004),
max
/X O
CxODY
μ= (2.32)
And the maximum possible mass transfer rate is defined as,
*
max L DOOTR k aC= (2.33)
Should be determined throughout the bioprocess.
In order to express the oxygen limitation in an aerobic process, the
effectiveness factor, η (oxygen uptake rate per maximum possible oxygen
utilization rate) and modified Damköhler number, Da (maximum possible
33
oxygen utilization rate per maximum mass transfer rate (Çalık et al., 2004))
are defined according to the equations given below:
OUROD
η = (2.34)
max
ODDaOTR
= (2.35)
And the enhancement factor, E (oxygen transfer coefficient per physical
oxygen transfer coefficient) can be also defined as,
oL
L
aKaKE = (2.36)
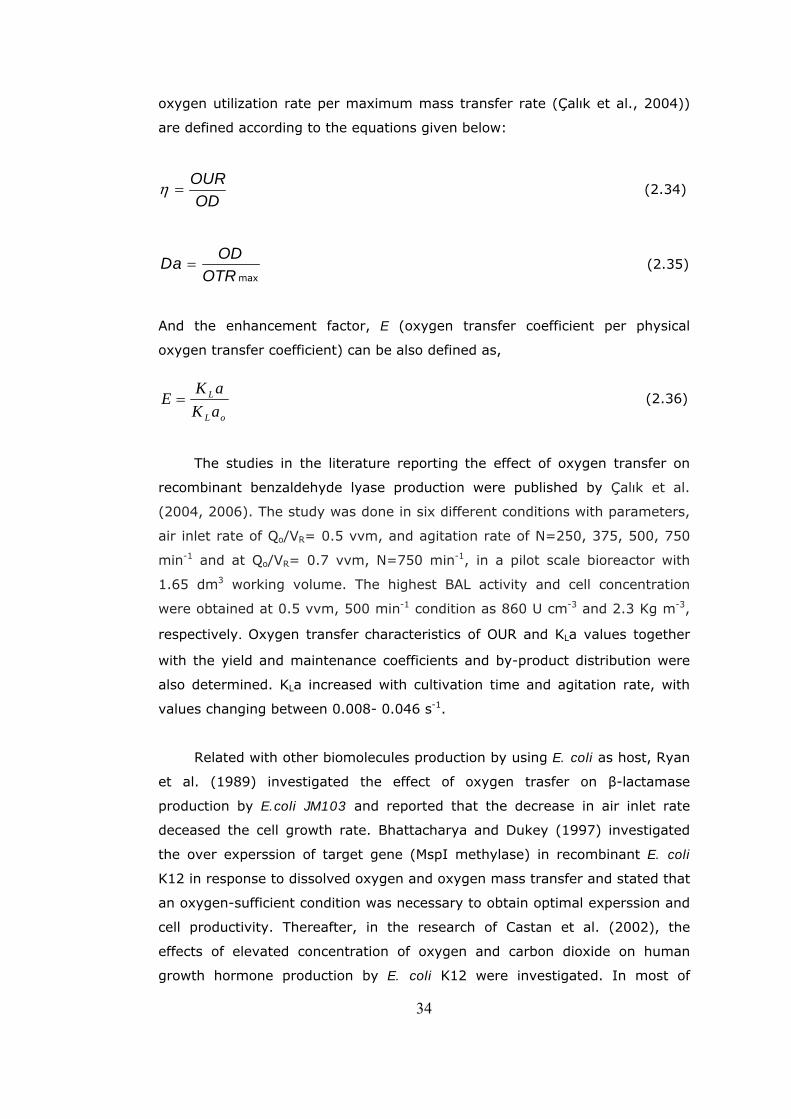
The studies in the literature reporting the effect of oxygen transfer on
recombinant benzaldehyde lyase production were published by Çalık et al.
(2004, 2006). The study was done in six different conditions with parameters,
air inlet rate of Qo/VR= 0.5 vvm, and agitation rate of N=250, 375, 500, 750
min-1 and at Qo/VR= 0.7 vvm, N=750 min-1, in a pilot scale bioreactor with
1.65 dm3 working volume. The highest BAL activity and cell concentration
were obtained at 0.5 vvm, 500 min-1 condition as 860 U cm-3 and 2.3 Kg m-3,
respectively. Oxygen transfer characteristics of OUR and KLa values together
with the yield and maintenance coefficients and by-product distribution were
also determined. KLa increased with cultivation time and agitation rate, with
values changing between 0.008- 0.046 s-1.
Related with other biomolecules production by using E. coli as host, Ryan
et al. (1989) investigated the effect of oxygen trasfer on β-lactamase
production by E.coli JM103 and reported that the decrease in air inlet rate
deceased the cell growth rate. Bhattacharya and Dukey (1997) investigated
the over experssion of target gene (MspI methylase) in recombinant E. coli
K12 in response to dissolved oxygen and oxygen mass transfer and stated that
an oxygen-sufficient condition was necessary to obtain optimal experssion and
cell productivity. Thereafter, in the research of Castan et al. (2002), the
effects of elevated concentration of oxygen and carbon dioxide on human
growth hormone production by E. coli K12 were investigated. In most of
34

35
studies performed with E. Coli dissolved oxygen level was controlled at
constant value (10-30%) by changing the air flow rate (Luli et al., 1990) or
agitation rate in fed batch mode with an automated controller (Akesson et al.,
2001; Johnston et al., 2003).
36
CHAPTER 3
MATERIALS AND METHODS
3.1 Chemicals
All chemicals were analytical grade, and obtained from Sigma Ltd., Difco
Laboratories, Fluka Ltd. and Merck Ltd.
3.2 The Microorganism
Escherichia coli BL21 (DE3) pLySs strain carrying the pRSETA::bal
plasmid (Kaya, 2006) was used as the potential producer of benzaldehyde
lyase (BAL, EC 4.1.2.38). The recombinant microorganism is stored in the
microbanks (PRO-LAB), by inoculating young colonial growth into
cyropreservative fluid present in the vial. After providing the adsorption of
microorganism into the porous beads, excess cryopreservative was aspirated
and inoculated cyrovial stored at -70oC.
3.3 The Solid Medium
The recombinant E. coli strain, stored on agar slants at 4ºC, was
inoculated onto the freshly prepared agar slants under sterile conditions, and
was incubated at 37ºC overnight on Luria-Bertani (LB) medium (Table 3.1);
thereafter inoculated into the precultivation medium.

Table 3.1 The composition of the solid medium.
37
Compound Concentration,Kg m-3
Soytryptone 10.0
Yeast Extract 5.0
NaCl 10.0
Agar 15.0
Ampicillin 0.1
Chloramphenicol 0.035
3.4 The Precultivation Medium
The recombinant E. coli strains, grown in the solid medium, were
inoculated into precultivation medium and incubated at 37ºC and N=200 min-1
for 12 h in agitation and heating rate controlled orbital shakers (B.Braun,
Certomat BS-T) using air-filtered Erlenmeyer flasks 150 ml in size that had
working volume capacities of 33 ml. The compositions of precultivation
mediums were listed in Table 3.2. The selective antibiotics were added to the
precultivation medium to increase the stability of the plasmid in amounts
stated in Table 3.2 after sterilization.
Table 3.2 The composition of the precultivation medium.
Compound Concentration, kg m-3
Soytryptone 10.0
Yeast Extract 5.0
NaCl 10.0
Ampicillin 0.1
Chloramphenicol 0.035

38
3.5 The Production Medium
The microorganisms inoculated in precultivation medium, were further
inoculated in production medium. The reference production medium (RPM) for
benzaldehyde lyase production in E. coli was chosen to be medium described
in Çalık et al. (2004, 2006); the composition is given in Table 3.3.
Table 3.3 The composition of BAL production medium.
Component Concentration, kg m-3
Glucose 8.0
Na2HPO4 6.7
KH2PO4 3.1
(NH4)2HPO4 5.0
NaCl 0.5
MgSO4.7H2O
FeSO4.7H2O
ZnSO4.7H2O
MnSO4.7H2O
CuSO4.5H2O
Ampicillin
Chloramphenicol
0.5
1.0 x 10⁻³
0.1 x 10⁻³
7.5 x 10⁻⁵
1.0 x 10⁻⁵
0.1
0.035
The laboratory scale experiments for microbial growth and medium
design were executed in Erlenmeyer flasks, 150 ml in size with working
volume capacities of 33 ml. Microorganisms were inoculated at a cultivation
temperature of 37ºC and an agitation rate of 200 min-1 in agitation and
heating rate controlled orbital shakers.
The pilot scale batch bioreactor with a 3.0 dm3 volume (B.Braun CT2-2),
having a working volume of 1.65 dm3, and consisting of temperature, pH,
foam and stirring rate controls, was used for the investigation of oxygen
39
transfer effects. The bioreactor utilized an external cooler, steam generator
and a jacket around the bioreactor for sterilization and temperature control.
The bioreactor was stirred with two Rushton turbines and consisted of four
baffles, two six-bladed impellers, each of which has a diameter of 53 mm, and
a sparger.
All of the medium components were steam sterilized at 121oC for 20 min,
glucose being sterilized separately. Antibiotics were added to the medium
when the culture temperature was about 50oC; the final concentrations were
arranged as given in Table 3.3.
3.6 Analysis
Throughout the bioprocesses, samples were taken at characteristic
cultivation times. After determining the cell concentration, the medium was
centrifuged at 13500 min-1 for 10 min at 4oC to precipitate the cells. In
recombinant E. coli strains, precipitate was used to determine benzaldehyde
lyase activity after the lysis of the cell wall; supernatant was used for the
determination of glucose concentrations, organic acid concentrations, oxygen
uptake rate and liquid phase mass transfer coefficient values.
3.6.1 Cell Concentration
Cell concentrations based on dry weights were measured with a UV-Vis
spectrophotometer (Thermo Spectronic, Heλiosα) using a calibration curve
(Appendix A) obtained at 600 nm.
3.6.2 Benzaldehyde Lyase Activity
Benzaldehyde lyase activity was determined by measuring the
conversion of benzoin into benzaldehyde. Samples from the culture broth were
harvested by centrifugation (Sigma 1-15) at 13500 min-1 for 10 min at 4oC. In
order to determine activity of the intracellular benzaldehyde lyase in r-E. coli
strains, the cell walls were lyzed at f=10 s-1 for 10 minutes at the agitator
bead mill (Retsch, MM 200) by using 30% suspension of glass beads in activity
buffer of 40 mM Tris-HCl (pH=8.0), 0.02 mM TPP, 0.2 mM MgCl2 buffer. Fresh
substrate solutions were prepared daily by mixing 0.5 volume activity buffer
with 0.35 volume stock benzoin (0.1mM) and 0.15 volume 15%PEG solution
with a final concentrations of 0.035 mM benzoin, 20 mM Tris-HCl (pH=8.0),
0.01 mM TPP, 0.1 mM MgCl2, 7.5% PEG and incubated at 37oC. Stock benzoin
solution (0.1mM) was prepared in 15% PEG solution and used after overnight
incubation at room temperature. The conversion reaction was carried out at
37oC.
Reaction was started by the addition of 20 µl of samples to 3 cm3 of
substrate solution and further incubated for 10 seconds. Enzymatic activity
was monitored spectrophotometrically at 250 nm by following the change in
absorbance in ten seconds. The substrate benzoin and the product
benzaldehyde have similar absorbance maxima. However, since two molecules
of benzaldehyde are produced per each molecule of benzoin cleaved, the
following formula was used to relate absorbance change to product formed
(Gonzalez and Vicuna, 1989):
Nanomoles of product formed= [2(Af – Ai)/(εs-2εp)]*106
With εs and εp being molar extinction coefficients of the substrate and the
product, respectively. Af – Ai is the change in optical density during the
reaction time, measured at 250 nm. One unit of enzymatic activity was
defined as the amount of enzyme that catalyzes the cleavage of benzoin into
one nanomoles of benzaldehyde at 37oC and pH 8.0 in one second (Çalık et
al., 2004).
3.6.3 Reduced Sugar Concentration
Reduced sugar, glucose, concentration was determined by the glucose
oxidation method at 505 nm with a UV spectrophotometer (Boyaci et. al.,
2005). D-glucose is oxidized in the presence of glucose oxidase enzyme
(equation 3.1) and peroxide formed due to oxidation reaction is further
reacted with 4-aminoantipyrine and phenol in the catalysis of peroxidase to
form iminoquinone (equation 3.2) which gives spectro-photometrically
observable red color in proportion with glucose concentration.
22daseGlucoseoxy
2 2 OHGluconateOH O glucose-D +⎯⎯⎯⎯ →⎯++ (3.1)
40
OHinoquinoneOH 2peroxidase
22 Im Phenol yrineAminoantip-4 +⎯⎯⎯ →⎯++ (3.2)
The calibration curve was obtained from the slope of absorbance versus known
standard glucose concentration (Appendix B).
The method used in analysis of samples is given below:
1. The samples containing more than 1 g/L glucose were diluted to a
final concentration less than or equal to 1g/L.
2. 2 ml analysis solution was added to standard glucose solutions and
0.05 ml samples, respectively. Due to analysis procedure the test
tubes and analysis solution should be kept at room temperature.
3. Treated samples were incubated at either room temperature for 20
minutes or at 37˚C for 10 minutes. The sample passing through the
same steps but do not contain any reducing sugar is used as blank
and the absorbance values of the samples were measured by a UV
spectrophotometer at 505 nm.
3.6.4 Organic Acids Concentrations
Organic acid concentrations were measured with an organic acid analysis
system (Waters, HPLC, Alliance 2695). The method is based on reversed
phase HPLC, in which organic acid concentrations were calculated from the
chromatogram, based on the chromatogram of the standard organic acids
solution. Samples were filtered with 45 µm filters (ACRODISC CR PTFE) and
loaded to the analysis system with a mobile phase of 3.12% (w/v) NaH2PO4
and 0.62x10⁻³% (v/v) H3PO4. Needle and seal wash were conducted with 20%
(v/v) acenotrile. The analysis was performed under the conditions specified
below:
Column Capital Optimal ODS, 5µm
Column dimensions 4.6 x250 mm
System :Reversed phase chromatography
Mobile phase flow rate :0.8 ml/min
41
42
Column temperature :30 °C
Detector and wavelength
:Waters 2487 Dual absorbance detector,
210 nm
Injection volume :5 μl
Analysis period :15 min
3.6.5 Amino Acids Concentrations
Amino acid concentrations were measured with an amino acid analysis
system (Waters, HPLC), using the Pico Tag method (Cohen, 1983). The
method is based on reversed phase HPLC, using a pre-column derivation
technique with a gradient program developed for amino acids. The amino acid
concentrations were calculated from the chromatogram, based on the
chromatogram of the standard amino acids solution. Samples were filtered
with 45 µm filters (ACRODISC CR PTFE) and loaded to the analysis system
with a mobile phase of 6.0% (v/v) acenotrile, 1.79% (w/v) NaAc from solvent
A and 66.6% (v/v) acenotrile from solvent B.
The analysis was performed under the conditions specified below:
Column :Amino acid analysis column
(Nova-Pak C18, Millipore)
Column dimensions :3.9 mm x 30 cm
System :Reversed phase chromatography
Mobile phase flow rate :1 ml/min
Column temperature :38 °C
Detector and wavelength :UV/VIS, 254 nm
Injection volume :4 μl
Analysis period :20 min

43
3.6.6 Liquid Phase Mass Transfer Coefficient and Oxygen Uptake Rate
In order to determine the liquid phase mass transfer coefficient and
oxygen uptake rate in the benzaldehyde lyase production process, the
Dynamic Method (Rainer, 1990), as explained in section 2.3.3.3, was used.
Prior to inoculation of the microorganism to the production medium in the
bioreactor, the physical mass transfer coefficient (KLa0) was determined. After
inoculation of the microorganism to the bioreactor, the dynamic oxygen
transfer experiments were carried out at certain cultivation times for a short
period of time, so that the biological activities of the microorganisms are
unaffected. During this period, while the air inlet was totally ceased, the
agitation rate was lowered to N=50 min-1 in order to lower the effect of
surface aeration.
3.6.7 Saturation oxygen concentration determination
In order to calculate the dissolved oxygen concentration in the
fementation during the bioprocesses, saturation oxygen concentrations, CO2*,
were determined. For the saturation oxygen concentration measurements,
approximately 1000 ml of fermentation broth was prepared according to the
medium composition used at the beginning of the bioprocess and 1000 ml of
fermentation broth was collected at the end of each experiment performed in
pilot scale bioreactor. Fermentation broth sample was set to 37°C and stirred
with a magnetic stirrer. Air was compressed to the fermentation broth and
dissolved oxygen concentration was measured by an oxygen probe. After a
short period, dissolved oxygen concentration attained a constant value,
namely the saturation oxygen concentration, CO2*.

44
CHAPTER 4
RESULTS AND DISCUSSION
This study focuses on the effects of oxygen transfer conditions on the
intracellular synthesis of the enzyme benzaldehyde lyase in recombinant E.
coli BL21 (DE3) pLysS. For this purpose, the effects of oxygen transfer
together with the mass transfer coefficient (KLa), enhancement factor E
(=KLa/KLao), volumetric oxygen transfer rate, volumetric and specific
oxygen uptake rates, mass transfer and biochemical reaction resistances;
moreover, the variation in product and by-product distribution, specific
substrate uptake rates, yield and maintenance coefficient were investigated
on a defined medium with glucose and (NH4)2HPO4 as the carbon and
nitrogen sources (Table 3.3) in 3.0 dm3 pilot scale batch bioreactor (Braun
CT2-2) equipped with temperature, pH, foam, air inlet and stirring rate
controls with VR=1.65 dm3 working volume at six different conditions.
4.1 Oxygen Transfer Effects
In aerobic processes, oxygen is a key substrate for cell growth and,
therefore, continuous transfer of oxygen from the gas phase to liquid phase is
crucial. The effect of oxygen transfer was studied systematically for
benzaldehyde lyase production in recombinant E. coli BL21 (DE3) pLySs strain
by altering the parameters of air inlet rate, QO/VR, agitation rate, N, and
dissolved oxygen level, DO, at the stated conditions in Table 4.1.
This study was carried out at six different conditions with the
parameters, air inlet rate of QO/VR = 0.5 vvm and agitation rates of N= 250,
500, 625, and 750 min-1, and dissolved oxygen levels DO= 20%, 40% (CDO=
0.04, 0.08 mol m-3) of the saturation, while medium components were CG=
8.0 kg m-3, CN= 5.0 kg m-3 and salt solution at controlled pHc=7.2.

The operation conditions applied at Qo/VR= 0.5 vvm and N= 250, 500,
625, and 750 min-1, were named as OT1, OT2, OT3, and OT4 conditions; and
the last two operations at DO=20%, 40% were named as OT5 and OT6
conditions.
The investigation of the effects of oxygen transfer on benzaldehyde lyase
production was performed by batch-bioreactor experiments, in the bioreactor
system consisted of temperature, pH, foam, dissolved oxygen level, air inlet
and stirring rate controls with VR =1.65x10⁻³ m3 working volume.
Table 4.1 Oxygen transfer conditions and their abbreviations.
Oxygen Transfer
Condition Applied
N,min-1; QO/VR, vvm
Abbreviation
Oxygen Transfer
Condition Applied
N, min-1; QO/VR, vvm
Abbreviation
N=250, QO/VR = 0.5
N=500, QO/VR = 0.5
N=625, QO/VR = 0.5
OT1
OT2
OT3
N=750, QO/VR= 0.5
DO=20%
DO=40%
OT4
OT5
OT6
4.1.1 Dissolved oxygen
The variations in dissolved oxygen concentration with cultivation time,
air inlet rate and agitation rate are given in Figures 4.1 and 4.2. Solubility of
oxygen, CO2* in cultivation medium at 37°C was found as 0.21 mol m-3.
45
46
Dissolved oxygen (DO) level in the fermentation broth depends on the
extent of the oxygen transfer rate to the medium and to the oxygen uptake
rate of the cells. At all the oxygen transfer conditions, except OT5 and OT6
operations, illustrated on Figure 4.1, a generous decrease due to the rapid
uptake of dissolved oxygen by the microorganism was observed in the
dissolved oxygen concentration profiles but at different rates depending on the
amount of oxygen transferred to the medium and amount of oxygen
demanded by the microorganism. At OT1 condition, there was no oxygen
accumulation throughout the bioprocesses after t=0.5 h of bioprocess. At OT2
condition, due to the high oxygen demand of the cells between t=3-11 h,
transferred oxygen was totally consumed but oxygen profile suddenly
increased at the end of the bioprocesses which indicates that there is a
decrease in oxygen uptake of cells.
However at OT3 and OT4 conditions dissolved oxygen level decreased in
the first 5 hours; after t=5h , due to the decrease in oxygen uptake rate
dissolved oxygen level increased.
When the dissolved oxygen concentration profiles of the current study
were compared with that of obtained by Çalık et al. (2004), similar trends
were observed in the dissolved oxygen concentration profiles at the same
conditions.
At the OT5 and OT6 conditions, dissolved oxygen levels were controlled at
the values of DO= 20, 40% respectively, by keeping agitation rate at constant
value of N=625 min-1 and by considering air inlet rate as variable parameter.
As seen in the figure 4.2 at OT5 and OT6 conditions a sharp increase was
observed in the air flow rate profiles between t=3-5 h of bioprocess but at
different rate depending on oxygen demand of the cells during the growth
phase; before starting to decrease at the remaining hours of bioprocess.

0
10
20
30
40
50
60
70
80
90
100
0 2 4 6 8 10 12t,h
DO
%
0.5 vvm 500 min-1 0.5 vvm 750 min-10.5 vvm 625 min-1 0.5 vvm 250 min-1
Figure 4.1 The variations in the dissolved oxygen concentration with the
cultivation time, agitation and air inlet rates applied. CG=8.0 Kg m-3, T=37oC, VR=1.65×10⁻³ m3, pHc=7.2.
0
0.5
1
1.5
2
2.5
3
3.5
0 2 4 6 8 10 12
t, h
Qo/V
R ,
vvm
Figure 4.2 The variations in air flow rate with the cultivation time: OT5 (∆); OT6 (●). CG=8.0 Kg m-3, T=37°C, VR=1.65×10⁻³ m3, pHc=7.2.
47
48
4.2 Cell Growth Profiles
The variations in the cell concentration with cultivation time agitation and
air inlet rates applied are given in Figure 4.3.
At t=0-4 h of bioprocess, in all conditions except in OT1 condition, cell
formation did not change significantly with respect to the oxygen transfer
conditions applied. On the other hand, after t=4 h cell profiles altered
considerably throughout the bioprocess. In general, cell growth reached to
stationary phase after t=8 h when cell formation rate decreased at all the
conditions. The highest cell concentration was obtained at OT6 condition with
the value of CX=3.0 kg m-3 and the lowest cell concentration was observed at
OT1 condition as CX=1.19 kg m-3 where oxygen supply seems to be insufficient
for maintenance of oxidative metabolism among the investigated oxygen
transfer conditions.
The variation of cell concentration with the cultivation time should be
related to the dissolved oxygen concentration of the fermentation broth. In a
typical batch culture, the dissolved oxygen concentration decreases in the
media along with the growth time, until the microorganism reaches the
stationary phase and then the dissolved oxygen concentration increases. This
decreasing and increasing pattern in dissolved oxygen concentration with
respect to cell growth can be seen well on Figures 4.1 and 4.3.
In the study of Çalık et al. (2004), among the investigated oxygen
transfer conditions, the condition with agitation rate of N=500 min-1, air inlet
rate of Qo/VR=0.5 vvm, and medium composed of 8.0 kg m-3 glucose and 5.0
kg m-3 (NH4)2HPO4 were reported to be the optimum condition in terms of the
cell growth with a value of 2.3 kg m-3 in recombinant E. coli K12 carrying
pUC18::bal plasmid at pilot scale bioreactor with a working volume of 1.65
dm3. When the cell concentration of OT2 condition (CX=2.1 kg m-3) of the
current study is compared with that of the same condition (CX=2.3 kg m-3) of
Çalık et al. (2004), it can be concluded that the oxygen requirement of the E.
coli BL21 (DE3) pLySs strain is higher than that of E. coli K12 strain which
result in the lower cell concentration in the same condition.

0
0.5
1
1.5
2
2.5
3
3.5
0 2 4 6 8 10 12t, h
Cx,
kg m
-3
Figure 4.3 The variations in cell concentration with the cultivation time,
agitation rates and air inlet rates applied and medium contents: OT1
(□); OT2 (■); OT3 (○); OT4 (▲) OT5 (∆); OT6 (●). CG=8.0 Kg m-3, T=37°C,
VR=1.65×10⁻³ m3, pHc=7.2.
4.3 Glucose Concentration Profiles
The effect of oxygen transfer conditions on the consumption of glucose
which enters to the carbon metabolism from the beginning of the glycolysis
pathway, throughout the process is given in Figure 4.4.
In the first two hours of the bioprocess, the oxygen transfer conditions
applied did not affect the glucose consumption rate considerably; because
during this period the cell growth profiles did not also change considerably
with respect to the different oxygen transfer conditions. On the other hand,
between t=2-8 h with the increase in the cell formation rate, glucose
consumption rate increased.
At OT3, OT4, OT5, and OT6 conditions glucose depleted at t=8 h while at
OT1 and OT2 conditions it was totally consumed at t=10 h of the bioprocess.
49

Among the investigated oxygen transfer parameters, the highest
consumption rate was observed at OT6 condition, where the cell concentration
was the highest; whereas, the lowest glucose consumption rate was attained
at OT1 condition, where the cell concentration was low due to the oxygen
limitation. So it can be concluded that glucose concentration profiles coincide
with the cell growth at all operation conditions. Where the higher glucose
utilization rate was observed, the higher cell growth rate was obtained.
When the glucose concentration profiles of the present study were
compared with the findings of Çalık et al. (2004) at the same oxygen transfer
conditions, where the glucose consumption rates were the lower, it can be
concluded that, E. coli BL21 (DE3) pLySs strain requires more glucose as
carbon source to maintain the optimum state of cell growth than E. coli K12
dose.
0
2
4
6
8
10
0 2 4 6 8 10 12t,h
CG
,kg
m-3
Figure 4.4 The variations in glucose concentration with the cultivation time,
agitation rates and air inlet rates applied and medium contents: OT1
(□); OT2 (■); OT3 (○); OT4 (▲) OT5 (∆); OT6 (●). CG=8.0 Kg m-3, T=37°C,
VR=1.65×10⁻³ m3, pHc=7.2.
50

4.4 Benzaldehyde Lyase Activity Profiles
The variations of benzaldehyde lyase volumetric activity with the
cultivation time at the oxygen transfer conditions applied are given in Figure
4.5.
The highest benzaldehyde lyase volumetric activity was obtained at OT6
condition (A=1095 U/cm3), where the highest cell concentration and the
highest glucose consumption rate was obtained. On the other hand, at t=12 h
the lowest benzaldehyde lyase volumetric activity (A=459 U cm-3) was
obtained at OT1 condition among the investigated oxygen transfer conditions.
0
200
400
600
800
1000
1200
0 2 4 6 8 10 12t, h
A, U
cm
-3
Figure 4.5 The variations in benzaldehyde lyase volumetric activity with the
cultivation time, agitation and air inlet rates applied: OT1 (□); OT2 (■);
OT3 (○); OT4 (▲) OT5 (∆); OT6 (●). CG=8.0 Kg m-3, T=37°C, VR=1.65×10-
3 m3, pHc=7.2.
51

52
When benzaldehyde lyase volumetric activity (A=923 U cm-3) at OT2
condition of the current study is compared with the optimum benzaldehyde
lyase volumetric activity (A=860 U cm-3) of Çalık et al. (2004), it is concluded
that, the capability of E. coli BL21 (DE3) pLySs strain in the benzaldehyde
lyase production is better than E. coli K12 strain. Since in production, the aim
is to obtain the maximum volumetric benzaldehyde lyase activity and cell
concentration; it is essential to increase the concentration of the benzaldehyde
lyase producing cells. Therefore, it is concluded that to increase benzaldehyde
lyase production by E. coli BL21 (DE3) pLySs strain , the bioreactor should be
operated at OT6 (DO=40%) condition, where the highest amount of the cell
was formed.
In most of the studies performed with E. coli, dissolved oxygen level was
kept constant ranging between 10-30% by either changing the air flow rate
(Luli et al., 1990) or agitation rate in fed batch processes with automated
control systems (Akesson et al., 2001; Johnston et al., 2003). Similarly, in this
study the optimum condition in terms of cell concentration and benzaldehyde
lyase activity was achieved at constant dissolved oxygen level determined by
changing the air flow rate, and the optimum constant dissolved oxygen value
was obtained at OT6 condition as DO=40%. When the air inlet flow rate profile
of OT5 operation was compared with that of OT6, it can be concluded that the
insufficient oxygen supply was the reason of low cell concentration and enzyme
activity at this condition.
4.5 Organic Acid Concentration Profiles
The variations in the organic acids detected in the fermentation broth
with the cultivation time and oxygen transfer conditions were demonstrated in
Table 4.2.
Apparently, for all oxygen transfer conditions, acetic acid is the major by-
products in the fermentation medium. One of the main challenges in total
productivity in E. coli cultivation is onset of acetic acid production which is
known to inhibit the cell growth and recombinant protein production (Shiloach
et al., 1996; Johnston et al., 2003; Akesson et al., 2001; Luli et al., 1990; Çalık
et al., 2004, 2006). The reason is the accumulation of undissociated

53
(protonated- CH3COOH) form of acetic acid in the medium. Since undissociated
state of acetate is lipophilic, it can freely permeate the cell membrane and
accumulate in the medium. When a fraction of undissociated acid present
extracellularly re-enters the cell, it dissociates (ionized- CH3COO-) at the
relatively higher intracellular pH. When this process continues, the intracellular
pH decreases and hence the ΔpH component of the promotive force collapses.
Thus, apart from energy consumption for rapid growth, E. coli requires energy
for maintenance of optimum intracellular pH which leads to inhibition on cellular
efficiency (Stephanopoulos, 1998; Luli et al., 1990).
E. coli BL21 (DE3) pLySs strain was derived from E. coli B which was
reported to be a low acetate producer (Luli et al., 1990; Shiloach et al., 1996).
In general, formation of acetate in E. coli occurs when oxygen limitation and
excess carbon source, especially glucose, are present. The latter cause of
aerobic acidogenesis under glucose mediated fermentations is known as
Crabtree effect or overflow metabolism (Doelle et al., 1982).
Table 4.2 Organic acids detected in the fermentation broth with cultivation
time at the oxygen transfer conditions applied.
OT1, COA (kg.m-3)
Time(h) 2 4 6 8 10 12 Ac 0.1148 0.5902 0.8430 1.3836 3.1608 2.6332 Form 0.0060 0.0969 0.0713 0.1037 0.0777 0.0557 Cit 0.0747 0.1185 0.1977 0.3535 0.7992 0.9495 Mal - - - - - - Suc - - - - - - TOA 0.1955 0.8056 1.1120 1.8408 4.0377 3.6384
OT2, COA (kg.m-3)
Time(h) 2 4 6 8 10 12 Ac 0.0778 0.2518 0.6958 1.7248 1.0952 1.4076 Form 0.0044 0.0086 0.0013 0.0288 0.0183 0.0181 Cit 0.0898 0.1138 0.2409 0.3006 0.0875 0.0770 Mal - - - - - - Suc - - - 0.0232 0.0707 0.0614 TOA 0.1720 0.3742 0.9380 2.0774 1.2717 1.5641

54
OT3, C OA (kg.m-3)
Time (h) 2 4 6 8 10 12
Ac 0.0504 0.1722 0.2688 0.3512 0.5940 0.4680 Form - 0.0482 0.2838 0.8282 0.0213 0.0090 Cit 0.0950 0.0173 0.1767 0.1823 0.1023 0.0883 Mal - - - 0.1590 0.1886 0.1433 Suc - 0.0189 0.0408 - 0.1460 0.1075 TOA 0.1454 0.2566 0.7701 1.5207 1.0522 0.8161
OT4, COA (kg.m-3)
Time (h) 2 4 6 8 10 12 Ac 0.0596 0.1640 0.2596 0.3448 0.3824 0.3596 Form 0.0044 0.0093 0.3000 0.4460 0.0068 0.0130 Cit 0.0878 0.0986 0.1645 0.1828 0.0784 0.0735 Mal - - 0.0582 0.1340 0.1322 0.1261 Suc - 0.0215 - - 0.0780 0.0740 TOA 0.1518 0.2934 0.7823 1.1076 0.6778 0.6462
OT5, COA (kg.m-3)
Time (h) 2 4 6 8 10 12 Ac 0.0596 0.2892 0.4016 0.5108 0.6436 0.4976 Form - 0.0620 0.1530 0.2605 0.0198 0.0075 Cit 0.0864 0.1161 0.1357 0.1807 0.1527 0.0392 Mal - - - 0.0907 0.1387 0.1087 Suc - 0.0114 0.0235 0.0169 0.0819 0.0603 TOA 0.1460 0.4787 0.7138 1.0596 1.0367 0.7133 OT6, COA (kg.m-3) Time (h) 2 4 6 8 10 12 Ac 0.0498 0.2322 0.3118 0.4064 0.3468 0.3388 Form 0.0387 0.0390 0.2079 0.2079 0.0333 0.0880 Cit 0.0954 0.0982 0.1451 0.2424 0.0494 0.0491 Mal - 0.0076 - 0.1474 0.1035 0.1233
Suc 0.0155 0.0288 0.0684 0.0654 0.0920 0.1127
TOA 0.1994 0.4058 0.7332 1.0695 0.6250 0.7119
Almost for all the oxygen transfer conditions applied, acetic, formic, citric,
malic and succinic acids were detected in the fermentation broth. Presence of
55
the organic acids of the TCA cycle, i.e., citric, succinic and malic acid may be a
consequence of inadequate oxygen supply which leads to repression on the
TCA cycle enzymes or their improper activity. Apart from the effect of limiting
oxygen, due to glucose depletion at t=8h, the lower amount of organic acid at
t=10 was obtained in almost all oxygen transfer conditions. Similarly, in the
study of Çalık et al. (2004), under oxygen limiting conditions the TCA cycle
organic acids of α-ketoglutaric acid and succinic acid were found in the medium
showing insufficient operation of the TCA cycle under low oxygen transfer
conditions and high acetate accumulation, up to 2.5 kg m-3 was observed,
where recombinant E. coli K12 was the host microorganism.
As seen in the figure 4.6 the highest acetate accumulation occurred in
OT1 condition, where the lowest cell concentration and the lowest glucose
consumption rate were observed, as CAC=3.16 kg m-3 at t=10 h; and the
lowest amount of the acetate was detected at OT6 condition, where the highest
cell concentration was obtained, as CAC=0.34 kg m-3 at t=12h. All the oxygen
transfer conditions except OT2 and OT6, show similar trend in terms of acetate
accumulation in the fermentation broth. Acetate concentration increases and
reaches a peak value at t=10h (except OT2), then decreases (Figure 4.6).
However in OT2 condition acetate concentration gives a maximum at t=8 h.
The change in the metabolic activity can be explained by activation of the
acetate utilization pathways in response to an acetate accumulation in the
fermentation broth, or a decrease in the glucose uptake rate, or with their
concerted effect (Shiloach et al., 1996).
0
0.5
1
1.5
2
2.5
3
3.5
4
0 2 4 6 8 10 12
t, h
CA
cetic
, Kg
m-3
Figure 4.6 The variations in acetic acid concentration with the cultivation time,
agitation and air inlet rates: OT1 (□); OT2 (■); OT3 (○); OT4 (▲) OT5 (∆);
OT6 (●). CGo =8.0 kg m-3, T=37°C, VR= 1.65x10⁻³ m3, pHc=7.2.
0
1
2
3
4
5
0 2 4 6 8 10 12
t, h
Cto
tal o
rgan
ic a
cid,
kg m
-3
Figure 4.7 The variations in total organic acid concentration with the
cultivation time, agitation and air inlet rates: OT1 (□); OT2 (■); OT3 (○);
OT4 (▲) OT5 (∆); OT6 (●). CGo =8.0 kg m-3, T=37°C, VR=1.65x10⁻³ m3,
pHc=7.2.
56
57
4.6 Amino Acid Concentration Profiles
The variations in amino acid concentrations with the cultivation time with
respect to oxygen transfer conditions used were listed in Table 4.3.
Most microorganisms have the metabolic machinery to synthesize all
essential amino acids from carbon and nitrogen sources for the production of
proteins. Aspartic acid, asparagine, cysteine, glutamic acid, isoleucine, leucine,
lysine, serine, threonine, tyrosine, valine, and ornithine are the amino acids
that were detected in the medium, but in very low amounts. The highest total
amino acids produced was at OT6 condition at t=10 h as TAA=0.1737 kg m-3,
followed by OT1 condition as a TAA=0.0734 kg m-3. For all conditions studied,
aspartic acid was the major amino acid excreted, which indicates that the
demand for aspartic acid should be lower than the produced amount, thus it
was excreted to the fermentation broth.
Table 4.3 The variations in amino acid concentrations with the cultivation time
at the oxygen transfer conditions applied.
OT1, CAA (kg.m-3)
Time (h) 0 2 4 6 8 10 12
Asp 0.0128 - 0.012 0.038 - 0.015 - Asn 0.0 - 0.0 0.019 - 0.011 - Cys 0.0056 - 0.0016 0.0 - 0.0 - Glu 0.0 - 0.0 0.0 - 0.0 - Iso 0.0 - 0.0 0.0 - 0.0 - Leu 0.0 - 0.01 0.087 - 0.038 - Lys 0.0095 - 0.0 0.0 - 0.0 - Ser 0.0044 - 0.0 0.0028 - 0.0014 - Orn 0.0 - 0.0 0.0 - 0.0 - Thr 0.073 0.0 0.0 - 0.0 - Tyr 0.0 - 0.018 0.017 - 0.008 - Val 0.039 - 0.006 0.0 - 0.0 -
TAA 0.1443 - 0.0476 0.1638 - 0.0734 -

58
OT2, CAA (kg.m-3) Time (h) 0 2 4 6 8 10 12
Asp 0.0128 - 0.018 0.011 - 0.0 - Asn 0.0 - 0.0 0.0 - 0.0 - Cys 0.0056 - 0.01 0.008 - 0.0 - Glu 0.0 - 0.0 0.0 - 0.0 - Iso 0.0 - 0.0 0.0 - 0.0 - Leu 0.0 - 0.0 0.0 - 0.0 - Lys 0.0095 - 0.0 0.0 - 0.0 - Ser 0.0044 - 0.0 0.0 - 0.0 - Orn 0.0 - 0.0 0.0 - 0.0 - Thr 0.073 0.0 0.0 - 0.0 - Tyr 0.0 - 0.0 0.0 - 0.0 - Val 0.039 - 0.0 0.0 - 0.0 - TAA 0.1443 - 0.028 0.019 - 0.0 -
OT3, CAA (kg.m-3)
Time (h) 0 2 4 6 8 10 12
Asp 0.0128 - 0.0 0.016 - 0.03 - Asn 0.0 - 0.01 0.0 - 0.0 - Cys 0.0056 - 0.0 0.0 - 0.0 - Glu 0.0 - 0.0 0.0 - 0.0 - Iso 0.0 - 0.0004 0.002 - 0.0 - Leu 0.0 - 0.008 0.0 - 0.0 - Lys 0.0095 - 0.0 0.0 - 0.0 - Ser 0.0044 - 0.01 0.009 - 0.0045 - Orn 0.0 - 0.0 0.0 - 0.002 - Thr 0.073 - 0.0 0.0 - 0.0 - Tyr 0.0 - 0.0 0.006 - 0.006 - Val 0.039 - 0.0 0.0 - 0.0 - TAA 0.1443 - 0.0284 0.033 - 0.0425 -
OT4, CAA (kg.m-3)
Time (h) 0 2 4 6 8 10 12
Asp 0.0128 - 0.207 0.016 - 0.014 - Asn 0.0 - 0.0 0.0 - 0.0 - Cys 0.0056 - 0.0 0.0 - 0.0 - Glu 0.0 - 0.0 0.0 - 0.0 - Iso 0.0 - 0.0 0.0 - 0.0 - Leu 0.0 - 0.0057 0.0 - 0.0 - Lys 0.0095 - 0.006 0.0 - 0.0046 - Ser 0.0044 - 0.003 0.005 - 0.0035 - Orn 0.0 - 0.0 0.0 - 0.0 - Thr 0.073 - 0.0 0.0 - 0.0 - Tyr 0.0 - 0.01 0.0 - 0.0061 - Val 0.039 - 0.0 0.0 - 0.0 -
TAA 0.1443 - 0.2287 0.021 - 0.0282 -
59
OT5, CAA (kg.m-3) Time (h) 0 2 4 6 8 10 12
Asp 0.0128 0.0267 0.011 0.015 0.012 0.012 0.011 Asn 0.0 0.0 0.0 0.0 0.0 0.0 0.0 Cys 0.0056 0.003 0.0 0.0 0.0 0.003 0.0 Glu 0.0 0.0 0.0 0.0 0.0 0.0 0.0 Iso 0.0 0.0 0.0 0.0025 0.0 0.0 0.0017 Leu 0.0 0.0 0.0 0.013 0.0 0.0 0.0 Lys 0.0095 0.0 0.0 0.0 0.0043 0.012 0.0 Ser 0.0044 0.0031 0.003 0.008 0.0079 0.007 0.0055 Orn 0.0 0.0 0.0 0.0 0.0 0.0 0.0 Thr 0.073 0.0 0.0 0.0 0.0 0.0 0.0 Tyr 0.0 0.008 0.0 0.0 0.0034 0.004 0.0 Val 0.039 0.0 0.0 0.0 0.0 0.0 0.0
TAA 0.1443 0.0408 0.014 0.0385 0.0276 0.038
0.0182
OT6, CAA (kg.m-3)
Time (h) 0 2 4 6 8 10 12
Asp 0.0128 0.0 0.0 0.0 0.196 0.0 0.0 Asn 0.0 0.0 0.0 0.0 0.01 0.017 0.0 Cys 0.0056 0.0043 0.0 0.014 0.0055 0.0 0.0 Glu 0.0 0.0 0.0 0.0 0.0 0.009 0.0 Iso 0.0 0.0 0.0032 0.0 0.0 0.0 0.0 Leu 0.0 0.0 0.0 0.0 0.0 0.0 0.0 Lys 0.0095 0.0079 0.011 0.0096 0.016 0.145 0.001 Ser 0.0044 0.0049 0.0044 0.017 0.0 0.0027 0.0099 Orn 0.0 0.0 0.0 0.0 0.0 0.0 0.0 Thr 0.073 0.0 0.0 0.0 0.054 0.0 0.0 Tyr 0.0 0.0 0.0 0.0 0.0 0.0 0.0 Val 0.039 0.0 0.0 0.0 0.016 0.0 0.0
TAA
0.1443 0.0171 0.0186 0.0406 0.2975 0.1737 0.0109
4.7 Oxygen Transfer Characteristics
The Dynamic Method was applied to find the oxygen transfer parameters,
i.e., oxygen uptake rate (OUR), r0, and oxygen transfer coefficient, KLa. At t<0
h, the physical oxygen transfer coefficient KLao was measured in the medium in
the absence of the microorganism. The variations in KLa, enhancement factor E
(=KLa/KLao), oxygen uptake rate (OUR), oxygen transfer rate (OTR),
60
maximum oxygen utilization rate (OD), Damköhler number (Da) and
effectiveness factor (η) calculated throughout the bioprocess are given in Table
4.4.
Volumetric mass transfer coefficients (KLa) and the enhancement factor
(E) found were increased with the increase in the oxygen transfer, i.e. QO/VR
and N, at all the operation conditions except OT5 and OT6. The low values of
KLa could be explained as result of the high values of driving force at OT5 and
OT6 conditions where dissolved oxygen levels were controlled at the values of
DO= 20, 40%, respectively.
At all the operation conditions KLa and E values were higher in the
growth phase of the microorganism than in the benzaldehyde lyase production
phase. KLa depends on agitation rate, temperature, and rheological properties
of the fermentation medium and presence of fine particles in the mass transfer
zone. Temperature and agitation rate were kept constant throughout the
bioprocess, therefore the reason for the observed decrease at some conditions
in KLa, could be due to the increase in viscosity of the medium due to the
secreted metabolites. Furthermore, particles with a diameter somewhat greater
than the thickness of the mass transfer layer enhance the gas absorption, but
the enhancement decreases by increasing particle diameter; therefore, along
with the increase in the concentration of the rod-shaped micro-bioreactors, the
mass transfer coefficient may increase or decrease depending on the diameter
and concentration of the biomass (Çalık et al., 1998). The highest KLa and
consequently E were obtained in OT4 operation at t=5 h of the bioprocess as
0.039 s-1 and 1.86 respectively. The lowest KLa value as 0.005 s-1 at t=10 h of
the bioprocess was obtained in OT6 condition where the highest cell
concentration was observed.

61
Table 4.4 The variations in oxygen transfer parameters.
t
(h)
kLa
(s-1)
E
kLa/kLa0
OTRx103
(molm-3s-1)
OTRmaxx103
(molm-3s-1)
OURx103
(molm-3s-1)
ODx103
(molm-3s-1)
Da
OD/OTRmx
η
OUR/OD
0.25 0.008 1.05 1.08 1.68 0.70 1.71 1.02 0.41
1 - - - - - - - -
3 - - - - - - - -
5 - - - - - - - -
OT1
10 - - - - - - - -
0.25 0.017 1.42 1.03 3.57 1.2 1.27 0.36 0.94
1 0.019 1.58 1.47 3.99 1.5 1.66 0.42 0.90
3 - - - - - - - -
5 - - - - - - - -
OT2
10 - - - - - - - -
0.25 0.022 1.57 0.63 4.62 0.90 0.99 0.22 0.90
1 0.023 1.65 0.74 4.83 1.3 2.08 0.43 0.62
3 0.025 1.78 2.14 5.25 2.2 3.62 0.69 0.60
5 0.021 1.5 2.63 4.41 2.2 7.07 1.60 0.31
OT3
10 0.020 1.43 0.2 4.20 0.40 81.69 19.45 0.005
0.25 0.034 1.62 0.81 7.56 1.10 1.18 0.16 0.93
1 0.036 1.71 0.85 6.93 1.30 1.66 0.22 0.78
3 0.038 1.81 1.92 8.19 2.40 4.13 0.52 0.58
5 0.039 1.86 2.48 8.61 2.50 7.74 0.94 0.32
OT4
10 0.037 1.76 0.55 5.88 0.60 138.81 17.86 0.04
0.25 0.007 - 0.90 1.41 0.90 1.18 0.83 0.76
1 0.008 - 1.20 1.76 1.20 1.69 0.96 0.71
3 0.011 - 1.50 2.28 1.50 3.37 1.48 0.44
5 0.008 - 1.40 1.75 1.40 5.11 2.93 0.27
OT5
10 0.007 - 0.80 1.44 0.80 56.21 38.99 0.01
0.25 0.007 - 0.90 1.37 0.90 1.29 0.94 0.69
1 0.01 - 1.20 2.16 1.20 1.98 0.92 0.60
3 0.017 - 2.00 3.57 2.00 3.29 0.92 0.60
5 0.014 - 1.90 2.91 1.90 8.26 2.84 0.23
OT6
10 0.005 - 0.60 1.07 0.60 60.66 56.42 0.01
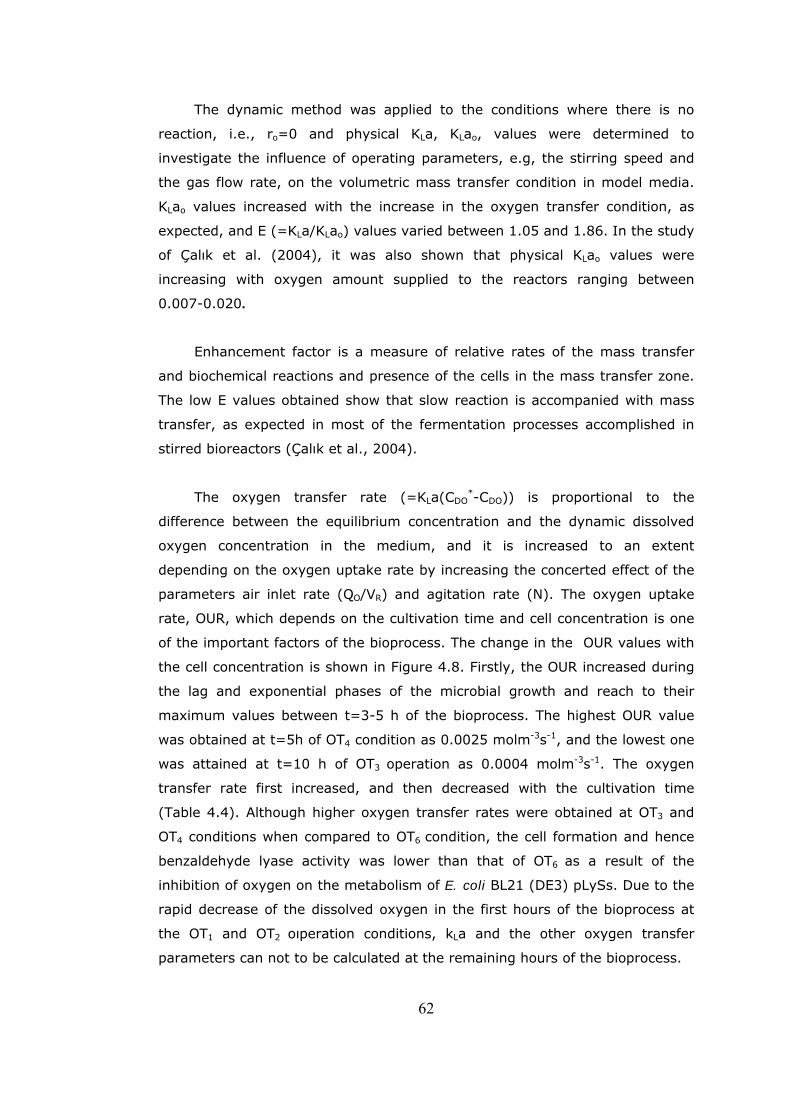
62
The dynamic method was applied to the conditions where there is no
reaction, i.e., ro=0 and physical KLa, KLao, values were determined to
investigate the influence of operating parameters, e.g, the stirring speed and
the gas flow rate, on the volumetric mass transfer condition in model media.
KLao values increased with the increase in the oxygen transfer condition, as
expected, and E (=KLa/KLao) values varied between 1.05 and 1.86. In the study
of Çalık et al. (2004), it was also shown that physical KLao values were
increasing with oxygen amount supplied to the reactors ranging between
0.007-0.020.
Enhancement factor is a measure of relative rates of the mass transfer
and biochemical reactions and presence of the cells in the mass transfer zone.
The low E values obtained show that slow reaction is accompanied with mass
transfer, as expected in most of the fermentation processes accomplished in
stirred bioreactors (Çalık et al., 2004).
The oxygen transfer rate (=KLa(CDO*-CDO)) is proportional to the
difference between the equilibrium concentration and the dynamic dissolved
oxygen concentration in the medium, and it is increased to an extent
depending on the oxygen uptake rate by increasing the concerted effect of the
parameters air inlet rate (QO/VR) and agitation rate (N). The oxygen uptake
rate, OUR, which depends on the cultivation time and cell concentration is one
of the important factors of the bioprocess. The change in the OUR values with
the cell concentration is shown in Figure 4.8. Firstly, the OUR increased during
the lag and exponential phases of the microbial growth and reach to their
maximum values between t=3-5 h of the bioprocess. The highest OUR value
was obtained at t=5h of OT4 condition as 0.0025 molm-3s-1, and the lowest one
was attained at t=10 h of OT3 operation as 0.0004 molm-3s-1. The oxygen
transfer rate first increased, and then decreased with the cultivation time
(Table 4.4). Although higher oxygen transfer rates were obtained at OT3 and
OT4 conditions when compared to OT6 condition, the cell formation and hence
benzaldehyde lyase activity was lower than that of OT6 as a result of the
inhibition of oxygen on the metabolism of E. coli BL21 (DE3) pLySs. Due to the
rapid decrease of the dissolved oxygen in the first hours of the bioprocess at
the OT1 and OT2 oıperation conditions, kLa and the other oxygen transfer
parameters can not to be calculated at the remaining hours of the bioprocess.

63
In order to analyze the limiting step of the growth process, the maximum
possible OUR (OD) and the maximum oxygen transfer rate were calculated in
the course of the fermentation. Relation between both maximum rates is the
modified Damköhler number, Da (Çalık et al., 2000). The evolution of Da with
cell concentration was shown in Figure 4.9. As seen in the Figure and Table
4.4, Da highly depends on the stirrer speed. The highest and lowest profiles
were achieved OT5 and OT4 respectively. It can be concluded that OT5 operation
was a mass-transfer-limited condition, which resulted a higher profile of Da. Da
increased, when the maximum oxygen transfer rate decreased by the increase
in mass transfer resistance. As OT4 condition attained the highest maximum
oxygen transfer rate profile and hence the lowest mass transfer resistance, it
had the lowest profile for Da.
The effectiveness factor, η, defined as the ratio between the observed
biochemical reaction rate and the formal reaction rate, without mass transfer
(Calık et al., 2000). As seen in Table 4.4, η took value close to 1.0 at OT2, OT3
and OT4 conditions at t=0-0.25 h indicating that the cells are consuming
oxygen with such a high rate that maximum possible oxygen utilization (OD)
value was approached; thereafter the decrease in η indicates that the cells are
consuming lower oxygen than the OD. On the other hand, at OT1, OT5 and OT6
conditions, starting from the beginning of the processes, cells consumed
oxygen lower than the oxygen demand (OD) due to the low oxygen transfer
rate.
Film effectiveness factor, η, is inversely proportional with Da and cell
concentration and this proportionally can be observed in Figures 4.10 and 4.11.
As the maximum oxygen utilization rate increased with increase in the cell
concentration, Da increased and consequently, η decreased which is inversely
proportional to the maximum oxygen utilization rate.

0.00E+00
5.00E-04
1.00E-03
1.50E-03
2.00E-03
2.50E-03
3.00E-03
0 0.5 1 1.5 2 2.5 3 3.5
Cx, kg m-3
OU
R, m
ol m
-3s-1
Figure 4.8 The variation of OUR with cell concentration, agitation and air inlet rates: OT3 (○); OT4 (▲) OT5 (∆); OT6 (●). CG
o = 8.0 kg m-3, T=37°C, VR= 1.65x10⁻³ m3, pHc=7.2.
0.1
1
10
100
0 0.5 1 1.5 2 2.5 3 3.5
Cx ,kg m-3
Da
Figure 4.9 The variation of Da (OD/OTRmax) with cell concentration, agitation
and air inlet rates: OT3 (○); OT4 (▲) OT5 (∆); OT6 (●). CGo = 8.0 kg m-
3, T=37°C, VR= 1.65x10⁻³ m3, pHc=7.2.
64
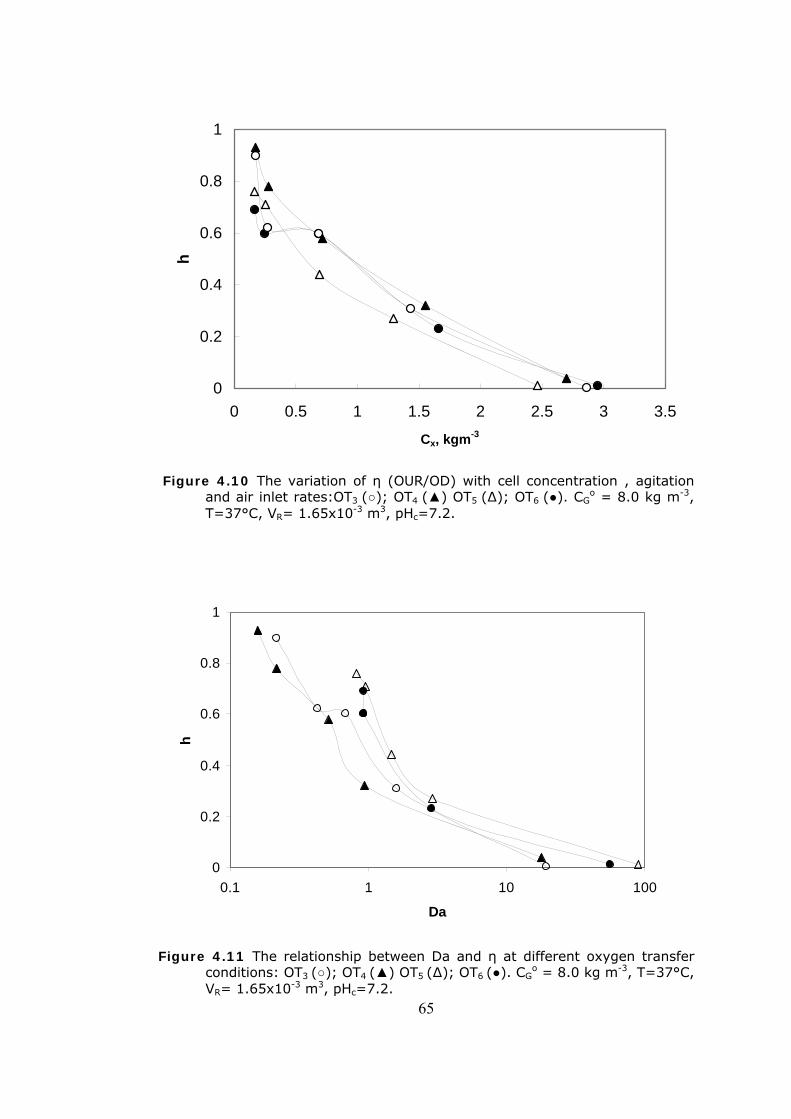
0
0.2
0.4
0.6
0.8
1
0 0.5 1 1.5 2 2.5 3 3.5
Cx, kgm-3
h
Figure 4.10 The variation of η (OUR/OD) with cell concentration , agitation and air inlet rates:OT3 (○); OT4 (▲) OT5 (∆); OT6 (●). CG
o = 8.0 kg m-3, T=37°C, VR= 1.65x10⁻³ m3, pHc=7.2.
0
0.2
0.4
0.6
0.8
1
0.1 1 10 100
Da
h
65
Figure 4.11 The relationship between Da and η at different oxygen transfer conditions: OT3 (○); OT4 (▲) OT5 (∆); OT6 (●). CG
o = 8.0 kg m-3, T=37°C, VR= 1.65x10⁻³ m3, pHc=7.2.

66
4.8 Specific Growth Rate, Yield and Maintenance Coefficients
The variations in the specific growth rate, µ, the specific oxygen uptake
rate, q0, maintenance coefficients for oxygen, m0 and m0’, and maintenance
coefficients for substrate, ms and ms’ and the yield coefficients with the
cultivation time are given in Table 4.6.
As it is seen in the Figure 4.12, specific growth rates decreased with the
cultivation time and approaches to 0 as the cells get closer to the stationary
phase at all the oxygen transfer conditions, as expected; but the decrease in
specific growth rate was higher at high oxygen transfer conditions. The highest
specific growth rate (μ) was obtained as μmax=0.81 h-1 at t=0.25 h at OT2
condition and the highest cell concentration was achieved among the operation
conditions at OT6 as Cx=3.0 Kgm-3 at t=12h. The maximum specific growth rate
in the study of Çalık et al. (2004) was reported as 1.19 h-1 at t=1 h at HOT1
(N=750 min-1, Qo/VR=0.5 vvm) condition and the same trend in the specific
growth rate values was observed.
Specific oxygen uptake rates (qO) and specific substrate utilization rates
(qS) decreased with the cultivation time between t=1-10 h of bioprocess at all
the oxygen transfer conditions. The highest value of qO was obtained at t=1 h
of OT4 and OT2 conditions as 0.72 kg kg-1 h-1; where the lowest value was
obtained at t=10 h of OT3 condition as 0.016 kg kg-1 h-1. The highest value of
qS was obtained at t=1 h of OT6 condition as 1.97 kg kg-1 h-1.
The yield coefficients, which represent the overall distribution and the
efficiency of conversion reactions, were given in Table 4.6. The highest overall
specific cell yield on substrate (YX/S) value was obtained at OT6 as 0.354, due
to the increased efficiency of the utilization of the carbon source for product
formation; while the lowest value was 0.13 obtained at OT1 condition.
Cell yield on oxygen values increased between t=1-5 h of bioprocess with
cultivation time and took the maximum value between t=3-5 h before the
reduction at the remaining time of the process, where the cell growth reached
to stationary phase. The highest YX/O value was obtained at OT5 condition at

67
t=5 h as 1.88 kg kg-1 followed by OT6 condition with a value of 1.55 kg kg-1at
t=3 h. The lowest YX/O value was obtained at OT4 at t=10 h as 0.14 kg kg-1
indicating the inefficient use of the oxygen through biochemical reaction
network, probably due to the inhibition effect of oxygen on metabolism.
Similarly, the amount of substrate metabolized per amount of oxygen
used (YS/O) increased between t=1-5 h of bioprocess with cultivation time and
took the maximum value at t=5 h before the reduction at the remaining time
of the process signaling either the increased energy requirement or decrease in
the efficiency of energy metabolism with the cultivation time (çalık et al.,
2006). The highest YS/O was obtained as 6.54 kg kg-1 at OT6 condition at t= 5
h; while the lowest YS/O was obtained as 0.68 kg kg-1 at OT5 condition at t= 10
h (Table 4.6). The amount of substrate consumed per amount of oxygen
utilized, YS/O, values were higher in E. coli BL21 (DE3) pLySs cells relative to E.
coli K12 cells (Çalık et al., 2004) at the exponential phase of the processes.
Therefore, there can be suggested that E. coli BL21 (DE3) pLySs cells require
much more energy for effective glucose utilization to maintain the optimum
state of cell growth than E. coli K12 does.
From the slope of the plot of 1/YX/O versus 1/μ, the rate of oxygen
consumption for maintenance were obtained, and the variation of mO and mO’
with the oxygen transfer conditions applied is given in Table 4.6. The mO values
varied between 0.02-0.43 kg kg-1 h-1, and mO’ varied between 0.08-0.42 kg kg-
1 h-1. The highest value for mO and mO’ were obtained at OT3 and OT6 conditions
as 0.43 and 0.42 kg kg-1 h-1 respectively. And similarly, the rate of substrate
consumption for maintenance mS and mS’ values were obtained for each
oxygen transfer condition. The mS values varied between 0.01-0.35 kg kg-1 h-1,
and ms’ varied between 0.04-0.11 kg kg-1 h-1. The highest value for ms and ms’
were obtained at OT3 and OT6 conditions as 0.35 and 0.11 kg kg-1 h-1
respectively. The calculation procedure of maintenance coefficients was
explained in section 2.3.1.2; the Leudeking-Piret constants calculated for the
bioprocesses are given in Table 4.5.

68
Table 4.5 The variations in Leudeking-Piret constants
α β
OT1 2.4521 0.1221
OT2 0.3975 0.1034
OT3 0.3069 0.1248
OT4 0.1607 0.0763
OT5 0.5179 0.0206
OT6 0.3124 0.0889
Fi
gure 4.12 The variations in specific growth rate with the cultivation time,
agitation and air inlet rates: OT1 (□); OT2 (■); OT3 (○); OT4 (▲) OT5 (∆);
OT6 (●). CGo = 8.0 kg m-3, T=37°C, VR= 1.65x10⁻³ m3, pHc=7.2.
, h-1
µ, h
-1
0
0.2
0.4
0.6
0.8
1
0 2 4 6 8 10 12
t, h

69
Table 4.6 The variations in specific growth rate and yield coefficients.
Condition t (h)
µ (h-1)
qo
(kgkg-1h-1)
qs
(kgkg-1h-1) Yx/s (kgkg-1)
Yx/o (kgkg-1)
Ys/o (kgkg-1)
mo
(kgkg-1h-1)mo’ (kgkg-1h-1)
ms
(kgkg-1h-1) ms’ (kgkg-1h-1)
0.25 0.35 0.44 1.19 0.29 0.79 2.69 - - - - OT1Overall 0.13 0.25 0.81 0.72 1.21 0.45 0.76 1.68 - - - - 1 0.77 0.72 1.46 0.53 1.07 2.03 - - - - OT2
Overall 0.24 0.25 0.77 0.61 1.65 0.46 1.27 2.75 1 0.53 0.55 1.39 0.38 0.96 2.53 3 0.51 0.37 1.63 0.34 1.41 4.15 0.43 0.412 0.35 0.09 5 0.31 0.18 0.92 0.29 1.50 5.18 10 0.004 0.02 0.02 0.19 0.26 1.37
OT3
Overall 0.34

70
Condition t (h)
µ (h-1)
qo
(kgkg-1h-1)
qs
(kgkg-1h-1) Yx/s (kgkg-1)
Yx/o (kgkg-1)
Ys/o (kgkg-1)
mo
(kgkg-1h-1)mo’ (kgkg-1h-1)
ms
(kgkg-1h-1) ms’ (kgkg-1h-1)
0.25 0.8 0.72 1.65 0.48 1.10 2.27 1 0.55 0.65 1.25 0.53 1.03 1.92 3 0.49 0.38 1.71 0.29 1.29 4.44 5 0.28 0.18 0.98 0.28 1.49 5.29 0.118 0.08 0.11 0.04 10 0.002 0.02 0.02 0.16 0.14 0.91
OT4
Overall 0.32 0.25 0.65 0.62 1.39 0.46 1.06 2.31 1 0.61 0.55 1.17 0.53 1.10 2.09 3 0.38 0.25 0.79 0.48 1.52 3.16 0.117 0.19 0.1 0.1 5 0.23 0.12 0.61 0.38 1.88 4.87 10 0.04 0.04 0.02 0.47 0.32 0.68
OT5
Overall 0.29 0.25 0.63 0.62 1.17 0.50 0.96 1.93 1 0.52 0.55 1.97 0.29 0.93 3.17 3 0.52 0.34 1.86 0.28 1.55 5.54 0.02 0.42 0.01 0.11 5 0.26 0.13 0.86 0.23 1.49 6.54 10 0.008 0.02 0.02 0.39 0.36 0.91
OT6
Overall 0.35
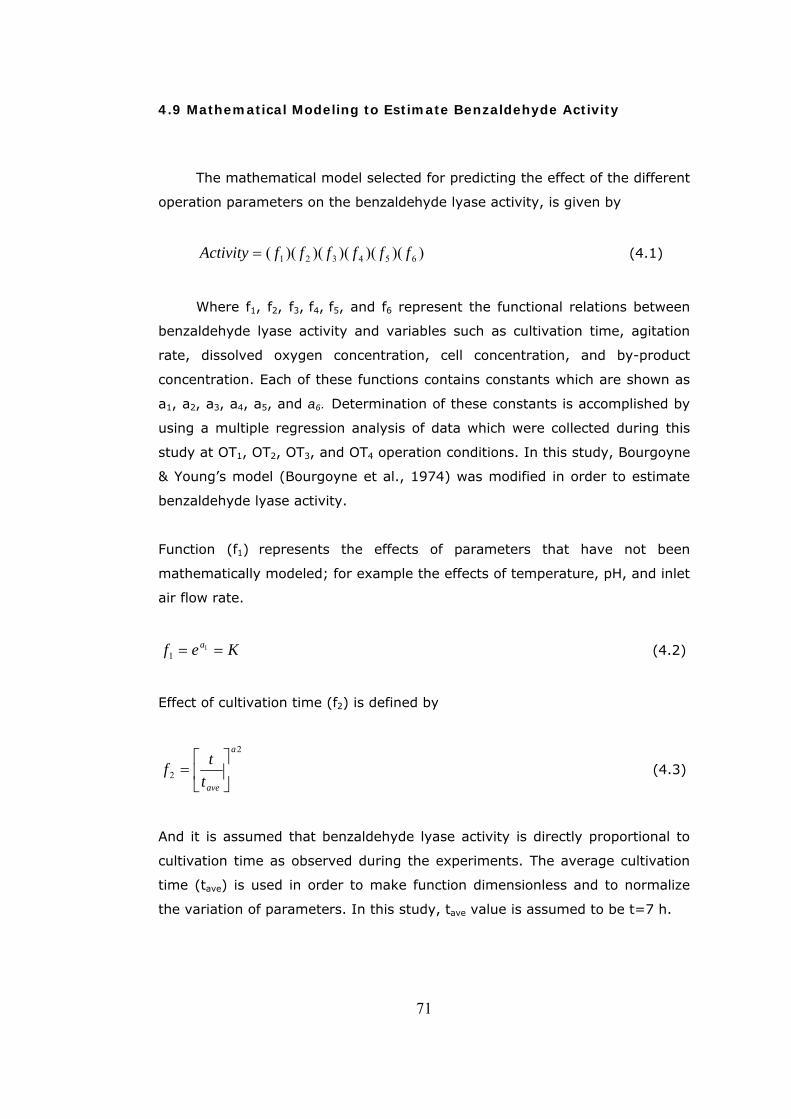
4.9 Mathematical Modeling to Estimate Benzaldehyde Activity
The mathematical model selected for predicting the effect of the different
operation parameters on the benzaldehyde lyase activity, is given by
))()()()()(( 654321 ffffffActivity = (4.1)
Where f1, f2, f3, f4, f5, and f6 represent the functional relations between
benzaldehyde lyase activity and variables such as cultivation time, agitation
rate, dissolved oxygen concentration, cell concentration, and by-product
concentration. Each of these functions contains constants which are shown as
a1, a2, a3, a4, a5, and a6. Determination of these constants is accomplished by
using a multiple regression analysis of data which were collected during this
study at OT1, OT2, OT3, and OT4 operation conditions. In this study, Bourgoyne
& Young’s model (Bourgoyne et al., 1974) was modified in order to estimate
benzaldehyde lyase activity.
Function (f1) represents the effects of parameters that have not been
mathematically modeled; for example the effects of temperature, pH, and inlet
air flow rate.
Kef a == 11 (4.2)
Effect of cultivation time (f2) is defined by
2
2
a
avettf ⎥⎦
⎤⎢⎣
⎡= (4.3)
And it is assumed that benzaldehyde lyase activity is directly proportional to cultivation time as observed during the experiments. The average cultivation
time (tave) is used in order to make function dimensionless and to normalize
the variation of parameters. In this study, tave value is assumed to be t=7 h.
71
Effect of agitation rate (f3) is defined by
3
3
a
aveNNf ⎥
⎦
⎤⎢⎣
⎡= (4.4)
Where Nave=531 min-1.
Effect of cell concentration (f4) is defined by
4
4
a
avex
x
CC
f ⎥⎦
⎤⎢⎣
⎡= (4.5)
And it is assumed an increase in benzaldehyde lyase activity with the cell
concentration. Where Cx ave=1.54 kg m-3.
Effect of dissolved oxygen concentration (f5) is defined by
5
2
25
a
aveo
o
CC
f−
⎥⎦
⎤⎢⎣
⎡= (4.6)
And it is assumed that benzaldehyde lyase activity is inversely proportional to
dissolved oxygen concentration as observed during the experiments. Where
Co2 ave= 0.05 mol m-3.
Effect of by- product concentration (f6) is defined by
6
6
a
aveBp
Bp
CC
f−
⎥⎥⎦
⎤
⎢⎢⎣
⎡= (4.7)
And it is assumed an decrease in benzaldehyde lyase activity with increase in
by-product formation rate. Where CBPave= 1.06 kg m-3.
72

By substituting equations 4.2-7 into the equation 4.1, the benzaldehyde lyase
activity model is obtained as
[ ]65
2
2
4321
)(
a
BPave
BP
a
aveo
o
a
xave
x
a
ave
a
ave
a
ave CC
CC
CC
NN
tte
ActivityActivity
−−
⎥⎦
⎤⎢⎣
⎡⎥⎦
⎤⎢⎣
⎡⎥⎦
⎤⎢⎣
⎡⎥⎦
⎤⎢⎣
⎡⎥⎦
⎤⎢⎣
⎡= (4.8)
Where the average activity value is 553 U cm-1.
4.9.1 The Dimensionless Analysis to calculate Cx, Co2, and CBP
Since the cell concentration, dissolved oxygen concentration, and by-
product concentration also depended on agitation rate and cultivation time,
the dimensionless correlations are developed to estimate them as function of
agitation rate and cultivation time. The following dimensionless equations for
Cx, Co2, and CBP are defined by:
[ ]32
1b
ave
b
ave
b
x
x
NN
tte
CC
ave
⎥⎦
⎤⎢⎣
⎡⎥⎦
⎤⎢⎣
⎡=
⎥⎥⎦
⎤
⎢⎢⎣
⎡ (4.9)
[ ]32
1
2
2
d
ave
d
ave
d
o
o
NN
tte
CC
ave
⎥⎦
⎤⎢⎣
⎡⎥⎦
⎤⎢⎣
⎡=
⎥⎥⎦
⎤
⎢⎢⎣
⎡ (4.10)
[ ]32
1g
ave
g
ave
g
BP
BP
NN
tte
CC
ave
⎥⎦
⎤⎢⎣
⎡⎥⎦
⎤⎢⎣
⎡=
⎥⎥⎦
⎤
⎢⎢⎣
⎡ (4.11)
Where b1, b2, b3, d1, d2, d3, g1, g2 and g3 are equation’s constants. The
constants can be determined from a multiple regression analysis of data which
were collected during this study at OT1, OT2, OT3, and OT4 operation
conditions.
73

4.9.2 Development of the Proposed Model
The benzaldehyde lyase activity model is developed by considering the
effects of different operation parameters. The model can be used for prediction
of benzaldehyde lyase activity at the condition in which medium contains 8.0
kg m-3 glucose, 5.0 kg m-3 (NH4)2HPO4 and the salt solution at T=37oC and
pH=7.2. By using the data obtained from experiments, model constants can
be determined. The procedure is presented as follows.
4.9.2.1 Selecting and sorting relevant and proper data
An Excel program has been provided to identify and store the
experimental data. In this program firstly, data which were obtained from
different bioreactor operation conditions (OT1, OT2, OT3, and OT4) were
rearranged. Then these data normalized and sorted by dividing them to their
average value. After taking the logarithm from the normalized values, a new
data file created which can be used in multiple regression analysis.
4.9.2.2 Multiple Regression Analysis
Multiple regression technique was used to determine the coefficients of
the proposed benzaldehyde lyase activity model and equations which calculate
Cx, Co2, and CBP. A derivation of the multiple regression-analysis procedure is
presented in detail as follows.
As mentioned before, the equation of the proposed model is:
[ ]65
2
2
4321
)(
a
BPave
BP
a
aveo
o
a
xave
x
a
ave
a
ave
a
ave CC
CC
CC
NN
tte
ActivityActivity
−−
⎥⎦
⎤⎢⎣
⎡⎥⎦
⎤⎢⎣
⎡⎥⎦
⎤⎢⎣
⎡⎥⎦
⎤⎢⎣
⎡⎥⎦
⎤⎢⎣
⎡= (4.12)
Taking the logarithm of both sides of the above equation yields equation
(4.13):
74

( ) ( ) ( ) ( )
( ) ⎥⎦
⎤⎢⎣
⎡−
⎥⎦
⎤⎢⎣
⎡−⎥
⎦
⎤⎢⎣
⎡+⎥
⎦
⎤⎢⎣
⎡+⎥
⎦
⎤⎢⎣
⎡+=⎟⎟
⎠
⎞⎜⎜⎝
⎛
BPave
BP
aveo
o
xave
x
aveaveave
CC
a
CC
aCC
aNNa
ttaa
ActivityActivity
ln
lnlnlnln)(
ln
6
2
254321
By considering
⎥⎦
⎤⎢⎣
⎡=
avettx ln2 (4.14)
⎥⎦
⎤⎢⎣
⎡=
aveNNx ln3 (4.15)
⎥⎦
⎤⎢⎣
⎡=
avex
x
CC
x ln4 (4.16)
⎥⎦
⎤⎢⎣
⎡−=
aveo
o
CC
x2
25 ln (4.17)
⎥⎥⎦
⎤
⎢⎢⎣
⎡−=
aveBp
Bp
CC
x ln6 (4.18)
The equation (4.13) can be rewritten as:
⎟⎟⎠
⎞⎜⎜⎝
⎛+= ∑
=
6
21ln
jjj
ave
xaaActivityActivity
(4.19)
If the residual error of the ith data point, ri, is defined by
avejjji Activity
Activityxaar ln6
21 −⎟⎟
⎠
⎞⎜⎜⎝
⎛+= ∑
=
(4.20)
In order to minimize the square of the residuals , the constants from a2
1i
n
i
r∑=
1
to a6 should be determined properly by taking derivative from the square of
the residuals . 2
1i
n
ir∑
=
75

∑∑∑
==
= =∂∂
=∂
⎟⎠
⎞⎜⎝
⎛∂
n
iji
j
in
ii
j
n
ii
xrar
ra
r
11
1
2
22 (4.21)
For j = 1, 2, 3, 4, 5, 6.
So that by simultaneously solving the system of equations obtained by
expanding∑ , the constants a=
n
iji xr
11 through a6 can be obtained.
The expansion of yields a serie of equations (4.22): ∑=
n
iji xr
1
( )∑ ∑∑∑∑∑ =+++++aveActivity
Activityxaxaxaxaxana ln. 66554433221
∑ ∑∑∑∑∑∑ =+++++aveActivity
Activityxxxaxxaxxaxxaxaxa ln262652542432322221
∑ ∑∑∑∑∑∑ =+++++aveActivity
Activityxxxaxxaxxaxaxxaxa ln363653543423323231
∑ ∑∑∑∑∑∑ =+++++aveActivity
Activityxxxaxxaxaxxaxxaxa ln464654524434324241
∑ ∑∑∑∑∑∑ =+++++aveActivity
Activityxxxaxaxxaxxaxxaxa ln465625545435325251
∑ ∑∑∑∑∑∑ =+++++aveActivity
Activityxxaxxaxxaxxaxxaxa ln626656546436326261
In order to calculate the constants from a1 to a6, the following linear
equation system should be solved:
76

⎥⎥⎥⎥⎥⎥⎥⎥⎥⎥⎥⎥⎥⎥⎥
⎦
⎤
⎢⎢⎢⎢⎢⎢⎢⎢⎢⎢⎢⎢⎢⎢⎢
⎣
⎡
=
⎥⎥⎥⎥⎥⎥⎥⎥
⎦
⎤
⎢⎢⎢⎢⎢⎢⎢⎢
⎣
⎡
×
⎥⎥⎥⎥⎥⎥⎥⎥⎥⎥⎥⎥⎥⎥⎥
⎦
⎤
⎢⎢⎢⎢⎢⎢⎢⎢⎢⎢⎢⎢⎢⎢⎢
⎣
⎡
∑
∑
∑
∑
∑
∑
∑∑∑∑∑∑
∑∑∑∑∑∑
∑∑∑∑∑∑
∑∑∑∑∑∑
∑∑∑∑∑∑
∑∑∑∑∑
=
=
=
=
=
=
======
======
======
======
======
=====
n
iii
n
iii
n
iii
n
iii
n
iii
n
ii
n
ii
n
iii
n
iii
n
iii
n
iii
n
ii
n
iii
n
ii
n
iii
n
iii
n
iii
n
ii
n
iii
n
iii
n
ii
n
iii
n
iii
n
ii
n
iii
n
iii
n
iii
n
ii
n
iii
n
ii
n
iii
n
iii
n
iii
n
iii
n
ii
n
ii
n
ii
n
ii
n
ii
n
ii
n
ii
yx
yx
yx
yx
yx
y
aaaaaa
xxxxxxxxxx
xxxxxxxxxx
xxxxxxxxxx
xxxxxxxxxx
xxxxxxxxxx
xxxxxn
x
16
15
14
13
12
1
6
5
4
3
2
1
1
26
156
146
136
126
16
165
1
25
145
135
125
15
164
154
1
24
134
124
14
163
153
143
1
23
123
13
162
1!52
142
132
1
22
12
16
15
14
13
12
Where n is the number of data points which are obtained from experiments
and ⎟⎟⎠
⎞⎜⎜⎝
⎛=
aveActivityActivityy ln . Also, the same procedure can be applied to calculate
the coefficients of the equations from (4.9) to (4.11).
4.9.3 Model Application
After appling the procedure which were mentioned in the earlier section,
the coefficient of the equations from (4.9) to (4.11) are calculated and
presented in equations (4.23), (4.24), and (4.25). It is observed that the
correlations can estimate the cell concentration, Cx, dissolved oxygen
concentration, Co2, and by-product concentration, CBP, with a reasonable
accuracy.
[ ]778.0991.0
003.0⎥⎦
⎤⎢⎣
⎡⎥⎦
⎤⎢⎣
⎡=
⎥⎥⎦
⎤
⎢⎢⎣
⎡
aveavex
x
NN
tte
CC
ave
(4.23)
[ ]995.2066.0
626.1
2
2⎥⎦
⎤⎢⎣
⎡⎥⎦
⎤⎢⎣
⎡=
⎥⎥⎦
⎤
⎢⎢⎣
⎡−
aveaveo
o
NN
tte
CC
ave
(4.24)
77

[ ]801.0254.1
238.0⎥⎦
⎤⎢⎣
⎡⎥⎦
⎤⎢⎣
⎡=
⎥⎥⎦
⎤
⎢⎢⎣
⎡−
aveaveBP
BP
NN
tte
CC
ave
(4.25)
The data which obtained from these equations were used to predict the
benzaldehyde lyase activity. Figures (4.13), (4.14), and (4.15) show the
calculated data which obtained by using the Multiple Regression Analysis
versus observed data from the experiments. As seen in Figures (4.13) and
(4.15), CBP and Cx can be predicted by using equations (4.23) and (4.25), with
reasonable accuracy. Although the Figure (4.14) looks scattered, still the
predictions from equation (4.24) are acceptable to be used in the
benzaldehyde lyase activity model.
0
1
2
3
4
0.0 0.5 1.0 1.5 2.0 2.5 3.0Cx(observed)
Cx(
calc
ulat
ed)
Figure4.13 Calculated Cx versus Observed Cx
78

0.00
0.02
0.04
0.06
0.08
0.10
0.12
0.14
0.00 0.05 0.10 0.15Co2 ,observed
Co2
, cal
cula
ted
Figure 4.14 Calculated Co2 versus Observed Co2
0
1
2
3
4
5
6
0 1 1 2 2 3 3 4 4CBP, observed
C BP,c
alcu
late
d
Figure 4.15 Calculated CBP versus Observed CBP
79

After determining cell concentration, dissolved oxygen concentration, and by-
product concentration, Multiple Regression analysis is applied to calculate the
benzaldehyde lyase activity model’s constants. Equation (4.26) represents
benzaldehyde lyase activity model constants.
[ ]30.372.2
2
2
08.402.343.138.1
)(
−−
−⎥⎦
⎤⎢⎣
⎡⎥⎦
⎤⎢⎣
⎡⎥⎦
⎤⎢⎣
⎡⎥⎦
⎤⎢⎣
⎡⎥⎦
⎤⎢⎣
⎡=
BPave
BP
aveo
o
xave
x
aveaveave CC
CC
CC
NN
tte
ActivityActivity
(4.26)
By using equation (4.26), benzaldehyde lyase activity can be calculated
at experiment conditions. In order to test the performance of the proposed
model, benzaldehyde lyase activities are estimated for each data point. The
results are posted in Table 4.7. The regression index of correlation G is used to
check the persistence of Multiple Regression Analysis. The regression index of
correlation G is defined by
( ) ( )[ ]( ) ( )[ ]∑
∑−
−−= 2
2
)ln()ln(
)ln()ln(0.1
ActivityActivity
ActivityActivityG
observed
calculatedobserved (4.27)
By calculating (G) for experimental data, it is observed that the model can
estimate enzyme activity with an error of ±10 % when compared with the data
obtained from laboratory experiments.
Table 4.7 The result of Analysis for Experiment’s Data
Activity(cal) Activity(ob) Activity(cal) Activity(ob) 120 116 141 110 271 331 316 340 435 520 508 729 609 697 710 932 790 921 922 1048 977 924 1141 1057 160 116 74 99 359 290 167 171 576 610 269 256 806 758 376 305 1046 1022 488 456 1295 1022 604 459
80

The graphical representation of Table 4.7 is presented in Figure 4.16 As
seen from figure, it can be concluded that the proposed model can estimate
benzaldehyde lyase activity with a reasonable accuracy.
0
200
400
600
800
1000
1200
1400
0 200 400 600 800 1000Activity, observed
Act
ivity
, cal
cula
ted
Figure 4.16 Calculated Activity versus Measured Activity
81

82
CHAPTER 5
CONCLUSION
In this study, the effects of oxygen transfer conditions on the synthesis
of the enzyme benzaldehyde lyase as intracellular in recombinant E. coli
BL21 (DE3) pLysS was investigated and a comprehensive model was
developed to determine benzaldehyde lyase activity. For this purpose, the
effects of oxygen transfer together with the mass transfer coefficient (KLa),
enhancement factor E (=KLa/KLao), volumetric oxygen transfer rate,
volumetric and specific oxygen uptake rates, mass transfer and biochemical
reaction resistances; moreover, the variation in product and by-product
distribution, specific substrate uptake rates, yield and maintenance
coefficient were investigated in the pilot scale batch bioreactor at six
different conditions then the data obtained during the experiments were
used to develop a model to estimate benzaldehyde lyase activity. In this
context the following conclusions were drawn:
1. Escherichia coli BL21 (DE3) pLySs carrying recombinant
pRSETA::bal plasmid (Kaya, 2006) was selected as the
benzaldehyde lyase producer, due to the highest BAL production
capacity of this strain in RPM medium.
2. The medium containing 8.0 kg m-3 glucose, 5.0 kg m-3
(NH4)2HPO4 and the salt solution was selected as a production
medium, due to the highest cell concentration and benzaldehyde
lyase activity which were obtained in the study of Çalık et. al.
(2004).
3. The effects of oxygen transfer on benzaldehyde lyase production
were investigated at six different conditions with the
parameters, air inlet rate of QO/VR = 0.5 vvm and agitation rates
83
of N= 250, 500, 625, and 750 min-1, and dissolved oxygen
levels DO= 20%, 40% (CDO=0.04, 0.08 mol m-3) of the
saturation.
4. At OT1 condition, there was no oxygen accumulation throughout
the bioprocesses after t=0.5 h of bioprocess. At OT2 condition,
due to the high oxygen demand of the cells between t=3-11 h,
transferred oxygen was totally consumed however oxygen
profile suddenly increased at the end of the bioprocesses which
indicates that there is a decrease in oxygen uptake of cells. At
the OT3 and OT4 conditions dissolved oxygen level decreased in
the first 5 hours; after t=5h , due to the decrease in oxygen
uptake rate dissolved oxygen level increased. However at OT5
and OT6 conditions, dissolved oxygen levels were controlled at
the values of DO= 20, 40% respectively, by keeping agitation
rate at constant value of N=625 min-1 and by considering air
inlet rate as variable parameter.
5. The highest cell concentration with a value of 3.0 kg m-3 was
obtained at OT6 condition and the lowest cell concentration of
1.19 kg m-3 was observed at OT1 condition where oxygen supply
seems to be insufficient for maintenance of oxidative
metabolism.
6. Among the investigated oxygen transfer parameters, the highest
glucose consumption rate was observed at OT6 condition, where
the cell concentration was the highest; whereas, the lowest
glucose consumption rate was attained at OT1 condition, where
the cell concentration was low due to the oxygen limitation.
7. Almost for all oxygen transfer conditions applied, acetic, formic,
citric, malic and succinic acids were detected in the fermentation
broth. Presence of the organic acids of TCA cycle, i.e., citric,
succinic and malic acid may be a consequence of inadequate
oxygen supply which leads to repression on TCA cycle enzymes.

84
8. For the all oxygen transfer conditions, acetic acid was the major
by-products in the fermentation medium. the highest acetate
accumulation occurred in OT1 condition, where the lowest cell
concentration and the lowest glucose consumption were
observed, as 3.16 kg m-3 at t=10 h; and the lowest amount of
the acetate was detected at OT6 condition, where the highest
cell concentration was obtained, as 0.34 Kg m-3 at t=12h.
9. Aspartic acid, asparagine, cysteine, glutamic acid, isoleucine,
leucine, lysine, serine, threonine, tyrosine, valine, and ornithine
are the amino acids that were detected in the medium, but in
very low amounts. The highest total amino acids produced was
at OT6 condition at t=10 h as TAA=0.1737 kg m-3, followed by
OT1 condition as a TAA=0.0734 Kg m-3.
10. Volumetric mass transfer coefficients, KLa, values and
subsequently the enhancement factor, E, found were increased
with the increase in the oxygen transfer, i.e. QO/VR and N, at all
operation conditions except OT5 and OT6. The low values of KLa
could be explained as result of the high values of driving force
at OT5 and OT6 conditions where dissolved oxygen levels were
controlled at the values of DO= 20, 40% respectively.
11. The highest KLa and consequently E were obtained in OT4
operation at t=5 h of the bioprocess as 0.039 s-1 and 1.86
respectively. The lowest KLa value as 0.005 s-1 at t=10 h of the
bioprocess was obtained in OT6 condition where the highest cell
concentration was observed.
12. Damköhler number (Da), effectiveness factor (η) was
determined to compare the mass transfer and biochemical
reaction rates. At the all operations mass transfer resistances
were effective (Da>>1) through the end of the process; while
they were smaller than 1 at the beginning of the processes,
signaling the low mass transfer resistance. Effectiveness factor,
η, were close 1 at OT2, OT3 and OT4 conditions indicating that
the cells are consuming oxygen with such a high rate that

85
maximum possible oxygen utilization (OD) value was
approached. The effectiveness factor dropped at the end of
process, where mass transfer resistances were the greatest.
13. The maximum value of µ was obtained as 0.81 h-1 at t=0.25 h
of OT2 condition and the highest cell concentration was achieved
among the operation conditions at OT6 as Cx=3.0 Kgm-3 at
t=12h.
14. The yield coefficients of overall specific cell yield on substrate
(YX/S), overall specific cell yield on oxygen (YX/O), and overall
specific substrate yield on oxygen (YS/O) values were calculated
according to empirical data. The highest overall specific cell yield
on substrate (YX/S) value was obtained at OT6 as 0.354, due to
the increased efficiency of the utilization of the carbon source
for product formation; and the lowest value was 0.13 obtained
at OT1 condition; while YX/O and YS/O increased between t=1-5 h
of bioprocess with cultivation time and took the maximum value
at t=5 h before the reduction at the remaining time of the
process.
15. Specific oxygen uptake rates (qO) and specific substrate
utilization rates (qS) decreased with the cultivation time between
t=1-10 h of bioprocess at all the oxygen transfer conditions. The
highest value of qO was obtained at t=1 h of OT4 condition as
0.72 kg kg-1 h-1; where the lowest value was obtained at t=10 h
of OT3 condition as 0.016 kg kg-1 h-1. The highest value of qS
was obtained at t=1 h of OT6 condition as 1.96 kg kg-1 h-1;
where the lowest value was obtained at t=10 h of the same
condition as 0.021 kg kg-1 h-1.
16. The rate of oxygen consumption for maintenance, m0, varied
between 0.02-0.43 kg kg-1 h-1, and the highest value was
obtained as 0.43 kg kg-1 h-1 at OT3, when the oxygen
consumption for by-product production was neglected. However
when oxygen consumption for by-product production is
considered, the rate of oxygen consumption for maintenance
86
attained as 0.41 kg kg-1 h-1 at OT3. As a result, when the by-
product formation was taken into account, m0 took lower values.
17. The rate of substrate consumption for maintenance mS and mS’
values were obtained for each oxygen transfer condition. The mS
values varied between 0.01-0.35 kg kg-1 h-1, and ms’ varied
between 0.04-0.11 kg kg-1 h-1. The highest value for ms and ms’
were obtained at OT3 and OT6 conditions as 0.35 and 0.11 kg kg-
1 h-1 respectively.
18. Among the investigated oxygen transfer conditions, the highest
cell concentration and benzaldehyde lyase activity was observed
at OT6 condition. These values were approximately 1.27 and
1.30 fold higher than the values obtained in the study of of Çalık
et al. (2004).
19. Proposed mathematical model can estimate benzaldehyde lyase
activity as function of time, agitation rate, cell concentration,
dissolved oxygen concentration, and by-product concentration
with reasonable accuracy.
87
REFERENCES
Adam, W., Lazarus, M., Möller, C., Schreier, P., 1999. Biocatalytic Synthesis of
Optically Active α-Oxyfunctionalized Carbonyl Compounds, Accounts of
Chemical Research, 32(10), 837-845
Akesson, M., Hagander, P., Axelsson, J., P., 2001. Avoiding acetate
accumulation in E. coli cultures using feedback control of glucose
feeding, Biotechnol. Bioeng., 3, 223-230.
Atkinson, B., Mavituna, F., 1991. Biochemical Engineering and Biotechnology
Handbook, 2nd ed., Macmillan Publishers Ltd., England.
Bailey, J., E., Ollis D., F., 1986. Biochemical Engineering Fundamentals, 2nd
ed., McGraw-Hill Inc., New York.
Bauer, K., Ben-Bassat, A., Dawson, M., de la Puente, V., Neway, J., 1990.
Improved Expression of Human Interleukin-2 in High-Cell-Density
Fermentor Cultures of Escherichia coli K-12 by a Phosphotransacetylase
mutant, Appl. Environ. Microbiol., 56:1296-1302
Bech Jensen, E., Carlsen, S., 1990. Production of Recombinant Human Growth
Hormone in Escherichia coli: Expression Of Different Precursors And
Physiological Effects Of Glucose, Acetate And Salts, Biotechnol. Bioeng,
36:1-11
Bhagavan, N., V., 2001. Medical Biochemistry, 4th Ed., Harcourt lnc.,USA.
Bhattacharya, S., K., Dukey, A., K., 1997. Effects of dissolved oxygen and
oxygen mass transfer on overexpression of target gene in E.coli,
Enzyme Microb Technol., 20, 355-360.

88
Boyaci I. H., 2005. A New Approach for Determination of Enzyme Kinetic
Constants Using Response Surface Methodology, Biochemical
Engineering Journal, 25, 55-62.
Büyüksungur. A., 2006. Cloning and Expression of Benzaldehyde Lyase Gene
from Pseudomonas fluorescens Biovar I in Pichia pastoris, M.Sc Thesis.
The Middle East Technical University., Turkey.
Castan, A., Näsman, A., Enfors, S-O., 2002. Oxygen enriched air supply in E.
coli processes: production of cell and r-human growth hormone,
Enzyme Microb Technol.,30, 847-854.
Chaplin, M. F., Bucke, C., 1990. Enzyme Technology, Cambridge University
Press, USA.
Choi, W. J., Lee, Y. S., 1997. Enhanced Expression of Bovine Growth Hormone
Gene by Different Culture Conditions in Escherichia coli, Biotechnology
Letters, 19, 735-739.
Christensen, L. M., Eriksen, T. N., 2002. Growth and Proton Exchange in
Recombinant Escherichia coli BL21, Enzyme and Microbial Technology,
31, 566-574.
Cohen, A., 1983. the PICO TAG System: a New Method to Analyze Primary and
Secondary Amino Acids with One Picomole Sensitivity, Biotechniques,
Sep/Oct, 273-275.
Çalık, P., Çalık, G., Özdamar, T.H., 1998. Oxygen Transfer Effects in Serine
Alkaline Protease Fermentation by Bacillus licheniformis: Use of Citric
Acid as the Carbon Source, Enzyme and Microbial Technology , 23(7-
8), 451-461.
Çalık, P., Çalık, G., Takaç, S., Özdamar, T.H., 1999. Metabolic Flux Analysis for
Serine Alkaline Protease Fermentation by Bacillus licheniformis in a
Defined Medium: Effects of the Oxygen Transfer Rate, Biotechnology
and Bioengineering, 64, 151-167.
Çalık, P., Özdamar, T. H., 2002-b. Bioreaction Network Flux Analysis for
Industrial Microorganisms: a Review, Reviews in Chemical Engineering,
18, 553-595.
89
Çalık, P., Yılgör, P., Ayhan, P., Demir, A. S., 2004. Oxygen Transfer Effects on
Recombinant Benzaldehyde Lyase Production, Chemical Engineering
Science, 59, 5075-5083.
Çalık, P., Yılgör, P., Demir, A. S., 2006. Influence Of Controlled-pH and
Uncontrolled-pH Operations on Recombinant Benzaldehyde Lyase
Production by Escherichia coli, Enzyme and Microbial Technology, 38,
617-627.
Demir, A. S., Pohl, M., Janzen, E., Muller, M., 2001. Enantioselective Synthesis
of Hydroxy Ketones Through Cleavage and Formation of Acyloin Linkage,
J. Chem. Soc., Perkin Trans., 633-635.
Demir, A. S., Şeşenoğlu Ö., Eren, E., Hosrik, B., Pohl, M., Janzen, E., Kolter, D.,
Feldmann, R., Dünkelmann, P., Müller, M., 2002. Enantioselective
Synthesis of α-Hydroxy Ketones via Benzaldehyde Lyase-Catalyzed C-C
Bond Formation Reaction, Advanced Synthesis &Catalysis. 344(1), 96-
103.
Demir, A. S., Şeşenoğlu, Ö., Dünkelmann, P., Muller, M., 2003. Benzaldehyde
Lyase-Catalyzed Enantioselective Carboligation of Aromatic Aldehydes
with Mono- and Dimethoxy Acetaldehyde, Organicletters, 5, 2047-
2050.
Demir, A. S., Ayhan, P., Igdir, C. A., Duygu, N. A., 2004. Enzyme Catalyzed
Hydroxymethylation of Aromatic Aldehydes with Formaldehyde.
Synthesis of Hydroxyacetophenones and (S) – Benzoins, Tetrahedron,
60, 6509-6512.
Doran, P., M., 1995. Bioprocess Engineering Principles, Academic Press Ltd.,
San Diego.
Dünkelmann, P., Kolter-Jung, D., Nitsche, A., Demir, A., S., 2002.
Development of a Donor-Acceptor Concept for Enzymatic Cross-
Coupling Reactions of Aldehydes: The First Asymmetric Cross-Benzoin
Condensation, J. am. Chem. Soc., 124, 12084-12085.

90
Faber, K., 2000. Biotransformations in Organic Chemistry, 4th ed., Springer,
Germany.
Fogarty, M. William and Kelly, T. Catherina, 1990. Microbial enzymes and
Biotechnology, 2th ed., Elsevier Applied Science, London.
Glazer, A., N., Nikaido, H., 1995. Microbial Biotechnology, W.H. Freeman and
Company, New York.
Godfrey, T., West, S., 1996. Industrial Enzymology, 2nd ed., Macmillan Press
Ltd., London.
Gonzalez, B., Vicuna, R., 1989. Benzaldehyde lyase, a novel thiamine PPi
requiring enzyme from Pseudomonas fluorescens Biovar I, J. Bacteriol.,
171, 2401-2405.
Hinrichsen, P., Gomez, I., Vicuna, R., 1994. Cloning and sequencing of the
gene encoding benzaldehyde lyase Pseudomonas fluorescens Biovar I.,
Gene, 144, 137-138.
Hischer, T., Gocke, D., 2005. Stereoselective synthesis of novel benzoins
catalysed by benzaldehyde lyase in a gel-stabilised two-phase system,
Tetrahedron, 61, 7378–7383.
Janzen, E., Muller, M., 2006. Characterization of benzaldehyde lyase from
Pseudomonas fluorescens: A versatile enzymefor asymmetric C–C bond
formation, Bioorganic Chemistry, 34, 345–361.
Johnston, A. W., Stewart, M., Lee, P., Cooney, J. M., 2003. Tracking the
Acetate Threshold Using DO-Transient Control During Medium and High
Cell Density Cultivation of Recombinant Escherichia coli in Complex
Media, Biotechnology and Bioengineering, 84, 315-323.

91
kaya. H., 2006. Comparison of Benzaldehyde Lyase Production Capacity in
Recombinant Escherichia coli and Recombinant Bacillus Species, M.Sc
Thesis. The Middle East Technical University., Turkey.
Kirk, R. E., Othmer, D. F., 1994. Encyclopedia of Chemical Technology, 4th Ed.,
the Interscience Encyclopedia Inc., New York.
Kneen, M. M., Pogozheva, D. I., Kenyon, L. G., Mcleish, J. M., 2005. Exploring
the Active Site of Benzaldehyde Lyase by Modeling and Mutagenesis,
Biochemica Et Biophysica Acta, 1753, 263-271.
Luli, G., W., Strohl, W., R., 1990. Comparison of Growth, Acetate Production
and Acetate Inhibition of Escherichia coli Strains in Batch and Fed-Batch
Fermentations, Appl. Environ. Microbiol, 56:1004-1011.
Maria, D. D. P., Stillger, T., Pohl, M., Wallert, S., Et Al., 2005. Preparative
Enantioselective Synthesis of Benzoins and (R)-2-Hydroxy-1-
Phenylpropanone Using Benzaldeyhyde Lyase, Journal of Molecular
Catalysis B: Enzymatic, 38, 43-47.
Matthews, H.R., freedland, R., Miesfeld, R.L., 1997. Biochemistry: A short
course, wiley- Liss Inc., New York.
Mosbacher, G. T., Mueller, M., Schulz, E. G., 2005. Structure and Mechanism
of the ThDP-Dependent Benzaldehyde Lyase from Pseudomonas
fluorescens, FEBS Journal, 272, 6067-6076.
Moses, V., Cape, R. E., 1991. Biotechnology: The Science and the Business,
Harwood Academic Publishers, Switzerland.
Mikolajek, R., Spiess, A.C., 2007. Feasibility of gas/solid carboligation:
Conversion of benzaldehyde to benzoin using thiamine diphosphate-
dependent enzymes, Journal of Biotechnology, 129, 723–725.

92
Neidhardt, F., C., Ingraham, J., L., Schaechter, M., 1990. Physiology of the
Bacterial Cell: A Molecular Approach, Sinauer Associates, Inc.,
Massachusetts.
Nielsen, J., Villadsen, J., 1994. Bioreaction Engineering Principles, Plenum
Press, New York.
Nielsen, Villadsen, Liden, 2003. Bioreaction Engineering Principles, Kluwer
Academic/Plenum Publisher, New York.
Pohl, M., Mueller, M., Demir, A. S., 2002. Nucleotide Sequence Encoding
Benzaldehyde Lyase and Method for the Stereoselective Synthesis of 2-
Hyroxyketone, Patent: WO0202753-A.
Rainer, B., W., 1990. Determination Methods of the Volumetric Oxygen
Transfer KLa in Bioreactors, Chem. Biochem. Eng. Q., 4(4), 185-186.
Ryan, W., Parulekar, J. S., Stark, C. B., 1989. Expression of β-Lactamase by
Recombinant Escherichia coli Strains Containing Plasmids of Different
Size-Effects of pH, Phospate, and Dissolved Oxygen, Biotechnology and
Bioengineering, 34, 309-319.
Sanchez-Gonzales, M., Rosazza, P. N. J., 2003. Mixed Aromatic Acyloin
Condensations with Recombinant Benzaldehyde Lyase: Synthesis of α-
Hydroxydihydrochalcones and Related α-Hydroxy Ketones, Adv. Synth.
Catal., 345, 819-824.
Scragg, A. H., 1988. Biotechnology for Engineers: Biological Systems in
Technological Processes, Ellis Horwood Ltd., ENGLAND
Shiloach, J., Kaufman, J., Guillard, S., Fass, R., 1996. Effect of Glucose Supply
Strategy on Acetate Accumulation, Growth, and Recombinant Protein

93
Production by Escherichia coli BL21 (Λde3) and Escherichia coli JM109,
Biotechnology and Bioengineering, 49, 421-428.
Shuler, M., L., Kargi, F., 1992. Bioprocess Engineering: Basic Concepts,
Prentice Hall Inc., New Jersey.
Shuler, M. L., Kargi, F., 2002. Bioprocess Engineering: Basic Concepts, 2nd Ed.,
Prentice Hall Inc., USA.
Stillger, T., Phol, M., 2006. Reaction Engineering of Benzaldehyde Lyase from
Pseudomonas fluorescens Catalyzing Enantioselective C-C Bond
Formation, Organic Process Research & Development, 10, 1172-1177.
Young, F. S., Bourgoyne, A.T., 1974, JR:’’ A Multiple Regression Approach to
Optimal Drilling and Abnormal Pressure Detection’’ SPE—4238.

APPENDIX A
Calibration of Escherichia coli Concentration
0.00
0.50
1.00
1.50
2.00
2.50
3.00
3.50
4.00
0 0.5 1
Cx, kg m-3
Abs
orba
nce
Figure A.1 Calibration curve for Escherichia coli concentration
Slope of the calibration curve, m=2.8782 1/kg m-3 (λ=600 nm)
RateDilution ×2.8782
Absorbance=Cx
94

APPENDIX B
Calibration of Reduced Sugar Concentration
0
0.1
0.2
0.3
0.4
0.5
0.6
0.7
0.8
0 0.2 0.4 0.6 0.8 1 1.2
CG ,kg m-3
abso
rban
ce
Figure B.1 Calibration curve of the glucose analysis solution
Slope of the calibration curve, m=0.6854 1/kg m-3 (λ=505 nm)
( ) RateDilution ×0.6854
0.0054-Absorbance=CG
95