influence of lean and green on supply chain performance ... · influence of lean and green on...
TRANSCRIPT

Pedro Tomaz Leitão Cirne de Castro
Licenciado em Ciências da Engenharia e Gestão Industrial
Influence of Lean and Green on supply chain performance: an Interpretive
Structural Modelling Model
Dissertação para obtenção do Grau de Mestre em Engenharia e Gestão Industrial
Orientadora: Professora Doutora Helena Maria Lourenço Carvalho Remígio, Professora Auxiliar, FCT-UNL
Co-orientadora: Professora Doutora Susana Maria
Palavra Garrido, Professora Auxiliar, UBI
Júri:
Presidente: Prof. Doutor Rogério Salema Araújo Puga Leal
Vogais: Prof. Doutora Isabel Maria do Nascimento Lopes Nunes
Vogais: Prof. Doutora Helena Maria Lourenço Carvalho Remigío
Setembro 2014


Pedro Tomaz Leitão Cirne de Castro
Licenciado em Ciências da Engenharia e Gestão Industrial
Influence of Lean and Green on supply chain performance: an interpretive
structural modelling
Dissertação para obtenção do Grau de Mestre em Engenharia e Gestão Industrial
Orientadora: Professora Doutora Helena Maria Lourenço Carvalho Remígio, Professora Auxiliar, FCT-UNL
Co-orientadora: Professora Doutora Susana Maria
Palavra Garrido, Professora Auxiliar, UBI
Júri:
Presidente: Prof. Doutor Rogério Salema Araújo Puga Leal
Vogais: Prof. Doutora Isabel Maria do Nascimento Lopes Nunes
Vogais: Prof. Doutora Helena Maria Lourenço Carvalho Remigío
Setembro 2014


i
Influence of Lean and Green on supply chain performance: an interpretive
structural modelling
Copyrighted © by Pedro Tomaz Leitão Cirne de Castro
Todos os direitos reservados
A Faculdade de Ciências e Tecnologia e a Universidade Nova de Lisboa têm o direito,
perpétuo e sem limites geográficos de arquivar e publicar esta dissertação através de
exemplares impressos reproduzidos em papel ou de forma digital, ou por qualquer outro meio
conhecido ou que venha a ser inventado, e de a divulgar através de repositórios científicos e
de admitir a sua cópia e distribuição com objectivos educacionais ou de investigação, não
comerciais, desde que seja dado crédito ao autor e editor.

ii

iii
Acknowledgements First of all, I would like to thank to Professor Doctor Helena Carvalho, my supervisor, for her guidance, dedication, availability, encouragement, discussions, the text review and all her support, feedback and validation of the developed ideas that contributed to the success of this dissertation. To Professor Doctor Susana Garrido Azevedo for all the support and feedback during the last months of this dissertation. To all the professionals and academics, for their willingness and sincerity in responding to questionnaires, and for having collaborated with their experience to enrich this dissertation. To my family, girlfriend and friends for all their support, incentive and inspiration. Finally, thanks to everyone that is not mentioned for all the knowledge and experiences shared that supported my work.

iv

v
Abstract
This work aims to identify and rank a set of Lean and Green practices and supply chain
performance measures on which managers should focus to achieve competitiveness and
improve the performance of automotive supply chains. The identification of the contextual
relationships among the suggested practices and measures, was performed through literature
review. Their ranking was done by interviews with professionals from the automotive industry
and academics with wide knowledge on the subject. The methodology of interpretive structural
modelling (ISM) is a useful methodology to identify inter-relationships among Lean and Green
practices and supply chain performance measures and to support the evaluation of automotive
supply chain performance. Using the ISM methodology, the variables under study were
clustered according to their driving power and dependence power. The ISM methodology was
proposed to be used in this work. The model intends to provide a better understanding of the
variables that have more influence (driving variables), the others and those which are most
influenced (dependent variables) by others. The information provided by this model is strategic
for managers who can use it to identify which variables they should focus on in order to have
competitive supply chains.
Keywords: Lean, Green, Interpretive structural modeling, Automotive industry, Supply chain
management, Performance measures.

vi
vii
Resumo Este trabalho tem como objetivo identificar e classificar um conjunto de práticas “Lean” e
“Green” e medidas de desempenho da cadeia de abastecimento em que os gestores se devem
concentrar para alcançar a competitividade e melhorar o desempenho das cadeias de
abastecimento automóvel. A identificação das relações contextuais entre as práticas e as
medidas sugeridas foi realizada por meio de revisão da literatura e a sua classificação foi feita
por meio de protocolos. Foram consultados profissionais da indústria automóvel e académicos
com amplo conhecimento sobre o assunto. A abordagem de modelagem estrutural ativa
(ISM) é uma metodologia útil para identificar as inter-relações entre as práticas “Lean” e
“Green” e medidas de desempenho da cadeia de abastecimento, apoiando a avaliação de
desempenho da cadeia de abastecimento automóvel. Usando o modelo proposto, a abordagem
ISM, as variáveis estudadas foram agrupadas de acordo com a sua “driving power and
dependence power”. A abordagem ISM utilizada tem a intenção de permitir uma melhor
compreensão das variáveis que têm mais influência sobre as outras (variáveis de condução ou
“drivers”) e aquelas que são mais influenciadas por outras (variáveis dependentes). A
informação fornecida por este modelo é estratégica para que se possa utilizá-la para identificar
quais as variáveis que devem ser alvo de foco de forma a conseguir atingir cadeias produtivas
mais competitivas.
Palavras-chave: Lean, Green, Modelagem estrutural interpretativa, Indústria automóvel,
Gestão das cadeias de abastecimento, Medidas de desempenho.

viii

ix
Contents 1. Introduction.............................................................................................................................. 1
1.1 Scope ................................................................................................................................... 1
1.2 Objectives ............................................................................................................................ 3
1.3 Methodology ........................................................................................................................ 3
1.4 Dissertation Structure .......................................................................................................... 5
2. Lean and Green supply chain management review ............................................................ 7
2.1 Supply chain management .................................................................................................. 7
2.2 Lean supply chain ................................................................................................................ 9
2.3 Green supply chain ............................................................................................................ 11
2.4 Lean and Green supply chain paradigms characterization ............................................... 13
2.5 Hybrid Lean-Green supply chain ....................................................................................... 14
2.6 Supply chain performance ................................................................................................. 15
2.7 Lean and Green synergies, similarities and differences .................................................... 16
2.7.1 Synergies .................................................................................................................... 16
2.7.2 Similarities and differences ......................................................................................... 18
2.8 Automotive industry ........................................................................................................... 20
2.8.1 Automotive supply chain ............................................................................................. 20
2.8.2. Importance of the automotive industry ....................................................................... 20
2.8.3. Automotive industry innovations ................................................................................ 21
2.8.4 Lean and Green in automotive industry ...................................................................... 23
2.9. Theoretical framework ...................................................................................................... 24
3. Methodology .......................................................................................................................... 27
3.1 Research stages ................................................................................................................ 27
3.2 An overview of ISM methodology ...................................................................................... 28
4. . Model development ............................................................................................................. 35
4.1 Research design ................................................................................................................ 35
4.2 Variables selection ............................................................................................................. 35
4.3 Development of structural self-interaction matrix (SSIM) .................................................. 37
4.4 Development of the reachability matrix ............................................................................. 40
4.5 Partitioning the reachability matrix - Level partitions ......................................................... 43
4.6 ISM-based model ............................................................................................................... 43
4.7 MICMAC analysis .............................................................................................................. 45
5. Conclusions ........................................................................................................................... 47
References .................................................................................................................................. 50
Appendix ...................................................................................................................................... 54
Appendix A: Interview protocol (1st) - academics / professionals ........................................... 54
Appendix B: Interview protocol (2nd) - SSIM ........................................................................... 59

x
xi
Index of figures
Figure 1.1: Pratical research-methodology .................................................................................. 4
Figure 2.1: The major supply chain drivers .................................................................................. 8
Figure 2.2: Supply chain view....................................................................................................... 9
Figure 2.3: Model of a synergistic relationship between Lean and Green operations ............... 18
Figure 2.4 : Exportation of Goods in Portugal (2013)................................................................. 21
Figure 2.5 : Importance of the automotive industry in the portuguese economy (2013) ............ 22
Figure 2.6 : Theoretical framework of the influence of Lean and Green practices on supply
chain performance ....................................................................................................................... 25
Figure 3.2: Transitive graph. ....................................................................................................... 30
Figure 3.3: ISM flow chart ........................................................................................................... 32
Figure 4.1: Final digraph decipting the relationships among variables ...................................... 45
Figure 4.2: Driving and dependence power diagram for the suggested variables ..................... 46

xii

xiii
Index of tables
Table 2.1: Lean and Green supply chain characterization. ........................................................ 14
Table 2.2: Measures and metrics to evaluate the influence of Lean and Green practices on
supply chain performance. .......................................................................................................... 17
Table 2.3: Relation between supply chain attributes and the two paradigms. ........................... 19
Table 3.1: Applications of the ISM .............................................................................................. 29
Table 4.1: Profile of experts ........................................................................................................ 36
Table 4.2: Expert’s ranking. ........................................................................................................ 38
Table 4.3: Final SSIM matrix. ...................................................................................................... 40
Table 4.4: Initial reachability matrix ............................................................................................ 41
Table 4.5: Final reachability matrix ............................................................................................. 42
Table 4.6: Partition of reachability matrix .................................................................................... 44

xiv
List of abbreviations
COO - chief operations officer EPA - environmental protection agency GSCM - Green supply chain management ISM - interpretive structuring modelling JIT - just-in-time
KPI - key performance indicator MICMAC - matrix of cross impact – multiplications applied to classification
OEM - original equipment manufacturers PMS - performance measurement systems RM - reachability matrix SC - supply chain SCM - supply chain management SEM - structural equation modelling SSIM - structural self-interaction matrix TPS - Toyota production system

xv

1
1. Introduction
Product and technology life cycles are getting shorter, and the consumer demand makes
necessary a greater differentiation of products and services (Carvalho et al., 2011a). Living in a
highly demanded environment, it is mandatory to any organization to increase efficiency and
responsiveness levels to stay competitive (Carvalho et al., 2011b). Suppliers and customers are
no longer mentioned as if they were managed in isolation, each one managed as an
independent entity. It is being witnessing a transformation in which suppliers are inextricably
linked throughout the entire sequence of events that bring raw material from its source of
supply, through different value adding activities to the ultimate customer (Spekman et al., 1998).
Therefore, organizations cannot compete as isolated entities but as networks instead (Azevedo
et al., 2013).
The supply chain (SC) seen as a network can be quite complex but at same time is crucial for
increasing organizational effectiveness, competitiveness and for enhancing customer service,
profitability and also to influence the business sustainability (Azevedo et al., 2011). It intends to
provide the customer with the right products and services on time, with the required
specifications and at the right place (Azevedo et al., 2011).
The overall performance of SC is affected by the set of practices that may be deployed to
manage the organizations operations and the relationships with all the stakeholders. But it is not
only necessary to implement practices that promotes SC overall efficiency, but also the ones
that focus on social, economic and environmental concerns (Carvalho et al., 2011b, Azevedo et
al., 2011). The nonexistence of an appropriate performance measurement systems (PMS) will
lead to failure in provide high levels of customer satisfaction, sub-optimization of the
organization’s performance, missed opportunities to outperform the completion and conflict
within the SC (Azevedo et al., 2013). Performance measurement is therefore crucial to better
SC management (SCM), because it can facilitate understanding and integration among SC
partners while revealing the effects of strategies and potential opportunities in SCM (Carvalho et
al., 2011a). The PMS intend to support managers in the decision making process and to provide
monitoring capability about the influence of practices on SC performance in an integrated way
(Azevedo et al., 2011).
1.1 Scope The environment of high volatile markets and unpredictable conditions has imposed that
competitiveness improvement requires collaborative work and partnerships across the SC’s
(Santos, 2013). Some SCM paradigms have already been adopted by many organizations over
the last years, in order to strengthen their business in the market (Santos, 2013).

2
Espadinha-Cruz (2012) stresses that Lean, agile, resilient and Green are among the most used
paradigms or strategies, but these strategies by themselves do not provide all the solutions
needed for every organization.
Therefore, Espadinha-Cruz (2012) considers that hybrid solutions, e.g. Lean and Green, seen
as one single strategy, are now the forefront to achieve competitiveness and organization’s
profit.
Duarte and Cruz Machado (2012) comment that going Lean and Green is a trend that identifies
new business opportunities for organizational improvement and for competitiveness. The same
authors reinforce their idea, referring that these two paradigms are often seen as synergetic
paradigms because of their both focus on waste reduction, efficient use of resources and put
the focus on satisfying customer needs.
The Lean and Green management paradigms are quite relevant in the automotive industry.
Jayaram et al. (2008) remember that the popularity of Lean strategies can be traced to
successes of leading edge manufacturing companies such as Toyota, Allen Bradley and Boeing
but more specifically, the popularity of the Japanese automotive manufacturer and it Toyota
Production System (TPS) contributed a lot to the Lean movement. Jayaram et al. (2008) also
refer to the positive impact of Lean in the automotive industry and describe some of the benefits
associated with Lean manufacturing or just in time (JIT) oriented systems like: reductions in lot
sizes, lower inventories, improved quality, reduced waste, reduced rework, improved motivation,
greater process yields, increased productivity, increased flexibility, reduced space requirements,
lower overheads, decreased manufacturing costs, reduced lead-times, elimination of certain
trade-offs (e.g. cost versus quality), and increased problem solving capabilities. The same
authors describe a study conducted in 2005 and involving 175 U.S. manufacturers suggesting
the combinatorial power of relationship building and Lean manufacturing on firm performance.
They found that a combination of JIT tactics (such as zero-defect production, on-time delivery
and quantity precision) along with development of close relationship with customers contribute
to improved organisational performance.
Nunes (2011) points out the fact that automakers are currently facing economic and
environmental challenges. The automotive industry suffers from overcapacity, and is struggling
with low profit margins, high break-even points, and undergoing increasing pressure to reduce
its environmental burdens. In his study, the author refers that the benchmarking and analysis of
Green operations initiatives is useful for companies in the automotive sectors as well as for
companies in different industries, but more specifically the automotive industry, due to the
maturity and awareness of its environmental impacts, can serve as an example for the Green
practices and concerns companies should consider when developing their environmental
strategies.

3
There are relevant reasons to conduce scientific research to ensure that better economic and
environmental decisions are taken within this industry. So, this work will focus its study with the
automotive SC. Since it provides a rich context with: numerous raw materials, e.g. steel,
complex parts, engines, transmissions, or even components like tyres, flow from a vast array of
suppliers to the automaker (Azevedo et al., 2013).
Also in this SC there are high levels of outsourcing in the automaker’s activities as tens of
thousands of components need to be purchased, and consequently several hundreds of direct
suppliers and an enormous number of indirect suppliers need to be coordinated.
Azevedo et al. (2013) refer that, systems and metrics of SC performance should be developed,
to monitor and control performance for SC optimization and competitiveness.
There is a lack of studies addressing the relationship between Green and Lean paradigms and
their influence on SC performance, so this work intends to contribute to a better understanding
concerning Green and Lean paradigms seen as hybrid solution to improve SC’s performance.
1.2 Objectives This work intends to improve the knowledge regarding the simultaneous influence of Lean and
Green paradigms on SC performance. So, it intends to respond to the following research
question:
“Is there a positive influence of Lean and Green management paradigms on SC performance?”
Therefore, this work aims to address the following issues:
- Identify the Lean and Green practices affecting automotive SC performance;
- Suggest a model with the relationship among Lean and Green practices and SC
performance.
1.3 Methodology
In Figure 1.1 is shown in a structured way the practical research that was done in this work.
The research methodology comprises three stages:
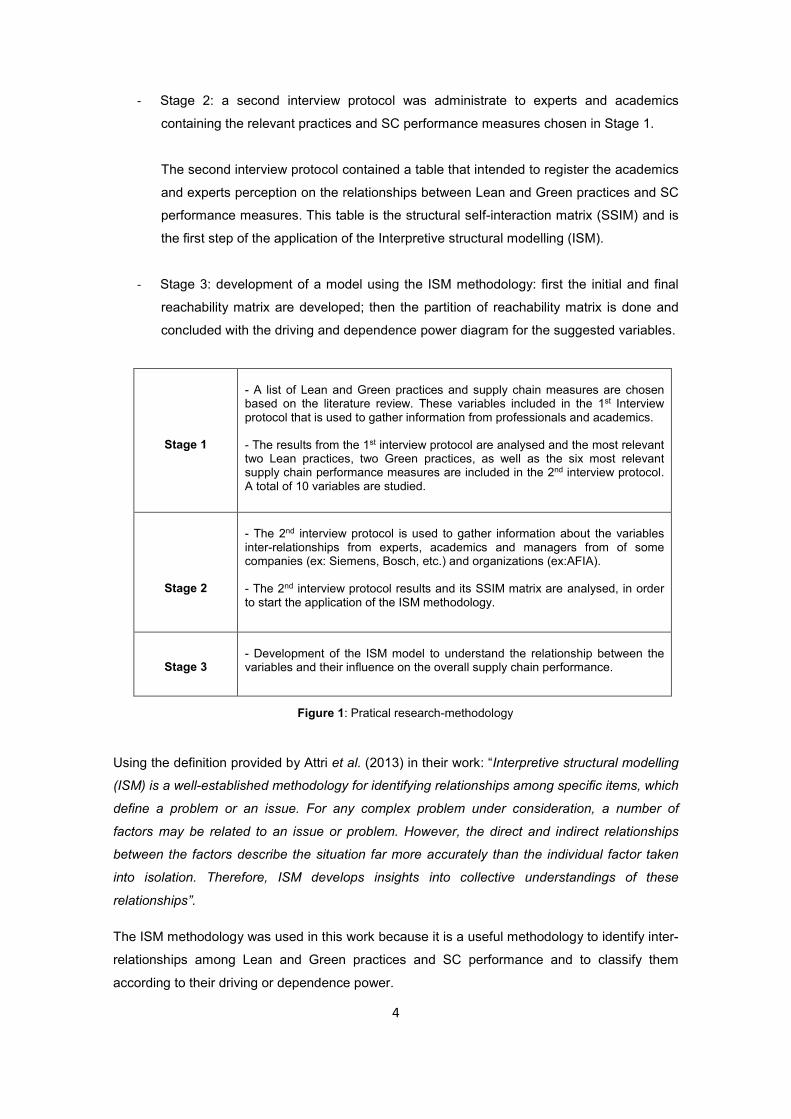
- Stage 1: identification of the most relevant Lean and Green practices and performance
measures for the automotive SC using a literature review. After the theoretical study,
interviews were made with to several experts and academics with the objective of
understanding which are the Lean and Green measures and practices that they
consider as the most relevant, to have the best SC performance in an organization.
Then, a ranking was prepared, to select the two most relevant Lean and the two most
relevant Green practices, and select six most relevant SC performance measures.
4
- Stage 2: a second interview protocol was administrate to experts and academics
containing the relevant practices and SC performance measures chosen in Stage 1.
The second interview protocol contained a table that intended to register the academics
and experts perception on the relationships between Lean and Green practices and SC
performance measures. This table is the structural self-interaction matrix (SSIM) and is
the first step of the application of the Interpretive structural modelling (ISM).
- Stage 3: development of a model using the ISM methodology: first the initial and final
reachability matrix are developed; then the partition of reachability matrix is done and
concluded with the driving and dependence power diagram for the suggested variables.
Stage 1
- A list of Lean and Green practices and supply chain measures are chosen based on the literature review. These variables included in the 1st Interview protocol that is used to gather information from professionals and academics. - The results from the 1st interview protocol are analysed and the most relevant two Lean practices, two Green practices, as well as the six most relevant supply chain performance measures are included in the 2nd interview protocol. A total of 10 variables are studied.
Stage 2
- The 2nd interview protocol is used to gather information about the variables inter-relationships from experts, academics and managers from of some companies (ex: Siemens, Bosch, etc.) and organizations (ex:AFIA). - The 2nd interview protocol results and its SSIM matrix are analysed, in order to start the application of the ISM methodology.
Stage 3
- Development of the ISM model to understand the relationship between the variables and their influence on the overall supply chain performance.
Figure 1: Pratical research-methodology
Using the definition provided by Attri et al. (2013) in their work: “Interpretive structural modelling
(ISM) is a well-established methodology for identifying relationships among specific items, which
define a problem or an issue. For any complex problem under consideration, a number of
factors may be related to an issue or problem. However, the direct and indirect relationships
between the factors describe the situation far more accurately than the individual factor taken
into isolation. Therefore, ISM develops insights into collective understandings of these
relationships”.
The ISM methodology was used in this work because it is a useful methodology to identify inter-
relationships among Lean and Green practices and SC performance and to classify them
according to their driving or dependence power.

5
The gathering of information from the ISM methodology is done through a matrix analysis,
where conclusions are drawn about what are the practices that have more influence on SC
performance.
1.4 Dissertation Structure The dissertation is organised in the following chapters:
- The first chapter provides a brief introduction, regarding the objectives of this work and
the research methodology;
- Chapter 2, refers to the relevant literature review on the topics SC, and the Lean and
Green paradigms. In this chapter there is also a brief review about the importance of
both paradigms in the automotive industry. Also it is presented a theoretical framework
about the importance of the set a Lean and Green practices and the SC performance
measures;
- The ISM methodology is described in the chapter 3.
- In chapter 4, the development of the model and the main results are analysed and
highlighted
- Finally in chapter 5 the main conclusions are drawn.

6

7
2. Lean and Green supply chain management review
In this chapter there is a review of literature concerning SCM, the Lean and Green paradigms, a
sub-section about the hybrid Lean-Green paradigm and a brief review about SC performance
measures. The automotive industry and its connection with the Lean and Green paradigms are
part of the last sub-section of this literature review. This chapter ends with a theoretical
framework.
2.1 Supply chain management The main objective of every SC is to maximize the overall value generated, which is the
difference between what the final product is worth to the customer and the effort to the SC
expends in filling the customer’s request, by matching demand with supply and do so with the
minimal inventory (Ranganathan and Premkumar, 2012). All flows of information, product, or
funds, generate costs within the SC, so that, the appropriate management of flows is critical to
SC success (Ranganathan and Premkumar, 2012). Success is no longer measured by a single
transaction, and competition is often evaluated as a network of co-operating organizations
competing with other organizations along the entire SC (Spekman et al., 1998).
According to Duarte et al. (2011) the SCM intends to manage and improve the flow of materials,
services and information, from the origin to the delivery points, to satisfy the requirements of the
final customer at the lowest possible cost for all the intervenient. Ranganathan and Premkumar
(2012) also state that SCM involves the management of flows between and among stages in a
SC to maximize its total profitability. To be an efficient SC, it’s mandatory to deliver the right
materials, in the right places, in the right quantities, with the appropriate appearance (Duarte et
al., 2011).
For Ranganathan and Premkumar (2012), an effective SC consists of some drivers and each
one of them has the ability to directly affect the SC and enable certain capabilities, so that,
organizations must make decisions individually and collectively regarding their actions in
the area of these drivers. Hugos (2006) describes the five major drivers as: production,
transportation, location, inventory and information. Figure 2.1 shows this five major drivers in a
SC context.
Since each level of the SC focuses on a compatible set of objectives, redundant activities and
duplicated effort can be reduced, which facilitates the ability of SC partners to openly share
information to jointly meet end user’s needs (Spekman et al., 1998). A flow of supply exists for
all the type of products and also a cyclic process takes place between the SC entities
(Ranganathan and Premkumar, 2012). Figure 2.2 shows an illustration of a manufacturing
organization’s SC and it contains all the flows that happen from the raw material supplier to the
end-user.

8
Figure 2.1: The major supply chain drivers.
Adapted from Hugos (2006).
The authors Ranganathan and Premkumar (2012) in their work highlight the SC cycles,
mentioning that a cyclic process takes place between the entities. It is mentioned the existence
of four cycles: i) procurement cycle: occurs at the manufacturer/supplier interface and
includes all processes necessary to ensure that materials are available for manufacturing to
occur according to schedule; ii) manufacturing cycle: occurs at the distributor/manufacturer (or
retailer/manufacturer) interfaces and includes all processes involved in replenishing distributor
(or retailer) inventory; iii) replenishment cycle: occurs at the retailer/distributor interface, includes
all processes involved in replenishing retailer inventory and it is initiated when a retailer places
an order to replenish inventories to meet future demand; iv) customer order cycle: occurs at the
customer/retailer interface and includes all processes directly involved in receiving and filling the
customer’s order.
To manage and have an efficient SC, many organizations have adopted management’s
paradigms like Lean or Green, to optimize performance and competitive advantage. Lean and
Green paradigms aim the same goal, which is to satisfy the customer needs, at the lowest
possible cost to all members in the SC. Ravet (2012) considers that Lean and Green SC’s are
able to satisfy the demands of customers and consequently achieve sustainable development.

9
The Lean and Green paradigms are modern management strategies that recognize new
opportunities for SC improvement and have been explored independently in isolated contexts
and normally applied to production level. Therefore, and despite its importance on the SCM, the
understanding of how these two paradigms may be integrated within the SC context it’s not
deeply explored.
Figure 2.2: Supply chain view.
Adapted from Spekman et al. (1998) and Ranganathan and Premkumar (2012).
The Lean and Green paradigms are modern management strategies that recognize new
opportunities for SC improvement and have been explored independently in isolated contexts
and normally applied to production level. Therefore, and despite its importance on the SCM, the
understanding of how these two paradigms may be integrated within the SC context it’s not
deeply explored.
2.2 Lean supply chain Intending to show a better way to organize and manage customer relations, the SC, product
development, and production operations, a paradigm pioneered by the Japanese Toyota
Company after World War II was mentioned in the book: “The Machine That Changed the
World” by the authors: Womack, Jones, and Roos. This book was first published in 1990, and at
the time, the Japanese company – Toyota, was half the size of General Motors.
10
“The Machine That Changed the World” reveals Toyota's Lean production system (TPS), that is
the basis for its enduring success and contrasts two fundamentally different business systems:
Lean and mass production, which are two very different ways of thinking about how humans
work together to create value. Robert Green the Quality Digest's managing editor in his article
about Lean, points out that TPS system is considered the earliest form of Lean manufacturing.
Together with Toyota's Shigeo Shingo and Taiichi Ohno, Kiichiro Toyoda developed the TPS
system, whose objective was minimizing any consumption of resources that added no value to
the finished product (Green, 2002).
Womack et al. (1990) with their book, provided a comprehensive description of the entire Lean
system, mentioning its advantages over the mass production model and predicted that Lean
production would eventually triumph not just in manufacturing, but in every value-creating
activity from health care to retail to distribution. According to the same authors, Lean paradigm
is an methodology which provides a way to do more and more with less and less (less human
effort, less equipment, less time, and less space), while coming closer to customer
requirements. Azevedo and Carvalho (2012) consider it as a systematic paradigm to identify
and eliminate all non-value added activities through continuous improvement.
The Lean manufacturing handbook by T.Epply (2008) gives a good example of a non-value
added activity: if a shirt to be custom made is ordered, it may take 6 weeks, when the actual
time that the tailors or seamstresses are working on the shirt is only 5 hours. The rest of the
time is taken up by such things as material ordering, waiting between processes and inefficient
shipping practices, so the extra time does not add value to the customer. If Lean manufacturing
principals were applied to the shirt-making process, there would be a reduction in delivery time
from 6 to 4 weeks and even less. The idea of the ideal shirt-making operation is to conclude that
the customer should receive what and when he/she wants, at the lowest possible cost within the
least amount of time. Still considering the non-value added activities, the same author, explains
the difference between “add value to the customer” and “add value to the product” using the
same t-shirt example. The author refers that that the custom made shirt may be made more
valuable by adding extra stitching, using top of the line fabric and adding a monogram and all
these things add value to the product in terms of quality and the longevity of the product. But, if
the customer just wants a basic shirt that fits well and that will last about two years, then these
things do not add value to him. The customer will not be willing to pay a premium to have a
more valuable product. So, the added extras are actually a form of waste.
Ravet (2012) refers that the majority of the existing research stresses that competitiveness of
Lean production comes from physical savings (less material, fewer parts, shorter production
operation, less productive needed for set-ups, etc.) but on the technical side, a focus is also
done on the “psychological efficiency” (commitment, cognition, empowerment, communication,
etc.).
11
Ravet (2012) emphasized the fact that Lean production is not just a technological system, but
also a concept implemented throughout the whole organization, that requires consensus on
corporate culture and has been one of the competitive advantages for Japanese enterprises,
and the cultural element behind it. T.Epply (2008) also agrees and mentions that find and
eliminate waste in the work environment requires a major shift in one's understanding as to
what waste is. To truly implement a Lean manufacturing system, first it is necessary to change
the definition of waste, to anything that does not add value to the customer and then, once the
mind-set is changed, it will be possible to see opportunity after opportunity for eliminating waste.
The Lean Enterprise Institute (2009) considers that Lean thinking and Lean consciousness and
its methods are only beginning to take root among senior managers and leaders. The Lean
paradigm is increasing and spreading around the world, while organization’s leaders are
adapting the tools and principles beyond manufacturing, to logistics and distribution, services,
retail, healthcare, construction, maintenance, and even government.
2.3 Green supply chain In the past, innovation was predominantly driven by the intention of exceeding customer’s
expectations or to create simpler and less costly processes. However, nowadays several
organizations are required to respond to the increased pressure from community and
environmentally conscious consumers that led to rigorous environmental regulations, forcing the
manufacturers to effectively integrate environmental concerns into their management practices
(Nunes et al., 2008). The 21st century brought new concerns and pressures to the way
organizations innovate, so, time and money are being spent to enhance the efforts of
environmental protection and sustainable development (Nunes et al., 2008; Chuang et al.,
2013). Also, many environmental protection measures have been legislated by governments in
response to the Green consciousness among consumers and governments, and some
directives are created as a product of collaborative international efforts to shape environment
policy based (Chuang et al., 2013). Notable examples are the Montreal protocol on substances
that deplete the ozone layer, the Kyoto protocol or more recently, the ISO 14000 environment
management systems and standards (Chuang et al., 2013). However, the International
Symposium of Green Manufacturing and Applications 2012, shown that policies, societal
behaviours in usage of products, and integration of other fields such as composite materials,
nano-scale science and technology, and buildings are necessary (Ahn et al., 2013).
Complying with international regulations sometimes motivate organizations to improve their
Green competitiveness to win a market, as policies can also become international trade barriers
that force organizations to improve their environmental practices to adhere to the environmental
protection trends (Chuang et al., 2013).

12
Environmental concerns like atmospheric pollution, scarcity of freshwater or land availability,
have a high impact on how organizations manage their business, and therefore, they are a
driver to innovation; e.g. the availability of land can create a pressure on the prices for land
disposal, which “forces” organisations to innovate in order to reduce the waste from their
production sites (Nunes et al., 2008).
In many developed countries, manufacturers are mandated by law to retrieve, recover and/or
dispose of used products and packaging, leading to the evolution of phrases such as ‘reverse
logistics’, ‘closed-loop SC’s’ and ‘Green SC’s’ (Mitra et al., 2013). Li et al. (2013) consider that
although substantial improvement has been made over the last years, the energy and
environment still remain as top concerns for manufacturers and consumers despite the
economic downturn and point out that it is estimated that Green energy can save EU 3 trillion
euros by 2050. The same authors also refer that it is a fact that the “Green” jobs are growing
faster than overall job growth in the U.S, so going “Green” or “sustainable” is not an option, but
a necessity.
The Global environmental measures in addition to Green development trends and industrial
competition require that organizations urgently adopt Green-manufacturing practices, so the
development of paradigms to enhance the Green performance of a company therefore has
become important (Chuang et al., 2013).
Nunes et al. (2008) describe and divide Green innovation management in three steps: (i)
identification of environmental demands, customer’s requirements and acceptance of
environmentally-friendly products, competitors’ actions, amongst other factors; (ii)
implementation or development of the idea in the market; (iii) monitoring activity that should
feedback an organization about its Green innovation in order to enhance the learning of
innovating in sustainable way.
Chuang et al. (2013) consider Green manufacturing as a method that minimises waste and
pollution and it is a subset of sustainable manufacturing. Li et al. (2013) give a wider description
of Green manufacturing, describing it as method that covers abroad spectrum of manufacturing,
from development of Green technology products (in particular, those used in renewable energy
systems and technology equipment), implementation of advanced manufacturing and
production technologies, and introduction of energy efficient and environmentally friendly
manufacturing processes and systems, from the plant floor to the enterprise level, and the
whole SC.
The changing global scenario and the growing concern over environmental issues had a
considerable effect on traditional SC’s, which integrate raw material delivery, the manufacturing
process and final product delivery to customers either through retail or through distribution
services (Mishra et al., 2012).
13
Nowadays organizations need to incorporate an additional component to handle environmental
concerns, as a result, Green sustainable SC’s are being developed, using environmentally
friendly materials that can easily be recycled (Mishra et al., 2012).
Azevedo and Carvalho (2012) in their work describe Green SC management (GSCM) as an
“integrating environmental thinking into SCM, including product design, material sourcing and
selection, manufacturing processes, delivery of the final product to the consumers as well as
end-of-life management of the product after its useful life”.
Mishra et al. (2012) refer that the by-products produced by environmentally friendly materials
have advantages, i.e. they can be reclaimed and re-used within the manufacturing process, so,
the authors consider that GSCM involves Green purchasing, Green manufacturing, materials
management, Green distribution and marketing and, finally, reverse logistics. It has emerged as
an organizational philosophy that seeks to achieve corporate profit and market share objectives,
reducing environmental risks and impacts, while improving the ecological efficiency of these
organizations and their partners (Carvalho, 2013). It involves finance flow, logistics flow,
information flow, integration, relationships, and environmental management, promoting
efficiency and synergy between partners, facilitates environmental performance, minimal waste
and cost savings (Duarte et al., 2011).
Carvalho et al. (2012) consider an advantage, if all Green practices could cover all the SC
activities, from Green purchasing to integrate lifecycle management, through to manufacturer,
customer, and closing the loop with reverse logistics. In addition, it is mentioned that it is
necessary to consider the integration of organizational environmental management practices
into the entire SC to make it sustainable and competitive. Moreover, GSCM can reduce the
ecological impact of industrial activity without sacrificing quality, cost, reliability, performance or
energy utilization efficiency. In conclusion, meeting environmental regulations to not only
minimizing ecological damage, but also leading to overall economic profit, makes the Green
paradigm an important source of the organization’s competitive advantages.
2.4 Lean and Green supply chain paradigms characterization In literature it is possible to find an extensive set of practices associated to Lean and Green
paradigms, and also some works comparing both of them, or even both with other paradigms,
namely e.g. Carvalho et al. (2011a), Carvalho et al. (2011b) and Vasconcelos et al. (2013)
among other.
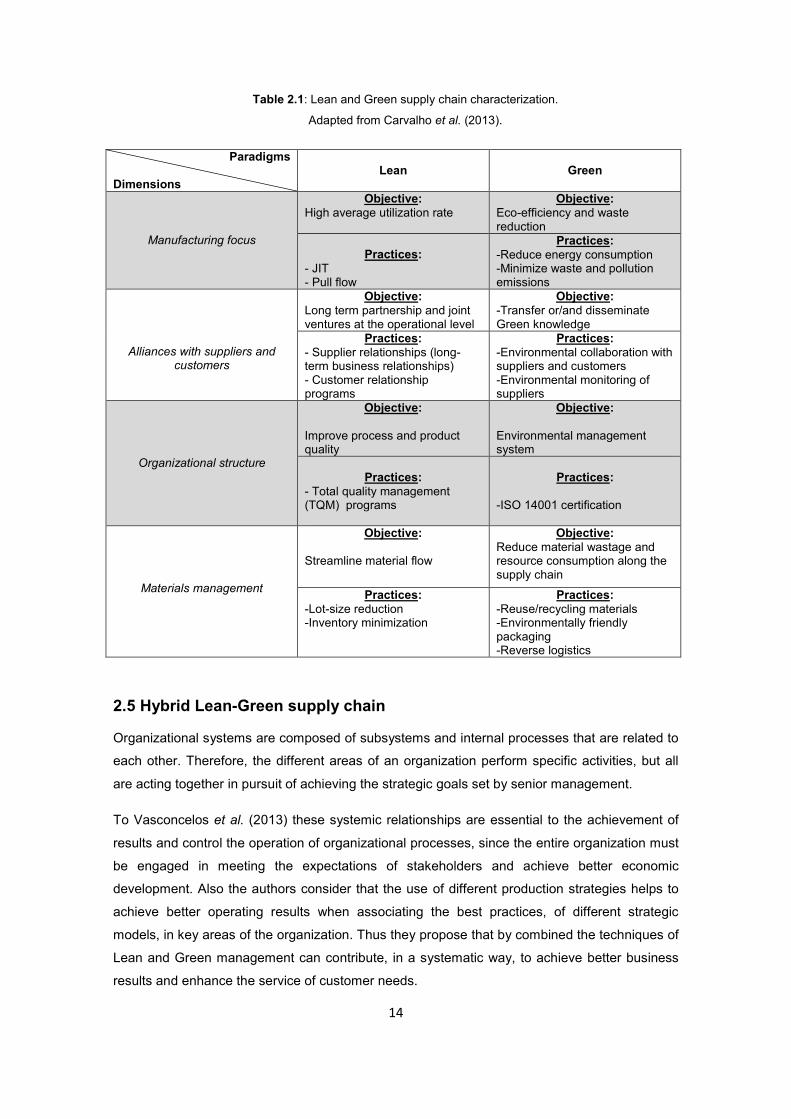
Table 2.1 contains the paradigms characterization and the practices associated with each one
for the four dimensions: manufacturing focus; alliances with suppliers and customers;
organizational structure and materials management. The practices contained in this table will be
used to report the empirical work of this research.
14
Table 2.1: Lean and Green supply chain characterization.
Adapted from Carvalho et al. (2013).
Paradigms
Dimensions
Lean
Green
Manufacturing focus
Objective: High average utilization rate
Objective: Eco-efficiency and waste reduction
Practices:
- JIT - Pull flow
Practices: -Reduce energy consumption -Minimize waste and pollution emissions
Alliances with suppliers and customers
Objective: Long term partnership and joint ventures at the operational level
Objective: -Transfer or/and disseminate Green knowledge
Practices: - Supplier relationships (long-term business relationships) - Customer relationship programs
Practices: -Environmental collaboration with suppliers and customers -Environmental monitoring of suppliers
Organizational structure
Objective:
Improve process and product quality
Objective:
Environmental management system
Practices:
- Total quality management (TQM) programs
Practices:
-ISO 14001 certification
Materials management
Objective: Streamline material flow
Objective: Reduce material wastage and resource consumption along the supply chain
Practices: -Lot-size reduction -Inventory minimization
Practices: -Reuse/recycling materials -Environmentally friendly packaging -Reverse logistics
2.5 Hybrid Lean-Green supply chain Organizational systems are composed of subsystems and internal processes that are related to
each other. Therefore, the different areas of an organization perform specific activities, but all
are acting together in pursuit of achieving the strategic goals set by senior management.
To Vasconcelos et al. (2013) these systemic relationships are essential to the achievement of
results and control the operation of organizational processes, since the entire organization must
be engaged in meeting the expectations of stakeholders and achieve better economic
development. Also the authors consider that the use of different production strategies helps to
achieve better operating results when associating the best practices, of different strategic
models, in key areas of the organization. Thus they propose that by combined the techniques of
Lean and Green management can contribute, in a systematic way, to achieve better business
results and enhance the service of customer needs.
15
Ravet (2012) considers that Lean and Green paradigms should not be considered alone or in
isolation within the SC. Also Cruz Machado and Duarte (2010) share the same idea, and
comment that trade-offs between those management paradigms may help organizations and
their SC to become more competitive and sustainable.
Santos (2013) refers that it may be difficult to categorize an organisation as being Lean or
Green, but in today’s business environment, the challenge is to integrate the paradigms on the
same SC. Therefore, it is essential to extend knowledge of the trade-offs between paradigms,
assessing their contribution for efficiency, streamlining and sustainability of SC’s. This author
also refers that although the paradigms like agile, Green, Lean and resilient seem to be
contradictory, it would be ideal that managers combine two or more paradigms to find the best
strategies for SC’s.
Duarte et al. (2013) consider that the compatibility between Lean and Green paradigms
represents a new way of thinking in the context of SCM and the integration of both paradigms
may develop a hybrid SC.
An important quote can by fond in the document “The Lean and Environmental Toolkit”, which
assembles practical experience collected by the U.S. Environmental Protection Agency (EPA)
from a group of partner organizations that have experience with coordinating Lean
implementation and environmental management, and adds environmental metrics to Lean
metrics, referring that: “using environmental metrics in Lean efforts will allow organizations to
document the environmental benefits that are part of Lean implementation, as well as identify
targets for future improvement efforts” (EPA, 2007). In this way, the development of Lean
production and its inter-relationship with the environmental management must occur
systemically, mobilizing the various operational areas of the organization in order to achieve
concrete results through a sustainable management strategy (Vasconcelos et al., 2013)
2.6 Supply chain performance The application of paradigms such as Lean and Green on SCM influence the PMS. Design the
PMS allows organizations to reach a holistic vision of effective and efficient businesses (Duarte
et al., 2011). The same authors refer that: “developing the metrics for performance
measurement of a SC is a difficult problem” and also point out that the performance measures
may influence the decisions to be made at the different organizational levels: i) Financial
measures are appropriate for strategic decision and ii) Non-financial measures might be more
proper for operational decisions.
Carvalho and Cruz Machado (2009) state that to develop an efficient and effective SC, it is
necessary to assess its performance, and since SC managers take decisions with the purpose
of improving key performance indicators (KPI’s).

16
The determination of priorities among performance measures and an understanding of the
intricate relationships among them are critical to achieving high levels of performance.
According to Azevedo et al. (2013) it is really important to develop a performance measurement
system that incorporates issues in way to study the Lean and Green SC performance, and very
few studies exist relating performance metrics in current strategies of the SCM, so this work
intends to be a contribution in this field.
In this work the development of an interpretive structural model (ISM) intends to analyse the
relationships among measures. The idea is to support managers in the decision making process
and to provide monitoring capability to analyse the influence of their decisions on the SC
performance in an integrated way (Azevedo et al., 2013).
Table 2.2 provides the PMS that is used in this work. All the performance measures are
developed from the organization perspective, to assess its contribution to the overall
performance of the SC, so that any organization, whatever their position in the SC as a
producer or distributor, can use the proposed PMS to assess the effect of their actions on
overall SC performance and compare the influence of the adoption of Lean or Green practices
(Carvalho et al., 2011).
2.7 Lean and Green synergies, similarities and differences
2.7.1 Synergies
Lean manufacturing objectives are to tighten up efficiency, cut down on wasted time, maximize
talent and reduce waste and it may seem like the same benefits of going Green, so it makes
sense to study and argue some of the similarities and synergies, where Green manufacturing
intersects with Lean principles. Dües et al. (2011) explain that in a synergy, all partners have to
influence each other in a positive way, increasing the greater benefits of the relationship.
Dües et al. (2011) refer that a synergy is often described with the equation 1+1=3, and it means
that combined practices have greater results than the sum of the separate performances.
According to those authors there are few studies about the relationship between aspects of
Lean and Green practices, but they propose that Lean companies which include Green
practices achieve better Lean results (particularly improved cost performance) than those
companies which do not. They also argue about the synergies between the Lean and Green
paradigms and mention that setting goals for achieving Leanness will be a catalyst for
successfully implementing Green practices and help in reaching Green goals as well.

17
Lean and Green practices are described by Carvalho and Cruz-Machado (2009) as a
synergistic joining of environmental and operations management. Therefore, in a synergy of the
Lean and Green paradigms, Lean has to be driving forward and enhancing Green practices,
while at the same time Green has to be synergistic for Lean.
Table 2.2: Measures and metrics to evaluate the influence of Lean and Green practices
on supply chain performance.
Adapted from Azevedo et al. (2011) and Carvalho et al. (2011b).
Variables (measures) Metrics
Su
pp
ly c
hain
perf
orm
an
ce m
eas
ure
s
Operational cost: It is an important aid to making judgments and decisions, because its purpose is to evaluate, control and improve operational processes.
- Warranty cost - Production cost - Unit production costs - Cost per operating hour - Cost of maintaining stocks
Business wastage: It is used in its broader sense including typical Lean wastages.
- Total flow quantity of scrap - Percentage of materials remanufactured - Percentage of materials recycled or reused - Returning customers ratio - Hazardous and toxic material output
Environmental cost: It is crucial to have information about environmental practice’s costs to scrap/rework, disposal and purchasing environmentally friendly materials, certification, among others.
- Cost of scrap or rework - Cost for purchasing environmentally friendly materials - Disposal costs - Recycling cost = transport + storage costs - Costs of training in environmental policies
Customer satisfaction: The degree to which customers along the supply chain are satisfied with the product and/or service received.
- Aftersales service efficiency = number of customers served/ the number of customers seeking for service
- Rates of customer complaints - Stock-out ratio - Delivery-time
Efficiency: Generate the highest return using fewer resources by reducing waste.
- Overhead expense = selling, general and administrative expenses/total of sales
- Operating expenses = (selling, general and administrative expenses + cost of goods sold) / total of sales
Evaluation of product life cycle: It is crucial to have information about the wastes and consumption, in order to be as Lean and Green as possible.
- Energy consumption - Solid and liquid wastes - Greenhouse gas emission - Release of toxic and hazardous materials
Quality: Achieve the zero defects and satisfy the customer needs.
- Customer rejection rate - Finished product first pass yield-> finish products that
are met all specifications, on time, first time (no rework). - In plant defect fallow rate - Increment product quality = (quality of outgoing
reprocessed products – quality of incoming used products)
As an example from those found in literature, Bergmiller and McCright (2009) identify the
correlation between Green operations and Lean results by studying Shingo prize winners and
finalists. They have followed a methodology with interesting conclusions related to the
synergistic relationship between Lean and Green operations (Figure 2.3).

18
In their work, Bergmiller and McCright (2009) point out that synergistic Lean and Green
practices optimize the human resources applied to waste reduction. In their opinion, the move
towards Green manufacturing is more than just a coincidental side-effect but rather a natural
extension. The authors also consider that Green techniques will enhance Lean efforts and
address ever more urgent environmental issues that organizations need to deal with. In
addition, they state that Green practices serve as a catalyst to Lean results, which indicate the
great potential for integration.
Figure 2.3: Model of a synergistic relationship between Lean and Green operations.
Adapted from Bergmiller and McCright (2009).
The work of Bergmiller and McCright (2009) also indicates that uniting Lean and Green into a
single zero waste operations system, is capable of realize efficiencies and synergies well
beyond what was found in their study.
There are substantial research opportunities to create a single Lean and Green operations
model (hybrid model), that maximizes synergistic Lean and Green practices and improve the
efficiency and effectiveness of total waste reduction efforts. In short, Bergmiller and McCright
findings indicate that only when both paradigms are implemented simultaneously Lean and
Green can unfold their full potential and bring greater benefits than when implemented
separately.
2.7.2 Similarities and differences
Despite the integration of paradigms like Lean and Green in SCM is object of study of a limited
number of researches, it is possible to say that some of them recognize a connection beyond
waste reduction. In their work, Carvalho and Cruz Machado (2009) explore the Lean, agile,
resilient and Green paradigms and describe the causal relationships of SC attributes and KPI’s
(cost, service level and lead time) in a conceptual model, providing a thorough understanding of
synergies and discrepancies between them.
Table 2.3 shows an overview of main similarities and divergences between the paradigms
implementation in the SC. Carvalho and Cruz Machado (2009) highlight the synergies of the
paradigms.
19
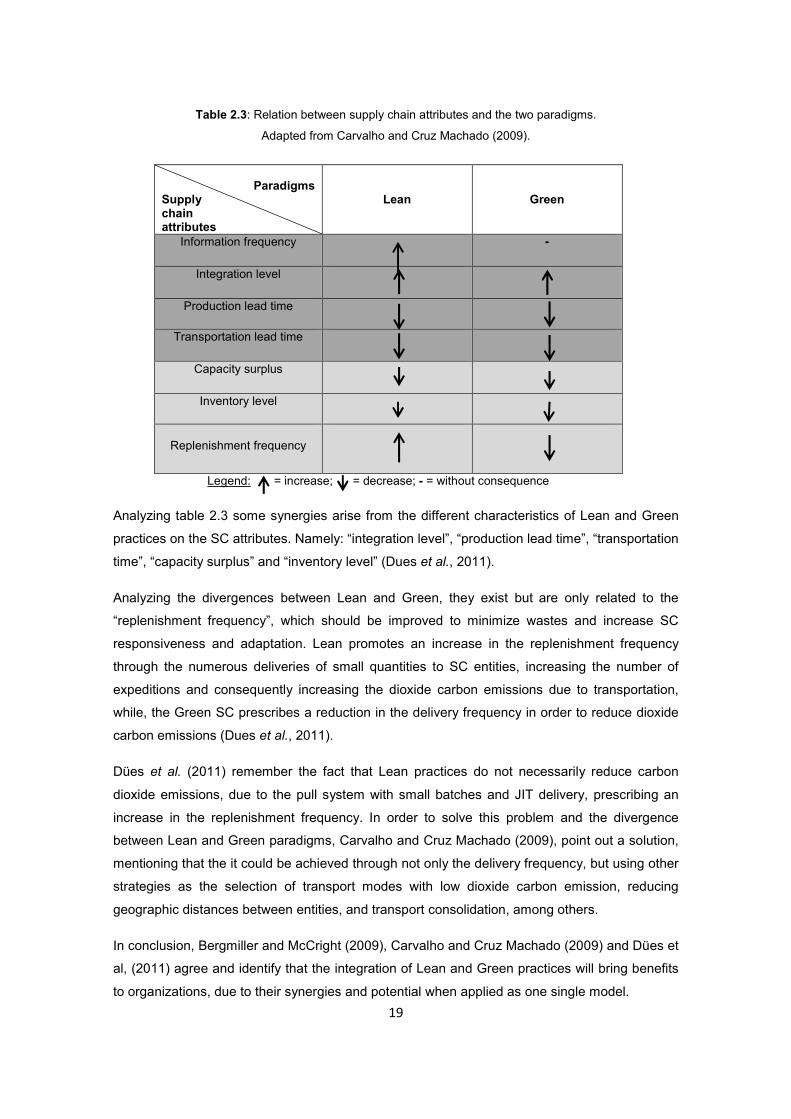
Table 2.3: Relation between supply chain attributes and the two paradigms.
Adapted from Carvalho and Cruz Machado (2009).
Paradigms Supply chain attributes
Lean
Green
Information frequency -
Integration level
Production lead time
Transportation lead time
Capacity surplus
Inventory level
Replenishment frequency
Legend: = increase; = decrease; - = without consequence
Analyzing table 2.3 some synergies arise from the different characteristics of Lean and Green
practices on the SC attributes. Namely: “integration level”, “production lead time”, “transportation
time”, “capacity surplus” and “inventory level” (Dues et al., 2011).
Analyzing the divergences between Lean and Green, they exist but are only related to the
“replenishment frequency”, which should be improved to minimize wastes and increase SC
responsiveness and adaptation. Lean promotes an increase in the replenishment frequency
through the numerous deliveries of small quantities to SC entities, increasing the number of
expeditions and consequently increasing the dioxide carbon emissions due to transportation,
while, the Green SC prescribes a reduction in the delivery frequency in order to reduce dioxide
carbon emissions (Dues et al., 2011).
Dües et al. (2011) remember the fact that Lean practices do not necessarily reduce carbon
dioxide emissions, due to the pull system with small batches and JIT delivery, prescribing an
increase in the replenishment frequency. In order to solve this problem and the divergence
between Lean and Green paradigms, Carvalho and Cruz Machado (2009), point out a solution,
mentioning that the it could be achieved through not only the delivery frequency, but using other
strategies as the selection of transport modes with low dioxide carbon emission, reducing
geographic distances between entities, and transport consolidation, among others.
In conclusion, Bergmiller and McCright (2009), Carvalho and Cruz Machado (2009) and Dües et
al, (2011) agree and identify that the integration of Lean and Green practices will bring benefits
to organizations, due to their synergies and potential when applied as one single model.

20
2.8 Automotive industry The following sections intend to briefly introduce the automotive industry, clarify the reader with
the reasons why this issue is so important and at the same time explain why it is being studied
in this work.
2.8.1 Automotive supply chain
Beltramello (2012) refers that the automotive industry is characterised by the presence of a
limited number of large international vehicle manufacturers and integrators of systems and
modules, as well as several suppliers of components and raw materials. The industry value
chain is characterised by a structure in "tiers", where OEM’s (original equipment manufacturers)
are responsible for the assembly of the final product and sell the vehicles under their brand
names. The same author also explains that along the value chain, suppliers are ranked in terms
of the complexity of the components they manufacture. In addition, first-tier suppliers, typically
supply OEM’s directly, not only individual parts but also entire modules and sub-systems of
vehicles. Concluding, once the assembly process is terminated, vehicles are distributed to
dealers.
2.8.2. Importance of the automotive industry
The automotive industry may have a huge importance in the economy of many countries, even
in the smaller ones. One of the examples is Portugal, which is a small country in Europe. AFIA
(Portuguese Association of Automotive Suppliers) is the association that links and represents
the Portuguese automotive suppliers, both at the national and international level, was very
helpful and kindly provided some information to show in detail the impact and importance of the
automotive industry in the Portuguese economy. In figure 2.4 it is described that the total
Portuguese automotive industry represents the biggest sector of exportation of goods in 2013
with 8 120 Million €, in which 6 000 Million € represent the manufacturing of components.
In the figure 2.5 it is possible to highlight some comparisons between three automotive industry
sectors as molds and tools, automotive components and automotive manufacturing. The
turnover, jobs, the organizations, the GDP (gross domestic product) and exportations can be
analyzed and some conclusions might be taken.

21
Figure 2.4 : Exportation of Goods in Portugal (2013).
Adapted from AFIA 2013.
As an example, it can be seen also in figure 2.5 that the sum of the three sector leads to 5,2%
of the Portuguese GDP and represents 12,1% of the exportations of the country. Moreover it is
possible to highlight that the components industry gives more than 41 000 jobs and it is the
sector which has the highest turnover among the three sectors.
2.8.3. Automotive industry innovations
Due to the lack of environmental awareness the automotive industry has created some serious
problems worldwide. Vehicles emit what are called “Greenhouse” gases like carbon dioxide and
carbon monoxide and many vehicles emit solid particulates into the air, but there is an
increasing consumer preference toward vehicles with a lower carbon footprint (Doe, 2014;
KPMG International, 2010). Governments have responded to market forces and geo-political
factors by imposing stringent environmental regulations on OEM’s for emissions control and fuel
economy.

22
As a result, global OEM’s and suppliers are being challenged to constantly update their product
portfolios to meet numerous regulatory requirements, which are expected to add relevantly to
their manufacturing costs (KPMG International, 2010).
Figure 2.5: Importance of the automotive industry in the Portuguese economy (2013). Adapted from AFIA 2013
Vegh (2014) considers that one of the largest factors in how innovation works for the automotive
industry is the fact that automotive manufacturing is a group effort and almost everything
happens due to collaboration, because it is not easy for a single entity or OEM, to make a
dramatic change to a product without years of advance planning, notice, and negotiation.
According to Vegh (2014), some of the best improvements are developed at automotive
manufacturer association meetings and symposia. Also refers that the innovation gap between
the automotive industry and others, is that a great idea that finds life somewhere down the
complex automotive SC will need to prove itself several times as it slowly makes its way
upwards to where it will gain some attention.
According to Nunes and Bennet (2008) the automotive industry is facing some innovation
challenges. Namely, the transfer of the assembly plants to developing countries and global
outsourcing are evident changes in the industry’s business and operations strategy. In addition,
the same authors remember to the fact that automobile industry was the pioneer in the use of
robots and it still is the main destination of the use of robotics, still being responsible for 60% of
the total utilisation of robots in the world.

23
As the industry innovates its way towards new business models with alternative powertrains and
fuel-efficient technologies, it is clear the map of the industry will look very different from the one
today. So, OEM’s and suppliers should embrace emission regulations and technologies and use
them as competitive advantages (KPMG international, 2010).
In Portuguese context AFIA’s association believes that the future of the automotive
manufacturing and processes goes to gather resources and increase efficiency in the
automotive plants. Some examples of Portuguese plants that are well succeeded “Autoeuropa”
or “Bosch Car Multimedia”.
Autoeuropa is a major example of success. This automaker is the biggest automotive producer
in Portugal and have been resisting to the displacement of plants to East Europe or China. One
of the reasons of its success, is the location of its main suppliers near the plant in the same
industrial area. This provides a decrease of needs of material from external suppliers, reducing
the time of logistics/transportation and avoiding long distances between SC partners.
2.8.4 Lean and Green in automotive industry
In this work there is an evident focus on articles related to the automotive industry, not only
because this is the industry under study in this work, but also because of its connection to Lean
and Green paradigms. Looking back at the history, it is possible to note that the automobile
industry has had few radical changes over the last 30 years; however these few changes were
often remarkable and had a relevant impact on practice and academia (Nunes and Bennett,
2008). Concerning Lean paradigm, it is impossible not to associate with the Japanese
automotive enterprise Toyota, the leading Lean exemplar in the world and one of the largest
automakers in the world in terms of overall sales. Toyota has its dominant success in everything
from rising sales, market shares in every global market and a clear lead in hybrid technology, all
of them strong proofs of the power of Lean enterprise.
Toyota’s success created an enormous demand for greater knowledge about Lean thinking, and
nowadays there are literally hundreds of books and papers, not to mention thousands of media
articles exploring the subject, and numerous other resources available to this growing audience.
According to Hall. C (2009) the Green paradigm is younger than Lean. He refers that in the last
decade there has been a relevant increase in public awareness of the need to conserve energy,
recycle waste, and make lifestyle choices that are environmentally friendly. He also notes that
some organizations have adopted slogans or advertising campaigns that emphasize their
proactive involvement in the environmental movement. The same author, points out that the
automobile industry and more specifically the Japanese automaker Toyota, took advantage
among the others competitors, introducing a model called “Prius” with advertisements that
emphasize how the car is environmentally friendly.

24
In conclusion, Chad Hall points out that in the case of the automotive industry, the changes that
can be made are those that relate to using energy more efficiently, thereby reducing the
aggregate annual consumption of fuel. Nunes and Bennett (2008) provide in their paper, two
case studies were it is shown two major Green innovations apart from the use or creation of a
different kind of fuel: the Norwegian “Th!nk” and the german BMW. It is reported that the
Norwegian car is 16% made by recycled materials and 95% is recyclable, and also it is
mentioned that BMW had the first water-based paint shop in USA with the main environmental
benefit of reducing in the emissions of Volatile Organic Compounds.
It is a fact that there is a concern about Lean and Green in the automotive industry, and had
been increasing over the years. This is a strategic issue for the automotive manufactures like
Toyota, General Motors, Nissan or Opel. But there is still a lack of knowledge and studies about
the application of both paradigms as a single strategy (hybrid strategy) in order to improve the
overall performance of SC’s. This hybrid strategy could help automotive manufactures apply
Lean and Green as management tool that boosts an organization and make it more competitive
and sustainable.
2.9. Theoretical framework Considering the literature review and the lack of knowledge about Lean and Green when
applied together to increase the performance on SC, it is critical the identification of the
relationships between Lean and Green practices and SC performance.
The focus of this work is to find out the relevant Lean and Green practices that are being used
in the automotive industry to the performance of SC’s. To this end, a theoretical framework was
developed in order to explore the influence of Lean and Green practices on SC performance.
Figure 2.6, provides an overview of the proposed framework. It can be seen that the Green and
Lean practices which are the focus of this research are not only those that are internal to the
organization but also the ones which transcend the organization’s boundaries involving
suppliers (e.g. “environmental collaboration with suppliers”) and customers (e.g. ”working with
customers to change product specifications”).
The theoretical framework also proposes a number of measures to evaluate the influence of
these practices on SC performance from operational, economic and environmental
perspectives.

25
Summarizing, it is clear that the synergies and similarities of Lean and Green paradigms point
out the existence of relationships among them. It is expected the existence of a positive
relationship and a positive impact of the hybrid Lean and Green paradigm in the organization’s
performance, which will maximize the overall SC’s performance. Moreover, it is expected that
the ISM methodology can capture the interactions and clarifies the linkages among Lean and
Green practices and SC performance through a single systemic model.
Supply chain green practices: Environmental friendly practices in purchasing Working with designers and suppliers to reduce and eliminate product environmental impact Environmental collaboration with suppliers Minimizing waste ISO 14001 certification Decreased consumption of hazardous and toxic materials Environmental collaboration with customers Environmental friendly packaging Working with customers to change product specifications
Supply chain lean practices: JIT (just-in-time) Deliveries directly to the point of use Geographical concentration Using EDI’s to share information Single sourcering TQM (Total quality management) Pull Flow Supplier relationships/long-term business relationships programs Lot-size reduction Inventory Minimization
?
Supply chain performance measures:
Economic: - Efficiency - Environmental cost - Cost
Operational: - Customer satisfaction - Quality
Environmental: - Business wastage - Evaluation of the product life cycle
Figure 2.6: Theoretical framework of the influence of lean and green practices on supply chain performance.
Adapted from Carvalho et al. (2012) and Azevedo et al. (2011).

26

27
3. Methodology
In the following sections the focus is the explanation of the research stages, the objective of
using two interview protocols and also an overview of the ISM methodology.
3.1 Research stages To gain knowledge of i) which practices deployed by the automotive SC are most relevant to be
considered Lean and Green, ii) which performance measures are considered most relevant to
assess the influence of Lean and Green practices on the automotive SC performance, iii) what
relationships exist between Lean and Green practices and the overall SC performance in this
industry, two interview protocols were performed in this research (Appendix A and B). The
interviews protocols were made in Portuguese language, since this is the researcher and
interviewed native language. The aim of these interviews is to understand which set of Lean
and Green practices and set of SC measures are most relevant for this research. Several
experts in the automotive industry and some academics were the informants of this research.
Also, an objective of the interviews was to facilitate the development of a relationship matrix as
a first step towards developing an ISM-based model. The research methodology comprises
three stages as described in the next paragraphs.
Stage 1: It starts with the gathering of a set of Lean and Green practices and SC measures from
the literature review. Then, the first interview protocol (in appendix A) was sent by e-mail or
given in hand in certain cases (interview). The interviews protocols given to the professionals
have few differences from the ones that were given to academics. The professionals had to fulfil
the firm characterization, respond to questions about Green SC practices and Lean SC
practices, and also which practices are applied in the organization. In the end they respond to
questions about a set of SC performance measures. The academics had as a first step to fulfil
their academic profile, respond to a set questions about Green SC practices and Lean SC
practices, and also to respond to a set of questions about SC performance measures. From the
responses two Green, two Lean and six SC performance measures were then selected. These
practices and measures are the ones included in the second interview protocol. This stage is
analysed in section 4.1.
Stage 2: It contains the second interview protocol (in appendix B). This second interview
protocol intended to register the perception of professionals from automotive industry and
academics on the relationships between four practices (two Lean and two Green) and six SC
performance measures that were ranked as the most relevant in the first interview.
The professionals and academics fulfilled the Structural Self-Interaction Matrix – (SSIM) using
four symbols, considering the relationships between “variable i” and “variable j”. This stage is
fully explained in section 4.2.
28
Stage 3: Is this last stage all the data was analysed, the ISM model was developed and
conclusions were taken. This stage is performed from sections 4.3 to 4.7.
3.2 An overview of ISM methodology The ISM-based methodology was first proposed by Warfield in 1973 to analyse the complex
socioeconomic systems (Carvalho, 2013). The ISM methodology uses expert’s practical
experience and knowledge to decompose a complex system into several elements and
construct a multilevel visualised hierarchical structure (Warfield, 1976; Chang et al., 2013). It is
a method of analyzing and solving complex problems to manage decision-making (Chang et al.,
2013). Raj et al. (2008) describes the ISM as a process that transforms unclear and poorly
articulated mental models of systems into visible and well defined models. Faisal (2010)
describes the ISM as an interpretive and structural methodology: “the judgement of the group
decides whether and how the variables are related” and it is a structural model, as on the basis
of relationship an overall structure is extracted from the complex set of variables. The same
author considers also the ISM as a modelling technique in which the specific relationships of the
variables and the overall structure of the system under consideration are portrayed in a digraph
model.
It is generally felt that researchers encounter difficulties in dealing with complex issues or
systems, due to the presence of a large number of elements and interactions among these
elements, e.g. the management of a manufacturing system, that consists of a large number of
factors associated with physical elements and/or decision-making (Raj et al., 2008; Chang et
al., 2013). Also, the presence of directly or indirectly related factors, complicates the structure of
a system which may or may not be articulated in a clear manner, making difficult to deal with
such a system in which structure is not clearly defined (Raj et al., 2008; Chang et al., 2013).
Therefore, it is needed the development of a methodology that aids in identifying an inter-
relationship structure within a system: the ISM model, in which a set of different directly and
indirectly related elements are structured into a systematic model (Sage, 1977).
Attri et al. (2013) describe the applications of ISM methodology, which can be used at a high
level of abstraction, such as needed for long range planning. The model can also be used at a
more concrete level to process and structure details related to a problem or activity such as:
process design, career planning, strategic planning, engineering problems, product design,
process re-engineering, complex technical problems, financial decision making, human
resources, competitive analysis and electronic commerce.
The ISM methodology has been widely applied in various applications. Table 3.1 includes some
of the examples that can be found in the literature.

29
Table 3.1 Applications of ISM methodology.
Adapted from Carvalho (2013)
Authors Topic under considerations
Raj et al. (2008)
An ISM approach for modelling the enablers of flexible manufacturing system: the case for India
Govindan et al. (2013)
Analyzing green supply chain management practices in Brazil’s electrical/electronics industry using ISM
Faisal (2010)
Analyzing the barriers to corporate social responsibility in supply chains: an ISM approach
Alawamleh and Popplewell (2011) Interpretive structural modelling (ISM) of risk sources in a virtual organization
Chang et al. (2013)
An ISM-ANP approach to identifying key agile factors in launching a new product into mass production
Bolaños et al. (2005) Using interpretive structural modelling in strategic decision-making groups
The ISM methodology is used in this work to identify the relationships between Lean and Green
practices and also SC performance measures and it was chosen because it supports the
identification of the main relationships among specific variables, which define a problem or an
issue. It also empathized by the Carvalho H. (2013) that this methodology allows the
identification of the main research variables and also it can act as a tool for imposing order and
direction on the complexity of relationships among variables.
To Raj et al. (2008) there are two basic concepts which are essential to understand the ISM
methodology: transivity and reachability. These concepts are clarified as follows:
- Transivity: As shown in figure 3.2, if element i relates to element j (iRj) and element j
relates to element k (jRk), then transitivity implies element i relates to element k (iRk).
In the same fashion, it implies that element i relates to element m (iRm) and element j
relates to element m (jRm). It helps in maintaining the conceptual consistency.
- Reachability: is the building block of ISM methodology, where different identified
elements are compared on a pair-wise basis with respect to their interrelation. This
information is represented in the form of binary matrix – reachability matrix (RM). The
RM (that is fully explained in section 4.3) consists of some entries from the pair-wise
comparisons and some inferred entries, and one does not need to make all
comparisons.
Figure 3.2 illustrates the steps involved in the ISM methodology (Carvalho, 2013; Faisal, 2010;
Govindan et al., 2013; Raj et al., 2008; Attri et al., 2013 and Alawamleh and Popplewell, 2011)
and it includes the following main steps:

30
Figure 3.2: Transitive graph. Adapted from Raj et al. (2008)
(i) Organize an ISM implementation group: To begin with, a group of people (experts and/or
academics) with relevant knowledge, skills, and backgrounds related to the researched topic
must be chosen.
(ii) Variables affecting the system under consideration are listed. Different variables which are
related to defined problems are identified and enlisted by a survey. Concerning this research,
during this step the relevant Lean and Green practices and performance measures which could
be used to evaluate the influence of those practices on SC performance were identified and
selected.
(iii) An adjacent matrix or self-interaction matrix (SSIM) is developed for variables: Through the
use of the expert group, the directed relationships among the variables (two Lean, two Green
and six SC performance measures) are hypothesized, indicating pair-wise relationships among
variables of the system under consideration. This is a way of working on the trade-offs that
could exist among SC practices and performance measures. The adjective “directed” refers to
the need to specify the direction of the relationship (if any) between any two SC performance
measures – e.g., from A to B, from B to A, in both directions between A and B, or A and B
unrelated.
(iv) A RM is developed from the SSIM and is checked for transivity: Based on the adjacent
matrix, a binary matrix (elements are 0 or 1) that reflects the directed relationships between all
the SC practices and performance measures are created. The RM is developed from the SSIM
and subsequently the matrix is checked for transitivity. This matrix states that if a variable A is
related to B and B is related to C, then A is necessarily related to C. Basically, the RM answers
the question: yes or no – is it possible to “reach” factor B by starting at factor A? “Reach” it
means that is there a direct or indirect relationship from A to B.
(v) Decompose variables into different levels, a directed graph is drawn based on the
relationships given above in the RM and the transitive links are removed: The RM is
decomposed to create structural models. This is an algorithm-based process which provides for
the grouping of the research variables (two Lean, two Green and six SC performance
measures) into different levels, depending upon their interrelationships.

31
This provides a multilevel ISM model in which the relationships among variables are clarified.
Finally, the ISM model is checked for conceptual inconsistency and necessary modifications are
incorporated.
Attri et al. (2013) describe some advantages of ISM methodology:
i) No knowledge of the underlying process is required of the participants.
ii) The ISM process is efficient because the use of transitive inference may reduce the
number of the required relational queries by 50–80%.
iii) It guides and records the results of group deliberations on complex issues in an efficient
and systematic manner.
iv) It produces a structured model or graphical representation of the original problem
situation that can be communicated more effectively to others.
v) It enhances the quality of interdisciplinary and interpersonal communication within the
context of the problem situation by focusing the attention of the participants on one
specific question at a time.
vi) It encourages issue analysis by allowing participants to explore the adequacy of a
proposed list of systems elements or issue statements for illuminating a specified
situation.
vii) It serves as a learning tool by forcing participants to develop a deeper understanding of
the meaning and significance of a specified element list and relation.
viii) It permits action or policy analysis by assisting participants in identifying particular areas
for policy action which offer advantages or leverage in pursuing specified objectives.
Attri et al. (2013) and Bolanõs et al. (2005) describe some limitations of ISM methodology:
i) There may be many variables to a problem or issue and that increases the complexity
of the ISM methodology. So it must be considered a limited number of variables in the
development of ISM model. The variables which are least affecting to a problem or
issue, may not be taken in the development of ISM model.
ii) A large number of experts involved in the ISM methodology, makes that other
methodologies are required to compute distances between pairs of structures, or
agreements on the distance and characteristics of relations, leading to the identification
of clusters of respondents with substantial shared knowledge becoming much more
complex the analysis.
iii) These models are not statistically validated, and structural equation modelling (SEM),
also commonly known as linear structural relationship methodology, has the capability
of testing the validity of such hypothetical model.
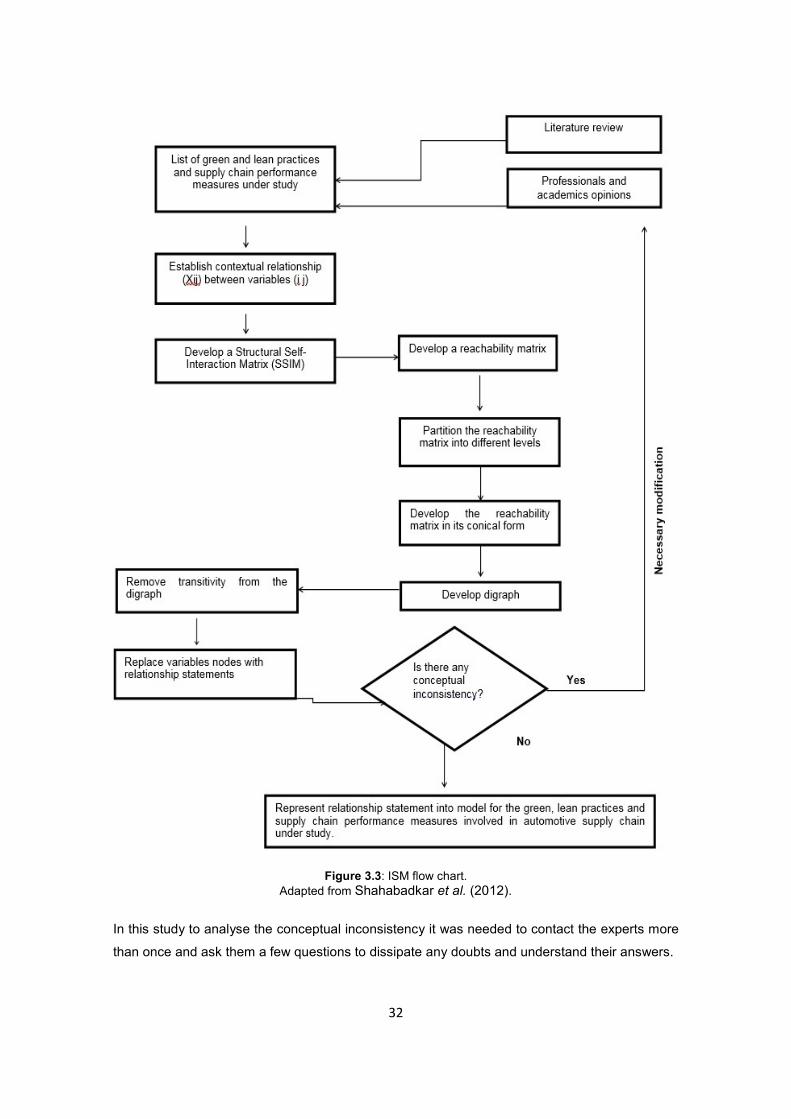
32
Figure 3.3: ISM flow chart.
Adapted from Shahabadkar et al. (2012).
In this study to analyse the conceptual inconsistency it was needed to contact the experts more
than once and ask them a few questions to dissipate any doubts and understand their answers.

33
Summarizing this chapter, it is possible to understand that the ISM methodology is a
methodology that allows its users to develop research works not also in the manufacturing
industry but also as a risk analysis tool (Alawamleh and Popplewell, 2011) or a strategic tool
(Bolanõs et al., 2005). Nevertheless, it has some limitations, as it must be considered only a
limited number of variables in the development of the model in order to reach some reasonable
results, and also the ISM models are not statically validated.

34
35
4. Model development
In the next sections it is explained how the ISM was developed in this work, and how it
contributed to find out which variables are most relevant in the automotive SC.
4.1 Research design The proposed Lean and Green practices and SC performance measures in this work derive
from the literature review in the area of SCM and PMS in the automotive industry. The
interactions among Lean and Green paradigms and SC performance are identified for
companies belonging to the Portuguese automotive SC. Next, the data necessary to develop
the model was collected.
Initially, the work objective and each variable meaning were clarified to the panel of experts.
This step is essential, because the researcher provides the necessary information and support
that the respondents during the questionnaires so they can fulfil them correctly. In a second
phase, the experts’ answer are combined, analysed and convergence identified for relationships
among the variables. Ultimately, the results are traduced in a matrix that reflects the expert’s
consensus.
During this work, to assure validity and reliability, the triangulation is used. Using Bodgan et al.
(2006) definition, comes that: “Triangulation is a powerful technique that facilitates validation of
data through cross verification from two or more sources. In particular, it refers to the application
and combination of several research methodologies in the study of the same phenomenon”. To
assure triangulation a panel constitute by professional and academic experts was used, as the
interview protocols were made to clarify the respondent’s perspective. The research design
used by Carvalho (2013) was followed:
Each paradigm is defined using two practices that contribute only to each paradigm and that are
not related to the others ones. Also, the SC performance construct is defined using autonomous
performance measures, conferring validity to the process. Also a previously brief made to the
respondents about the study objectives and the definition of variables was made, in this way,
the study actually measures what it is supposed to and the demonstrated relationships are
explained by the described practices and performance measures and no others. This means
that the internal validity is achieved.
4.2 Variables selection
In this research for identifying the contextual relationship among Lean and Green practices and
SC performance, three professionals and seven academics with research interests in the areas
of Lean, Green, SC management and others, were consulted.

36
The academics and professionals were selected because they are well conversant with the
Lean and Green practices and SC performance in the automotive industry.
The professionals belong to important companies in the automotive and electrical industry
which besides sited in Portugal also represent foreign organizational cultures, making them
good representatives of the automotive SC reality. The profile of professionals and academics is
shown at Table 4.1.
Table 4.1: Profile of experts
Professionals
Product lines Position in the supply
chain
Number of employees
Person interviewed
Company 1 Equipment of the areas: electrical; safety; medical;
transport; industry; services and engineering
solutions
1 st tier supplier 2500 Engineer/Manager of Contracts of Provision
of Maintenance Services
Company 2 Electric transformers (power and distribution)
2nd tier supplier
173 Production Manager
Company 3 Electrical panels for low and medium voltage
1st tier supplier 83 Coordinator of the Pre-fabrication
Academics
Experience Expertise Affiliation
Academic 1 4 years Business Interoperability; Multi-Criteria Decision Making; LARG Supply Chain
Management; Engineering Design; Modelling and Simulation
New University of Lisbon, FCT
Academic 2 4 years Business Interoperability in Cooperatives Industrial Networks; Supply Chain
Management; Lean; Agile; Resilient And Green
New of University of Lisbon, FCT
Academic 3 10 years Supply Chain and Sustainability New of University of Lisbon, FCT
Academic 4 17 years Supply Chain, Lean, Green New of University of Lisbon, FCT
Academic 5 24 years
Supply chain management New of University of Lisbon, FCT
Academic 6 28 years
Industrial Engineering New of University of Lisbon, FCT
Academic 7 20 years Management University of Business and Economics of University of Beira
Interior
This panel of experts contributes to data and investigator triangulation since the ISM
methodology is developed with the contributions of experts from academia and professionals
from the automotive industry. This gives the perspectives of experts: those who study the
phenomenon (academics) and those who deal with issues on a daily base (professionals).

37
The expert’s opinions are essential to the first interview protocol support the selection of most
relevant Lean and Green practices and SC performance measures.
The choice of the two most relevant Lean and Green practices and the six most relevant SC
performance measures were based on a ranking that is shown in table 4.2. and is prepared as
follows:
- Sum up the scores given by each expert for each practice or performance measure.
- Divide the sum by the total number of responses.
- Rank the practices by order of importance (a variable with a higher value is more
important).
- The variables highlighted had the best score, therefore they were chosen to be in the
ISM methodology.
Among the Lean practices, two variables were chosen among five with the same score,
because they were the ones that had a more standardized response pattern: only one person
gave a score of 3 on 5, and all the other experts attributed to the same two variables a score of
4 or 5. Therefore, “Lot-size reduction” and “Deliveries directly to the point of use” were chosen
to be part of the ISM methodology.
4.3 Development of structural self-interaction matrix (SSIM)
SSIM is the method used to understand what kind of relations exists among the variables under
study. The expert’s opinions are also important in this study, the second interview protocol
(appendix B) was used to identify the relationships among the variables. In this stage, some
interviews took place with some companies like Bosch Car Multimedia and Siemens, and with
AFIA’s technical secretary in order to gather information.
After identifying and enlisting the variables, the next step is to analyse these variables. For this
purpose, a contextual relationship of ‘reaches to’ type is chosen. This means that one variable
reaches to another chosen variable. Based on this principle, a contextual relationship between
the variables is developed (Carvalho 2013; Raj et al., 2008). Keeping in mind the contextual
relationship for each variable, the existence of a relation between any two variables (i and j) and
the associated direction of this relation is questioned.

38
Table 4.2 – Expert’s ranking
EXPERT'S RANKING: SUPPLY CHAIN GREEN AND LEAN PRACTICES, AND SUPPLY CHAIN PERFORMANCE MEASURES
(Expert's answers from 1 to 5) Academics Professionals
Green Practices A1 A2 A3 A4 A5 A6 A7 P1 P2 P3 (∑Practices or
Measures) /Nexp
Decreased consumption of hazardous and toxic materials 5 4 5 5 5 5 4 5 5 5 4,8 Minimizing waste 5 4 5 5 5 5 4 3 5 4 4,5 Reverse logistics 4 5 4 5 5 5 4 3 3 5 4,3 Working with designers and suppliers to reduce and eliminate product environmental impact 3 2 5 5 5 4 5 4 4 5 4,2 ISO 14001 certification 4 5 4 4 5 4 3 5 3 5 4,2 Environmental collaboration with suppliers 4 5 5 5 3 4 5 4 4 2 4,1 Environmental friendly practices in purchasing 3 4 5 5 4 3 4 4 3 5 4,0 Environmentally friendly packaging 4 4 5 3 5 5 2 4 3 5 4,0 Environmental collaboration with customers 4 2 4 4 3 3 5 4 4 3 3,6 Working with customers to change product specifications 4 2 4 4 4 2 2 3 4 3 3,2 Other : (by Academic 7) Environmental monitoring of suppliers 5 0,5
Lean Practices
Decrease inventory levels 4 4 5 5 2 5 5 5 4 5 4,4 Deliveries directly to the point of use 3 4 4 4 4 5 5 5 4 5 4,3 JIT production system 4 5 5 5 5 5 3 3 5 3 4,3 Lot-size reduction 4 4 5 5 4 4 5 4 3 5 4,3 Pull Flow 5 3 5 5 5 4 3 3 5 5 4,3 Using EDI’s to share information 4 5 4 4 4 4 5 3 3 3 3,9 Supplier relationships/long-term business relationship programs 2 5 4 4 3 2 5 4 3 3 3,5 TQM program 3 3 4 4 3 4 3 4 3 5 3,6 Geographical concentration 3 5 4 3 5 3 1 4 3 3 3,4 Single sourcering 4 4 3 2 4 3 4 4 2 3 3,3 Other : (by Academic 7) Selection of certified suppliers with appropriate expertise 5 0,5
Green supply chain performance measures
Evaluation of the product life cycle 5 3 5 5 5 5 5 4 4 4 4,5 Environmental cost 5 4 5 5 4 5 5 3 4 4 4,4 Business wastage 5 4 5 5 5 5 4 3 4 4 4,4 Efficiency 4 5 5 5 5 3 3 3 1 4 3,8 Cost 4 5 4 3 3 2 4 3 2 4 3,4 Customer satisfaction 4 5 4 3 3 2 2 4 2 5 3,4 Quality 3 4 4 5 3 2 2 4 1 5 3,3 Other 0,0
Lean supply chain performance measures
Cost 5 5 5 5 5 5 4 4 4 5 4,7 Quality 5 5 5 5 5 4 5 4 3 3 4,4 Customer satisfaction 5 5 4 4 5 4 5 4 3 5 4,4 Efficiency 4 5 5 5 4 5 2 4 2 5 4,1 Business wastage 4 4 5 5 3 3 2 3 4 5 3,8 Environmental cost 2 3 3 5 3 3 3 4 4 3 3,3 Evaluation of the product life cycle 2 2 4 3 3 3 1 4 4 3 2,9 Other 0,0

39
The following four symbols are used to denote the direction of the relationship between two
variables (Carvalho 2013; Raj et al., 2008):
- is used for the relation from variable i to variable j (i.e. variable i will help to achieve
variable j)
- is used for the relation from variable j to variable i (i.e. variable j will help to achieve
variable i)
- is used for both direction relations (i.e. variables i and j will help to achieve each
other).
- X is used for no relation between two variables (i.e. variables i and j are unrelated).
Based on contextual relationships, the SSIM was developed for all the ten variables associated
with the Lean and Green SCM practices and SC performance measures, and it was built
considering all the experts’ answers.
In order to analyse the relationship (cell by cell) and chose a symbol (mentioned above) that
represents the relationship between variables, it was performed a sum of the responses of each
respondent and it was chosen the symbol that had more responses. For certain relationships it
was needed to contact the experts more than once and ask them a few questions to dissipate
any doubts and understand their answers, in order to build a single final SSIM matrix. After that
analysis, it was possible to build a single SSIM matrix that represents the expert’s opinion
(Table 4.3).
The following examples help to clarify the relationships in the SSIM matrix:
- Variable 1 helps achieve variable 10. This means that as the level of “minimizing waste”
deployment increases, it helps to reduce the variable “cost”. Thus, the relationship
between variable 1 and 10 is denoted by “” in the Table 4.3.
- Variable 4 helps to achieve variable 2, this the practice “lot-size reduction” would help
achieve the practice “decreased consumption of hazardous and toxic materials”. Thus,
the relationship between these variables is denoted by “ “.
- Variable 1 and 4 help achieve each other. This means that the practice “minimizing
waste”, and “lot-size reduction”, help achieve each other. Thus, the relationship
between these variables is denoted by “”.
- No relationship exists between “decreased consumption of hazardous and toxic
materials” (variable 2) and “customer satisfaction” (variable 9) and hence the
relationship between these variables is denoted by “X”.

40
Table 4.3: Final SSIM matrix
4.4 Development of the reachability matrix
In a first step, the reachability matrix is developed from SSIM. The SSIM format is converted
into a binary matrix, called the initial reachability matrix by transforming the information of
each cell (, , and X) into binary digits (i.e. ones or zeros) as appropriate. The rules for
the substitution of 1’s and 0’s are as follows (Carvalho 2013; Faisal, 2010; Govidan et al.,
2013):
- If the (i, j) entry in the SSIM is , then the (i, j) entry in the initial reachability matrix
becomes 1 and the (j, i) entry becomes 0.
- If the (i, j) entry in the SSIM is , then the (i, j) entry in the initial reachability matrix
becomes 0 and the (j, i) entry becomes 1.
- If the (i, j) entry in the SSIM is , then the (i, j) entry in the initial reachability matrix
becomes 1 and the (j, i) entry becomes 1.
- If the (i, j) entry in the SSIM is X, then the (i, j) entry in the initial reachability matrix
becomes 0 and the (j, i) entry also becomes 0.
Following these rules the initial reachability matrix for the variables was build as shown in Table
4.4.

41
As a second sub-step, final reachability matrix is prepared. For this purpose, the concept of
transitivity (enumerated in section 3.2) is introduced, so that some of the cells of the initial
reachability matrix are filled by inference. The final reachability matrix will then consist of some
entries from the pair-wise comparisons and some inferred entries.
The transitivity concept is used to fill the gap, if any, in the opinions collected during the
development of SSIM, so any transitive links that may exist between different variables should
be investigated. After incorporating the transitivity concept as described above, the final
reachability matrix is obtained and is presented in table 4.5.
Table 4.4: Initial reachability matrix
Pj
Pi Variables 1 2 3 4 5 6 7 8 9 10
1 Minimizing
waste 1 1 1 1 0 1 1 1 0 1
2 Decreased consumption of hazardous and toxic materials
1 1 0 0 1 1 0 0 0 0
3 Deliveries directly to the point of use
1 0 1 1 0 0 0 1 0 1
4 Lot-size reduction 1 1 1 1 0 0 0 1 0 1
5 Environmental cost
0 0 0 0 1 1 0 0 0 0
6 Evaluation of the product life cycle 0 0 0 0 0 1 0 0 0 0
7 Business wastage
0 0 0 0 0 0 1 0 0 1
8 Quality 0 0 0 0 0 0 0 1 1 1
9 Customer satisfaction
0 0 0 0 0 0 0 0 1 0
10 Cost 0 0 0 0 0 0 0 0 0 1
For a better understanding, looking at the SSIM (table 4.3) it is possible to notice that there is no
direct relationship between variable 1 and variable 9 (the cell contains a X), thus in the initial
reachability matrix (table 4.4) the cell entry (p19; i=1 and j=9) is 0. But on examining the
transitive links it was found that variable 1 impacts variable 8 and variable 8 impacts variable 9.
Hence according to step 4 (section 3.2) of the ISM methodology, it can be inferred that variable
1 has an impact on variable 9. Thus in final reachability matrix (shown in Table 4.5) the cell
entry (p19) is 1. Other entries (marked with an * in Table 4.5) were similarly changed.
In the final reachability matrix, the driving power (last column) and the dependence (last row) of
each variable are also shown.

42
These driving powers and dependencies will be used in the MICMAC analysis (Matrice d’Impact
Croisés – Multiplication Appliqueé à un Classement or Matrix of Cross Impact – Multiplications
Applied to Classification), where the variables will be classified into four groups – autonomous,
dependent, linkage, and independent (Faisal, 2010; Carvalho, 2013).
Table 4.5: Final reachability matrix
Pj
Pi Variables
1 2 3 4 5 6 7 8 9 10 Driving
Power
1 Minimizing
waste 1 1 1 1 1* 1 1 1 1* 1
10
2 Decreased
consumption
of hazardous
and
toxic materials
1 1 1* 1* 1 1 1* 1* 0 1*
9
3 Deliveries
directly to
the point of
use
1 1* 1 1 0 1* 1* 1 1* 1
9
4 Lot-size
reduction 1 1 1 1 1* 1* 1* 1 1* 1
10
5 Environmental
cost 0 0 0 0 1 1 0 0 0 0
2
6 Evaluation of
the
product life
cycle
0 0 0 0 0 1 0 0 0 0
1
7 Business
wastage 0 0 0 0 0 0 1 0 0 1
2
8 Quality 0 0 0 0 0 0 0 1 1 1 3
9 Customer
satisfaction 0 0 0 0 0 0 0 0 1 0
1
10 Cost 0 0 0 0 0 0 0 0 0 1 1
Dependence
4 4 4 4 4 6 5 5 5 7

43
4.5 Partitioning the reachability matrix - Level partitions
From the final reachability matrix, for each factor, the reachability set and antecedent sets are
derived (Warfield, 1974; Sage, 1977; Faisal, 2010; Attri et al., 2013; Govindan et al., 2013;
Carvalho, 2013). The next step of the ISM methodology is the partition of reachability matrix
(Table 4.6).
The reachability set consists of the factor itself and the other factors that it may impact, whereas
the antecedent set consists of the factor itself and the other factors that may impact it (Attri et
al., 2013; Carvalho, 2013 and Govindan et al., 2013). The intersection of the sets is derived for
all the factors, and levels of different factors are determined (Attri el at., 2013).
Subsequently, intersection set for each variable is the intersection of the corresponding
reachability and antecedent sets. If the reachability set and the intersection set are the same,
then the variable is considered to be in level 1 and is given the top position in the ISM hierarchy,
meaning that the variable which would not help in achieving any other variable above its
own level. After the identification of the top-level element, it is discarded from the other
remaining variables (Govindan et al., 2013, Carvalho, 2013 and Azevedo et al., 2013).
Table 4.6 shows the 10 variables, along with their reachability set, antecedent set, intersection
set and levels in this study. Three iterations complete the level identification process of these
practices. It is seen that “evaluation of the product life cycle”, “customer satisfaction” and “cost”
(variable 6, 9 and 10) are found at Level I. Thus, they would be positioned at the top of the ISM
model. This iteration is continued until the levels of each measure are found out. The identified
levels aids in building the digraph and the final framework of ISM (Govindan et al., 2013;
Carvalho, 2013 and Attri et al., 2013).
4.6 ISM-based model At this stage, the structural model is generated and is shown as a graph (Figure 4.1). If the
relationship exists between the variables j and i, an arrow pointing from j and i shows this. The
resulting graph is called a digraph which is a graphical representation of the elements, their
directed relationships, and hierarchical levels. Removing the transitivity’s as described in the
ISM methodology, the digraph is finally converted into the ISM model (Carvalho, 2013). The
contextual relationship in this structure was ‘leads to’, implying that each arrow is read as ‘leads
to’ (Alawamleh and Popplewell, 2011).
Analyzing the digraph it is seen that “evaluation of the product life cycle”, “customer satisfaction”
and “cost” are very relevant variables to the automotive SC as they come at the top of the ISM
hierarchy.

44
These are the performance measures on which the competitiveness of automotive SC depends.
The variables “minimizing wastage”, “decreased consumption of hazardous and toxic materials”,
“deliveries directly to the point of use” and “lot-size reduction” come as the base of the ISM
hierarchy meaning that they influence the remaining variables.
The variables “quality”, “business wastage” and “environmental cost” have appeared at the
middle level of the hierarchy, and are performance measures on which the Leanness and
Greenness of automotive SC’s depend, leading to “customer satisfaction”, “evaluation of the
product life cycle” and “cost”.
The variables “quality”, “business wastage” and “environmental cost” have appeared at the
middle level of the hierarchy, and are performance measures on which the Leanness and
Greenness of automotive SC’s depend, leading to “customer satisfaction”, “evaluation of the
product life cycle” and “cost”.
Table 4.6: Partition of reachability matrix
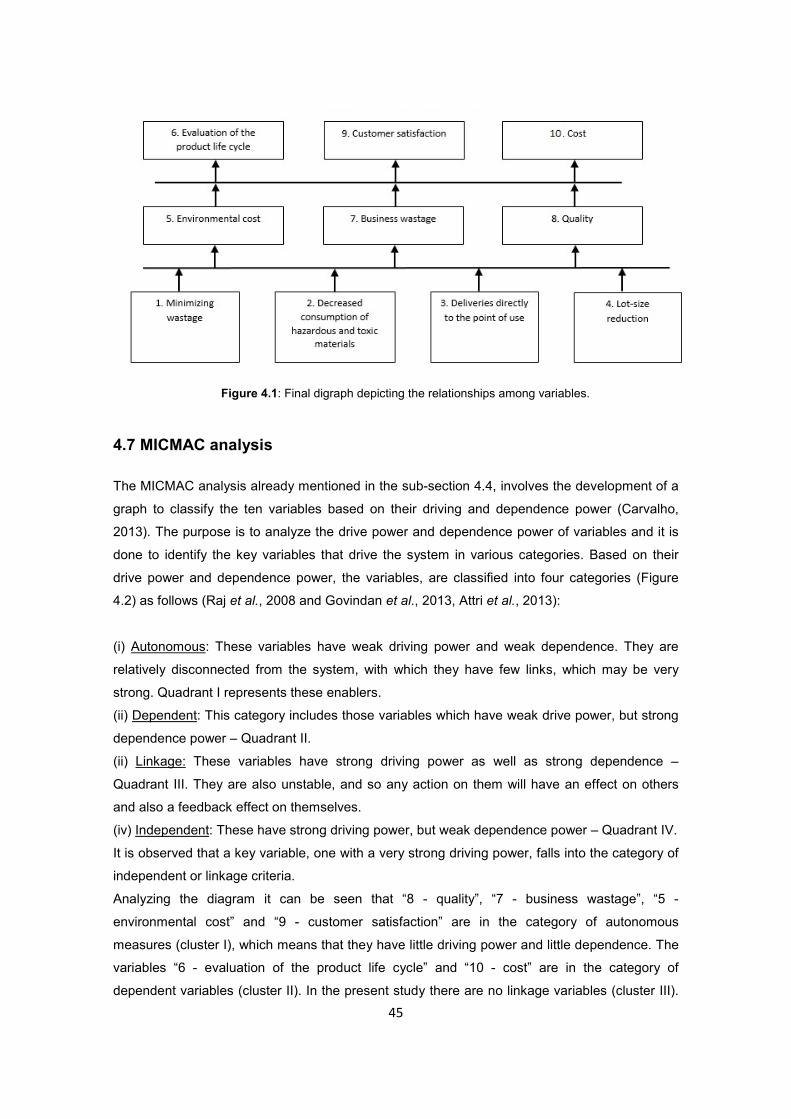
45
Figure 4.1: Final digraph depicting the relationships among variables.
4.7 MICMAC analysis
The MICMAC analysis already mentioned in the sub-section 4.4, involves the development of a
graph to classify the ten variables based on their driving and dependence power (Carvalho,
2013). The purpose is to analyze the drive power and dependence power of variables and it is
done to identify the key variables that drive the system in various categories. Based on their
drive power and dependence power, the variables, are classified into four categories (Figure
4.2) as follows (Raj et al., 2008 and Govindan et al., 2013, Attri et al., 2013):
(i) Autonomous: These variables have weak driving power and weak dependence. They are
relatively disconnected from the system, with which they have few links, which may be very
strong. Quadrant I represents these enablers.
(ii) Dependent: This category includes those variables which have weak drive power, but strong
dependence power – Quadrant II.
(ii) Linkage: These variables have strong driving power as well as strong dependence –
Quadrant III. They are also unstable, and so any action on them will have an effect on others
and also a feedback effect on themselves.
(iv) Independent: These have strong driving power, but weak dependence power – Quadrant IV.
It is observed that a key variable, one with a very strong driving power, falls into the category of
independent or linkage criteria.
Analyzing the diagram it can be seen that “8 - quality”, “7 - business wastage”, “5 -
environmental cost” and “9 - customer satisfaction” are in the category of autonomous
measures (cluster I), which means that they have little driving power and little dependence. The
variables “6 - evaluation of the product life cycle” and “10 - cost” are in the category of
dependent variables (cluster II). In the present study there are no linkage variables (cluster III).

46
In the category of independent variables (cluster IV), the variables that have strong driving
power and low dependence are “1 - minimizing wastage”, “2 - decreased consumption of
hazardous and toxic materials”, “3 - deliveries directly to the point of use” and “4 - lot-size
reduction”.
Figure 4.2: Driving and dependence power diagram for the suggested variables

47
5. Conclusions
In this work a set of Lean and Green practices and performance measures have been
highlighted and it was analysed their interaction. The practices used in this study are:
“decreased consumption of hazardous and toxic materials” and “minimizing waste”, “deliveries
directly to the point of use” and “lot-size reduction”. The measures are: “evaluation of the
product life cycle”, “environmental cost”, “business wastage”, “cost”, “quality” and “customer
satisfaction”.
Carvalho (2013) considers that the implementation of Lean and Green practices and SC
performance measures creates considerable challenges for professionals from the automotive
industry.
Being so, this research and the use of the ISM methodology intend to aid the deployment and
capture interactions among the Lean and Green practices and performance measures. The
model derived from the ISM methodology application makes possible to identify the hierarchy
and the relationships among the variables, representing strategic information to support the
decision making of the professionals and managers. Analysing the fully developed ISM model
performed in this work, it is possible to identify and also summarize relationships among SC
practices and performance measures, which is of considerable value for decision makers. The
ISM model developed in this work is related to the automotive SC, but the identification of SC
practices and performance measures in any SC assumes extreme importance
The model developed allows to deduce which variables are considered the most relevant. In
this case, the variables “minimizing wastage”, “decreased consumption of hazardous and toxic
materials”, “deliveries directly to the point of use” and “Lot-size reduction” are at the bottom level
of the hierarchy, this means that these four variables due to their higher driver power, are
considered the most important for the assessment of automotive SC performance, since they
influence the other variables. Therefore, managers should focus on and deploy them, in order to
have a Leanness and Greenness organization and automotive SC.
The driver-dependence diagram support some conclusions. It is observed that the variables
“evaluation of the product life cycle” and “cost” are weak drivers but moderately dependent on
other variables, meaning that the improvement of its level of performance depends on other
variables, namely “quality”, “business wastage”, and so on.
Also, it is possible to identify four autonomous variables, which have a weak influence on the
others: “quality”, “business wastage”, “environmental cost” and “customer satisfaction”. The
monitoring of these variables is not so critical for the assessment of automotive SC performance
since they have less influence on other variables, allowing managers to focus their attention on
the critical variables. In the linkage category (cluster III), there are no linkage variables.

48
This research supports the idea that not all practices and performance measures in an
automotive SC require the same amount of attention, existing a group of variables that have
high driving power and low dependence, requiring maximum attention, and are of strategic
importance and another group that has a high dependence but low driving power. This
classification may help SC managers to differentiate between independent and dependent
variables and further help them to focus on those variables that are most important so that they
can perform an appropriate SC and achieve competitiveness. Therefore, a conclusion that can
be drawn from analysis of the ISM model is that managers should consider as a priority and
focus their attention on the variables that have a high driving power, since these variables have
the capability to influence all the other variables that are shown at the upper levels of the ISM.
The information presented in this research allows to establish the idea that Lean and Green
paradigms positively influence the supply chain performance, responding to the question: “Is
there a positive influence of Lean and Green management paradigms on supply chain
performance?”.
From the list of authors that are referred in this research, Nunes and Bennett (2008) or
Bergmiller and McCright (2009) can be pointed out, since both have performed important
researches concerning the positive influence of Lean and Green practices.
Nunes and Bennett (2008) cited a Norwegian automaker called “Th!nk” reporting that the
Norwegian car is 16% made by recycled materials and 95% is recyclable, which points out to
the fact that organizations are increasingly conscious about being Lean and Green, gathering
efforts to reduce waste and reduce the ecological footprint. The authors Bergmiller and
McCright (2009) are even more accurate in their conclusions. Their findings refer the
advantages that managers may have when implementing Lean and Green practices as a hybrid
model. Studying the Shingo Prize Awards and the finalists, these authors found out that
synergistic Lean and Green practices optimize the human resources applied to waste reduction.
Also, they state that Green practices serve as a catalyst to Lean results, which indicate the
great potential for integration. Moreover, they indicate that only when both paradigms are
implemented simultaneously, it possible to unfold their full potential and bring greater benefits
than when implemented separately.
From the questionnaires and interviews that took place during this research it is also possible to
refer that these paradigms are being integrated in small or big organizations. The respondents
were always committed to demonstrate that Lean and Green are really important issues in their
daily work, and are considered as increasingly philosophies that organizations adopt. As an
example, scrap rate, delivery-time or energy consumption are topics that are discussed every
day in meetings in several departments.
49
Some considerations and limitations can be pointed to this research. Only ten variables were
used to perform the ISM model. It was used the knowledge of professionals and academics in
the automotive SC industry to derive relationships among the suggested practices and
performance measures, which represents an element of bias (influence). Another point, is that
this research focuses on one specific industrial context, the Portuguese automotive SC, so the
findings may not be applicable across different sectors or countries. There is also the possibility
that different sectors might have different product and process characteristics which could
influence the type, ranking and relationships among the variables that are being studied, leading
to different results from using the ISM methodology.
Since only ten variables were studied in this work, in future research, more extensive studies or
other variables are needed to explore the influence of the Lean and Green variables on SC
performance. Considering that this research was performed by the perceptions of experts from
the Portuguese automotive SC industry, it would be interesting to find out if in a similar research
in another country, the findings would be different. Also, the use of a more diverse panel of
professionals and academics might be interesting.
Since the ISM model is a hypothetical model, it would be useful to suggest it’s statistically
validation. Moreover, the present model can be statistically tested with use of SEM which has
the ability to test the validity and reliability of such models.
It would be interesting to compare ISM and SEM techniques. SEM can statistically validate an
already developed model but cannot prepare an initial model, whereas ISM has the capability to
provide such an initial model (Raj et al. 2008). In future, and due to the complementary nature
of both techniques, future research may be directed to test the validity of the proposed ISM
model by using the SEM technique.
Mohammad Alawamleh & Keith Popplewell (2011) complement the idea of further researches
with the use of fuzzy ISM (FISM), a step ahead of binary ISM that may also be carried out. The
authors explain that while only the existence of relations is considered between elements in the
ISM, the strength of relations is additionally considered in FISM, and the strength of relation can
be quantified using 0-1 scale. So that, future research could include broadening the inputs and
validation with more practitioners and by evaluating an actual set of variables in a real case
study with an experimental methodology to determine if the model’s relationships are influenced
as hypothesized on expert opinions.

50
6. References
AFIA (2013) “Portuguese Automotive Components Industry: Statistics 2013”. An-Yuan Chang, Kuo-Jen Hu and Yun-Lin Hong (2013), “An ISM-ANP approach to identifying key agile factors in launching a new product into mass production”, International Journal of Production Research, Vol. 51, No. 2 , pp. 582-597.
Attri R, Dev N and Sharma V (2013), “Interpretive Structural Modelling (ISM) approach: An Overview”. Retrieved on 03.2014. Available online at http://www.isca.in/IJMS/Archive/v2i2/2.ISCA-RJMS-2012-054.pdf.
Azevedo, S. G., Carvalho, H., and Cruz-Machado, V. (2011), “The influence of green practices on supply chain performance: A case study approach.” Transportation Research Part E: Logistics and Transportation Review, Vol. 47, No. 6, pp. 850–871.
Azevedo, S. G., Carvalho, H. Cruz-Machado, V. (2013), “Using interpretive structural modelling to identify and rank performance measures: An application in the automotive supply chain”, Baltic Journal of Management, Vol. 8, No. 2, pp. 208-230.
Azevedo, S. G., Carvalho H (2012), “Proposal of a Conceptual Model to Analyse the Influence of LARG Practices on Manufacturing Supply Chain Performance”, Journal of Modern Accounting and Auditing Vol. 8, No. 2, pp. 174-184.
Azevedo, S. G., Carvalho, H., Duarte, S., and Cruz-Machado, V. (2012), “Influence of Green and Lean Upstream Supply Chain Management Practices on Business Sustainability”, IEEE Transactions on engineering management, Vol. 59, No. 4, pp. 753-765.
Azfar, K. (2012), “Finding common ground for alignment of supply chain paradigms”, The 6th International Days of Statistics and Economics, Prague, Czech Republic.
Beltramello, A. (2012), “Market Development for Green Cars”, OECD Green Growth Papers, No. 2012-03, OECD Publishing, Paris. Retrieved on 02.2014. Available online at doi: 10.1787/5k95xtcmxltc-en. Bergmiller, M. (2009), “Are Lean and Green Programs Synergistic?”, Proceedings of the 2009 Industrial Engineering Research Conference, Miami, USA.
Breno Nunes and David Bennett (2008), “Managing Innovations: Green Innovation Management in the Automotive Industry”, Journal of Cleaner Production, Aston University, UK.
Bolaños, R., Fontela, E., Nenclares, A. and Pastor, P (2005), “Using interpretive structural modelling in strategic decision-making groups, management decision”, Journal Management Decision , Vol. 43, No. 6, pp. 877-895.
Carvalho, H. Azevedo, S. G., Duarte, S. et al (2011b), “Green and Lean paradigms influence on sustainable business development of manufacturing supply chains”, International Journal of Green Computing, Vol. 2, No. 2, pp. 45-62.
Carvalho, H. Azevedo, S. G., Cruz-Machado, V. (2011a), “Pathways between Lean and Green Paradigms and Manufacturing Supply Chain Performance”, in proceedings of 2011 International Conference on Economics, Business and Marketing Management - EBMM, Shangai, China.
Carvalho H, Govindan K, Azevedo S. G., Cruz-Machado V, “Lean, Green and Resilient influence on supply chain performance: Interpretive structural modelling approach”, International Journal of Environmental Science and Technology, Vol. 12, No. 1, pp. 15-34. Carvalho, H. Azevedo, S. G., and Cruz-Machado, V. (2011), “Lean, agile, resilient and Green: divergences and synergies”, International Journal of Lean Six Sigma, Vol. 2, No. 2, pp. 151-179.

51
Carvalho, H. and Cruz-Machado, V. (2009), “Integrating Lean, Agile, Resilience and Green Paradigms in Supply Chain Management (LARG_SCM)”; Proceedings of the Third International Conference on Management Science and Engineering Management, Tamil Nadu, India.
Cruz-Machado, V. and Duarte, S. (2010), “Trade-offs among Paradigms in Supply Chain Management”, Proceedings of the 2010 International Conference on Industrial Engineering and Operations Management, Dhaka, Bangladesh.
Doe, J. (2014), “The Automotive Industry and Green Awareness”. Retrieved on 02.2014. Available online at http://aiu-english.wikispaces.com/file/view/107-Model+Essay+IP1.pdf.
Duarte, S., Cruz-Machado, V. (2012), “Lean and Green: A Business Model Framework”, Proceedings of the Sixth International Conference on Management Science and Engineering
Management. Lecture Notes in Electrical Engineering, Vol. 185, pp. 751-759.
Duarte, S., Cruz-Machado, V., Cabrita, R. (2011), “Exploring Lean and Green Supply Chain Performance Using Balanced Scorecard Perspective”, Proceedings of the 2011 International Conference on Industrial Engineering and Operations Management, Kuala Lumpur, Malaysia.
Dües C., Tan K, Lim M (2011), “Green as the new lean - How to use lean practices as a catalyst to greening your supply chain”, Journal of cleaner production. Retrieved on 02.2014. Available online at doi:10.1016/j.jclepro.2011.12.023.
EPA (2007), United States Environmental Protection Agency, “The Lean and Environmental toolkit”. Retrieved on 02.2014. Available online at http://www.epa.gov/lean/environment/toolkits/environment/index.htm.
Epply, T. (2008), “The Lean Manufacturing Handbook” assisted by Judy Nagengast, Second Edition. Retrieved on 02.2014. Available online at http://continental-design.com/lean-manufacturing/handbook-1.html.
Espadinha-Cruz, P. (2012), “Lean, Agile, Resilient and Green Supply Chain Management Interoperability assessment methodology”, Dissertação para a obtenção de Grau de Mestre em Engenharia e Gestão Industrial, Faculdade de Ciências e Tecnologia da Universidade Nova de Lisboa, Caparica. Available online at run.unl.pt/bitstream/10362/7845/1/Cruz_2012.pdf.
Faisal, M.N (2010), “Analysing the barriers to corporate social responsibility in supply chains: an interpretive structural modelling approach”, International Journal of Logistics Research and Applications: A Leading Journal of Supply Chain Management, Vol. 13, No. 3, pp. 179-195.
Green, R. (2002), “Lean: What it is, where it started and where it might be going”. Retrieved on 02.2014. Available online at http://www.qualitydigest.com/feb02/html/Lean.html.
Govindan. K, Devika. K, Mathiyazhagan. K, Jabbour. A and Jabbour. C (2013) “Analysing green supply chain management practices in Brazil’s electrical/electronics industry using interpretive structural modelling”, International Journal of Environmental Studies, Vol. 70, No. 4, pp. 477-493.
Hall, C. (2009), “Greening the Automotive Supply Chain”. Retrieved on 02.2014. Available online at http://www.environmentalleader.com/2009/11/05/Greening-the-automotive-supply-chain/.
Hariram Ranganathan and Harishkumar Premkumar (2012), “Improving supply chain performance through Lean and Green: A study at Volvo Group India and Sweden”, Master thesis programme in production and logistics. Hugos, M. (2006), “Essentials of supply chain management”, third edition, Wiley, USA.

52
J. Jayaram, S. Vickery and C. Droge (2008), “Relationship building, Lean strategy and firm performance: an exploratory study in the automotive supplier industry,” International Journal of Production Research, Vol. 46, No. 20, pp. 5633-5649.
Jingshan Li, James R. Morrison, Mike Tao Zhang, Masaru Nakano, Stephan Biller, Bengt Lennartson (2013), “Automation in Green Manufacturing”, IEEE Transactions on automation science and engineering, Vol.10, No.1.
Lean Enterprise Institute (2009), “A Brief History of Lean”. Retrieved on 01.2014. Available online at https://www.Lean.org/.
Mohammad A. and Popplewell K. (2011), “Interpretive structural modelling of risk sources in a virtual organisation”, International Journal of Production Research, Vol. 49, No. 20, pp. 6041-6063.
N. Mishra, V. Kumar and F.T.S. Chan (2012), “A multi-agent architecture for reverse logistics in a Green supply chain”, International Journal of Production Research, Vol. 50, No. 9, pp. 2396-2406.
Nunes, B. (2011), “Greening Operations: An Investigation of Environmental Decision Making” PhD thesis, Aston University. Retrieved on 03.2014. Available online at http://eprints.aston.ac.uk/15851/.
P. Shahabadkar, S.S. Hebbal and S. Prashant (2012), “Deployment of Interpretive Structural Modelling Methodology in Supply Chain Management – An Overview”, International Journal of Industrial Engineering and Production Research, Vol. 23, No. 3, pp. 195-205.
Ravet, D. (2012), “Lean production: the link between supply chain and sustainable development in an international environment”, Colloque Franco-Tch`eque Trends in international business, Jun 2011, Lyon, France. pp. 20. Retrieved on 02.2014. Available online at https://hal.archives-ouvertes.fr/hal-00691666.
Sage, A.P. (1977), “Interpretive structural modelling: methodology for large-scale systems”. McGraw-Hill, New York, USA.
Santos J (2013), “A simulation model for Lean, Agile, Resilient and Green Supply Chain Management: practices and interoperability assessment”, Dissertação para a obtenção de Grau de Mestre em Engenharia e Gestão Industrial, Faculdade de Ciências e Tecnologia da Universidade Nova de Lisboa, Caparica. Available online at http://run.unl.pt/handle/10362/10972.
Shan-Ping Chuang and Chang-Lin Yang (2013), “Key success factors when implementing a Green-manufacturing system”, Production Planning and Control: The management of Operations, Vol. 25, No. 11, pp. 923-937. Retrieved on 02.2014. Available online at http://dx.doi.org/10.1080/09537287.2013.780314.
Spekman R, Kamauff Jr and Myhr (1998), “An empirical investigation into supply chain management - A perspective on partnerships”, International Journal of Physical, Distribution & Logistics, Management, Vol. 28, No. 8, pp. 630-650.
Sung-Hoon Ahn, Doo-Man Chun, and Won-Shik Chu (2013), “Perspective to Green Manufacturing and Applications”, International Journal of Precision Engineering and Manufacturing, Vol. 14, No. 6, pp. 873-874.
Subrata Mitra and Partha Priya Datta (2013), “Adoption of Green supply chain management practices and their impact on performance: an exploratory study of Indian manufacturing firms”, International Journal of Production Research. Retrieved on 02.2014. Available online at http://www.tandfonline.com/doi/abs/10.1080/00207543.2013.849014#.VLLZ9SusUSM.
53
KPMG international (2010), “The Transformation of the Automotive Industry – The Environmental Regulation Effect. Retrieved on 02.2014. Available online at https://www.kpmg.com/cn/en/IssuesAndInsights/ArticlesPublications/Pages/Transformation-Automotive-Industry-O-201001.aspx.
T. Raj, R. Shankar and M. Suhaib (2008), “An ISM approach for modelling the enablers of flexible manufacturing system: the case for India”, International Journal of Production Research, Vol. 46, No. 24, pp. 6883-6912.
Vasconcelos D, Neto J, Viana F (2013), “Lean e Green: A contribuição da produção enxuta e da gestão ambiental para a redução de desperdícios”, XXXVII Encontron da ANPAD, Rio de Janeiro, Brasil.
Vegh, G. (2014), “Is There an Innovation Gap in the Automotive Industry?”. Retrieved on 02.2014. Available at http://www.environmentalleader.com/2014/02/18/is-there-an-innovation-gap-in-the-automotive-industry/.
Warfield, J.N. (1976), “Implication structures for system interconnection matrices”, IEEE Systems, Man and Cybernetics Society.

54
Appendix
Appendix A: Interview protocol (1st) - academics / professionals
Questionário
A sua contribuição é muito importante para o desenvolvimento deste estudo. Por favor aceite
colaborar com esta investigação através do preenchimento deste questionário.
Este questionário tem por objectivo apoiar uma investigação (tese de mestrado) que pretende
estudar a influência da aplicação de práticas “verdes” e de práticas “magras” (Green e Lean) na
gestão da cadeia de abastecimento (GSCM – Green supply chain management and LSCM –
Lean supply chain management) e o seu desempenho.
GSCM surgiu como uma filosofia organizacional pela qual as organizações e os seus parceiros
atingem bons níveis de desempenho em termos de lucro e de quota de mercado, através da
redução dos riscos e impactos ambientais, melhorando a eficiência ecológica.
LSCM representa uma estratégia baseada em redução de custos e flexibilidade, com foco em
melhorias de processos, através da redução ou eliminação de todos os "resíduos" ou
operações sem valor adicional
Um supply chain attribute, é uma característica distintiva ou capacidade das cadeias de
abastecimento, que podem ser geridas através da implementação de práticas de gestão cadeia
de abastecimentos.
A - Caracterização da empresa/organização
A.0 - Responda às seguintes questões: A.1 Sector de actividade:
A.2 Número de empregados:
A.3 Produto principal produzido pela empresa (s):
A.4 Actividade do principal cliente (s):
A.5 Função da pessoa que preenche o questionário:
A.6 Cargo da pessoa que preenche o questionário:
A.7 Nome da pessoa que preenche o questionário:
A.8 Contacto (e-mail):
A.9 Como posiciona a sua empresa na cadeia de abastecimento? (Assinale a sua resposta
com um X)
Fornecedor de 4ª linha
Fornecedor de 3ª linha
Fornecedor de 2ª linha
Fornecedor de 1ª linha
Empresa focal
Cliente de
1ªlinha
Cliente de 2ª linha
Retalhista Consumidor final

55
C – Práticas Verdes (Green)
C.1 - Das seguintes práticas, indique a sua percepção sobre o seu nível de importância para
que determinada cadeia de abastecimento seja considerada verde e sustentável. (De 1 a 5
assinale com um X a resposta mais correcta)
Importância
Práticas Verdes
Prática nada
importante 1
2
3
4
Prática muito
importante 5
Colaboração ambiental com os fornecedores Aplicação de práticas “amigas do ambiente” no processo de compra
Trabalhar conjuntamente com designers e fornecedores
Minimização de desperdícios Diminuição do consumo de materiais tóxicos e perigos
Certificação ISO 14001 Logística Inversa (ex: embalagens retornáveis)
Colaboração ambiental com clientes Utilização de embalagens “amigas do ambiente”
Trabalhar com clientes para alterar as especificações do produto
Outra:
C.2 - Qual o nível/grau de implementação das seguintes práticas verdes pela sua empresa?
(De 1 a 5 assinale com um X a resposta mais correcta)
Grau de
implementação Práticas Verdes
Prática não
implementada 1
2
3
4
Prática totalmente
implementada 5
Colaboração ambiental com os fornecedores
Aplicação de práticas “amigas do ambiente” no processo de compra
Trabalhar conjuntamente com designers e fornecedores
Minimização de desperdícios Diminuição do consumo de materiais tóxicos e perigos
Certificação ISO 14001 Logística Inversa (ex: embalagens retornáveis)
Colaboração ambiental com clientes Utilização de embalagens “amigas do ambiente”
Trabalhar com clientes para alterar as especificações do produto
Outra:

56
D – Práticas magras (Lean)
D.1 - Das seguintes práticas, indique a sua percepção sobre o seu nível de importância para
que determinada cadeia de abastecimentos seja considerada magra e sustentável. (De 1 a 5
assinale com um X a resposta mais correcta)
Importância
Prática
Prática nada
importante 1
2
3
4
Prática muito
importante 5
Sistema de produção JIT (just in time): Pull Flow Relações fornecedor e comerciais de longe prazo
Programa de TQM(Gestão da qualidade total)
Redução de tamanho dos lotes Minimização de stocks Entregas directamente para o ponto de utilização
Concentração geográfica Uso de EDI’s (Troca electrónica de dados) para compartilhar informações
Fornecimento único Outra:
D.2 - Qual o nível/grau de implementação das seguintes práticas magras pela sua
empresa? (De 1 a 5 assinale com um X a sua resposta mais correcta)
Grau de implementação
Prática
Prática não implementada
1
2
3
4
Prática totalmente
implementada 5
Sistema de produção JIT (just in time): Pull Flow Relações fornecedor e comerciais de longe prazo
Programa de TQM(Gestão da qualidade total)
Redução de tamanho dos lotes Minimização de stocks Entregas directamente para o ponto de utilização
Concentração geográfica Uso de EDI’s (Troca electrónica de dados) para compartilhar informações
Fornecimento único Outra:

57
E – Medidas de desempenho na cadeia de abastecimento
E.1 – Práticas verdes (Green)
E.2 – Do seu ponto de vista, das seguintes medidas de desempenho, quais as que melhor
reflectem a influência da aplicação de práticas verdes na gestão da cadeia de
abastecimento sobre o desempenho da mesma? (De 1 a 5 assinale com um X a resposta mais
correcta).
NOTA: Consulte a última página deste questionário para saber quais as métricas em estudo
(uma medida/indicador de desempenho pode ser medido por diferentes métricas).
Influência Medidas de desempenho
Não tem nenhuma influência
1
2
3
4
Tem total influência
5
Qualidade Satisfação dos clientes Custo Eficiência Custos ambientais Avaliação do ciclo de vida dos produtos Desperdícios do negócio (Business waste) Outra:
E.3 – Práticas magras (Lean)
E.4 – Do seu ponto de vista, das seguintes medidas de desempenho, quais as que melhor
reflectem a influência da aplicação de práticas magras na gestão da cadeia de
abastecimento sobre o desempenho da mesma? (De 1 a 5 assinale com um X a resposta mais
correcta).
NOTA: Consulte a última página deste questionário para saber quais as métricas em estudo
(uma medida/indicador de desempenho pode ser medido por diferentes métricas).
Influência Medidas de desempenho
Não tem nenhuma influência
1
2
3
4
Tem total influência
5
Qualidade Satisfação dos clientes Custo Eficiência Custos ambientais Avaliação do ciclo de vida dos produtos Desperdícios do negócio (Business waste) Outra:

58
Legenda: Medida de desempenho Métrica Qualidade
Taxa de rejeição de clientes
Percentagem de peças boas à primeira
Taxa de defeitos interna
Satisfação do cliente
Eficiência do serviço pós-venda
Tempo de entrega (horas)
Serviço ao cliente
Rácio de ruptura de stock
Custo
Custo de garantia
Custo de produção
Custos unitários de produção
Custo horário
Custo de cada elemento da cadeia de abastecimento Custo de manutenção de stocks
Eficiência – gerar o maior retorno usando o menor número de recursos reduzindo os desperdícios
Despesas com “overheads”
Custos operacionais = (venda, despesas gerais e administrativas) / vendas totais
Custos ambientais
Custo de desperdício ou re-trabalho
Multas e penalizações
Custo por compra de materiais amigos do ambiente
Custo de eliminação de desperdícios
Despesas de formação em políticas ambientais
Rácio de despesas de investigação e desenvolvimento
Desperdício do negócio (business wastage)
Quantidade total do fluxo de desperdícios
Percentagem de produtos de re-trabalho
Percentagem de produtos reciclados ou reutilizados
Custo de devolução
Avaliação do ciclo de vida
Consumo energético
Desperdícios sólidos e líquidos
Emissão de gás com efeito de estufa
Emissão de materiais perigosos e tóxicos
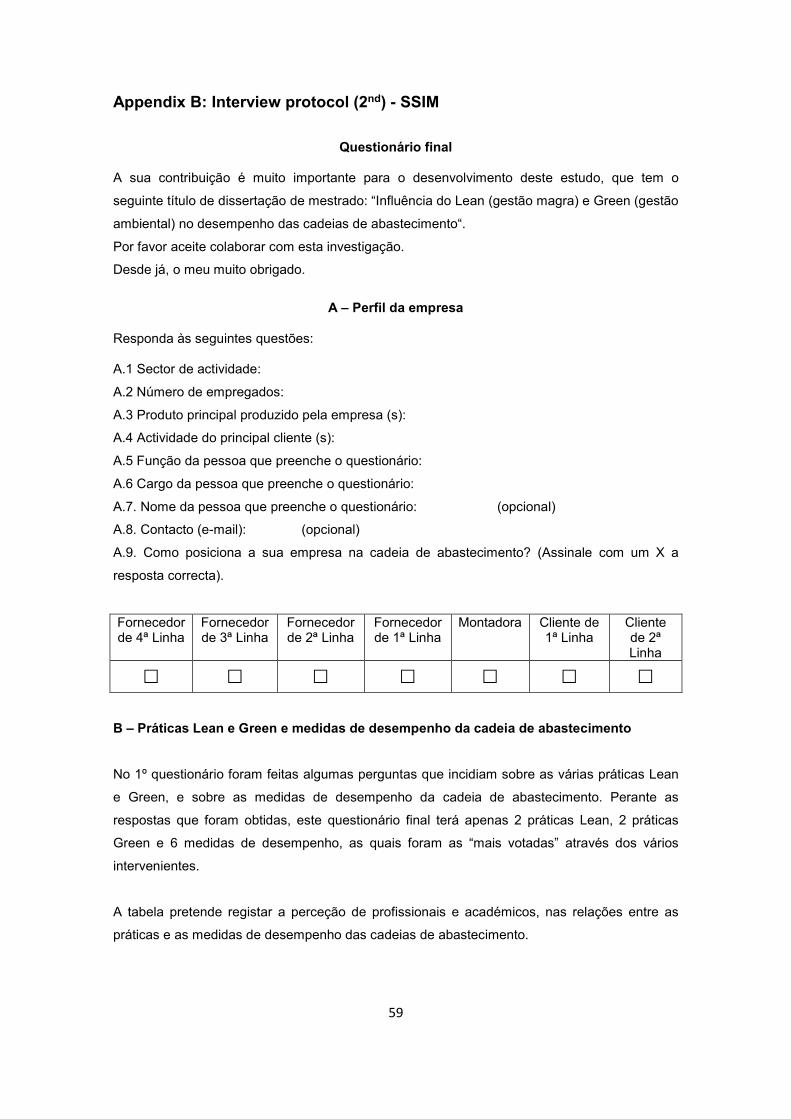
59
Appendix B: Interview protocol (2nd) - SSIM
Questionário final
A sua contribuição é muito importante para o desenvolvimento deste estudo, que tem o
seguinte título de dissertação de mestrado: “Influência do Lean (gestão magra) e Green (gestão
ambiental) no desempenho das cadeias de abastecimento“.
Por favor aceite colaborar com esta investigação.
Desde já, o meu muito obrigado.
A – Perfil da empresa
Responda às seguintes questões: A.1 Sector de actividade:
A.2 Número de empregados:
A.3 Produto principal produzido pela empresa (s):
A.4 Actividade do principal cliente (s):
A.5 Função da pessoa que preenche o questionário:
A.6 Cargo da pessoa que preenche o questionário:
A.7. Nome da pessoa que preenche o questionário: (opcional)
A.8. Contacto (e-mail): (opcional)
A.9. Como posiciona a sua empresa na cadeia de abastecimento? (Assinale com um X a
resposta correcta).
Fornecedor de 4ª Linha
Fornecedor de 3ª Linha
Fornecedor de 2ª Linha
Fornecedor de 1ª Linha
Montadora Cliente de 1ª Linha
Cliente de 2ª Linha
B – Práticas Lean e Green e medidas de desempenho da cadeia de abastecimento
No 1º questionário foram feitas algumas perguntas que incidiam sobre as várias práticas Lean
e Green, e sobre as medidas de desempenho da cadeia de abastecimento. Perante as
respostas que foram obtidas, este questionário final terá apenas 2 práticas Lean, 2 práticas
Green e 6 medidas de desempenho, as quais foram as “mais votadas” através dos vários
intervenientes.
A tabela pretende registar a perceção de profissionais e académicos, nas relações entre as
práticas e as medidas de desempenho das cadeias de abastecimento.
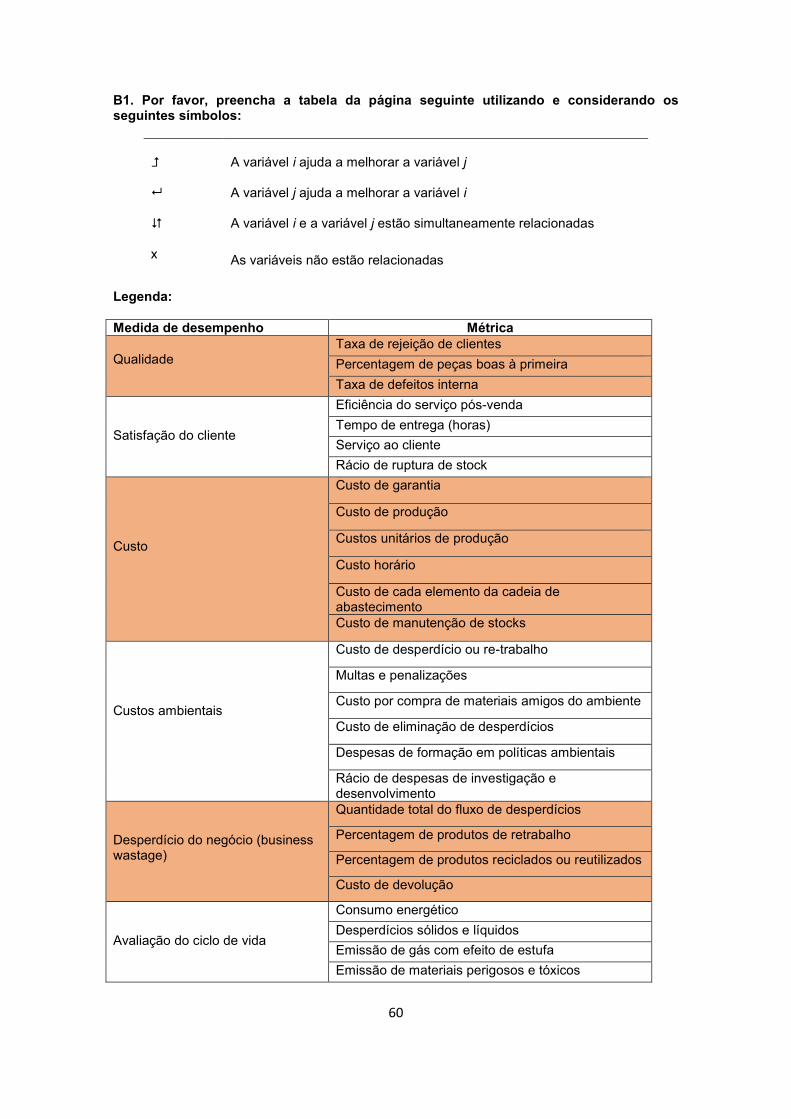
60
B1. Por favor, preencha a tabela da página seguinte utilizando e considerando os seguintes símbolos:
A variável i ajuda a melhorar a variável j
A variável j ajuda a melhorar a variável i
A variável i e a variável j estão simultaneamente relacionadas
x As variáveis não estão relacionadas
Legenda: Medida de desempenho Métrica Qualidade
Taxa de rejeição de clientes
Percentagem de peças boas à primeira
Taxa de defeitos interna
Satisfação do cliente
Eficiência do serviço pós-venda
Tempo de entrega (horas)
Serviço ao cliente
Rácio de ruptura de stock
Custo
Custo de garantia
Custo de produção
Custos unitários de produção
Custo horário
Custo de cada elemento da cadeia de abastecimento Custo de manutenção de stocks
Custos ambientais
Custo de desperdício ou re-trabalho
Multas e penalizações
Custo por compra de materiais amigos do ambiente
Custo de eliminação de desperdícios
Despesas de formação em políticas ambientais
Rácio de despesas de investigação e desenvolvimento
Desperdício do negócio (business wastage)
Quantidade total do fluxo de desperdícios
Percentagem de produtos de retrabalho
Percentagem de produtos reciclados ou reutilizados
Custo de devolução
Avaliação do ciclo de vida
Consumo energético
Desperdícios sólidos e líquidos
Emissão de gás com efeito de estufa
Emissão de materiais perigosos e tóxicos

61
1-
Min
imiz
açã
o
de
desp
erd
ício
s
2-D
imin
uiç
ão
d
o c
on
su
mo
d
e m
ate
riais
tó
xic
os e
/ou
p
eri
go
so
s
-
3-
En
tre
gas
dir
ec
tam
en
te
para
o p
on
to
de u
tilização
- -
4-R
ed
ução
d
o t
am
an
ho
d
e l
ote
s - - -
5-C
usto
s
am
bie
nta
is
- - - -
6-A
vali
aç
ão
d
o c
iclo
de
vid
a d
os
pro
du
tos
- - - - -
7-
Des
perd
ício
s
do
neg
ócio
- - - - - -
8-Q
ualid
ad
e
- - - - - - -
9-S
ati
sfa
çã
o
do
cli
en
te
- - - - - - - -
10-C
usto
- - - - - - - - -
Vari
ável j
Vari
ável i
1-
Min
imiz
açã
o
de
desp
erd
ício
s
2-D
imin
uiç
ão
d
o c
on
su
mo
d
e m
ate
riais
tó
xic
os e
/ou
p
eri
go
so
s
3-
En
tre
gas
dir
ec
tam
en
te
para
o p
on
to
de u
tilização
4-R
ed
ução
d
o t
am
an
ho
d
e l
ote
s
5-C
usto
s
am
bie
nta
is
6-A
vali
aç
ão
d
o c
iclo
de
vid
a d
os
pro
du
tos
7-
Des
perd
ício
s
do
neg
ócio
8-Q
ualid
ad
e
9-S
ati
sfa
çã
o
do
cli
en
te
10-C
usto
Medidas de desempenho da cadeia de abastecimento (5 a 10)
Práticas lean e green (1 a 4)