influence of inoculum size on antibiotic assays by
TRANSCRIPT

INFLUENCE OF INOCULUM SIZE ON ANTIBIOTIC ASSAYS BY THEAGAR DIFFUSION TECHNIQUE WITH KLEBSIELLA
PNEUMONIAE AND STREPTOMYCIN
A. H. LINTONDepartment of Bacteriology, University of Bristol, Bristol, England
Received for publication February 25, 1958
It is widely known that the inoculum size of thetest organism greatly influences the size ofinhibition zones in the agar diffusion assaytechnique, but little quantitative work on thissubject has been reported. Mitchison andSpicer (1949), compared different size inocula ofthe "Mayo" strain of Staphylococcus aureus in theassay of streptomycin, and concluded thatgreater sensitivity was experienced using inoculaas small as were consistent with accurate readingsof the zone edge of growth. Cooper and Wood-man (1946), and Linton (1949), showed thatzones of inhibition were formed at a definite timeafter commencement of incubation of the seededagar, thus relating the growth rate of the testorganism with the formation of the zone edge.This critical time was shown to be the time re-quired for a constant number of generations ofthe test organism to develop from a standardinoculum and any factors which influenced thegrowth rate were shown to correspondingly alterthis critical period (Cooper and Linton, 1952;Cooper and Gillespie, 1952; Linton, 1954).Subsequent work has demonstrated that this
constant number of generations was the numberof cell divisions necessary to reach a criticaldensity of population from a standard inoculumand that the critical time varied in order to allowthis density to be reached. When the inoculumsize was altered, the number of generations re-quired and the critical time varied accordingly,but the critical population required for position-ing the zone edge remained constant (Linton,1955; Cooper, 1955; Cooper et al., 1958).These studies resulted in a theoretical concept
of the formation of the inhibition zones in agardiffusion assays, and this was found to apply overa wide range of temperature and inocula size.Most of this had been worked out with the"Mayo" staphylococcus and streptomycin. Itsapplication to other systems remained to beinvestigated. Results obtained with Klebsiellapneumoniae and streptomycin have now extended
94
our previous observations, and these are reportedhere.
THEORETICAL ASPECTS
The concept of a critical time in which in-hibition zones are formed was first suggested byCooper and Woodman (1946), who proposed ontheoretical grounds the formula
X2 = 4D To 2.30(log mo - log m') (1)
This formula was concerned with the diffusion ofan antibiotic having a diffusion coefficient (D),from a solution kept at constant concentration(mo), into a seeded agar column (figure 1).The critical time (To), which was required for acritical growth-limiting concentration of anti-biotic (m') to reach the position of the zone edge,was obtained either by calculation based on thesize of the zones of inhibition (X) from theformula
To = X2/4D(2.30 log mo/m') (2)
or, by determining the length of time of preincu-bation of seeded agar after which the addition ofeven high concentrations of antibiotic were unableto produce zones of inhibition (figure 2). It wasfound that when the seeded agar was incubatedfor h hour before adding the antibiotic, the sizeof the zones was reduced until, when h = To, nozones were formed. The size of zones for varyingvalues of h may be given by substituting T =(To- h) for To in formula (1) and it follows thatwhen h = 0, then T = To.
Factors, such as incubation temperature, whichalter the growth rate of the test organism werefound to cause a corresponding variation in thecritical time (Cooper and Linton, 1952). This wasexplained by a clearer understanding of themeaning of To when it was shown that
To = L + n'G (3)where L is the lag period of the test organism, Gthe generation time in nutrient agar at the
on February 7, 2018 by guest
http://jb.asm.org/
Dow
nloaded from

EFFECT OF INOCULUM SIZE ON ANTIBIOTIC ACTIVITY 95
(otMot.)
S kA n Inocualted over i
Figure 1. A diagrammatic representation of aninhibition zone in a seeded agar column demon-strating some of the constants used in the theo-retical formulae (after Cooper, 1955).
120
loo
0
EJ° 1,x
0~~~~~~~ow40J
21\
o 1 2 3 4 5Hours of Pre-incubotion
Figure 2. The effect of inoculum size of Kleb-siella pneumoniae on the critical time (To) at 35 Cwith 1000 jug streptomycin per ml. The To valuesare the points of intersection of the graphs withthe time axis. The number of viable organismsper ml in each inoculum are: 0, 7.25 X 10w; O,9.35 X 106; 0, 1.45 X 10⁵; C, 1.45 X 10⁴.
temperature of the experiment and n' thenumber of generations developing in time To(Cooper and Gillespie, 1952). The influence of a
wide range of temperature (22 to 42 C) on the Tovalue was investigated. It was found that, whilethe critical time varied from 2.2 to 9.0 hr, thenumber of generations growing within each Todetermination was remarkably constant (3.5 to4.4 generations) when a standard inoculum andmedium was used. These observations suggestedthat the zone edge was formed when a criticaldensity of organisms had grown and, therefore,the value of n' could be varied according to thesize of the inoculum used. This was confirmed byinvestigating the influence of inoculum size usingthe "Mayo" staphylococcus and chloramphenicol(Linton, 1955). These preliminary observationsprompted Cooper (1955) to use the well knowntheory of the early part of the growth curve togive a theoretical meaning to To.
Let N be the number of organisms at time T,
No the number at zero time, n the number.*fgenerations, and G the generation time, then
N = No2nand
T = L + nG.
In solid media, the number of organisms pe,colony is given by
p = N/No= 2n
or
n log2 p = 1og2 N/No= 3.32 log1o N/No
thus by substitution
T = L + 3.32G(log N/No).When T = To, let the value of N be N' and thevalue of n be n', then
To = L + n'G = L + 3.32G(log N'/No) (4)
The first part of this formula is identical withequation (3) which was derived experimentally.Combining equation (4), using data derived
from the growth curve of the test organism, wilthequation (1) derived from diffusion laws, we haveX2 = 4D(2.30 log mom') (L + 3.32G log N'/No) (5)From these considerations, it is now evident
that n' is the number of generations of the testorganism required to reach a critical density ofpopulation (N') in time To. With a heavyinoculum, both the To and n' values are small,indicating that fewer generations are required toreach the N' value. This accounts for smallerzones with a heavier inoculum. With a lightinoculum, a longer time and more generations arerequired to reach the same N' value and hencethe zones are larger. It was concluded, therefore,that the zone edge was formed at a point in timewhen the critical concentration of antibiotic(m') reached, for the first time, a density ofpopulation (N') which it was incapable oftotally inhibiting. Such circumstances coincide attime To. Thereafter, the density of population issuch that it can deal adequately with concentra-tions of antibiotic greater than m' diffusing to it.These conceptions have now been subjected to
exhaustive experimentation in the case of the"Mayo" staphylococcus and streptomycin(Cooper et al., 1958). Agreement with thetheoretical deductions was found over a wide
19581
on February 7, 2018 by guest
http://jb.asm.org/
Dow
nloaded from

[voL. 76
range of temperature (25 to 40 C) and inoculumsize (2 X 10³ to 5 X 10⁸ viable cells per ml)The value of N', growing from an inoculum lessthan N', was found to be 3.89 X 10⁷ organismsper ml, and was constant for all temperatures.When an inoculum equal to N' was used, small
zones of inhibition and values of To were stillobtained since when No = N', log N'/No = 0and, therefore, To = L. With inocula greaterthan N', the To values diminished and becamezero when inocula equal to or greater than 13.57X 10⁷ organisms per ml were used. This value,which abolished all zone formation, was calledN". It is a measure of the smallest number ofcells, which when inoculated into agar, are ableto take up all the diffusing antibiotic from thebeginning of the lag period without being in-hibited.Both N' and N" proved to be constant at all
temperatures investigated with this combina-tion of antibiotic and test organism and since itwas found that the ratio LIG, determined fromzone size results, was also a constant, it waspossible to extend formula (5) as follows.When No = N" then
L+ Glog2N'/No = 0
1. e.,
L + Glog2N'/N" = 0
Therefore
L = -G(log N' - 10g2 N")
or
LIG = log N" -log N'
and
L/G + log0 N' = log2 N"hence
log2 N' = log,N2 - LIGPart of formula (5) may be written as
L + G log2 N'/No = L + G(log2 N'-log2 No)By substituting the value for log2 N' as
derived above we get
L + G log, N'/No = L + G((log2 N" - LIG)- log No)
= L + G log, N" - L - Glog2 No
= G log2 N"/No= 3.32G log N"/No
Substituting this expression in formula (5) wegetX2= 4D(2.30 log mo/m') (3.32G log N"/No) (6)
In this formula it has been possible to eliminatethe value L which is a very difficult constant todetermine in solid media and use is made only ofthose constants which can be accurately de-termined.Having proved the validity of this theoretical
concept in the case of the "Mayo" staphylococcusand streptomycin, it was thought of interest tosee whether or not other systems would demon-strate such agreement. The present work de-scribes results obtained with the organismKlebsiella pneumoniae opposite in its Gram re-action to the "Mayo" staphylococcus, togetherwith the same antibiotic.
MATERIALS AND METHODS
Organisms. The work described here wascarried out with the strain (N.T.C.C. No. 7242)of Klebsiella pneumoniae used for the assay ofstreptomycin. For regular use, this strain wasmaintained on nutrient agar slants, being sub-cultured at weekly intervals, and kept at roomtemperature after initial incubation at 37 C.The properties of the strain were checked atregular intervals with those of the original.Media. (1) Standard broth:-This was used in
the preparation of the inoculum and for the de-termination of generation time and lag periods.It was prepared with the following ingredients:peptone (Difco), 10 g; NaCl, 5 g; beef heart in-fusion made with glass-distilled water, 500 ml;and the volume made up to 1000 ml with glass-distilled water. After adjusting the pH to 7.8, itwas dispensed in screw-cap bottles (100 mlquantities), sterilized by autoclaving, and storedin the dark.
(2) Standard agar:-For diffusion experiments,1 per cent agar was added to standard broth.
Antibiotic. Streptomycin calcium chloride(Glaxo) was diluted in sterile, glass-distilledwater to give a final concentration of 200 mgstreptomycin per ml. This was stored at 4 C inscrew-cap bottles and replaced at fortnightlyintervals. Immediately before each experiment,dilutions were made in sterile, glass-distilledwater from this stock solution, to contain 10,100, and 1000 ,lg streptomycin per ml.
Preparation of inocula for diffusion experiments.The test organism was inoculated into 10 ml of
96 LINTON
on February 7, 2018 by guest
http://jb.asm.org/
Dow
nloaded from

EFFECT OF INOCULUM SIZE ON ANTIBIOTIC ACTIVITY
standard broth in a plugged tube and incubatedfor 20 hr at 37 C. Immediately before commenc-ing the experiment, this culture was diluted togive a series of dilutions, in sterile glass distilledwater warmed to 37 C. These were planned sothat when 0.5 ml was added to 9.5 ml of moltenstandard agar, held at 45 C in a water bath, thefinal number of viable cells approximated therequired counts.The viable count of the same 20 hr broth
culture was determined by the technique ofMiles and Misra (1938) for each series of ex-periments, and the size of each inoculum wascalculated from this.
Diffusion experiments. (1) Procedure:-Theassay method of Mitchison and Spicer (1949) wasused adopting certain modifications described byCooper and Gillespie (1952). By this method,molten standard agar, after inoculation, wasimmediately pipetted into sterile glass tubes(3 by 75 mm), to a depth of approximately 40mm. The tubes were placed in racks in the up-right position and the agar allowed to set bystanding at room temperature for 10 min. Theracks of tubes were then incubated in water bathsregulated at the required temperature. The timeat which incubation was commenced was regardedas time 0. Three concentrations of streptomycin(10, 100 and 1000 /Ag per ml) were pipetted on tothe agar surface of the first of three series of tubesat time 0 and, thereafter, at convenient periods ofpreincubation, e. g., 1, 2, 3 hr. The depths of thezones of inhibition, produced by diffusion of thestreptomycin, were read after 20 hr incubation.The square of these values (X2) thus obtained foreach concentration of streptomycin and for eachinoculum size, were plotted in various ways inorder to determine the constants To, m', and D.
(2) Determination of To:-When the values ofX2 for each concentration of streptomycin wereplotted against the hours of preincubation (h)the best straight lines through these experimentalpoints, intersected the h axis at time To hr.This value was determined for each inoculumsize (No) investigated, over a range from 8.2 X10³ to 7.8 X 10⁷ viable organisms per ml.
(3) Determination of m':-Plotting the values ofX2 against the logarithm of the concentrations ofstreptomycin used in the experiments (10, 100,and 1000 Mg per ml), resulted in straight linegraphs being obtained for each value of h andthese intersected on the concentration axis at thepoint mi.
(4) Determination of D:-This constant wascalculated by substituting experimental valuesfor X2, To, mo, and m', obtained at 35 C withinocula of different size, in the formula
To = X2/4D log, (mo/m')
The mean value of a large number of determina-tions was adopted. The values of D obtained werevery similar to published results determined byother methods. Values of D for other temper-atures were obtained theoretically, by correctingthe value at 35 C according to the change in theviscosity of water with temperature, by meansof the formula
DI/D2 = Tln2/T2-q I
where D1 and D2 are the diffusion coefficients atabsolute temperatures T1 and T2 and q1 and -12are the viscosities of water at these temperatures(Cooper and Woodman 1946).Determination of generation time and lag periods.
Broth experiments: The generation time and lagperiods of the test organism were determined instandard broth at the same temperature at whichthe diffusion experiments were done. Theseconstants were determined using inocula ofapproximately 1 X 10⁶ viable organisms per mlunder conditions as similar as possible to thoseof the diffusion experiments. This includeddiluting a 20 hr broth culture in sterile, glass-distilled water (1:50), adding 0.5 ml of this to9.5 ml of standard broth warmed to 45 C, coolingat room temperature for 10 min and then com-mencing incubation in accurately controlledwater baths. Samples were removed at regularintervals and the viable counts determined bothby the poured plate and Miles and Misra tech-niques (1938). The generation time and lagperiods were read from graphs plotting theviable counts against time.
RESULTS
A large number of experiments have beenundertaken with a view to quantitatively de-termining the effect of heavy and light inocula on
the size and elimination of inhibition zones withK. pneumoniae and streptomycin. Only a limitednumber of results can be described but thesehave been confirmed by many more determina-tions.The results obtained at one temperature only
will first be considered. Figure 2 presents graphi-cally the effect of inoculum size on determinations
9719581
on February 7, 2018 by guest
http://jb.asm.org/
Dow
nloaded from

LINTON
l,OC
01<.
u
Euin0
)0 0 0'
10 a0 0
<!.1m' value
1.0'C A*-0 25 50 75Values of X' (mm')
100 125
Figure S. Determination of the critical in-hibitory concentration of streptomycin (i') at35 C, with different size inocula of Klebsiellapneumoniae. The symbols which indicate size ofeach inoculum, are the same as in figure 2. The X2values shown were obtained when incubation anddiffusion were started at the same time (i. e.,when h = 0).
of To by prediffusion experiments at 35 C, using1000lug streptomycin ml. With each inoculum theextrapolated value of To was obtained with threeconcentrations of streptomycin and was foundto be independent of the concentration of theantibiotic. The experimental points shown are
the mean of a large number of readings.The critical concentration of streptomycin
(m') which just failed to produce zones of in-hibition was determined for each inoculum sizeand is the extrapolated point on the concentra-tion axis where all the graphs of X2 for eachvalue of h (hr of preincubation) intersect. Infigure 3, the experimental values of X2 for eachof three concentrations of streptomycin obtainedat 35 C, when h = 0, are plotted for each inocu-lum size and it is seen that the m' value is in-dependent of inoculum size.The influence of inoculum size on the zones of
inhibition and the fixing of other constants at35 C, is more clearly seen by plotting the valuesof To and all values of X2 when h = 0, againstthe logarithm of the inoculum size (figure 4Aand B). In figure 4A, the best fitted straight linethrough the To values intersects the inoculumsize axis at log2 No = 26 (6.78 x 10⁷ viableorganisms per ml). Inocula greater than thisvalue do not allow the formation of zones ofinhibition and, therefore, in these cases To = 0.In figure 4B, the values of X2 when h = 0,
12 16 20 22 24 26Inoculum Size (Logq N0)
Figure 4. The effect of inoculum size ofKlebsiella pneumoniae at 35 C on (1) the criticaltime (To), (A), and (2) the size of inhibition zones
obtained with the following concentrations ofstreptomycin; (0 10; X, 100; +, 1000 Ag per ml,(B). In (A), the drawn line is fitted to the experi-mental points; in (B), the lines are calculatedfrom formula 6. N' is the critical density of or-
ganisms which positions the zone edge when grow-ing from smaller inocula of dividing cells. N"is the smallest number of nondividing cells withwhich no inhibition zones can be produced.
TABLE 1
Constants obtained by diffusion experiments withKlebsiella pneumonia and Streptomycin
Temp Diffusion Coefficient Critical Inhibitory(D)* Conc (in)
20 0.734 1.525 0.836 3.230 0.948 3.535 1.06 3.240 1.19 3.2
* The diffusion coefficient for 35 C was calcu-lated by substituting experiment values in for-mula 1. The values of D at other temperatureswere obtained by correcting the value at 35 C forthe change in viscosity of water with tempera-ture.
[VOL. 7698
on February 7, 2018 by guest
http://jb.asm.org/
Dow
nloaded from
EFFECT OF INOCULUM SIZE ON ANTIBIOTIC ACTIVITY
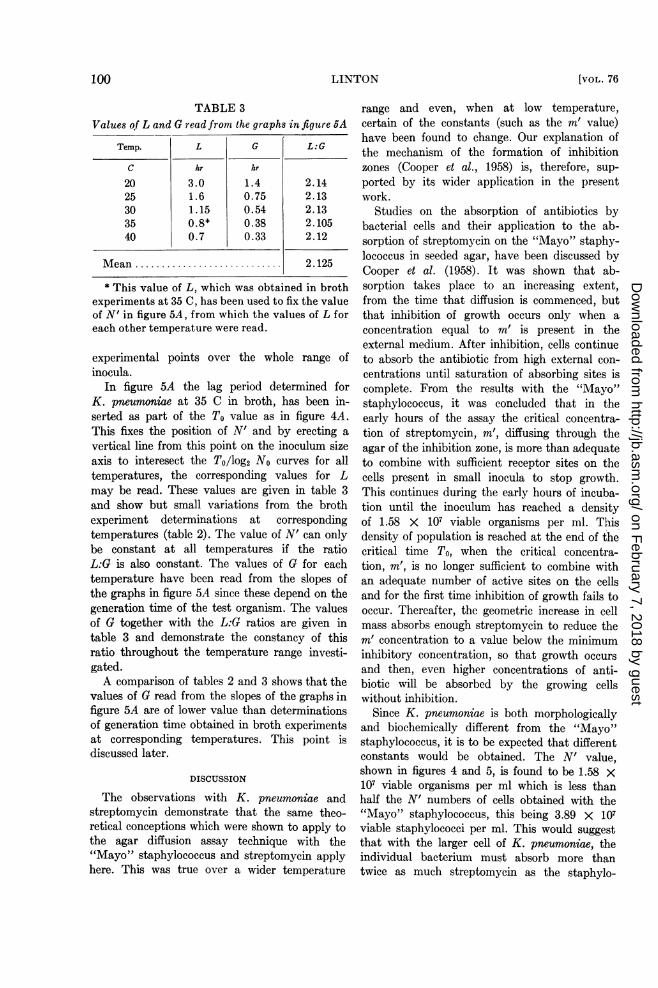
TABLE 2Generation time and lag period of Klebsiella
pneumoniae determined in broth atdifferent temperatures
Temp Lag Period Generation Time
C hr hr
20 3.3 1.625 1.65 0.8230 1.1 0.5535 0.8 0.4340 0.75 0.39
with each of three concentrations of the anti-biotic, are reduced to zero with the same inocu-lum (log2 No = 26) as in the To/log2 No graph(figure 4A). This value of No, which is inde-pendent of the concentration used, is the N" valueof the theoretical formula (6). The graphs infigure 4B are theoretical lines calculated bysubstituting the experimental values of To,mi', mO, D, No, and N" in formula (6), certainof the constants used being set out in table 1.The value of G used in this formula is the slopeof the graph in figure 4A, since this is dependentupon the generation time of the test organism insolid medium. Close agreement is seen betweenthe theoretical lines and the experimental points.The value of To has been shown to include
both the time taken for the inoculum to grow toa critical density and the lag period. Determina-tion of lag period in solid media is most difficultand so the generation time and lag period ofK. pneumoniae have been determined in brothunder conditions closely similar to those in thediffusion experiments. These results are set out intable 2. The lag period at 35 C obtained by thismethod has been inserted as part of the Tovalue in figure 4A and a vertical line is erectedfrom the point of intersection of the lag period on
the experimental curve and the inoculum sizeaxis. The value of No intersected by this verticalline, represents the critical population which,when developing from inocula smaller than N',at the end of the lag period is able to absorb thecritical concentration of antibiotic m' withoutshowing inhibition and therefore determines theposition of the zone edge. This value, which we
have called N', is shown to be log2 23.9 (i. e.,1.58 X 107 viable organisms per ml).
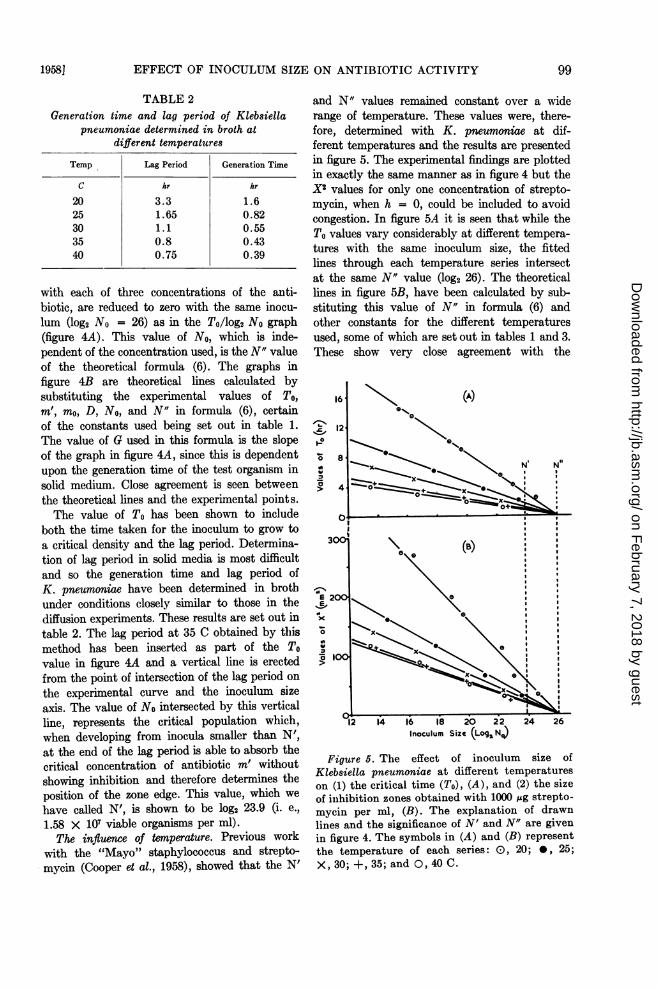
The influence of temnperature. Previous workwith the "Mayo" staphylococcus and strepto-mycin (Cooper et al., 1958), showed that the N'
and N" values remained constant over a widerange of temperature. These values were, there-fore, determined with K. pneumoniae at dif-ferent temperatures and the results are presentedin figure 5. The experimental findings are plottedin exactly the same manner as in figure 4 but theX2 values for only one concentration of strepto-mycin, when h = 0, could be included to avoidcongestion. In figure 5A it is seen that while theTo values vary considerably at different tempera-tures with the same inoculum size, the fittedlines through each temperature series intersectat the same N" value (log2 26). The theoreticallines in figure 5B, have been calculated by sub-stituting this value of N" in formula (6) andother constants for the different temperaturesused, some of which are set out in tables 1 and 3.These show very close agreement with the
16 (A)
12
d-0
(B)
E22JEW
41v S
Figure 6. The effect of inoculum size ofKlebsiella pneumoniae at different temperatureson (1) the critical time (To), (A), and (2) the sizeof inhibition zones obtained with 1000 ,ug strepto-mycin per ml, (B). The explanation of drawnlines and the significance of N' and N" are givenin figure 4. The symbols in (A) and (B) representthe temperature of each series: 0), 20; 0, 25;X, 30; +, 35; and 0, 40 C.
99
on February 7, 2018 by guest
http://jb.asm.org/
Dow
nloaded from
LINTON
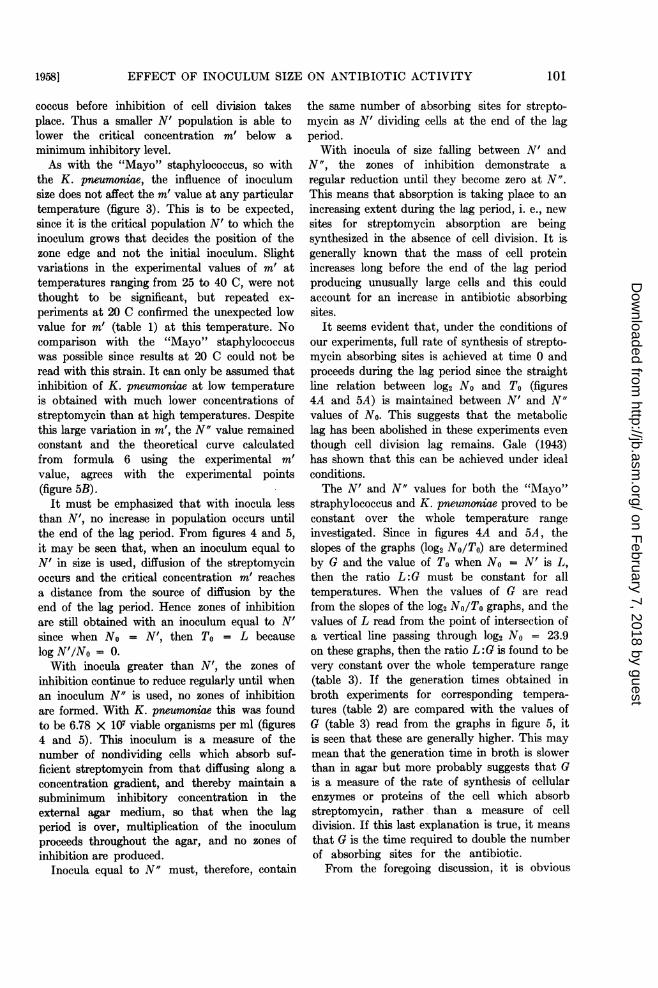
TABLE 3Values of L and G read from the graphs in figutre 5A
Temp. L G L:G
C hr hr
20 3.0 1.4 2.1425 1.6 0.75 2.1330 1.15 0.54 2.1335 0.8* 0.38 2.10540 0.7 0.33 2.12
Mean.2.125
* This value of L, which was obtained in brothexperiments at 35 C, has been used to fix the valueof N' in figure 5A, from which the values of L foreach other temperature were read.
experimental points over the whole range ofinocula.
In figure 5A the lag period determined forK. pneumoniae at 35 C in broth, has been in-serted as part of the To value as in figure 4A.This fixes the position of N' and by erecting avertical line from this point on the inoculum sizeaxis to interesect the To/log2 No curves for alltemperatures, the corresponding values for Lmay be read. These values are given in table 3and show but small variations from the brothexperiment determinations at correspondingtemperatures (table 2). The value of N' can onlybe constant at all temperatures if the ratioL:G is also constant. The values of G for eachtemperature have been read from the slopes ofthe graphs in figure 5A since these depend on thegeneration time of the test organism. The valuesof G together with the L:G ratios are given intable 3 and demonstrate the constancy of thisratio throughout the temperature range investi-gated.A comparison of tables 2 and 3 shows that the
values of G read from the slopes of the graphs infigure 5A are of lower value than determinationsof generation time obtained in broth experimentsat corresponding temperatures. This point isdiscussed later.
DISCUSSION
The observations with K. pneumoniae andstreptomycin demonstrate that the same theo-retical conceptions which were shown to apply tothe agar diffusion assay technique with the"Mayo" staphylococcus and streptomycin applyhere. This was true over a wider temperature
range and even, when at low temperature,certain of the constants (such as the m' value)have been found to change. Our explanation ofthe mechanism of the formation of inhibitionzones (Cooper et al., 1958) is, therefore, sup-ported by its wider application in the presentwork.
Studies on the absorption of antibiotics bybacterial cells and their application to the ab-sorption of streptomycin on the "Mayo" staphy-lococcus in seeded agar, have been discussed byCooper et al. (1958). It was shown that ab-sorption takes place to an increasing extent,from the time that diffusion is commenced, butthat inhibition of growth occurs only when aconcentration equal to m' is present in theexternal medium. After inhibition, cells continueto absorb the antibiotic from high external con-centrations until saturation of absorbing sites iscomplete. From the results with the "Mayo"staphylococcus, it was concluded that in theearly hours of the assay the critical concentra-tion of streptomycin, m', diffusing through theagar of the inhibition zone, is more than adequateto combine with sufficient receptor sites on thecells present in small inocula to stop growth.This continues during the early hours of incuba-tion until the inoculum has reached a densityof 1.58 X 10⁷ viable organisms per ml. Thisdensity of population is reached at the end of thecritical time To, when the critical concentra-tion, m', is no longer sufficient to combine withan adequate number of active sites on the cellsand for the first time inhibition of growth fails tooccur. Thereafter, the geometric increase in cellmass absorbs enough streptomycin to reduce them' concentration to a value below the minimuminhibitory concentration, so that growth occursand then, even higher concentrations of anti-biotic will be absorbed by the growing cellswithout inhibition.
Since K. pneumoniae is both morphologicallyand biochemically different from the "Mayo"staphylococcus, it is to be expected that differentconstants would be obtained. The N' value,shown in figures 4 and 5, is found to be 1.58 X10⁷ viable organisms per ml which is less thanhalf the N' numbers of cells obtained with the"Mayo" staphylococcus, this being 3.89 X 10⁷viable staphylococci per ml. This would suggestthat with the larger cell of K. pneumoniae, theindividual bacterium must absorb more thantwice as much streptomycin as the staphylo-
100 [VOL. 76
on February 7, 2018 by guest
http://jb.asm.org/
Dow
nloaded from
EFFECT OF INOCULUM SIZE ON ANTIBIOTIC ACTIVITY
coccus before inhibition of cell division takesplace. Thus a smaller N' population is able tolower the critical concentration m' below aminimum inhibitory level.As with the "Mayo" staphylococcus, so with
the K. pneumoniae, the influence of inoculumsize does not affect the m' value at any particulartemperature (figure 3). This is to be expected,since it is the critical population N' to which theinoculum grows that decides the position of thezone edge and not the initial inoculum. Slightvariations in the experimental values of m' attemperatures ranging from 25 to 40 C, were notthought to be significant, but repeated ex-periments at 20 C confirmed the unexpected lowvalue for m' (table 1) at this temperature. Nocomparison with the "Mayo" staphylococcuswas possible since results at 20 C could not beread with this strain. It can only be assumed thatinhibition of K. pneumoniae at low temperatureis obtained with much lower concentrations ofstreptomycin than at high temperatures. Despitethis large variation in m', the N" value remainedconstant and the theoretical curve calculatedfrom formula 6 using the experimental m'value, agrees with the experimental points(figure 5B).
It must be emphasized that with inocula lessthan N', no increase in population occurs untilthe end of the lag period. From figures 4 and 5,it may be seen that, when an inoculum equal toN' in size is used, diffusion of the streptomycinoccurs and the critical concentration m' reachesa distance from the source of diffusion by theend of the lag period. Hence zones of inhibitionare still obtained with an inoculum equal to N'since when No = N', then To = L becauselog N'/No = 0.With inocula greater than N', the zones of
inhibition continue to reduce regularly until whenan inoculum N" is used, no zones of inhibitionare formed. With K. pneumoniae this was foundto be 6.78 X 10⁷ viable organisms per ml (figures4 and 5). This inoculum is a measure of thenumber of nondividing cells which absorb suf-ficient streptomycin from that diffusing along aconcentration gradient, and thereby maintain asubminimum inhibitory concentration in theexternal agar medium, so that when the lagperiod is over, multiplication of the inoculumproceeds throughout the agar, and no zones ofinhibition are produced.
Inocula equal to N" must, therefore, contain
the same number of absorbing sites for strepto-mycin as N' dividing cells at the end of the lagperiod.With inocula of size falling between N' and
N", the zones of inhibition demonstrate aregular reduction until they become zero at N".This means that absorption is taking place to anincreasing extent during the lag period, i. e., newsites for streptomycin absorption are beingsynthesized in the absence of cell division. It isgenerally known that the mass of cell proteinincreases long before the end of the lag periodproducing unusually large cells and this couldaccount for an increase in antibiotic absorbingsites.
It seems evident that, under the conditions ofour experiments, full rate of synthesis of strepto-mycin absorbing sites is achieved at time 0 andproceeds during the lag period since the straightline relation between log2 No and To (figures4A and 5A) is maintained between N' and N"values of No. This suggests that the metaboliclag has been abolished in these experiments eventhough cell division lag remains. Gale (1943)has shown that this can be achieved under idealconditions.The N' and N" values for both the "Mayo'"
straphylococcus and K. pneunoniae proved to beconstant over the whole temperature rangeinvestigated. Since in figures 4A and 5A, theslopes of the graphs (log2 No/To) are determinedby G and the value of To when No = N' is L,then the ratio L:G must be constant for alltemperatures. When the values of G are readfrom the slopes of the log2 No/To graphs, and thevalues of L read from the point of intersection ofa vertical line passing through log2 No = 23.9on these graphs, then the ratio L:G is found to bevery constant over the whole temperature range(table 3). If the generation times obtained inbroth experiments for corresponding tempera-tures (table 2) are compared with the values ofG (table 3) read from the graphs in figure 5, itis seen that these are generally higher. This maymean that the generation time in broth is slowerthan in agar but more probably suggests that Gis a measure of the rate of synthesis of cellularenzymes or proteins of the cell which absorbstreptomycin, rather than a measure of celldivision. If this last explanation is true, it meansthat G is the time required to double the numberof absorbing sites for the antibiotic.From the foregoing discussion, it is obvious
101
on February 7, 2018 by guest
http://jb.asm.org/
Dow
nloaded from

LINTON
that adequate control of inoculum size in theassay of streptomycin, is of paramount im-portance. Many day to day variations and theneed for standard daily curves are, in part, due tovariations in inoculum size. When this is con-trolled, reproducible results may be obtained.
Similarly, the testing of the sensitivity ofstrains to antibiotics, also depends on thedensity of the inoculum. Strains of widelydiffering sensitivity can give zones of similar sizewhen a denser inoculum of the more sensitivestrain is used.The application of these considerations to
antibiotics other than streptomycin cannotnaturally be assumed without investigation.Work with penicillin in plate assays has shownsimilar results but experiments in deep tubes ofseeded agar have not proved possible, dueprobably to the influence of microaerophilicconditions and cell lysis by penicillin, on themode of action of this antibiotic. With chloram-phenicol, investigations in this laboratory haveshown deviations from the expected theoreticalresults due to a partial enzymic reduction of theantibiotic by growing cells. The density of theinoculum and the time of exposure of the chloram-phenicol to the growing cells during the formationof the inhibition zones markedly influenced theresults. This phenomenon of enzymic reductionby bacterial cells has been reported by Smith andWorrell (1949). Such a falling off in concentrationwith time would necessitate a dynamic variationof the constants in the formulae.
ACKNOWLEDGMENTS
The author wishes to express his deep gratitudeto Professor K. E. Cooper who for many yearshas stimulated research in this field. Thanks arealso due to my colleagues whose advice andencouragement have been invaluable, and toMr. H. J. Washer for kindly drawing the figures.
SUMMARY
The influence of both incubation temperatureand size of inoculum of Klebsiella pneumoniae,on the assay of streptomycin by the agar diffusiontechnique, has been investigated. The resultsobtained agree with the theoretical concept of themechanism of zone formation, as did previousresults with the "Mayo" staphylococcus and thesame antibiotic.
It has been shown that the zone edge is formed
at a point in time when a critical concentration ofstreptomycin, which is built up by diffusionthrough the agar, meets for the first time acritical density of organisms which have grownup from the original inoculum. For K. pneu-moniae this was found to be 1.58 X 10⁷ viableorganisms per ml. The time of occurrence varieswith the size of the inoculum used and the growthrate of the test organism. It is a measure of thetime required for the critical population to bereached. Until this population is reached, thecritical concentration of streptomycin is able toinhibit all the cells, but once the critical popu-lation of dividing cells has been reached, suf-ficient streptomycin is removed by adsorption onthe cells to reduce the concentration to a sub-minimal inhibitory level, and growth proceeds toform the zone edge.
Inocula somewhat larger than 1.58 X 10⁷organisms per ml still allow the formation ofinhibition zones due to diffusion of inhibitoryconcentration during the lag period. Thesezones are smaller than with inocula equal to1.58 X 107 organisms per ml since streptomycinis being increasingly absorbed during the lagperiod.With inocula equal to or greater than 6.78 X
107 organisms per ml no zones of inhibition wereformed. It is concluded that with populations ofthis density, sufficient absorbing sites are presentin the nondividing cell during the lag period tomaintain the level of diffusing antibiotic belowthe critical inhibitory level thus allowing fullgrowth at the end of the lag period.
REFERENCESCOOPER, K. E. 1955 Theory of antibiotic
inhibition zones in agar media. Nature,176, 510.
COOPER, K. E. AND GILLESPIE, W. A. 1952 Theinfluence of temperature on streptomycininhibition zones in agar cultures. J. Gen.Microbiol., 7, 1-7.
COOPER, K. E. AND LINTON, A. H. 1952 Theimportance of the temperature during theearly hours of incubation of agar plates inassays. J. Gen. Microbiol., 7, 8-17.
COOPER, K. E., LINTON, A. H., AND SEHGAL,S. N. 1958 The effect of inoculum size oninhibition zones in agar media using staphylo-cocci and streptomycin. J. Gen. Microbiol.,18, 670-687.
COOPER, K. E. AND WOODMAN, D. 1946 Thediffusion of antiseptics through agar gels,
102 [VOL. 76
on February 7, 2018 by guest
http://jb.asm.org/
Dow
nloaded from
EFFECT OF INOCULUM SIZE ON ANTIBIOTIC ACTIVITY
with special reference to the agar cup assay
method of estimating the activity of peni-cillin. J. Pathol. Bacteriol., 58, 75-84.
GALE, E. F. 1943 Factors influencing theenzymic activities of bacteria. Bacteriol.Revs., 7, 139-173.
LINTON, A. H. 1949 Action of antibiotics on
inhibition zones. M.Sc. Thesis, University ofBristol, England.
LINTON, A. H. 1954 Studies in the viability ofmicro-organisms. Ph.D. Thesis, University ofBristol, England.
LINTON, A. H. 1955 The relation betweengrowth rate of different bacteria and the for-
mation of antibiotic inhibition zones. J.Gen. Microbiol., 13, Proc., viii.
MILES, A. A. AND MISRA, S. S. 1938 The esti-mation of the bactericidal power of blood.J. Hyg., 38, 732-749.
MITCHISON, D. A. AND SPICER, C. C. 1949 Amethod of estimating Streptomycin in serum
and other body fluids by diffusion throughagar enclosed in glass tubes. J. Gen. Micro-biol., 3, 184-203.
SMITH, G. N. AND WORREL, C. S. 1949 Enzymicreduction of chloramphenicol (chloromycetin).Arch. Biochem., 24, 216-223.
103
on February 7, 2018 by guest
http://jb.asm.org/
Dow
nloaded from