influence of in-vessel pressure and corium melt properties
TRANSCRIPT

TRITA-FYS 2013:44 ISSN 0280-316X
ISRN KTH/FYS/--13:44—SE
Master Of Science Thesis
Influence of In-vessel Pressure and Corium
Melt Properties on Global Vessel Wall
Failure of Nordic-type BWRs
Andrei Goronovski
Division of Nuclear Power Safety
Royal Institute of Technology Stockholm 2013

II

III
Abstract
The goal of the present study is to investigate the effect of different scenarios of core
degradation in a Nordic-type BWR (boiling water reactor) on the reactor pressure vessel
failure mode and timing. Specifically we consider the effects of (i) in-vessel pressure, (ii) melt
properties. Control rod guide tube (CRGT) cooling and cooling of the debris from the top are
considered as severe accident management (SAM) measures in this study. We also consider
the question about minimal amount of debris that can be retained inside the reactor pressure
vessel (RPV).
Analysis is carried out with coupled (i) Phase-change Effective Convectivity (PECM) model
implemented in Fluent for prediction of the debris and melt pool heat transfer, and (ii)
structural model of the RPV lower head implemented in ANSYS for simulation of thermo-
mechanical creep. The coupling is done through transient thermal load predicted by PECM
and applied as a boundary condition in ANSYS analysis.
Results of the analysis suggest that applying only CRGT and top cooling is insufficient for
maintaining vessel integrity with 0.4 m deep (~12 tons) corium melt pool. The failure of the
vessel by thermally induced creep can be expected starting from 5.3 h after the dryout of the
debris bed in the lower plenum. However, earlier failure of the instrumentation guide tubes
(IGTs) is possible due to melting of the nozzle welding.
The internal pressure in the vessel in the range between 3 to 60 bars has no significant
influence on the mode and location of the global RPV wall failure. However, depressurization
of the vessel can delay RPV wall failure by 46 min for 0.7 m (~ 30 tons) and by 24 min for
1.9 m (~ 200 tons) debris bed. For 0.7 m pool case, changes in vessel pressure from 3 to
60 bars caused changes in liquid melt mass and superheat from ~18 tons at 180 K to ~13 tons
at 100 K superheat, respectively. The same changes in pressure for 1.9 m case caused changes
in liquid melt mass and superheat from ~40 tons at 42 K to ~10 tons at about 8 K superheat,
respectively.
Investigation of the influence of melt pool properties on the mode and timing of the vessel
failure suggest that the thermo-mechanical creep behavior is most sensitive to the thermal
conductivity of solid debris. Both vessel wall and IGT failure timing is strongly dependent on
this parameter. For given thermal conductivity of solid debris, an increase in Tsolidus or Tliquidus
generally leads to a decrease in liquid melt mass and superheat at the moment of vessel wall
failure. Applying models for effective thermal conductivity of porous debris helps to further
reduce uncertainty in assessment of the vessel failure and melt ejection mode and timing.
Only in an extreme case with Tsolidus, Tliquidus range larger than 600 K, with thermal
conductivity of solid 0.5 W∙m-1
∙K-1
and thermal conductivity of liquid melt 20 W∙m-1
∙K-1
, a
noticeable vessel wall ablation and melting of the crust on the wall surface was observed.
However, the failure was still caused by creep strain and the location of the failure remained
similar to other considered cases.

IV

V
Acknowledgements
Current research project has been performed at the Nuclear Power Safety department at Royal
Institute of Technology (Kungliga Tekniska Högskolan (KTH), Stockholm) under supervision
of Professor Pavel Kudinov and co-supervision of Dr. Walter Villanueva. The work is
supported by the Swedish Nuclear Radiation Protection Authority (SSM), Swedish Power
Companies, European Commission (SARNET-2), Nordic Nuclear Safety Program (NKS),
and Swiss Federal Nuclear Safety Inspectorate (ENSI) under the APRI- MSWI program at the
Royal Institute of Technology (KTH), Stockholm, Sweden.
I would like to express my great appreciation to every person at the department for creating
great work environment and friendly atmosphere. I really enjoyed the time spent at the office
working on the Master thesis.
I am particularly grateful for my supervisor Professor P. Kudinov and co-supervisor Dr. W.
Villanueva for their patient guidance and constructive criticism of my research work. I would
also like to express special thanks for PhD students Kaspar Kööp and Marti Jeltsov for their
constant willingness to aid and to give a valuable advice.
Special thanks should be given to Professor Sevostian Bechta, for the great insight and
valuable notes on the analytical models for predicting effective thermal conductivity of
particulate beds.
Last but not least, I would like to thank my parents who have trusted in me and have been
supporting me for my whole life.

VI
VII
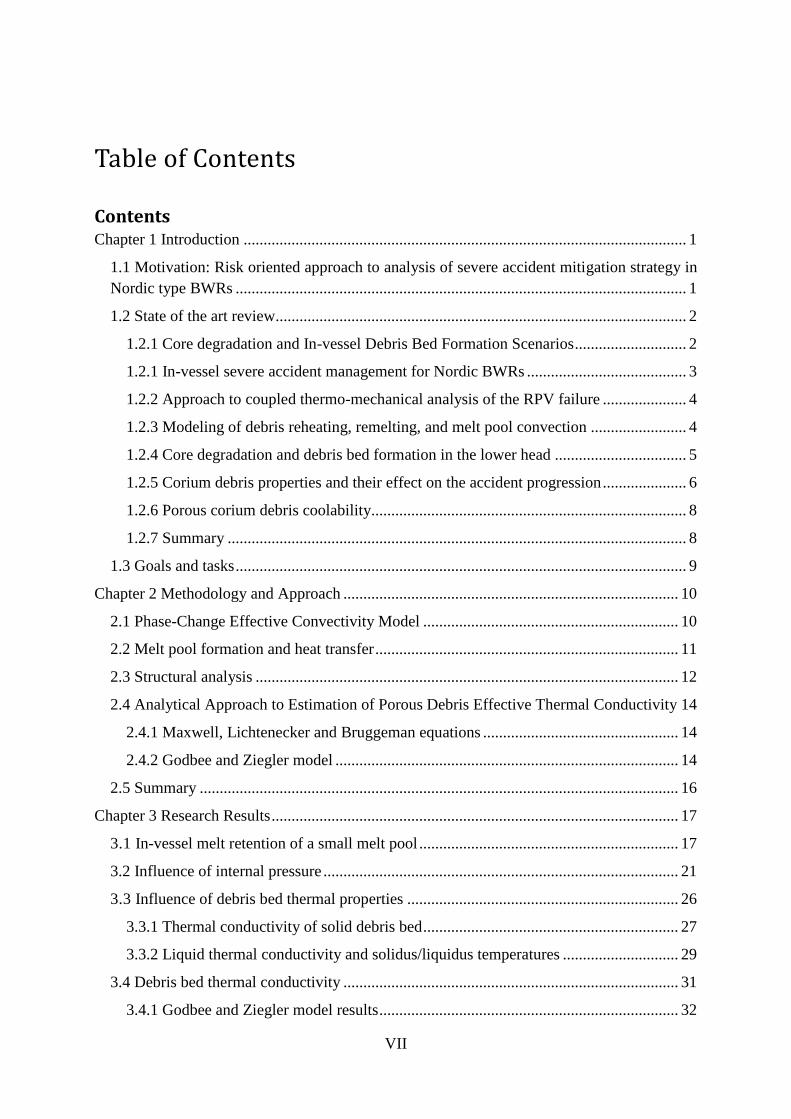
Table of Contents
Contents Chapter 1 Introduction ............................................................................................................... 1
1.1 Motivation: Risk oriented approach to analysis of severe accident mitigation strategy in
Nordic type BWRs ................................................................................................................. 1
1.2 State of the art review ....................................................................................................... 2
1.2.1 Core degradation and In-vessel Debris Bed Formation Scenarios ............................ 2
1.2.1 In-vessel severe accident management for Nordic BWRs ........................................ 3
1.2.2 Approach to coupled thermo-mechanical analysis of the RPV failure ..................... 4
1.2.3 Modeling of debris reheating, remelting, and melt pool convection ........................ 4
1.2.4 Core degradation and debris bed formation in the lower head ................................. 5
1.2.5 Corium debris properties and their effect on the accident progression ..................... 6
1.2.6 Porous corium debris coolability ............................................................................... 8
1.2.7 Summary ................................................................................................................... 8
1.3 Goals and tasks ................................................................................................................. 9
Chapter 2 Methodology and Approach .................................................................................... 10
2.1 Phase-Change Effective Convectivity Model ................................................................ 10
2.2 Melt pool formation and heat transfer ............................................................................ 11
2.3 Structural analysis .......................................................................................................... 12
2.4 Analytical Approach to Estimation of Porous Debris Effective Thermal Conductivity 14
2.4.1 Maxwell, Lichtenecker and Bruggeman equations ................................................. 14
2.4.2 Godbee and Ziegler model ...................................................................................... 14
2.5 Summary ........................................................................................................................ 16
Chapter 3 Research Results ...................................................................................................... 17
3.1 In-vessel melt retention of a small melt pool ................................................................. 17
3.2 Influence of internal pressure ......................................................................................... 21
3.3 Influence of debris bed thermal properties .................................................................... 26
3.3.1 Thermal conductivity of solid debris bed ................................................................ 27
3.3.2 Liquid thermal conductivity and solidus/liquidus temperatures ............................. 29
3.4 Debris bed thermal conductivity .................................................................................... 31
3.4.1 Godbee and Ziegler model results ........................................................................... 32

VIII
3.4.2 Conclusions ............................................................................................................. 35
3.5 Results of analysis with variable thermal conductivity .................................................. 36
3.5.1 Summary ................................................................................................................. 38
Chapter 4 Conclusions and Recommendations ........................................................................ 39
4.1 Conclusions .................................................................................................................... 39
4.2 Discussion ...................................................................................................................... 41
4.3 Outlook ........................................................................................................................... 41
List of References ..................................................................................................................... 42
List of Figures
Figure 1.1: BWR pressure vessel lower head schematic image (proceedings of MSWI-35) .... 3
Figure 2.1: Melt mass fraction and temperature, pool height is 0.7 m ..................................... 11
Figure 2.2: Melt mass fraction and temperature, pool height is 1.9 m. .................................... 11
Figure 2.3: ANSYS creep model validation ............................................................................. 12
Figure 2.4: 2D axisymmetric model of a Nordic design BWR. ............................................... 13
Figure 2.5: Restructured unit cell volume in Godbee and Ziegler model ................................ 15
Figure 3.1: Vessel wall temperature at the time, 20 % creep strain is reached (5.3 h) ............ 17
Figure 3.2: Von Mises creep strains and vessel wall axial displacements at times, when 20 %
and 45 % creep strains are reached .......................................................................................... 18
Figure 3.3: Debris temperature and melt mass fraction at t = 5.3 h. ........................................ 18
Figure 3.4: Welding material temperature of the IGT, closest to the vessel centerline. .......... 19
Figure 3.5: Maximum vertical displacement of the RPV centerline f. .................................... 20
Figure 3.6: RPV wall deformations and corresponding equivalent strains H = 0.7 m............. 22
Figure 3.7: RPV wall deformations and corresponding equivalent strains H = 1.9 m............. 23
Figure 3.8: Maximum vertical displacement of the RPV centerline ........................................ 24
Figure 3.9: Maximum values of wall equivalent creep strain temperature. ............................. 26
Figure 3.10: Vessel wall deformations in and melt fraction .................................................... 27
Figure 3.11: Failure timing of vessel wall and IGT. ................................................................ 28
Figure 3.13: Time history for the IGT welding point closest to RPV center bottom. .............. 29
Figure 3.14: Vessel wall failure timing plotted against debris liquidus thermal conductivity,
debris solidus temperature and debris liquidus temperature. ................................................... 30
Figure 3.15: Region of possible melt mass and superheat at the time of vessel failure. .......... 31
Figure 3.16: Cumulative weight distribution of debris bed particles sizes from FARO
experiment. ............................................................................................................................... 33
Figure 3.17: UO2 thermal properties (a) conductivity and (b) emissivity as a function of
temperature. .............................................................................................................................. 33
Figure 3.18: Effective thermal conductivity predicted with Godbee and Ziegler model ......... 34
Figure 3.19: Effective thermal conductivity of the debris bed for 3 mean particle sizes. ........ 35

IX
Figure 3.20: Effective thermal conductivity of UO2, pure Zircaloy and completely oxidized
zirconium beds. ........................................................................................................................ 35
Figure 3.21: Mass-averaged effective thermal conductivity evolution as a function of time for
three cases, calculated in FLUENT. ......................................................................................... 37
Figure 3.22: 3 cases with applied with effective thermal conductivity applied as a function of
time ........................................................................................................................................... 37

X
List of Tables
Table 1: ABB- Atom reactor main core materials’ masses and thermal conductivities ............ 7
Table 2: Maximum wall displacement, melt mass fraction and superheat 0.7 m debris bed. .. 21
Table 3: Maximum wall displacement, melt mass fraction and superheat 1.9 m debris bed. .. 24
Table 4: Two model predictions of effective thermal conductivity. ........................................ 32
Table 5: Comparison of results with constant and variable effective thermal conductivity of
solid debris ............................................................................................................................... 36

XI
List of Publications
1. A. Goronovski, W. Villanueva, C.-T. Tran and P. Kudinov, “The effect of internal
pressure and debris thermal properties on BWR lower head failure mode and timing”,
Proceedings of The 15th International Topical Meeting on Nuclear Reactor Thermal-
Hydraulics (NURETH-15), Pisa, Italy, May 12-17, NURETH15-500, 2013.

XII
Nomenclature
Latin
a Shape factor in Godbee and Ziegler model
B Stefan Boltzmann constant, [W∙m-2
∙K-4
]
Dp Particle mean size, [m]
fi Material mass fraction
H Melt pool height, [m]
ke Effective thermal conductivity, [W∙m-1
∙K-1
]
kg Thermal conductivity of gaseous phase, [W∙m-1
∙K-1
]
Thermal conductivity of bulk gas, [W∙m
-1∙K
-1]
ki Individual material thermal conductivity in MELCOR, [W∙m-1
∙K-1
]
kliquid Thermal conductivity of liquid phase, [W∙m-1
∙K-1
]
kr Radiative thermal conductivity, [W∙m-1
∙K-1
]
ks (ksolid) Thermal conductivity of solid phase, [W∙m-1
∙K-1
]
Nu Nusselt number
Ra Rayleigh number
S Cross-sectional area of gas solid path in Godbee and Ziegler model, [m2]
t Time, [s]
T Temperature, [K]
Tliquidus Material liquidus temperature, [K]
Tsolidus Material solidus temperature, [K]
U Characteristic velocity, [m∙s-1
]
X Length of a cell in Godbee and Ziegler model, [m]
Greek
α Thermal diffusivity, [m2∙s
-1]
ε Material thermal emissivity
εcr Equivalent creep strain, [%]
σ Equivalent stress, [Pa]
Φ Material porosity (fraction of continuous phase)

XIII
I. List of Acronyms
ADS Automatic Depressurization System
APRI Accident Phenomena of Risk Importance
BWR Boiling Water Reactor
CFD Computational Fluid Dynamics
CRGT Control Rod Guide Tube
IGT Instrumentation Guide Tube
IVMR In-Vessel Melt Retention
FCI Fuel Coolant Interaction
LWR Light Water Reactor
NPP Nuclear Power Plant
PSA Probabilistic Safety Analysis
PECM Phase-change Effective Convectivity Model
ROAAM Risk Oriented Accident Analysis Method
RPV Reactor Pressure Vessel
SAM Severe Accident Management
SBO Station Black Out

1
Chapter 1 Introduction
1.1 Motivation: Risk oriented approach to analysis of severe
accident mitigation strategy in Nordic-type BWRs
New design requirements to nuclear power reactors essentially demand long term melt
retention within the containment, without any significant fission product release into the
environment in case of a severe accident. The problem is that for the next decades we are
going to rely on generation of reactors, developed before modern safety approaches appeared.
This is the reason why we are aiming at a sophisticated task to improve the design of already
built reactors.
The possibility of ex-vessel melt retention is considered as an ultimate SAM strategy in
Nordic-type BWRs. Establishing a deep subcooled water pool in the lower drywell is
expected to provide conditions for melt fragmentation and long term coolability of the formed
debris bed. However, the exact properties of formed debris bed and possibility of having
energetic steam explosion is significantly dependent on the vessel failure modes. The
possibility of having energetic steam explosion and the properties affecting the coolability of
debris bed are considered highly dependent on vessel failure mechanics (mainly rupture size
and location, failure timing, ejected melt mass and superheat). Therefore there is a significant
interest in clarifying vessel failure mechanics and melt ejection scenarios in order to connect
core damage and relocation modes and timing with vessel failure modes and timing taking
into account SAM measures. It is clear that both scenarios of accident progression and
phenomena of molten core materials interactions with the structures and the coolant are
important sources of uncertainty.
The current research is performed as a part of 8th
Accident Phenomena of Risk Importance
(APRI-8) project. The global goal of the project is to develop risk assessment approach for a
Nordic-type BWRs using the integrated Risk Oriented Accident Analysis Methodology
(ROAAM [1]), which would allow to deal with both epistemic (modeling) and aleatory
(scenario) uncertainties. ROAAM is aimed to balance in between prevention and mitigation
of containment treating phenomena. The benefit of the approach compared with PSA is the
ability to deal with phenomenological and modeling uncertainties.
Current work contributes to development of phenomenological models as ‘building blocks’
necessary for development of the ROAAM frameworks. Specifically dependencies of the
vessel failure mode and timing on the uncertain parameters of scenario (debris properties, in-
vessel pressure, SAM, etc.) are of primary concern.

2
1.2 State of the art review
Most of the work related to Nordic BWR severe accident phenomena was done in the
framework of the APRI projects [2], [3]. Significant progress in the understanding of severe
accident phenomena has been obtained, yet, sources of significant uncertainties still remain.
Considerable efforts were devoted to development of the tools (coupled PECM model,
ANSYS structural creep model, and RELAP) for investigation of the in-vessel stage of the
accident. Below we provide a more detailed overview of the state-of-the-art in order to
identify gaps in knowledge and to formulate research tasks for this work.
1.2.1 Core degradation and in-vessel debris bed formation scenarios
An experimental study named XR2-1 [4] has been performed as a part of integrated BWR
severe accident analysis in order to clarify core material relocation to the vessel lower head
following a severe accident. Based on the RPV depressurization, two sets of conditions within
the core were predicted ‘wet’ and ‘dry core’. In the first scenario the system is still under high
pressure. Presence of a large amount of water in the lower plenum is expected to lead to a
resolidification of the molten material in the lower region of the core and blockage of the flow
channels for the melt. Subsequent core melting will lead to formation of a large molten pool
in the core region. Eventually the formed and superheated corium will be ejected to the lower
plenum. That type of scenario has been observed in the TMI-2 accident.
Another possible sequence, namely ‘dry core’ was proposed and then supported
experimentally [4]. This failure mode is expected to happen in case the RPV is depressurized.
A continuous drainage of the molten material will take place if there is no formation of stable
crust or blockages of the flow path for the melt. In this case the debris bed will consist of
strongly marked separate layers- metallic part on the bottom and ceramic debris layer on top.
The high pressure ‘wet core’ scenario is considered unlikely to happen in Nordic BWRs as
the latest plant modifications provide highly reliable systems for depressurization of the
vessel. Yet, the timing of the vessel depressurization remains uncertain and the possible
effects of such a delay on vessel failure mode need to be addressed.
It is possible to perform a lumped parameter analysis with MELCOR system code [5] in order
to simulate core degradation stage and to predict debris bed composition and to reduce
uncertainties arising from this severe accident stage. The code allows to consider the effects
of system dynamics and accident progression on melt pool properties and to include
interaction with other safety systems (ECCS, ADS, etc.). This step is essential for further in-
vessel melt pool behavior analysis.

3
1.2.1 In-vessel severe accident management for Nordic BWRs
One of the first large-scale research projects which addressed melt pool behavior, thermal
loads applied on the RPV and possible location of wall failure was motivated by the idea of
IVMR [6]. The in-vessel melt retention (IVMR) concept is an innovative and promising SAM
strategy in reactor design since it allows preserving the fission products inside the vessel. This
concept was first applied in Loviisa VVER-440 and in the design of AP-600, AP-1000
reactors. The goal was to use external vessel flooding for a long term corium cooling.
Bounding scenarios assessment and sensitivity studies were performed to depict the failure
boundaries. As a conclusion lower head failure was considered ‘physically unreasonable’ for
the studied reactor designs.
However implementation of IVMR for Nordic-type BWRs was abandoned as unfeasible due
to design-specific factors. It was found that removing vessel insulation and filling cavity with
water up to the vessel level cannot be completed in time. Another problem that might be
expected is related to the complex geometry of the BWR lower head (Figure 1.1). A forest of
penetrations is a source of additional uncertainties in the analysis of possible failure modes.
Even if the cooling capacities are sufficient to avoid vessel wall creep and to prevent debris
from constant reheating, the temperatures inside the lower head might be high enough for
penetration (IGTs or CRGTs, or recirculation pump) nozzles to be melted providing a flow
path for melt release from the vessel.
Figure 1.1: BWR pressure vessel lower head schematic image (proceedings of MSWI-35).
CRGTs can be cooled from inside by water flow which can also provide a source of coolant
into the reactor vessel for cooling of the debris from the top. In total 169 tubes in the vessel
lower head provide significant heat transfer area for volumetric cooling of the debris. Thus
there is a potential for using CRGT cooling as in-vessel severe accident mitigation strategy.
Recirculation pump nozzles
CRGT nozzles IGT nozzles

4
Nominal CRGT flow rate (in total ~10kg/s) can be provided in case of station blackout (SBO)
event if independent power supply and water source will be implemented.
1.2.2 Approach to coupled thermo-mechanical analysis of the RPV failure
Consideration of RPV failure requires coupled thermo-mechanical analysis where thermal
loads from the natural convection in the volumetrically heated melt pool are used as loads in
vessel structural integrity analysis.
Coupled thermo-mechanical creep analysis of the RPV lower head was first carried out by
Willschuetz et al. [7]. The goal was to predict the location and timing of vessel wall failure
due to loads applied by internally heated melt pool. The thermal part of the model was
calculated with Effective Conduction Convection Model (ECCM) [8] which was then coupled
with model implemented using finite element ANSYS code.
The analysis was performed for FOREVER test series, a 1:10 scaled experiments conducted
for the PWR lower head at KTH. One of the main conclusions was that the thermal load effect
is dominant in terms of failure timing, while the melt mass load was found to have negligible
effect.
The model by Willschuetz et al. [7] was developed for analysis of PWR vessel failure and
validated against high-pressure scenarios and thus cannot be directly applied in this work. The
most important limitation however is a 2D nature of ECCM which cannot resolve complex
geometry of the BWR lower head with cooled CRGTs. In this work coupled thermo-
mechanical analysis for the BWR vessel lower head is performed using Phase-change
Effective Convectivity (PECM) model developed by Tran and Dinh [9]. The PECM is
capable of resolving 3D melt pool heat transfer and has been extensively validated [10].
1.2.3 Modeling of debris reheating, remelting, and melt pool convection
Addressing aleatory (scenario) and epistemic (modeling) uncertainties requires parametric
studies and thus computationally efficient methods. Natural turbulent convection in a
volumetrically heated oxidic corium melt pool is characterized by high Rayleigh numbers
which might exceed 1015
[6]. Modeling of such problem with Computational Fluid Dynamics
(CFD) would require unaffordable computational costs. Therefore alternative simplified
models for analysis melt pool convection have been under development for some time.
The Effective Convectivity Conductivity Model (ECCM) was introduced by Bui and Dinh
[8]. Characteristic correlations for heat transfer in upward and downward directions were
applied to model convective terms in the energy balance equation, thus eliminating the need
to solve the complete Navier-Stokes equations.
Following the concept of effective convectivity introduced in ECCM, Tran and Dinh [9], [11]
developed Effective Convectivity Model (ECM). Characteristic velocities were applied to

5
simulate the effects of heat transfer towards cooled boundaries. An important step was
development of Phase-change ECM (PECM) model [12] which takes into account non-
eutectic solidification and melting phenomena which are important for the melt pool heat
transfer and interactions with cooled surfaces.
Based on the dual tier validation of the model- the results were compared with CFD
calculations and available experimental data, the PECM was considered [13] to be a reliable
and computationally efficient tool for long term melt pool transient simulation.
Main results of the previous works on Nordic BWR vessel lower head failure analysis can be
summarized as follows [14], [15], [16]:
Only CRGT cooling is insufficient to retain melt in the vessel in case the debris bed
height inside the lower plenum is above 0.7 m.
RPV integrity can be preserved if external vessel cooling is applied in addition to
CRGT cooling just before creep acceleration starts. However, implementation of ex-
vessel cooling in time would require significant changes in the plants.
Thermo-mechanical analysis revealed that vessel failure happened due to thermally
induced creep before wall melting temperature was reached. Two different vessel
failure modes were determined, namely (i) ‘ballooning’ failure mode with creep
strains distributed in the lower section of the vessel that is covered by melt pool and
with maximum deformation in the vicinity of the vessel bottom, and (ii) ‘localized-
creep’ failure mode with creep strains and maximum deformations concentrated in the
vicinity of the uppermost region of the melt pool. Transition from ballooning to
localized failure was observed if melt pool depth increases above 1.1 m.
Analysis of IGT failure suggested that IGT can fail before global vessel failure [15]. It
was suggested to consider a possibility of the IGT clamping inside the nozzle due to
closure of the gap between IGT housing and the flow limiter. A study carried out by
Villanueva et al. [15] has demonstrated that IGTs located closest to the vessel
centerline are not clamped the entire time of the transient and thus IGT ejection might
be a dominant vessel failure mode.
1.2.4 Core degradation and debris bed formation in the lower head
During molten corium relocation to the reactor lower head the melt is expected to quench and
a fraction or even all the relocated material will be fragmented into debris which will form a
porous debris bed. The knowledge regarding the size and shape of formed particles is
important for predicting thermo-mechanical properties of the debris bed (such as effective
thermal conductivity) for further analysis of reheating and remelting of the debris. Several
experimental studies with prototypic and simulant corium melt mixtures done in the past can
be used to assess the ranges of uncertainties in the properties of the debris bed.
Many fuel-coolant interaction (FCI) experiments were carried out in the past with primary
goal to study the corium-water explosive interactions. Such facilities as FARO, KROTOS

6
[17] and TROI [18] have been used for many years for tests with prototypic corium melt
mixtures with masses from 3 – 177 kg of UO2-ZrO2-(Zr). The visual inspections of the
formed debris bed showed that in most of the experiments bottom part of the bed consisted of
tightly packed spongy structures- ‘cake’, while the rest of the corium debris was well
fragmented. The averaged sizes of the loose particles were in the range between 2.6 and
4.8 mm regardless of the test conditions.
Debris Bed Formation (DEFOR-S and DEFOR-A [19], [20], [21]) was the first systematic
experimental study of the debris bed formation phenomena in a relatively deep pool. The tests
were carried out with corium simulant materials (eutectic and non-eutectic). Pouring and
Underwater Liquid Melt Spreading (PULiMS-E [22], [23]) test campaign was done with
similar to DEFOR conditions but with much shallower (0.2 m) water pool. Results of the
DEFOR and PULiMS experiments provide data about melt jet fragmentation and debris
particle formation, liquid melt spreading, debris bed formation and agglomeration.
Quantitative analysis of debris porosity and particle size distribution were carried out.
The obtained fragmented particles’ shapes were found to be dependent on the water
subcooling. Results showed sharp edged elements at high water subcooling and roughened
ones with high internal porosity at medium or low subcooling. At temperatures close to
coolant saturation, obtained fragments looked like droplets with smooth surface. Large
internal pores were found to be fully or partially encapsulated.
The findings from the tests with prototypic mixtures and corium simulant materials suggest
that the porosity of fragmented debris bed can be from ~45 to 70 % in the beds where particle
agglomeration is not observed. In case of ‘cake’ formation or massive agglomeration the
porosity can be significantly lower ~30 %.
1.2.5 Corium debris properties and their effect on the accident
progression
Debris reheating, re-melting, melt pool heat transfer and interactions with the vessel are
determined (among other factors) by the properties of the debris material. Previously the
influence of the melt properties on melt pool convection was studied in [13] and [24]. It was
found that melt pool formation and heat transfer characteristics (both local and integral) are
dependent on the corium material properties (liquid melt and solid debris thermal
conductivities and melting range). However, the influence of the parameters on the vessel
failure modes has not been clarified.
It is important to assess the uncertainties arising from the melt composition and resulting
thermo-physical properties of the debris. Due to the large uncertainties in the (i) scenarios
leading to specific debris compositions and configurations of the bed, and (ii) phenomena
relevant to the effective properties of the debris, it is impractical to start with development of
elaborated models for prediction of the properties. Instead a sensitivity analysis is to be
performed first to identify the most influential parameters. Specifically the influence of

7
solidus/liquidus temperatures and liquid/solid phase thermal conductivities on the failure
mode and timing of Nordic-type BWR vessel are to be determined. For the sensitivity
analysis it is important to assess the ranges of the parameters.
During reactor core degradation complex thermo-physical-chemical interactions between core
materials take place. For instance, UO2 pellets can be partially dissolved in Zr-ZrOx liquid
phase. The resulting high temperature mixture of materials is called corium. The corium
attacks vessel structures, melting them down to form even more complex mixtures consisting
mainly of uranium, zirconium, oxygen, iron, boron and carbon [25].
The masses of the main components of corium for the ABB design of a BWR and
corresponding thermal conductivities of the materials are presented in Table 1.
Table 1: ABB- Atom reactor main core materials’ masses and thermal conductivities (reactor
thermal power of 3300 MW).
Internal reactor material UO2 Zircaloy ZrO2 Stainless Steel
Mass, tons [24] 146 53 71.61 172
Thermal conductivity,
W∙m-1
∙K-1
[26] 2 - 6 12.6 - 41.8 1.69 - 2.01 13.25 - 40
2
1Mass of completely oxidized zirconium.
2Type 304SS, correlation fitting in the range of 300- 1671 K.
Melting temperatures and thermal conductivities of corium prepared from UO2 and Zircaloy-2
have been recently studied by Kato et al. [27]. Three specimens were produced with different
atomic weights and oxidation level of Zirconium. Resulting corium properties were measured
in the temperature range between 673-1873 K. No significant influence of the temperature on
thermal conductivity was observed. Measured values vary in the range of 1.5-3.5 W∙m-1
∙K-1
depending on the Zr content. Specimen melting temperatures were measured by thermal arrest
method. Tsolidus changed in the range 2782-2895 K and the measured Tliquidus were up to 100 K
above that. Presence of steel, fission products and boron carbide can further enlarge the
melting region.
Prototypic corium composition would be more complex than that studied by Kato. A metallic
alloy specimen comprising of (U, Zr, Fe, C, O) with rather high Fe content (~77.6%) was
experimentally analyzed in the MASCA tests [28]. Several measurements were performed at
low temperatures 357-489 K. The averaged measured thermal conductivity between all tests
was 13.53 W∙m-1
∙K-1
. The high value is explained by the large concentration of iron in the
specimen.
Slightly lower values of 8-12 W∙m-1
∙K-1
with the fraction of molten steel around 30 % are
predicted by severe accident code MELCOR [4] according to the following formula
∑
(1)
where, ke is the effective thermal conductivity, ki and fi are material individual conductivities
and mass fractions.

8
It is instructive to note that presented above values of thermal conductivity were measured or
assessed for solid specimens having different material compositions. Kato did tests with UO2-
Zr dust sintered into high density pellets in steam environment. In the MASCA program, the
measurements were performed for an alloy with specific material composition. In MELCOR
simple relation (equation 1) between individual thermal conductivities of the materials, and
corresponding mass fractions was applied.
As it was previously discussed, during ejection to the lower plenum, melt is expected to
fragment and to form porous debris bed. The porosity of the formed bed is expected to affect
the effective thermal conductivity. In order to take this effect into account a linear dependence
between debris void fraction and normalized thermal conductivity for UO2 fuel is proposed by
Nikolopoulos [29]. The predicted values of thermal conductivity match well experimental
data for porosities up to 20 %. Unfortunately these results might not be directly applicable for
the debris bed formed during FCI. For example, experimental study as a part of LIVE
program [30] reports significant reduction of thermal conductivity (2-3 times) for the crust
layer consisting of non-eutectic materials. In the ‘cake’ part of the debris bed internal porosity
can be up to 35 % [20], [21]. In case of the well fragmented debris bed void fraction can be
even larger (45-70% [19]). Experimental measurements show that effective thermal
conductivities of a packed bed consisting of oxidic particles can be reduced an order of
magnitude [31] if the porosity is around 40 %.
Discussed above findings provide sufficient information for the order-of-magnitude
assessments to be used in sensitivity analysis carried out in this work.
1.2.6 Porous corium debris coolability
An experimental data is used as an input for DECOSIM code, a code developed for
investigating particle debris coolability. A ‘Load versus Capacity’ approach is used which
evaluates possibility of removing decay heat by water evaporation. The aim is to find
conditions under which local dryout heat flux occurs, which is considered as a conservative
criterion for debris coolability. Latest presented results [32] show the sensitivity of the system
to uncertainties in the input parameters and predict debris bed dryout probabilities. As a
conclusion author emphasizes importance for further clarifying debris particle size
distribution and possible ranges of the slope angle.
1.2.7 Summary
The in-vessel stage of a severe accident was stressed as the key for analyzing possible melt
ejection modes and providing robust input for ex-vessel severe accident phase modeling.
Thermo-mechanical properties of the debris bed in the lower head have significant influence
on the accident progression. Unfortunately, there is no systematic study up-to-date which

9
could clarify quantitative or even qualitative dependencies of the melt ejection mode and
timing in a Nordic BWR on the properties of the debris.
In the remote scenario of core degradation at high pressure it is important to understand the
influence of higher pressure on the vessel failure mode and timing.
According to previously performed analysis for Nordic BWR, vessel integrity cannot be
established for 0.7 m deep melt pool. Thus it is important to investigate if smaller masses of
the melt can be retained inside the vessel in case of application of CRGT and top debris
cooling.
1.3 Goals and tasks
Based on the state of the art review the following goal was formulated for this work:
To assess the influence on the vessel failure mode and timing in case of:
1. A small amount of debris (0.4 m deep melt pool).
2. Higher pressures inside the vessel.
3. Variable thermo-mechanical properties of the debris bed and melt pool.
In order to achieve the goals, the following tasks have been formulated:
1. Apply coupled thermo-mechanical analysis implemented in PECM/ANSYS in order
to predict the possibility in-vessel retention for 0.4 m deep debris bed, assuming only
CRGT and top cooling applied as a SAM measure. In case vessel integrity cannot be
preserved, location and dominant failure mode can be determined.
2. Investigate the influence of internal vessel pressure on the vessel failure mode and
timing.
3. Apply analytical models to quantify the possible ranges of solid debris bed thermal
conductivity based on experimentally obtained bed structural and morphological
properties.
4. Perform a sensitivity analysis of vessel failure mode and timing to debris bed thermo-
mechanical properties (i.e. thermal conductivity and material solidus/liquidus
temperature).

10
Chapter 2 Methodology and Approach
Creating a model to predict in-vessel accident stage for BWR is a challenging process due to
several large areas of uncertainty: (i) Corium mass and relocation mechanics to the lower
head of the RPV depend significantly on the accident sequence. Melt composition is a varying
in time quantity due to chemical reactions between elements. (ii) Comprising materials
thermo-mechanical properties (e.g., thermal conductivity, solubility, viscosity) change over a
wide range of temperatures. (iii) BWR lower head geometry contains a forest of auxiliary
structures and large amount of vessel wall penetrations. An effective model should address all
these phenomena and at the same time be computationally efficient.
2.1 Phase-change Effective Convectivity Model
The main idea of ECM is to apply effective heat-convecting velocities (Uup, Udown, Uside,
equations 2 - 4) instead of instantaneous fluid velocities, to remove heat from the volume to
the cooled boundaries while solving only the energy conservation equation. The melt pool is
an internally heated volume with width Hside, it is separated into two regions, where Hup is
height of well mixed upper part and Hdown the height of stratified lower region.
(2)
(3)
(4)
Steinberner-Reineke correlations (equations 5 - 7) are used to quantify characteristic heat
transfer.
(5)
(6)
(7)
The ECM is implemented in the commercial FLUENT code, which solves energy
conservation equations with modified source term, specified by the user in the User Defined
Function. Extensive validation of the model was performed and showed good model accuracy
altogether with being computationally efficient.
11
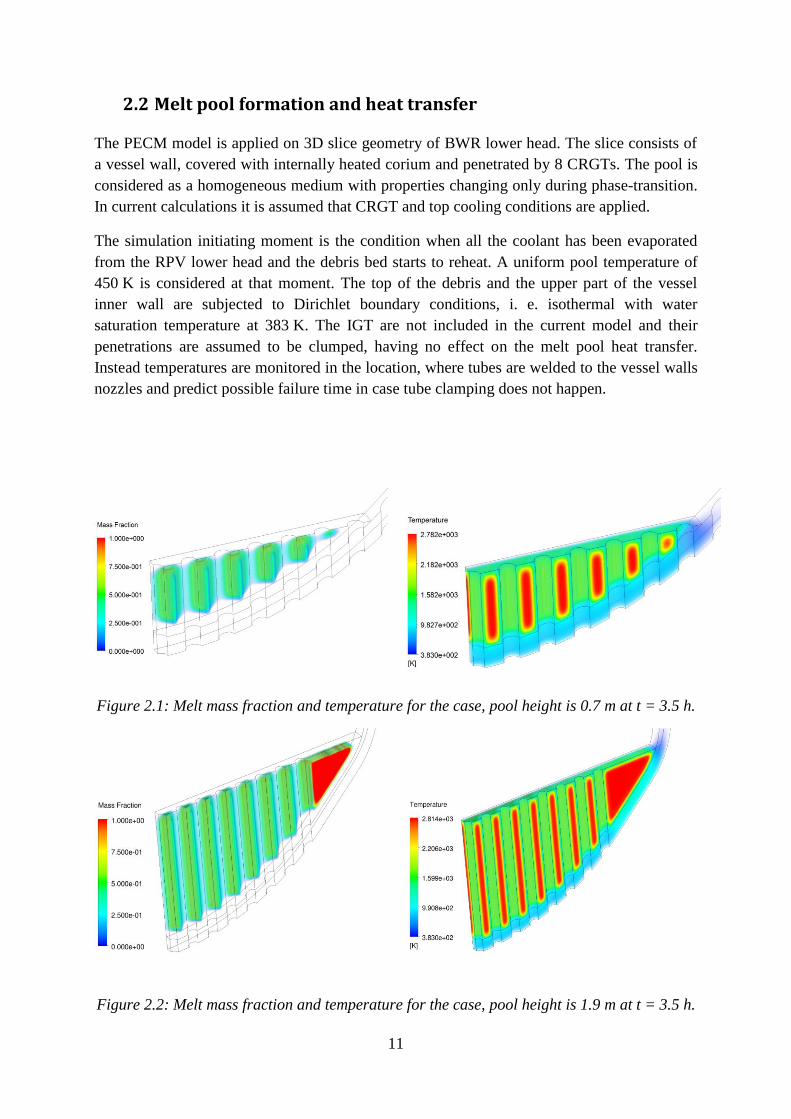
2.2 Melt pool formation and heat transfer
The PECM model is applied on 3D slice geometry of BWR lower head. The slice consists of
a vessel wall, covered with internally heated corium and penetrated by 8 CRGTs. The pool is
considered as a homogeneous medium with properties changing only during phase-transition.
In current calculations it is assumed that CRGT and top cooling conditions are applied.
The simulation initiating moment is the condition when all the coolant has been evaporated
from the RPV lower head and the debris bed starts to reheat. A uniform pool temperature of
450 K is considered at that moment. The top of the debris and the upper part of the vessel
inner wall are subjected to Dirichlet boundary conditions, i. e. isothermal with water
saturation temperature at 383 K. The IGT are not included in the current model and their
penetrations are assumed to be clumped, having no effect on the melt pool heat transfer.
Instead temperatures are monitored in the location, where tubes are welded to the vessel walls
nozzles and predict possible failure time in case tube clamping does not happen.
Figure 2.1: Melt mass fraction and temperature for the case, pool height is 0.7 m at t = 3.5 h.
Figure 2.2: Melt mass fraction and temperature for the case, pool height is 1.9 m at t = 3.5 h.

12
The coupling is done only in one way, from FLUENT to ANSYS, assuming that vessel wall
deformation will have negligible effect on the heat transfer.
Two debris heights are considered- 0.7 (Figure 2.1) and 1.9 m (Figure 2.2). The main
difference between two scenarios is the presence of the uncooled region in the upper
periphery of debris bed for a model with a deeper pool.
2.3 Structural analysis
Previously obtained results show that vessel failure happens before wall melting temperature
is reached [16]; therefore failure is mainly governed by thermally induced creep. In our
analysis we use a modified time hardening creep model, implemented in the commercial code
ANSYS. Equivalent creep strain (εcr) is described by equation 8, where c1, c2, c3 are constants,
generated using experimental creep data obtained from Rempe et al. [33].
A yield or a creep limit is not used in this study (see [16] for more discussion), instead there is
an interest in the range of reliably predicted strain. A range of strains within 20 % is
considered as reliably predicted based on the experimental data and the model applied (Figure
2.3). ANSYS creep model validation tests were performed for a rectangular SA533B1 steel
block at a constant temperature 1150 K and under applied stress of 26.5 MPa from one side,
while the other side was clamped.
Figure 2.3: ANSYS creep model validation with a SA533B1 steel rectangle (1x0.2 m) at
T = 1150 K with a stress of 26.5 MPa applied to one end.
(8)
Validation Test
reliably predicted
13
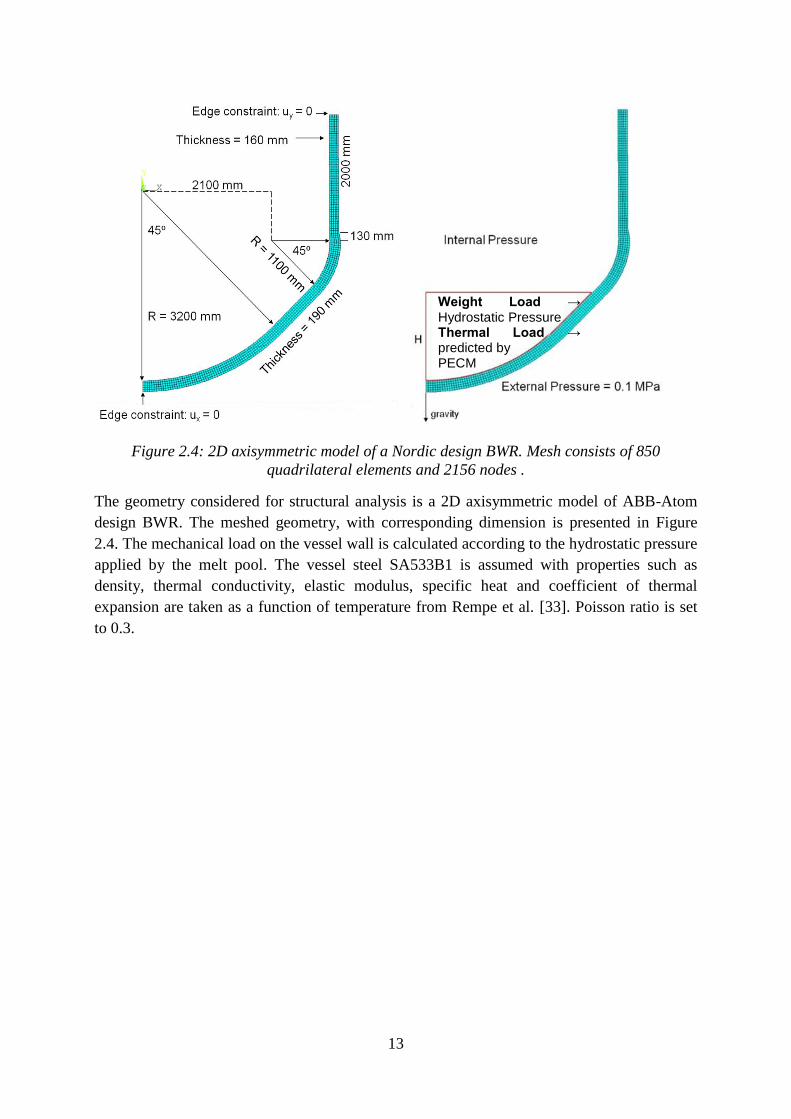
Figure 2.4: 2D axisymmetric model of a Nordic design BWR. Mesh consists of 850
quadrilateral elements and 2156 nodes .
The geometry considered for structural analysis is a 2D axisymmetric model of ABB-Atom
design BWR. The meshed geometry, with corresponding dimension is presented in Figure
2.4. The mechanical load on the vessel wall is calculated according to the hydrostatic pressure
applied by the melt pool. The vessel steel SA533B1 is assumed with properties such as
density, thermal conductivity, elastic modulus, specific heat and coefficient of thermal
expansion are taken as a function of temperature from Rempe et al. [33]. Poisson ratio is set
to 0.3.
Weight Load → Hydrostatic Pressure Thermal Load → predicted by PECM

14
2.4 Analytical Approach to Estimation of Porous Debris Effective
Thermal Conductivity
Previous analysis of the experimental results (section 1.2.4 and 1.2.5) has pointed out possible
mechanical properties and morphology of debris bed formed inside RPV lower head during
severe accident scenario. Obtained knowledge is used in analytical expressions to predict
possible ranges for debris bed effective thermal conductivity.
2.4.1 Maxwell, Lichtenecker and Bruggeman equations
One of the oldest models was presented by Maxwell in 1863 [34] to estimate effective
conductivity of a dispersed medium within a continuous phase. It considers spherical objects
spread in a medium and conduction is only possible through the attached surfaces of the
particles. Although the equation (9) was developed first for the electrical current calculation it
can be well applied for finding mass or energy flow under a driving force.
[
] (9)
Applying Maxwell model a packed debris bed of spherical particles is assumed. Predictions
with Maxwell model overestimate the value of effective thermal conductivity if ⁄ is
above 10 and at high porosities which is the point in our case. Therefore results are presented
only to be compared with other correlations.
A different approach was proposed by Lichtenecker in 1926 [35]. Equation 10 stands for a
logarithmic law describing properties of a two phase mixture. Effective thermal conductivity
is predicted as a function of separate materials conductivities and their fractions.
(10)
Both correlations (9) and (10) are often used as a foundation for mathematical models to
describe effective thermal conductivity of various two phase mixtures due to a good physical
basis. In order to cover cases with highly porous particulate mixtures, which are poorly
predicted by Maxwell equation, a Differential Effective Medium (DEM) theory of
Bruggeman [36] might be used. The formula (11) proposed is valid for a two-phase mixture
with a low solid fraction.
(
)
(11)
2.4.2 Godbee and Ziegler model
A list of more complicated models [37] used to predict effective thermal conductivity of a two
phase mixture is compared with experimentally obtained results for silicate sands and alumina

15
at temperatures up to 1220 K. Although the results could not predict temperature dependence
with a high confidence, they still were found to be within an order of magnitude of measured
effective conductivities. The Godbee and Ziegler correlation was chosen as it gave reasonable
predictions of a conductive component and allowed to treat radiative term individually. Since
heat transfer through the debris bed cannot be determined with a high precision, there is an
interest in studying the trends caused by temperature change and in better understanding
influence of the material properties.
Figure 2.5: Restructured unit cell volume in Godbee and Ziegler model.
Godbee and Ziegler [38] employed a semi-empirical unit cell model to find effective thermal
conductivity of packed powder beds. The main benefit of the derived equation is that it takes
into account: (i) shape and packing factors of the particles, (ii) heat conduction through solid-
solid phases and solid-gas phases, (iii) radiation between solid phases. Contribution of each
mechanism in terms of effective thermal conductivity has been correlated based on affecting
properties. It is important to note the separate treatment of the radiative term since all our
calculations are performed at high debris temperatures, where radiation is expected to
dominate the heat transfer.
The model is derived from a cubic cell presented in Figure 2.5. The volume is created by
reconstructing portion of debris in such a way, that solid part of the material forms a
homogeneous block. The conduction between solid phases is possible throughout the
contacting surfaces, while other surface areas are subjected to gas-solid thermal conduction
and radiative heat transfer. The total effective thermal conductivity of the packed bed can be
expressed in the following way:
[
⁄
]
(12)
Where and are derived in terms of a shape factor a. The shape factor depends on
the size distribution of the bed [39] and determines how much of the solid material might be
heat flux

16
considered to be in parallel with surrounding gas and how much in series. The radiant heat
transfer term of thermal conductivity and effective gas conductivity are found with
equations 13 and 14, where is a bulk gas thermal conductivity, derived by Schotte [40]. All
the parameters describing the bed are evaluated from the lognormal probability plot of particle
size against cumulative weight, therefore in the current model Dp stands for the median of the
distribution.
(
)
(
) (13)
(14)
2.5 Summary
The goal of the analysis is to assess uncertainty ranges. Thus affordable computational
efficiency is required along with reasonable accuracy. This is achieved by employing
simplified modeling approaches which has been successfully validated in the past.
Coupled thermo-mechanical analysis is applied for predicting vessel failure modes and
timing. Thermal load on the vessel wall is calculated with a correlation based PECM model
and is applied as a boundary condition in the structural-creep analysis. The approach has been
validated against a set of relevant experiments and high resolution CFD generated data.
Godbee and Ziegler model was selected for assessment of possible ranges of effective thermal
conductivity of a porous debris bed, because it gives reasonable agreement with available
experimental data.

17
Chapter 3 Research Results
3.1 In-vessel melt retention of a small melt pool
A multi-dimensional analysis of melt pool heat transfer coupled with vessel wall creep
analysis is performed with the corium pool depths H = 0.4 m. The goal of current analysis is
to examine the possibility of in-vessel melt retention of a small melt pool in the lower head of
Nordic-type BWR applying only CRGT and top cooling as SAM measures. The calculations
are performed for the homogeneous debris bed with crust/liquid porosity of 1/3 W∙m-1
∙K-1
and
the melting range between 2750 – 2770 K, corresponding to previously discussed oxidic
corium conditions [24].
Figure 3.1: Vessel wall temperature at the time, 20 % creep strain is reached (5.3 h).
The heat removal through CRGTs is strongly reduced by the crust formed along the cooled
regions. The vessel wall is assumed to be thermally insulated; therefore only small heat flux
through it of 20 W∙m-2
is allowed. It is subjected to constant thermal load and the temperature
of the vessel layer below debris bed exceeds 1000 K after 3.5 h and continues to grow until
20 % von Mises creep strain is reached around 5.3 h (Figure 3.2) and the failure is expected to
happen shortly. Constant pool reheating was observed until that moment, meaning that
amount of decay heat produced exceeds the heat removed through the CRGT and pool top
surfaces. At the moment when 20 % strain is reached the vessel temperatures are far below
melting point (Figure 3.1) and thus failure is mainly caused by thermally induced creep. At
5.3 h the vertical displacement of the bottom center of the pressure vessel has become
0.288 m, while displacements decrease towards the pool top as presented in Figure 3.2, which
characterizes failure as a ‘ballooning’ mode.

18
Figure 3.2: Von Mises creep strains and vessel wall axial displacements at times, when 20 %
and 45 % creep strains are reached.
Figure 3.3: Debris temperature and melt mass fraction at the moment of wall failure
(t = 5.3 h).
At the moment 20 % creep strain is reached, almost half of debris is remelted (melt mass
fraction is 49.5 %) and is mainly located in the uncooled regions between CRGTs as it is
shown in Figure 3.3. Poor heat transfer within the observed medium leads to high temperature
gradients in the vicinity of cooled surfaces.

19
Figure 3.4: Welding material temperature of the IGT, closest to the vessel centerline. 1100
stands for the onset of accelerated creep temperature while 1553/1673 are min/max Inconel
solidus temperatures.
The height of the debris bed is 0.4 m, meaning that the melt pool still covers the IGT nozzles
and thus tube drop-off is possible in case there is no clamping. Currently the model does not
include IGT penetrations. Instead, debris temperature in the locations of the IGTs nozzles was
monitored. Reaching IGT welding material solidus temperature was used as a failure
criterion. Two different materials were considered to give maximum and minimum possible
solidus temperatures of the welding. These were Inconel® 718 (TInconel_Solidus_Min = 1533 K
[41]) and Inconel® MA754 (TInconel_Solidus_Max = 1673 K [42]). The aim is to obtain an idea
about timing of IGT drop off, if such event is possible, e.g. in case the IGT casing is not
clamped in the nozzle [15]. Figure 3.4 presents IGT-1 (closest to the vessel centerline)
welding material temperature evolution in time. At the observed time period, the temperature
for that tube is identical for three different melt pools heights simulated (0.4, 0.7, 1.9 m) if
other pool properties are the same.

20
Figure 3.5: Maximum vertical displacement of the RPV centerline for models with melt pool
depth H = 0.4, 0.7 and 1.9 m. Solid lines indicate displacement until von Mises creep strain
reaches 0.2 which is considered to be reliably predicted. The lines are continued to provide
qualitative indicative comparison between the simulations.
According to Figure 3.5 the vertical displacements of the bottom center of the vessel wall are
almost identical for three melt pools until acceleration of creep takes place. It can be seen that
even a really small melt pool (12 tons of oxidic material) cannot be retained inside vessel due
to large vessel wall deformations.

21
3.2 Influence of internal pressure
In this section analysis with two corium pool depths H = 0.7 m and H = 1.9 m at different
internal conditions is performed. The influence of internal pressure is studied to highlight
importance of Automatic Depressurization System (ADS) activation timing. Similarly to
previously reported studies [16], two modes of vessel wall failure are observed, namely, (i)
‘ballooning’ type and (ii) ‘localized creep’.
Figure 3.6 shows the von Mises creep strains and displacements of the vessel wall at different
internal vessel pressures for the case with melt pool depth H = 0.7 m (about 30 tons of melt).
At time t = 4.92 h in Figure 3.6 (a), the maximum creep strain has reached 0.2 with maximum
displacement of 0.264 m. Six minutes later at t = 5.02 h (Figure 3.6 b), the maximum creep
strain has approached 0.45 with maximum displacement at the bottom of the vessel of 0.55 m.
Upper part of the vessel has creep strains below 0.05 and very small displacements. Note that
maximum creep strain below 0.2 is considered as reliably predicted. Figure 3.6 (c-f) shows
the von Mises creep strains and displacements for the cases with internal vessel pressure
p = 30 and 60 bars. It can be seen that there are no qualitative changes in the vessel failure
mode. However, transition from 0.2 to 0.45 von Mises creep strain accelerates significantly
with pressure increase. The transition time is about 1.8 min for both 30 and 60 bar cases.
Table 2: Maximum wall displacement, melt mass fraction and superheat when 20 % and 45 %
strain is reached for 0.7 m debris bed.
Parameter
3 bar 30 bar 60 bar
0.2
strain
0.45
strain*
0.2
strain
0.45
strain*
0.2
strain
0.45
strain*
Calculation time, [h] 4.92 5.02 4.31 4.33 4.15 4.18
Maximum displacement, [m] 0.264 0.554 0.305 0.583 0.306 0.610
Melt mass, [tons] 17.8 18.2 14.6 14.7 13.2 13.5
Melt superheat, [K] 181.4 186.3 115 118.3 105.2 107.1
* Note that values are indicative for 0.45 strain.
Table 2 presents maximum displacement, remelted material mass and superheat predicted for
different internal pressures at the time moments when von Mises creep strain reaches 0.2 and
0.45 in case melt debris bed height is 0.7 m. It is clear that the influence of pressure increase
is not dramatic. In all the cases a considerable amount of superheated melt above 100 K is
formed (17.8-13.2 tons, corresponding to around 60-45 % of the total debris mass) at the time
20 % percent strain is reached. In summary the increased pressure does not change the failure
mode or location, but has an influence on the failure timing.

22
Figure 3.6: RPV wall deformations and corresponding equivalent strains at 3 different
pressures 3 bar, 30 bar and 60 bar, with melt pool depth H = 0.7 m. Two figures for each
pressure scenario are presented when 20 % and 45 % strains are reached.
(a) 3 bar at t = 4.92 h (b) 3 bar at t = 5.02 h
(c) 30 bar at t = 4.31 h (d) 30 bar at t = 4.33 h
(e) 60 bar at t = 4.15 h (f) 60 bar at t = 4.18 h

23
Figure 3.7: RPV wall deformations and corresponding equivalent strains at 3 different
pressures 3 bar, 30 bar and 60 bar, with melt pool depth H = 1.9 m. Two figures for each
pressure scenario are presented when 20 % and 45 % strains are reached.
For a deeper melt pool H = 1.9 m (about 200 tons of melt), a different mode of failure, namely
‘localized creep’, is observed where maximum strains are located in the region right below the
pool top surface with no cooled CRGTs and the highest thermal loads. Figure 3.7 shows
deformations of the lower plenum at 3 different pressures which change only slightly, in
(a) 3 bar at t = 3.49 h (a) 3 bar at t = 3.57 h
(a) 30 bar at t = 3.16 h
(a) 60 bar at t = 3.08 h (a) 60 bar at t = 3.10 h
(a) 30 bar at t = 3.14 h

24
contrast with presented above case with 0.7 m bed. For all three in-vessel pressures the
displacements of the wall are almost uniform in the bottom region covered by debris.
Table 3: Maximum wall displacement, melt mass fraction and superheat when 20 % and 45 %
strains are reached for 1.9 m debris bed.
Parameter
3 bar 30 bar 60 bar
0.2
strain
0.45
strain*
0.2
strain
0.45
strain*
0.2
strain
0.45
strain*
Calculation time, [h] 3.49 3.57 3.14 3.16 3.08 3.10
Maximum displacement, [m] 0.073 0.133 0.085 0.129 0.104 0.167
Melt mass, [tons] 40.4 46.2 14.8 16.0 10.1 12.2
Melt superheat, [K] 42.2 46.8 8.9 9.3 7.5 7.9
* Note that values are indicative for 0.45 strain.
Table 3 provides maximum displacement, remelted material mass and superheat predicted for
different internal pressures at the time moments when von Mises creep strains reach 0.2 and
0.45 for pools with depth H = 1.9 m. The fraction of remelted material (around 5-20 % of the
total debris mass) and its superheat (42 K is the maximum at 20 % strain) are considerably
lower compared with 0.7 m case due to an earlier RPV failure (difference in failure time is
around 1.5 h at 3 bar pressure). Debris bed remains mostly solid (only a small mushy region
of 10 ton is presented) at failure time for 60 bar pressure. However, the time delay due to
depressurization leads to formation of melt pool (above 20% of total mass is remelted at the
time of failure) in the vicinity of failure location.
Main fraction of the debris bed remains solid at all pressures at the time 20 % creep strain is
reached. Similarly to 0.7 m melt pool case, increased pressure does not change failure mode
or location, but has an influence on the failure timing.
Figure 3.8: Maximum vertical displacement of the RPV centerline at pressures 3, 10, 30 and
60 bars with a melt pool depth (a) H = 0.7 m and (b) 1.9 m. Solid lines indicate displacement
until von Mises creep strain reaches 0.2 which is considered to be reliably predicted. The
lines are continued to provide qualitative indicative comparison between the simulations.
(a) (b)

25
When pressure is reduced from 3 to 60 bars, the time to reach 20 % creep strain decreases by
24 min (or 11.7 % of the time) for the 1.9 m bed and by 48 min (or 15.7% of the time) for the
H = 0.7 m bed case. This implies that with a smaller melt pool, pressure has higher
significance for the failure timing, while speaking of melt release- the effective is opposite as
1.9 m debris failure happens shortly after remelting starts to form.
Figure 3.8 shows the vertical displacement of the bottom center of the lower head for 0.7 and
1.9 m deep debris beds. Again, the plots are divided into two parts (i) solid line which
represent reliably predicted results with less than 20 % strain, and (ii) beyond this limit which
is shown with dotted line and can be considered only as indicative. In all cases the vertical
displacement follows a gradual growth until certain moment in time and then accelerates
rapidly. As stated previously, we cannot infer exactly the time of failure and the
corresponding deformations after 20 % strain is reached. However, once the maximum creep
strain follows an accelerated increase, failure of the global vessel wall is considered as
imminent and soon (within some minutes). The higher the internal vessel pressure, the earlier
transition to rapid vertical displacement of the lower head is observed.

26
3.3 Influence of debris bed thermal properties
The last part of this Master’s thesis work was dedicated to the study of the influence of debris
bed thermo-physical properties on the vessel wall failure mode and timing. All presented
cases correspond to a 1.9 m debris bed with CRGT and top cooling. The size of the debris is
chosen due to previously observed effect [24] that for a large melt pool the influence of
corium material properties is more pronounced. In total, 43 scenarios were simulated to
determine the time to reach 0.2 von Mises creep strain and the corresponding mass and
superheat of re-melted material. Homogeneous debris bed conditions are assumed, while
material properties are changed between simulations.
The same failure type (‘localized creep’) was observed in all cases. The failure is located
above 45 degrees from the vessel bottom, in the region with no cooled CRGTs, faster liquid
melt formation and higher vessel temperatures. The displacements at assumed failure time
(0.2 strain) differ negligibly from case to case.
Vessel wall ablation was predicted under certain scenario conditions: crust/corium thermal
conductivity was 0.5/20 W∙m-1
∙K-1
and the melting range (Tliquidus - Tsolidus) was above 600 K.
Melting of a crust attached to the wall lead to direct melt-vessel interaction. The rapid thermal
conductivity change that was applied (more than an order of magnitude) was dictated by
theoretically predicted results (see chapter 3.4.1 for more discussions).
Figure 3.9: Maximum values of wall equivalent creep strain and temperature plotted as a
function of time. The parameters were as follows: ksolid=0.5 W∙m-1
∙K-1
; kliquid=20 W∙m-1
∙K-1
;
Tsolidus=2000 K; Tliquidus=2770 K.
Direct melt-vessel interaction led to a significant temperature rise in a short term. Wall
maximum temperature and creep strain are plotted in Figure 3.9 as a function of time. A rapid
temperature rise, corresponding to melt steel contact can be observed, before onset of creep
acceleration is reached. By the time 20 % strain is exceeded, the vessel has already
superheated above 2000 K (RPV steel liquidus = 1721 K). According to Figure 3.10

27
noticeable part of the wall thickness is ablated; however, the vessel failure is still caused by
the thermally induced creep in the region, 45 degrees above vessel bottom.
Figure 3.10: Vessel wall deformations in ANSYS and melt fraction in FLUENT plotted at the
same time moment. By the time 23.8 % creep strain is reached almost third of wall thickness
has melted. The molten region temperature exceeds steel Tliquidus by 600 K.
Comparing the obtained results, it was observed that the failure conditions might change
dramatically from case to case if several debris parameters are modified. Therefore we are
aiming to study the influence of each property changing one at a time. The scenarios were
chosen to (i) expand failure map as much as possible, (ii) observe tendencies provided by a
single parameter change.
3.3.1 Thermal conductivity of solid debris bed
It was found that the solid debris thermal conductivity is the most influential parameter with
respect to the failure mode (in this case amount and superheat of liquid melt) and timing. The
results are presented in Figure 3.11 for both global vessel and possible IGT failure times as a
function of solid debris thermal conductivity. Similarly to 0.4 m model, debris temperature
was monitored in the locations of IGT nozzles. The tubes nearest to the vessel centerline were
found to be most vulnerable to thermal load and therefore fail first while clamping of this
location is considered least probable. The results presented in this section correspond to
IGT 1.
(a) (b)

28
Figure 3.11: Failure timing of vessel wall and IGT. Two Inconel materials with lowest and
highest solidus temperatures are used in IGT failure criterion. Other parameters are varied in
the following ranges: kliquid=0.5-20 W∙m-1
∙K-1
; Tsolidus=2000-2770 K; Tliquidus=2020-2770 K.
More on other trends presented in Figure 3.11, there is a large (between 3.44 - 4.21 h)
difference in timing due to variation of the other parameters at very low ksolid = 0.5 W∙m-1
∙K-1
.
The difference is also noticeable (3.41 – 3.52 h) if the crust conductivity is 1 W∙m-1
∙K-1
. If
solid debris thermal conductivity is higher than 2.0 W∙m-1
∙K-1
, other thermo-mechanical
properties of the debris have no influence on the failure timing. If ksolid is above 6 W∙m-1
∙K-1
,
no liquid melt is predicted at the time of the vessel wall failure. From Figure 3.11 and Figure
3.13 we can conclude that for ksolid > 6 - 8 W∙m-1
∙K-1
, IGT failure is unlikely to occur, at least
during several hours. The IGT failure is expected to happen before vessel wall failure for
thermal conductivities below 5 W∙m-1
∙K-1
(Figure 3.11).
Figure 3.12: Melt superheat at the time of IGT failure with IGT material Inconel MA754,
for debris with Tsolidus = 2128 K, Tliquidus = 2148 K and kliquid in the range 0.5 -
20 W∙m-1
∙K-1
.

29
Figure 3.13: Time history for the IGT welding point closest to RPV center bottom for different
ksolid. The 1100 K temperature corresponds to the creep acceleration and the shaded area
between 1533 and 1673 K shows the range of solidus temperatures of Inconel.
The maximum debris temperature (which is located in the periphery region with no CRGTs
and IGTs) at IGT failure time rises with ksolid, while averaged debris temperature goes down
(Figure 3.12). In all cases there is no melt in the vicinity of IGT at the time when welding
material starts to melt.
3.3.2 Liquid thermal conductivity and solidus/liquidus temperatures
Figure 3.14 shows that liquid melt thermal conductivity (kliquid) has a noticeable influence on
the timing of vessel wall failure only if ksolid is equal to 0.5 W∙m-1
∙K-1
. Similarly, the influence
of the solidus and liquidus temperatures of the debris bed on the global vessel failure time is
negligible except for the cases with ksolid = 0.5 W∙m-1
∙K-1
, however even in this case the effect
is not big because most of the relocated material has already re-melted by the time of vessel
failure.

30
Figure 3.14: Vessel wall failure timing plotted against (a) debris liquidus thermal
conductivity, (b) debris solidus temperature and (c) debris liquidus temperature. Other
parameters are varied in the following ranges: kliquid = 0.5-20 W∙m-1
∙K-1
; Tliquidus = 2020-
2770 K, and Tsolidus = 2000-2750 K.
Figure 3.15 represents two regions for the predicted melt mass and superheat at the time 20 %
creep strain is reached. Our goal was to cover all possible failure regimes. The ksolid is the
dominant parameter, while other ones may play an important role in expanding the region of
uncertainty, in case sufficiently large melt pool is formed. It can be observed, that if crust
conductivity is above 4 W∙m-1
∙K-1
, the other parameters’ influence is negligible.
If ksolid is less than 3 W∙m-1
∙K-1
, considerable amount of superheated above 100-200 K melt
can be generated. It should be noted, however, that IGT failure for the same and smaller ksolid
occurs much earlier (Figure 3.11). Thus formation of a large pool of superheated melt (which
(b)
(c)
(a)

31
increases a risk of ex-vessel debris agglomeration and energetic steam explosion) might be
avoided if multiple IGT failures would provide a flow path for gradual melt release from the
vessel in a dripping mode. Yet actual location of the melt pool with respect to the IGTs and
possibility of such gradual release have to be further investigated.
Figure 3.15: Region of possible melt (a) mass and (b) superheat at the time of vessel failure.
Note that maximum mass and temperature values were obtained under different debris
scenario conditions.
In order to distinguish a separate effect of each studied debris bed property- a series of
simulations were performed with one input parameter (kliquid, Tsolidus, Tliquidus) changed at a
time. The results are presented in Appendix A and the observed trends are emphasized with
colors. It is important to point out, that the effect provided by each parameter separately was
significantly less important compared to ksolid. Another observation was done, that the
influence of single debris property depends on other ones. For instance increase of liquid
thermal conductivity could either lead to a failure delay or to failure acceleration, based on
Tsolidus/Tliquidus applied. The strongest observed effects on failure conditions were indicated
with bald font and debris solidus temperature was found to be secondly most significant
thermo-mechanical property after ksolid. Its influence remained constant between sets of
scenarios and the effect was more appreciable than for kliquid and Tliquidus.
3.4 Debris bed thermal conductivity
Table 4 presents calculated effective thermal conductivities for two different debris beds,
assuming kg equals to steam conductivity at 450 K and 3 bar pressure. Results predicted by
Maxwell model are significantly higher than two other models as it was expected. The
Lichtenecker and Bruggeman correlations show good agreement for oxidic debris bed, while
predicted results differ by a factor of two for debris with solid phase thermal conductivity of
(a) (b)

32
13.53 W∙m-1
∙K-1
. The presented results should be treated with caution since all three
approaches are simplistic. However, we are still able to conclude that effective debris bed
thermal conductivity can drop an order of magnitude and even more for porosity values 40 %
and above (see ke values with Bruggeman in Table 4).
Table 4: Three model predictions of effective thermal conductivity. ks = 3 corresponds to an
oxidic debris bed [24] while ks = 13.53 stands for the oxidic-metallic mixture measured in
MASCA experiment [28].
3.4.1 Godbee and Ziegler model results
In order to obtain shape factor, six FARO experiments’ (namely L11, L14, L19, L20, L28,
L33 [17]) data was post-processed. Experimentally obtained particle distribution as a function
of size is presented in Figure 3.16. In all the experiments at least 95% of the formed
fragmented particles’ sizes was found to be in between 0.25-15 mm. A lognormal distribution
function was proposed by Godbee and Ziegler in [39] in order to characterize the cumulative
density function. Values of a between 0.860-0.999 were obtained for the presented
experiments.
As a first approach, a thermal conductivity of bed consisting of pure UO2 was calculated.
Correlations for steam and uranium dioxide thermal properties were taken from material
databases [26] and [43]. UO2 thermal conductivity and heat emissivity are plotted in Figure
3.17 as a function of temperature. The idea to apply model for a more complex corium
composition was abandoned due to a large uncertainty in material fractions and complex
behavior of some elements’ thermal properties (e.g. Zr emissivity and conductivity are highly
influenced by the oxidation process).
40 % porosity 70 % porosity
ks, [W∙m-1
∙K-1
] 3 13.53 3 13.53
ke (Maxwell),
[W∙m-1
∙K-1
] 1.52 6.79 0.69 3.03
ke (Lichtenecker),
[W∙m-1
∙K-1
] 0.49 1.02 0.13 0.2
ke (Bruggeman),
[W∙m-1
∙K-1
] 0.35 0.45 0.088 0.092

33
Figure 3.16: Cumulative weight distribution of debris bed particle sizes from FARO
experiments.
An issue that was encountered during the course of this work is the lack of experimental data
for highly porous samples at temperatures above 1500 K, hence comparative analysis of the
calculated results cannot be performed. Nevertheless, the results can be used to quantify limits
of reasonable effective thermal conductivity and to figure out the most influential parameters
of the debris. The resulting effective UO2 thermal conductivity for beds with porosity of 40 %
and 70 % is presented in Figure 3.18. Two separate terms are shown to distinguish their
effect- radiative term and conductive, which includes heat transfer between connected solid-
solid surfaces and between solid-gas phase.
Figure 3.17: UO2 thermal properties (a) conductivity1 and (b) emissivity
2 as a function of
temperature.
1 Washington correlation was used [43]
2 Emissivity correlation was derived in [26]
(a) (b)

34
A surprising effect observed, is that calculated effective thermal conductivity for more porous
debris bed (70 %) is significantly higher. The difference between two cases presented in
Figure 3.18 is already 2 times at T = 2000 K. The reason for this effect is the influence of the
emitting surface size on the radiative term, which becomes dominant after certain temperature
for two porosities observed. Another important conclusion is that in both cases ksolid exceeds
0.5 W∙m-1
∙K-1
if the temperature is above 1000 K.
Figure 3.18: Effective thermal conductivity predicted with Godbee and Ziegler model. The
calculations were performed assuming 1 mm median particle size and (a) 40% porosity (b)
70% porosity. The shape factor is 0.86.
The dominant effect of radiative thermal conductivity is governed by high temperatures and
large surface/volume ratio of the debris bed. It is reasonable to quantify significance of the
properties (material emissivity, particle size and the debris porosity), contributing to this term.
In Figure 3.19 results are presented for debris beds with two different porosities 40 % and
70 % and 3 mean particle sizes- 1, 5, 10 mm. Figure 3.20 shows difference in heat
conductance between pure Zircaloy (emissivity ~0.3) and completely oxidized zirconium
(emissivity ~0.8). The UO2 is provided to stress the similarity of effective conductivity for
oxidic materials. It should be noted here, that for high debris particle diameters (Dp > 5 mm) it
is reasonable to expect overestimation of the results. In the model the single particle
temperature is considered to be uniform, while in reality the temperature gradient between
particle centerline and edge would lead to a significantly lower radiative term than it is
predicted. For example, for UO2 pellets the temperature gradient might exceed 500 K over
5 mm.
(a) Φ = 40 % (b) Φ = 70 %

35
Figure 3.19: Effective thermal conductivity of the debris bed for 3 mean particle sizes. Solid
lines correspond for the shape factor α = 0.860, continuous lines for α = 0.999. It is
important to note that at high porosity (70 %) there is no observable influence due to shape
factor, since in this case the radiative term exceeds conductive term by far.
Figure 3.20: Effective thermal conductivity of UO2, pure Zircaloy and completely oxidized
zirconium beds. Other debris parameters are as follows- particle mead size is 5 mm, porosity
is 40 %. Dashed/solid lines correspond to maximum/minimum shape factor. The results are
presented up to temperature value of 2150, which is Zircaloy melting point.
3.4.2 Conclusions
Results presented in Figure 3.19 cover a wide range of values, especially at temperatures
above 2000 K. They give a good indication of the trend, characterizing debris effective
thermal conductivity. The main conclusions that can be drawn according to Godbee and
Ziegler model are:
(a) Φ = 40 % (b) Φ = 70 %

36
The most influential parameters in terms of debris thermal conductivity are
temperature, material heat emissivity, porosity and particle size distribution.
It is unreasonable to consider thermal conductivity below 0.5 W∙m-1
∙K-1
since that
value is exceeded for all the simulated properties in a short term.
Effective thermal conductivity can change an order of magnitude in the range of
temperatures between 450-2000 K.
3.5 Results of analysis with variable thermal conductivity
As a result of sensitivity analysis, it was found that among debris bed thermo-mechanical
properties, thermal conductivity of solid phase has the most significant influence on the
output. An effort was done to constrain this parameter based on analytical models discussed
in section 2.4. An overview of the ksolid behavior as a function of temperature was obtained.
Then additional analysis was done to determine the effect of non-constant thermal
conductivity, more specifically the function in Eq. 12 with dependence on temperature.
A case with maximum predicted melt mass at the time of vessel failure was selected as a
reference scenario. All the properties were kept constant, except solid debris thermal
conductivity which was predicted by Godbee and Ziegler model based on several debris
morphologies, as shown in Table 5. As presented in Figure 3.21 the averaged over whole
debris bed effective thermal conductivity follows the trend predicted by the model until
material Tsolidus is reached. For case 3 (1 mm mean particle size) a rapid ke change can be
observed just before 2 hours, which indicates onset of rapid debris remelting. For simulations
(1) and (2) this process is more gradual since at this time effective thermal conductivities
already high enough and mass of molten material is observably lower.
Table 5: Comparison of results with constant and variable effective thermal conductivity of
solid debris (equation 12) and kliquid = 8.5 W∙m-1
∙K-1
; Tsolidus = 2128 K; Tliquidus = 2148 K;
alpha = 0.86.
Scenario ksolid,
[W∙m-1
∙K-1
]
Debris
porosity,
[%]
Mean particle
diameter,
[mm]
Failure
time, [K]
Melt
mass,
[tons]
Melt
superheat,
[K]
Reference
case 0.5 - -
4.01 184 452.6
Case 1 Eq. 12 40 5 2.95 53.5 50.5
Case 2 Eq. 12 50 5 2.84 28.2 20.6
Case 3 Eq. 12 40 1 3.48 169 137.2

37
Figure 3.21: Mass-averaged debris (a) effective thermal conductivity and (b) temperature
evolution as a function of time for three cases, calculated in FLUENT.
The presented above 3 cases are now compared against the previous simulations with constant
effective thermal conductivity. The first two cases show significant reduction in time until
failure compared to the reference case (see Table 5), as well as the corresponding melt mass,
and melt superheat. As shown in Figure 3.22, the failure conditions correspond well to the
effective conductivity region between 2-3 W∙m-1
∙K-1
. The third case showed slight decrease of
time until failure and corresponding melt mass; although the melt superheat predicted is much
reduced compared with the other quantities.
The uncertainty in the porosity of debris bed and in the particle size distribution comes from
experiments, and cannot be reduced to significantly affect the areas failure maps plotted in
Figure 3.22.
Figure 3.22: Among 3 cases with applied with effective thermal conductivity applied as a
function of time (1) and (2) show significant reduction of predicted melt mass and superheat
at the time of failure.
(a) (b)
(a) (b)
(1)
(2) (1) (2)

38
3.5.1 Summary
Significant theoretical and experimental work has been done in the past in order to quantify
properties of debris bed (porosity, particle size distribution, material composition) that is
formed in the reactor lower head after core relocation and corium-coolant interactions. The
complexity of physical phenomena and scenarios lead to a wide range of possible debris bed
thermo-mechanical properties. Although, applying effective thermal conductivity of the
debris bed dependent on the temperature results in reduction of the uncertainty ranges, there is
still significant uncertainty in the melt ejection mode and timing.

39
Chapter 4 Conclusions and Recommendations
4.1 Conclusions
The work addresses a hypothetical severe accident in a Nordic-type BWR with core
degradation, and debris bed formation in the vessel lower head, followed by debris reheating,
melt pool formation and vessel failure.
The goal of the work was to assess the influence on the vessel failure mode and timing in case
of: (i) a small (0.4 m deep) melt pool; (ii) higher pressures inside the vessel; (iii) variable
thermo-mechanical properties of the debris bed. Control rod guide tube (CRGT) cooling and
cooling of the debris from the top are considered as severe accident management (SAM)
measures in this study.
Analysis is carried out with coupled (i) Phase-change Effective Convectivity (PECM) model
implemented in Fluent for prediction of the debris and melt pool heat transfer, and (ii)
structural model of the RPV lower head implemented in ANSYS for simulation of thermo-
mechanical creep. The coupling is done through transient thermal load predicted by PECM
and applied as a boundary condition in ANSYS analysis.
Following tasks have been addressed:
Minimum retainable amount of melt
Results of the analysis suggest that applying only CRGT and top cooling is insufficient for
maintaining vessel integrity with 0.4 m deep (~12 tons) corium melt pool. Poor heat transfer
properties of the crust formed on cooled from inside CRGTs are deemed to be responsible for
the ineffectiveness of the CRGT cooling. The failure of the vessel by thermally induced creep
can be expected starting from 5.3 h after the dryout of the debris bed in the lower plenum. The
‘ballooning failure’ mode was observed with the maximum strains located in the vessel
bottom part. However, an earlier failure of the instrumentation guide tubes (IGTs) is possible
due to melting of the nozzle welding.
Influence of vessel internal pressure
The internal pressure in the vessel in the range between 3 to 60 bars has no significant
influence on the mode and location of the global RPV wall failure for debris bed pool depths
0.7 m (~30 tons) and 1.9 m (~200 tons) with implemented CRGT and top cooling conditions.
Two vessel failure modes were observed- ‘ballooning mode’ for a smaller pool and ‘localized
creep’ for a deeper one.
Pressure in the vessel has the influence on timing of the RPV wall failure. By decreasing
pressure from 60 to 3 bars, the failure was delayed by 46 min for 0.7 m and by 24 min for
1.9 m debris bed. For 0.7 m pool case, changes in vessel pressure from 3 to 60 bars caused
changes in liquid melt mass and superheat from ~18 tons at 180 K to ~13 tons at 100 K

40
superheat. The same changes in pressure for 1.9 m case caused changes in liquid melt mass
and superheat from ~40 tons at 42 K to ~10 tons at about 8 K superheat.
Influence of the debris bed and melt properties
Investigation of the influence of melt pool properties on the mode and timing of the vessel
failure was carried out for the case with pool height of 1.9 m and CRGT and top cooling
conditions. A broad range of parameters was tested, ksolid/kliquid changed in between 0.5-
20 W∙m-1
∙K-1
, while Tsolidus/Tliquidus between 2000-2770 K.
Results of the analysis suggest that the thermo-mechanical creep behavior is most sensitive to
the thermal conductivity of solid debris. Both vessel wall and IGT failure timing are strongly
dependent on this parameter. For ksolid > 2 W∙m-1
∙K-1
other thermo-mechanical properties had
no significant effect on vessel wall failure timing. If the thermal conductivity is above 6 W∙m-
1∙K
-1, no liquid melt is expected at the time of the wall failure.
Amount and superheat of ejected melt also depend on the other debris bed and melt
properties. A map for possible vessel failure conditions as a function of melt properties has
been proposed. It was observed that considerable amount of superheated above 100 K melt
can be generated before vessel wall failure if ksolid is below 3 W∙m-1
∙K-1
. However, in this case
melting of the IGT nozzle welding is predicted earlier than vessel failure and before any
liquid melt is formed.
For given debris thermal conductivity of solid phase, an increase in Tsolidus or Tliquidus generally
leads to a decrease in liquid melt mass and superheat at the moment of vessel wall failure.
Only in an extreme case with Tsolidus, Tliquidus range larger than 600 K, thermal conductivity of
solid 0.5 W∙m-1
∙K-1
and thermal conductivity of liquid melt 20 W∙m-1
∙K-1
, a noticeable vessel
wall ablation and melting of the crust on the wall surface was observed. However, the failure
was still caused by creep strain and the location of the failure remained similar to other
considered cases.
Effective thermal conductivity of debris as a function of temperature
Godbee and Ziegler model was applied for prediction of the identified most influential
parameter – effective thermal conductivity of the porous debris. The results of prediction for
UO2 debris show that effective thermal conductivity can change up to an order of magnitude
within temperature ranges 450-2000 K. This is mainly due to the radiant heat transfer which
becomes dominant at high temperatures. The other influential parameters are material
emissivity, particle size distribution and debris porosity, whilst individual material thermal
conductivities have minor effect on ke.
Although, applying effective thermal conductivity of the debris bed dependent on the
temperature results in reduction of the uncertainty ranges, there is still significant uncertainty
in the melt ejection mode and timing.

41
4.2 Discussion
The current analysis is an important step in understanding of BWR vessel failure modes. It
provides a basis for further analysis of ex-vessel stages of severe accident progression.
It should be emphasized that according to the obtained results at any combination of the melt
and debris properties, failure of the vessel (either vessel wall or IGT nozzle welding) is
predicted before any significant amount of melt is formed in the vessel.
However in case when IGT nozzle welding fails first, it is still possible that the failure will be
plugged (e.g. by solid debris and slowly dripping melt). Which means that melt ejection mode
will be determined by the vessel failure.
Application of CRGT cooling as a sole SAM measure does not provide sufficient heat
removal capacity to preserve vessel integrity even if relatively small mass (~12 ton) of corium
is relocated to the vessel lower head.
4.3 Outlook
The following future research directions are considered as most important:
In all the cases addressed in the current study CRGT and top cooling was applied as a
SAM measure. Similar analysis needs to be performed without application of the
cooling.
For the 1.9 m melt pool scenario failure is expected to happen in the region 45 degrees
above vessel centerline. Located slightly above this region reactor recirculation pumps
might affect the failure mechanism and timing. Thus pump penetrations should be
included in the analysis using appropriate 3D thermal and structural models.
Volumetric heat source was considered constant during the considered transients.
Changes in the decay heat and also possible heat due to oxidation of the debris can be
taken into account in the continuation of this work.
Early re-melting of metallic debris which can fill the gaps between oxidic particles
and chemical reactions changing composition of the debris will affect thermo-physical
properties of the debris and melt and should be taken into account in the future.
There is a deficiency in theoretical background and experimentally validated models
for prediction of solid debris thermo-physical properties at high temperatures.
Development and validation of such models is another direction for further reduction
of the uncertainties.
Effective thermal conductivity was applied as a function of temperature for UO2
debris. Further analysis should include complex corium composition and address
corresponding important physical phenomena (zirconium and steel oxidation,
dissociation of UO2).
42
List of References
[1] T. G. Theofanous, “On the proper formulation of safety goals and assessment of safety
margins for rare and high-consequence hazards”, Reliability Engineering & System
Safety, Vol. 54, Issues 2–3, Pages 243-257, ISSN 0951-8320, 1996.
[2] W. Frid, N. Garis, J.-O. Liljenzin, B. R. Sehgal, T.-N. Dinh, W. Ma, P. Kudinov, A.
Karboijan, C. T. Tran, R. Hansson, C. Ekberg, J. Holm, H. Glänneskog, S.
Holgersson, “APRI-6 Accident phenomena of risk importance” report, 2009:25, 2009.
[3] W. Frid, N. Garis, J.-O. Liljenzin, W. Ma, P. Kudinov, M. Foreman, S. Tietze, “APRI-
7 Accident phenomena of risk importance” report, 2012:12, 2012.
[4] R. O. Gauntt, L. L. Humphries, et al. “Final results of the XR2-1 BWR metallic melt
relocation experiment”, Washington, D.C.: Division of Systems Technology, Office of
Nuclear regulatory Research, U.S. Nuclear Regulatory Commission, 1997.
[5] V.-A. Phung, P. Kudinov, W. Ma, “MELCOR analysis of core relocation
phenomena”, MSWI-35 proceedings, 2012.
[6] T. G. Theofanous, C. Liu, S. Additon, S. Angelini, O. Kymäläinen, T. Salmassi, “In-
vessel coolability and retention of a core melt”, Nuclear Engineering and Design,
Volume 169, Issues 1–3, Pages 1-48, ISSN 0029-5493, 10.1016/S0029-
5493(97)00009-5, 1997.
[7] H.-G. Willschuetz, E. Altstadt, B. R. Sehgal, and F.-P. Weiss, “Recursively coupled
thermal and mechanical FEM-analysis of lower plenum creep failure experiments”,
Annals of Nuclear Energy, Vol. 33, pp. 126-148, 2006.
[8] V. A. Bui, T.-N. Dinh, “Modeling of heat transfer in heated-generating liquid pools by
an effective diffusivity-convectivity approach”, Proceedings of 2nd European
Thermal-Sciences Conference, Rome, Italy, pp. 1365-1372, 1996.
[9] C.-T. Tran, T.-N. Dinh, “The effective convectivity model for simulation of melt pool
heat transfer in a light water reactor pressure vessel lower head. Part I: Physical
processes, modeling and model implementation”, Progress in Nuclear Energy, Vol.
51, pp. 849-859, 2009.
[10] C.-T. Tran, P. Kudinov, T. N. Dinh, “An approach to numerical simulation and
analysis of molten corium coolability in a boiling water reactor lower head”, Nuclear
Engineering and Design, Vol. 240, Issue 9, pp.2148-2159, ISSN 0029-5493, 2009.
[11] C.-T. Tran, T.-N. Dinh, “The effective convectivity model for simulation of melt pool
heat transfer in a light water reactor pressure vessel lower head. Part II: Model
assessment and application”, Progress in Nuclear Energy, Vol. 51, pp. 860-871, 2009.
[12] C.-T. Tran, T.-N. Dinh, “Simulation of core melt pool formation in a reactor pressure
vessel lower head using an effective convectivity model”, Nuclear engineering and
technology, Vol. 41, pp. 929-944, 2009.
[13] C.-T. Tran, P. Kudinov, T. N. Dinh, “An approach to numerical simulation and
analysis of molten corium coolability in a BWR lower head”, XCFD4NRS Workshop,
Grenoble, France, September 10-12, 2008.

43
[14] W. Villanueva, C.-T Tran, P. Kudinov, “Assessment with coupled thermo-mechanical
creep analysis of combined CRGT and external vessel cooling efficiency for a BWR”,
Proceedings of 14th International Topical Meeting on Nuclear Reactor Thermal-
Hydraulics (NURETH-14), Toronto, Ontario, Canada, September 25-30, Paper
NURETH14-628, 2011.
[15] W. Villanueva, C.-T. Tran, P. Kudinov, “Analysis of instrumentation guide tube
failure in a BWR lower head”, Proceedings of 9th International Topical Meeting on
Nuclear Thermal-Hydraulics (NUTHOS-9), Kaohsiung, Taiwan September 9-13,
Paper N9P0268, 2012.
[16] W. Villanueva, C.-T. Tran, P. Kudinov, “Coupled thermo-mechanical creep analysis
for boiling water reactor pressure vessel wall lower head,” Proceedings of The 8th
International Topical Meeting on Nuclear Thermal-Hydraulics, Operation and Safety
(NUTHOS-8), Shanghai, China, October 10-14, Paper N8P0248, 2010.
[17] D. Magallon, “Characteristics of corium debris bed generated in large- scale fuel- cool
interaction experiments”, Nuclear Engineering and Design, Vol. 236, pp. 1998-2009,
2006.
[18] J.H. Song, I.K. Park, Y.S. Shin, J.H. Kim, S.W. Hong, B.T. Min, H.D. Kim, “Fuel
coolant interaction experiments in TROI using a UO2/ZrO2 mixture”, Nuclear
Engineering and Design, Vol. 222, Issue 1, Pages 1-15, ISSN 0029-5493, 2003.
[19] P. Kudinov, A. Karboijan, W. Ma, Truc-Nam Dinh, “The DEFOR-S experimental
study of debris formation with corium simulant materials”, Nuclear Technology, Vol.
170, pp. 219-230, 2010.
[20] P. Kudinov, A. Karbojian, C.-T. Tran, W. Villanueva, “The DEFOR-A experiment on
fraction of agglomerated debris as a function of water pool depth,” Proceedings of The
8th International Topical Meeting on Nuclear Thermal-Hydraulics, Operation and
Safety (NUTHOS-8), Shanghai, China, October 10-14, Paper N8P0296, 2010.
[21] P. Kudinov, A. Karbojian, C.-T. Tran, and W. Villanueva, ”Experimental Data on
Fraction of Agglomerated Debris Obtained in the DEFOR-A Melt-Coolant Interaction
Tests with High Melting Temperature Simulant Materials,” Accepted by Nuclear
Engineering and Design, 2013.
[22] A. Konovalenko, A. Karbojian, P. Kudinov, “Development of scaling approach for
prediction of thermal spread thickness of melt poured into a water pool”, Proceedings
of 9th International Topical Meeting on Nuclear Thermal-Hydraulics (NUTHOS-9),
Kaohsiung, Taiwan, September 9-13, Paper N9P0302, 2012.
[23] A. Konovalenko, A. Karbojian, P. Kudinov, “Experimental results on pouring and
underwater liquid melt spreading and energetic melt-coolant interaction”, Proceedings
of 9th International Topical Meeting on Nuclear Thermal-Hydraulics (NUTHOS-9),
Kaohsiung, Taiwan, September 9-13, Paper N9P0303, 2012.
[24] C.-T. Tran, W. Villanueva, P. Kudinov, “A study on the integral effect of corium
material property on melt pool heat transfer in a boiling water reactor”, Proceedings of
9th International Topical Meeting on Nuclear Thermal-Hydraulics (NUTHOS-9),
Kaohsiung, Taiwan, September 9-13, Paper N9P0289, 2012.
[25] V. G. Asmolov, V. N Zagryazkin, F. D. Tsurikov, V. Yu. Vishnevsky, Ye. K.
D’yakov, A. Yu. Kotov, V. M. Repnikov, “Main result of study on the interaction

44
between the corium and melt and steel in the VVER-1000 reactor vessel during a
severe accident performed under MASCA project”, Journal of Physics of Atomin
Nuclei, Vol. 73, pp. 2301- 2318, 2010.
[26] C. M. Allison, G. A Berna, R. Chambers, E. W. Coryell, K. L. Davis, D. L. Hagrman,
D. T. Hagrman, N. L. Hampton, J. K. Hohorst, R. E. Mason, M. L. McComas, K. A.
McNeil, R.L. Miller, C. S. Olsen, G. A. Reymann, L. J Siefken,
“SCDAP/RELAP5/MOD3.1 code manual volume IV: MATPRO – A library of
materials properties for light water reactor accident analysis”, NUREG/CR-6150
ECG-2720, 1993.
[27] Masato Kato, Teppei Uchida, Shun Hirooka, Masatoshi Akashi, Akira Komeno and
Kyoichi Morimoto, “Melting temperatures and thermal conductivities of corium
prepared from UO2 and Zircaloy-2”, MRS Proceedings, 1444, 2012.
[28] D. V. Tsurikov, V. F. Strizhov, S. V. Bechta, V. N. Zagriazkin, N. P. Kiselev, “Main
results of the MASCA1 and MASCA2 projects”, https://www.oecd-nea.org, 2007.
[29] P. Nikolopolous, G. Ondracek, “Conductivity bounds for porous nuclear fuels”,
Journal of Nuclear Materials, Vol. 114, pp. 231-233, 1983.
[30] X. Gaus-Liu, A. Miassoedov, T. Cron, T. Wenz, “The coolability of melt pool in PWR
lower head- results of LIVE experiments”, Journal of Energy and Power Engineering,
Vol. 4, No.3(Serial No.4), 2010.
[31] J. S. M. Botterill, A. G. Salway, Y. Teoman, “The effective thermal conductivity of
high temperature particulate beds – I. Experimental determination”, International
Journal of Heat and Mass Transfer, Vol. 32, pp. 585-693, Great Britain, 1989.
[32] S. E. Yakush, N. T. Lubchenko and P. Kudinov, “Risk and uncertainty quantification
in debris bed coolability”, Proceedings of The 15th International Topical Meeting on
Nuclear Reactor Thermal-Hydraulics (NURETH-15), Pisa, Italy, May 12-17,
NURETH15-283, 2013.
[33] J. L. Rempe, S. A. Chavez, G. L. Thinnes, C. M. Allison, G. E. Korth, R. J. Witt, J. J.
Sienicki, S. K. Wang, L. A. Stickler, C. H. Heath, S. D. Snow, “Light water reactor
lower head failure”, Report NUREG/CR-5642, Idaho Falls, 1993.
[34] J. C. Maxwell, “A Treatise on Electricity and Magnetism”, Vol.1, Oxford, 1873.
[35] K. Lichtenecker, “Die Ableitung der logarithmischen Mischungsregel aus dem
Maxwell-Rayleighschen Schrankenwertverfahren”, Kolloidchemische Beihefte, Vol.
23, Issue 1-9, pp. 285-291, 1926.
[36] D.A.G. Bruggeman, “Berechnung verschiedener physikalischer Konstanten von
heterogenen Substanzen”, Annals of Physics, Vol. 24, 636-679, Leipzig, 1935.
[37] J. S. M. Botterill, A. G. Salway, Y. Teoman, “The effective thermal conductivity of
high temperature particulate beds – II. Model predictions and the implication of the
experimental values”, International Journal of Heat and Mass Transfer, Vol. 32, pp.
595-609, Great Britain, 1989.
[38] H. W. Godbee, W. T. Ziegler, “Thermal conductivities of MgO, Al2O3, and ZrO2
powders to 850 ºC. II. Theoretical”, Journal of Applied Physics, Vol. 37, Issue 1,
pp. 56-65, 1966.

45
[39] H. W. Godbee, W. T. Ziegler, “Thermal conductivities of MgO, Al2O3, and ZrO2
powders to 850 ºC. I. Experimental”, Journal of Applied Physics, Vol. 37, Issue 1,
pp. 40-55, 1966.
[40] W. Schotte, “Thermal conductivity of packed beds”, AIChE J., Vol. 6, pp. 63–67,
1960.
[41] Special Metals Corporation, “Inconel Alloy 718SPF datasheet”, Publication nr. SMC-
096, September, 2004.
[42] Special Metals Corporation, “Inconel Alloy MA754 datasheet”, Publication nr. SMC-
040, September, 2004.
[43] “Thermophysical properties of materials for water cooled reactors”, IAEA-TECDOC-
949, Vienna, 1997.

46
III. Appendix A
Three tables indicate the trends in vessel failure time, melt mass and superheat for a single
parameter changing (liquid thermal conductivity, solidus and liquidus temperatures). Colors
indicate the trends that were observed- blue one represents decrease for a certain parameter
while red one stands for growth. The columns highlighted with bold show the major change
of a failure condition due to one input parameter modified.
k_liquid failure time melt mass melt superheat
k_solid = 0.5; T_solidus = 2128; T_liquidus = 2148
0.5 4.07 179.7 673.2
1.5 4.02 183.6 515.4
8.5 4.01 184 452.6
20 3.96 184.2 463
k_solid = 0.5; T_solidus = 2750; T_liquidus = 2770
0.5 4.15 148.3 390.4
1.5 4.19 158.5 320.7
8.5 4.22 164.7 277
20 4.21 165.6 267.3
k_solid = 1; T_solidus = 2750; T_liquidus = 2770
1 3.49 66.6 51.2
3 3.49 68 39
8.5 3.49 78.22 40.23
20 3.49 82.45 17.45
T_solidus failure time melt mass melt superheat
k_solid = 0.5; k_liquid = 20; T_liquidus = 2770
2000 3.44 98.7 412
2128 3.65 112.2 392.1
2450 4.03 165.9 301.3
2750 4.21 165.6 267.3
k_solid = 1; k_liquid = 3; T_liquidus = 2770
2000 3.41 78.6 355.8
2128 3.5 82 315.4
2450 3.52 83.5 40.23
2750 3.49 68 39
T_liquidus failure time melt mass melt superheat
k_solid = 0.5; k_liquid = 0.5; T_solidus = 2128
2148 4.07 179.7 673.2
2328 4.08 178.8 682.4
2528 4.07 177.6 661.6
2770 4.05 176.5 658.2
k_solid = 1; k_liquid = 3; T_solidus = 2000
2020 3.52 165.8 264.6
2200 3.5 162.9 251.0
2400 3.43 119.1 280.4
2770 3.41 78.6 355.8

47
IV. Appendix B
List of simulated cases with different debris/corium thermo-mechanical properties is
presented. Time to reach 20 % creep strain is considered as a global failure criterion.
Maximum vessel wall displacements, remelted material mass and superheat are presented for
this moment. Time to reach onset of accelerated creep and melting point for the IGT welding
material is provided in two last rows.
Ksolid Kliquid Tsolidus Tliquidus
Global failure time,
[h]
Maximum wall
displacement, [m]
Melt mass, [ton]
Melt superheat,
[K]
Time to reach
1100 K, [h]
Time to reach 1533-1673 K, [h]
0.5
0.5 2128
2148 4,07 0,077 179,7 673,2 0,72 1,26-1,42
2328 4,08 0,077 178,8 682,4 0,72 1,26-1,42
2528 4,07 0,078 177,6 661,6 0,72 1,26-1,42
2770 4,05 0,094 176,5 658,2 0,72 1,26-1,42
2750 2770 4,15 0,079 148,3 390,4 0,72 1,26-1,42
1.5 2128 2148 4,02 0,099 183,6 515,4 0,72 1,26-1,42
2750 2770 4,19 0,096 158,5 320,7 0,72 1,26-1,42
8.5 2128 2148 4,01 0,111 184 452,6 0,72 1,26-1,42
2750 2770 4,22 0,097 164,7 277 0,72 1,26-1,42
20
2000 2770 3,44 0,087 98,7 412 0,72 1,26-1,42
2128 2148 3,96 0,106 184,2 463 0,72 1,26-1,42
2770 3,65 0,098 112,2 392,1 0,72 1,26-1,42
2450 2770 4,03 0,111 165,9 301,3 0,72 1,26-1,42
2750 2770 4,21 0,096 165,6 267,3 0,72 1,26-1,42
1
1 2750 2770 3,49 0,074 66,6 51,2 0,76 1,28-1,46
3
2000
2020 3,52 0,087 165,8 264,6 0,76 1,28-1,46
2200 3,5 0,094 162,9 251 0,76 1,28-1,46
2400 3,43 0,082 119,1 280,4 0,76 1,28-1,46
2770 3,41 0,077 78,6 355,8 0,76 1,28-1,46
2128 2770 3,5 0,094 82 315,4 0,76 1,28-1,46
2450 2770 3,52 0,087 83,5 126 0,76 1,28-1,46
2750 2770 3,49 0,074 68 39 0,76 1,28-1,46
2750 2770 3,49 0,074 78,22 40,23 0,76 1,28-1,46
20 2128 2148 3,52 0,09 163 167,7 0,76 1,28-1,46
2750 2770 3,49 0,074 82,45 17,45 0,76 1,28-1,46
2 5
2128 2528 3,02 0,089 37,59 155,6 0,78 1,37-1,58
2450 2770 3,02 0,086 1,41 107,4 0,78 1,37-1,58
2750 2770 3,02 0,086 1,88 4,2 0,78 1,37-1,58
20 2128 2148 3,02 0,085 71,73 30,44 0,78 1,37-1,58

48
Ksolid Kliquid Tsolidus Tliquidus Failure time,
[h]
Maximum wall
displacement, [m]
Melt mass, [ton]
Melt superheat,
[K]
Time to reach
1100 K, [h]
Time to reach 1533-1673 K, [h]
3 6.3
2128 2148 2,78 0,088 21,4 15,3 0,81 1,49-1,76
2650 2770 2,79 0,089 1,3 24 0,81 1,49-1,76
20 2128 2148 2,78 0,088 21,4 14,1 0,81 1,49-1,76
4
3 2750 2770 2,64 0,088 0 - 0,85 1,68-2,05
8.5 2128 2148 2,64 0,088 8,4 13 0,85 1,68-2,05
2450 2770 2,64 0,088 1,2 40 0,85 1,68-2,05
20 2128 2148 2,64 0,088 8,4 13 0,85 1,68-2,05
6 6
2128 2148 2,47 0,082 3,6 8,3 0,96 -
2528 2,47 0,082 3,3 38,2 0,96 -
2750 2770 2,47 0,082 0 - 0,96 -
20 2128 2148 2,46 0,082 3,4 7,5 0,96
12 20 2750 2770 2,21 0,07 0,00 - - -
20 20 2128 2148 2,12 0,07 0,00 - - -
2750 2770 2,12 0,07 0 - - -