influence of frequency on compaction of sand in small-scale tests … · 2014-01-15 · influence...
TRANSCRIPT

Influence of Frequency on Compaction of Sand in Small-Scale Tests
Carl Wersäll
Licentiate Thesis Department of Civil and Architectural Engineering
Division of Soil and Rock Mechanics Royal Institute of Technology
Stockholm, 2013

ii
TRITA-JOB LIC 2023 ISSN 1650-951X

iii
Preface
This project was carried out between February 2011 and November 2013 at the Division of Soil and
Rock Mechanics, Department of Civil and Architectural Engineering, Royal Institute of Technology
(KTH) in Stockholm, Sweden. Supervisor was Prof. Stefan Larsson at KTH and assistant supervisor was
Dr. Nils Rydén at the Faculty of Engineering, Lund University (LTH) and PEAB AB.
The project was funded by the Development Fund of the Swedish Construction Industry (SBUF),
Dynapac Compaction Equipment AB, PEAB AB and KTH. Sincere thanks go to the funders, making this
project possible.
I would like to express my gratitude to the supervisor Prof. Stefan Larsson and to the assistant
supervisor Dr. Nils Rydén for their support, enthusiasm and guidance throughout the project.
Special thanks to Dr. Kent Lindgren at the Marcus Wallenberg Laboratory for Sound and Vibration
Research, KTH, for manufacturing and lending test equipment, calibrating measurement systems and
always being available for assistance in laboratory work. I would also like to thank Ingmar Nordfelt
and his colleagues at Dynapac for fruitful discussions and assistance in planning tests and evaluating
data. Dr. Anders Bodare and Dr. Rainer Massarsch at Geo Risk and Vibration Scandinavia AB have
provided valuable comments throughout the work. Their contributions are highly appreciated.
Furthermore, I would like to express my sincere gratitude to all my colleagues at the Division of Soil
and Rock Mechanics for valuable discussions and making my time at the department such an
enjoyable experience.
Finally, I would like to thank my family and my friends. Without their never‐ending support, this work
would not at all have been possible.
Stockholm, November 2013
Carl Wersäll

iv

v
Abstract
Vibratory rollers are commonly used for compaction of embankments and landfills. In a majority of
large construction projects, this activity constitutes a significant part of the project cost and causes
considerable emissions. Thus, by improving the compaction efficiency, the construction industry
would reduce costs and environmental impact. In recent years, rollers have been significantly
improved in regard to engine efficiency, control systems, safety and driver comfort. However, very
little progress has been made in compaction effectiveness. While the compaction procedure (e.g.
layer thickness and number of passes) has been optimized over the years, the process in which the
machine compacts the underlying soil is essentially identical to the situation in the 1970s.
This research project investigates the influence of one crucial parameter, namely vibration frequency
of the drum, which normally is a fixed roller parameter. Frequency is essential in all dynamic systems
but its influence on the compaction efficiency has not been studied since the early days of soil
compaction. Since laboratory and field equipment, measurement systems and analysis techniques at
the time were not as developed as they are today, no explicit conclusion was drawn. Frequency‐
variable oscillators, digital sensors and computer‐based analysis now provide possibilities to
accurately study this concept in detail.
In order to examine the influence of vibration frequency on the compaction of granular soil, small‐
scale tests were conducted under varying conditions. A vertically oscillating plate was placed on a
sand bed contained in a test box. The experiments were carried out in laboratory conditions to
maximize controllability. The first test setup utilized an electro‐dynamic oscillator where dynamic
quantities, such as frequency and particle velocity amplitude, could be varied in real‐time. The
second test setup included two counter‐rotating eccentric mass oscillators, where tests were
conducted at discrete frequencies. This type of oscillator has a force amplitude that is governed by
frequency.
The main objectives of the tests were to determine the optimal compaction frequency and whether
resonance can be utilized to improve compaction efficiency. Results showed that resonance had a
major influence in the electro‐dynamic oscillator tests, where the applied force amplitude is low, and
the optimal compaction frequency is the resonant frequency under these circumstances. In the
rotating mass oscillator tests, where a high force was applied to the plate, resonant amplification was
present but not as pronounced. Since force increase with frequency, the optimal frequency to obtain
the highest degree of compaction is very large. In a practical regard, however, frequency should be
kept as low as possible to minimize machine wear and emissions while still achieving a sufficient
compaction of the soil. Considering the practical issues, it is proposed that surface compactors
should operate slightly above the resonant frequency. However, the applicability to vibratory rollers
must be confirmed in full‐scale tests.
The thesis also presents an iterative method to calculate the frequency response of a vibrating plate,
incorporating strain‐dependent soil properties. Calculated dynamic quantities are compared to
measured values, confirming that the method accurately predicts the response.

vi

vii
Sammanfattning
Vibrationsvältar används normalt vid packning av fyllningar och väg‐ och järnvägsbankar. I merparten
av alla anläggningsprojekt utgör denna aktivitet en stor del av projektkostnaden och orsakar
betydande utsläpp. Genom att effektivisera packningsprocessen skulle därför byggbranschen kunna
minska kostnader och miljöpåverkan. Under senare år har vältar utvecklats med avseende på
motorer, kontrollsystem, säkerhet och förarkomfort. Dock har mycket lite utveckling skett av
packningseffektiviteten. Medan packningsförfarandet (t.ex. lagertjocklek och antal överfarter) har
optimerats under åren är processen i vilken maskinen packar underliggande jord identisk med
situationen på 1970‐talet.
Detta forskningsprojekt undersöker inflytandet av en grundläggande parameter, nämligen valsens
vibrationsfrekvens, vilken vanligtvis är en icke‐variabel vältparameter. Frekvensen är av avgörande
betydelse i alla dynamiska system men dess inflytande på packningseffektiviteten har inte
undersökts sedan jordpackningens barndom. Eftersom dåtidens laboratorie‐ och fältutrustning,
mätsystem och analysförfarande inte var så utvecklade som de är idag uppnåddes inga konkreta
slutsatser. Frekvensvariabla vibratorer, digitala mätsystem och datorbaserad utvärdering
tillhandahåller nu nya möjligheter för att studera detta koncept i detalj.
För att undersöka frekvensens betydelse vid packning av grovkornig jord utfördes småskaleförsök
under varierande förhållanden. En vertikalt vibrerande platta placerades på ett sandlager inneslutet i
en försökslåda. Experimenten utfördes i laboratoriemiljö för att maximera kontrollerbarheten. I den
första försöksuppsättningen användes en elektrodynamisk vibrator där dynamiska kvantiteter, såsom
frekvens och svängningshastighetsamplitud, kunde varieras i realtid. Den andra
försöksuppsättningen innefattade två vibratorer med motriktade roterande excentermassor och
försöken utfördes vid diskreta frekvenser. Denna typ av vibrator ger upphov till en kraftamplitud som
är frekvensberoende.
Försökens huvudsakliga syfte var att fastställa den optimala packningsfrekvensen och undersöka om
resonans kan godtyckliggöras för att förbättra packningseffektiviteten. Resultaten visade att
resonans hade en avgörande betydelse i försöken med den elektrodynamiska vibratorn, där
kraftamplituden är låg, och den optimala packningsfrekvensen är under dessa förutsättningar
resonansfrekvensen. Även i försöken med roterande excentermassor, där en hög kraftamplitud
anbringades plattan, uppstod resonansförstärkning, dock ej lika markant. Eftersom kraft ökar med
frekvens är den optimala packningsfrekvensen mycket hög. I praktiken bör dock frekvensen hållas så
låg som möjligt för att minimera maskinslitage och utsläpp, och samtidigt uppnå en tillräcklig
packning av jorden. Med hänsyn taget till de praktiska aspekterna föreslås att ytpackningsdon bör
arbeta något över resonansfrekvensen. Dock måste tillämpbarheten för vibrationsvältar bekräftas i
fullskaleförsök.
Avhandlingen presenterar också en iterativ metod för att beräkna frekvensresponsen av en
vibrerande platta, som tar hänsyn till töjningsberoende jordegenskaper. Beräknade dynamiska
kvantiteter jämförs med uppmätta värden och bekräftar att metoden framgångsrikt kan förutsäga
responsen.

viii

ix
List of Publications
The following papers are appended to the thesis:
Paper I
Wersäll, C. and Larsson, S., 2013, “Small‐Scale Testing of Frequency‐Dependent Compaction of Sand
Using a Vertically Vibrating Plate,” Geotechnical Testing Journal, Vol. 36, No. 3, pp. 1‐10.
Wersäll conducted the experiments, performed the analysis and wrote the paper. Larsson supervised
the work and assisted in interpreting the results and writing the paper.
Paper II
Wersäll, C., Larsson, S., Rydén, N. and Nordfelt, I., 2013, Frequency Variable Surface Compaction of
Sand Using Rotating Mass Oscillators, Submitted to Geotechnical Testing Journal in November 2013.
Wersäll conducted the experiments, performed the analysis and wrote the paper. Larsson supervised
the work and assisted in writing the paper. Rydén and Nordfelt assisted in interpreting the results and
provided valuable comments on planning the tests and writing the paper.

x

xi
Contents
Preface ..................................................................................................................................................... iii
Abstract .................................................................................................................................................... v
Sammanfattning ..................................................................................................................................... vii
List of Publications ................................................................................................................................... ix
List of Symbols ....................................................................................................................................... xiii
1 INTRODUCTION ................................................................................................................................ 1
1.1 Background .............................................................................................................................. 1
1.2 Objectives ................................................................................................................................ 3
1.3 Outline of Thesis ...................................................................................................................... 3
2 OSCILLATING FOUNDATIONS ON SOFTENING SOIL ......................................................................... 5
2.1 Single Degree of Freedom Systems ......................................................................................... 5
2.2 Vertically Oscillating Foundations ........................................................................................... 8
2.3 Soil Nonlinearity ...................................................................................................................... 9
2.4 Calculation of Foundation Response ..................................................................................... 13
3 DESCRIPTION OF SMALL‐SCALE TESTS ........................................................................................... 17
3.1 Tests with Electro‐Dynamic Oscillator ................................................................................... 17
3.2 Tests with Rotating Mass Oscillators ..................................................................................... 19
3.3 Results of Small‐Scale Tests ................................................................................................... 21
4 SUMMARY OF APPENDED PAPERS ................................................................................................. 23
4.1 Paper I .................................................................................................................................... 23
4.2 Paper II ................................................................................................................................... 23
5 CONCLUSIONS AND FURTHER RESEARCH ...................................................................................... 25
REFERENCES .......................................................................................................................................... 27

xii

xiii
List of Symbols
A Dimensionless stiffness coefficient
Bz Mass ratio
F Force
F0 Force amplitude
Fc Force in damper element
Fk Force in spring element
Fm Force in mass element
G Shear modulus
Gmax Small‐strain shear modulus
L Length of strained element
M Dynamic magnification factor for constant force
M’ Dynamic magnification factor for rotating mass oscillators
N Number of loading cycles
OCR Overconsolidation ratio
P Power
Pa Atmospheric pressure
PI Plasticity index
S Settlement of the plate
Wc Energy consumed in one cycle
a Acceleration
a0 Acceleration amplitude
c Damping coefficient
ccr Critical damping coefficient
cR Rayleigh wave speed
cS Shear wave speed
e Eccentricity
e Void ratio
d10 Diameter for 10 % passing
d60 Diameter for 60 % passing
f Frequency
fr Resonant frequency
gRMS RMS value of function g
k Spring stiffness
k Exponent depending on PI
m Mass
m0 Mass of foundation
me Eccentric mass
mee Eccentric moment
ms Apparent mass

xiv
n Exponent depending on stress state
r0 Footing radius
t Time
u Displacement
u0 Displacement amplitude
uA Nominal displacement amplitude
uLVDT Settlement of the plate
v Velocity
v0 Velocity amplitude
vLVDT Displacement velocity of the plate
w Water content
Vc Compacted volume
Vd Displaced volume
Empirical factor depending on PI
Dimensionless frequency
Empirical exponent depending on PI
Shear strain
r Reference shear strain
Compressive strain
Damping ratio
max Maximum damping ratio
Poisson’s ratio
Mass density
’0n Effective isotropic confining pressure
Shear stress
Circular frequency
n Circular natural frequency

INTRODUCTION
1
1 INTRODUCTION
1.1 Background
Soil compaction is the most common ground improvement method and is often necessary to reduce
settlement, increase stability and stiffness of the subgrade, control swelling and creep, lower the risk
of liquefaction and decrease the permeability. It implies densification of the soil by reducing its pore
volume. In granular soil, this is normally achieved by vibration or impact, producing stress‐waves that
rearrange the soil particles into a denser state. In construction of embankments and landfills, soil is
placed in layers and compacted using vibratory roller (Figure 1). This process is time‐consuming and
normally constitutes a significant part of the project cost as well as giving rise to considerable
emissions. It is thus in the interest of the industry to improve the compaction efficiency and reduce
the time for this activity.
As vibratory rollers became popular around the 1950s, the optimal compaction procedure became a
topic of research. One fundamental property that was investigated was the compaction frequency.
All rollers operate with rotating eccentric mass oscillators that produce increasing force amplitude
with frequency. However, all dynamic systems have a resonant frequency where vibrations are
amplified. For roller compaction, this is within the operating frequency of the roller and taking
advantage of this amplification might therefore be feasible. Several studies were conducted in the
early years of this research field (especially in the 1950s and 1960s), with varying results. However,
the available compaction equipment, measurement systems and evaluation techniques at the time
were far from what they are today. Frequency was normally varied by adjusting the speed of the
engine, which is a crude method for frequency variation. Since digital sensors or computers were not
Figure 1. Vibratory roller (courtesy of Dynapac Compaction Equipment AB).
INTRODUCTION
2
available, results were difficult to interpret. Furthermore, there are many aspects that affect the
results, not all of which were known at the time. First of all, a dynamic system behaves very
differently below, close to or above resonance. Hence, it is important to be aware of the compaction
frequency in relation to the resonant frequency. The acceleration amplitude is also of great
importance. Several authors have found that compaction should be performed at accelerations
above 1 g to be effective (D’Appolonia et al. 1969; Dobry & Whitman 1973). There are several other
aspects, such as dynamic‐to‐static load ratio, shape of the contact surface and soil properties. Due to
the complexity of the problem, the early studies had varying conclusions.
The first to propose a compactor, utilizing frequency to obtain the maximum degree of compaction
was Hertwig (1936). Tschebotarioff & McAlpin (1947) concluded that the subsidence of a piston,
vibrating on the soil was independent of frequency as long as the total number of cycles was
constant. However, the frequency in those tests was very low, less than 20 Hz. Bernhard (1952)
conducted laboratory tests with variable frequency and constant force, obtaining a more efficient
compaction at the resonant frequency. Converse (1953) conducted field compaction tests of sand
and also concluded that resonance could be utilized. Forssblad (1965) highlighted that in the tests by
Bernhard and Converse the dynamic load was only in the same order of magnitude as the static
weight and argued that the results could not be compared to roller compaction. Several other
authors found a correlation between resonance and increased compaction efficiency (Johnson &
Sallberg 1960; Lorenz 1960). Forssblad (1965) argued that the increase in force amplitude with
frequency would be too significant for the resonant amplification to influence the compaction effect
and that the technical difficulties for utilizing resonance would exceed the practical advantages. Thus,
there was no agreement among researchers on whether resonant amplification could be used to
improve roller compaction. There was, however, one conclusion on with the community agreed,
namely that effective compaction must be performed above the resonant frequency.
There have been many attempts to model the roller behavior by mathematical or numerical methods.
Yoo & Selig (1979) presented a lumped‐parameter model that formed the basis for most subsequent
models of roller behavior. These studies have mainly been conducted for the purpose of continuous
compaction control and intelligent compaction (e.g., Forssblad 1980; Thurner & Sandström 1980;
Adam 1996; Anderegg & Kaufmann 2004; Mooney & Rinehart 2009; Facas et al. 2011). Modeling the
dynamic behavior of compaction equipment is complicated by the fact that soil shows very nonlinear
stress‐strain behavior. Most models do not take this into account. However, Susante & Mooney
(2008) developed a model that includes nonlinear soil stress‐strain behavior, calculating the response
in time domain.
In the 1970s, computer programs using an equivalent linear approach to determine the nonlinear
seismic response during earthquakes, such as SHAKE (Schnabel et al. 1972), became popular. These
programs apply an iterative procedure to determine the nonlinear response of a transient time
history. As finite element and other numerical methods were introduced, these became dominating
in calculating the nonlinear response. However, numerical methods are time‐consuming and require
skilled operators to be reliable. Thus, equivalent linear methods are still useful but there has hardly
been any development of these concepts in recent years. No one has previously used this approach

INTRODUCTION
3
for calculating the nonlinear response of an oscillating foundation (such as surface compaction
equipment) on soil with strain‐dependent properties.
1.2 Objectives
This research project aims at determining the optimal compaction frequency of vibratory rollers and
to investigate whether resonance in the roller‐soil system can be utilized for increasing the
compaction efficiency. As a first step, the fundamental dynamic behavior during frequency‐variable
compaction is studied. The main objective of this thesis is to investigate the influence of frequency
on the compaction of sand in small‐scale tests. These are conducted under varying conditions to
quantify the effect of, not only frequency, but also type of oscillator, dynamic load and soil water
content. The small‐scale tests form a basis for full‐scale tests using vibratory roller.
Another objective is to develop an equivalent linear calculation procedure that can be performed in
frequency domain. These calculations are compared to results of the small‐scale tests.
1.3 Outline of Thesis
This thesis consists of an introductory part and two appended paper, one published in a peer‐
reviewed journal and the other submitted to the same journal. The introductory part is intended as
an introduction and a complement to the appended papers. It contains background information,
summary of the main findings and further development of some concepts that are included in the
papers.
Chapter 2 describes the fundamentals of dynamic single degree of freedom systems and vertically
oscillating foundations. The linear equivalent calculation procedure developed in Paper II is described
in detail. All necessary background information for understanding of this procedure is provided.
Chapter 3 is a description of the small‐scale tests. Since the tests are described thoroughly in the
papers, this chapter summarizes briefly the test setups and provides additional photographs of the
equipment. The test results of the two papers are summarized and discussed in relation to each
other.
Chapter 4 contains a summary of the appended papers.
Chapter 5 provides the main conclusions of the thesis and papers and suggests further research.

INTRODUCTION
4

OSCILLATING FOUNDATIONS ON SOFTENING SOIL
5
2 OSCILLATING FOUNDATIONS ON SOFTENING SOIL
Studies on vibrating foundations began with the objective to analyze ground vibrations from rotating
machinery founded on the ground surface. This has become the basis for dynamic soil‐structure
interaction analysis, including many more applications than just rotating machinery, such as wind
turbines and bridge abutments subjected to traffic load. This chapter describes how basic equations
for vibrating foundations can be combined with empirical knowledge for nonlinear stress‐strain
behavior of soil to predict the dynamic response of vibrating foundations on softening soil. Since this
thesis deals with vertical oscillations on granular soil, other oscillatory motions or plastic soils are not
treated herein. For other vibration modes, such as rocking or horizontal oscillation, reference is made
to Richart et al. (1970) and Gazetas (1983).
2.1 Single Degree of Freedom Systems
The dynamic behavior of a vertically oscillating foundation can be estimated by analyzing a single
degree of freedom (SDOF) system consisting of a mass, a dashpot and a spring, where the force in
these three components are proportional to acceleration, velocity and displacement, respectively.
The forces in each element (Fm, Fc and Fk) are determined by Equations 1 to 3.
(1)
(2)
(3)
where m is mass, a is acceleration, c is damping coefficient, v is vibration velocity, k is spring stiffness
and u is displacement. Since the velocity is given by and the acceleration is given by ,
and since all forces need to be in equilibrium, a SDOF system can be described by the second order
differential equation presented in Equation 4.
(4)
where F t is the externally applied force. The system may be either under‐damped, critically
damped or over‐damped depending on if the damping coefficient is less than, equal to or larger than
the critical damping coefficient ccr. The ratio between these is denoted damping ratio, , and is shown in Equation 5.
2√ (5)
All dynamic systems have one or several natural frequencies. The circular natural frequency, n, of a
SDOF system is calculated by Equation 6.

OSCILLATING FOUNDATIONS ON SOFTENING SOIL
6
(6)
It is convenient to express frequency normalized by the natural frequency, the so‐called
dimensionless frequency, , as shown in Equation 7.
(7)
where is the circular frequency. For a harmonic external load, the solution to Equation 4 may then
be expressed by Equation 8.
1
1 2 (8)
where u0 is displacement amplitude and F0 is force amplitude. The dynamic displacement in relation
to the displacement that would be obtained from static loading by the same force is called dynamic
magnification factor. It is calculated by Equation 9 and shown in Figure 2 for different values of the
damping ratio.
1
1 2 (9)
When the frequency approaches zero, the magnification factor approaches unity. As the excitation
frequency approaches the natural frequency, the dynamic response is significantly magnified. The
Figure 2. Dynamic magnification factor for constant force and different damping ratios.
0 0.5 1 1.5 2 2.5 30
1
2
3
4
5
6
Dimensionless frequency, (-)
Dyn
am
ic m
ag
nifi
catio
n fa
cto
r, M
(-) 0%
10%
20%
30%
50%
200%
100%
OSCILLATING FOUNDATIONS ON SOFTENING SOIL
7
frequency where maximum magnification occurs is the resonant frequency, which is equal to the
natural frequency when damping is zero and slightly lower as the damping ratio becomes larger.
When the frequency is increased above resonance, the magnification factor (and thus the
displacement amplitude) decreases and approaches zero for large frequencies. If the damping ratio is
zero, the resonant amplification is infinite. This is an unrealistic case as there are no real systems
without damping. However, for a damping ratio of 10 %, which represents quite high damping, the
resonant amplification is still as high as 5 times the static value. The damping ratios of 20‐30 % shown
in the figure are uncommon but can occur for example during large strain in soil, as will be discussed
below.
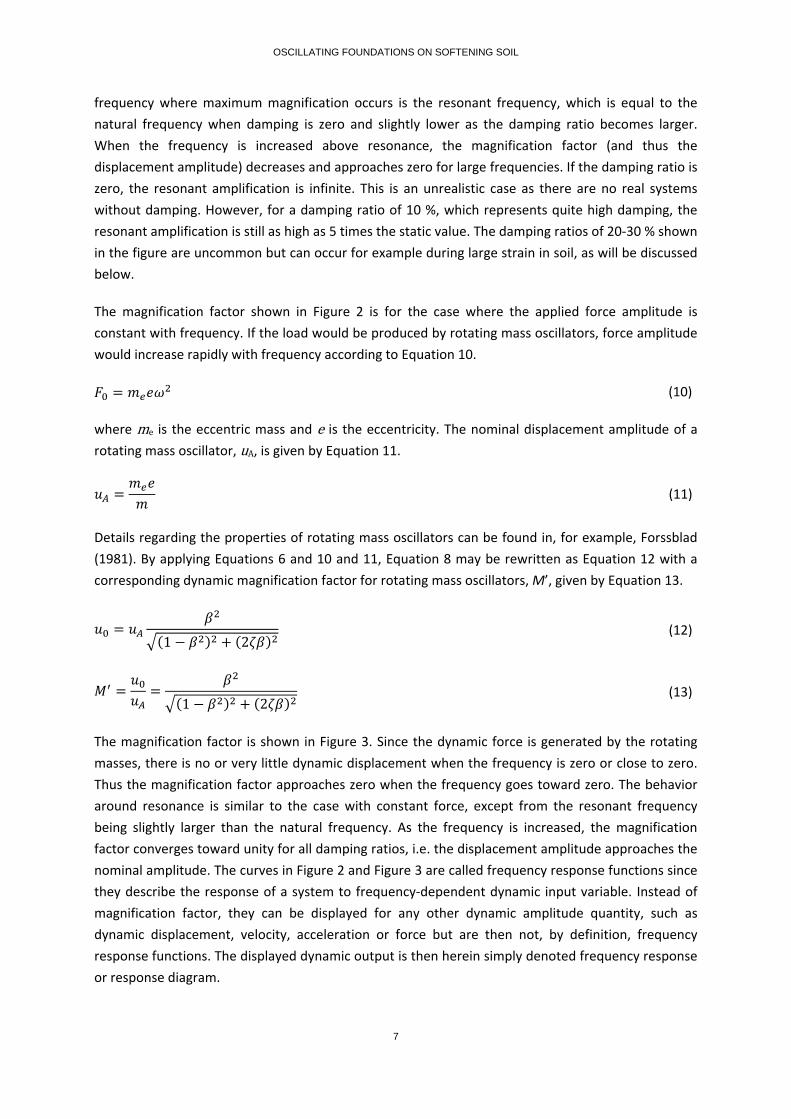
The magnification factor shown in Figure 2 is for the case where the applied force amplitude is
constant with frequency. If the load would be produced by rotating mass oscillators, force amplitude
would increase rapidly with frequency according to Equation 10.
(10)
where me is the eccentric mass and e is the eccentricity. The nominal displacement amplitude of a
rotating mass oscillator, uA, is given by Equation 11.
(11)
Details regarding the properties of rotating mass oscillators can be found in, for example, Forssblad
(1981). By applying Equations 6 and 10 and 11, Equation 8 may be rewritten as Equation 12 with a
corresponding dynamic magnification factor for rotating mass oscillators, M’, given by Equation 13.
1 2 (12)
1 2 (13)
The magnification factor is shown in Figure 3. Since the dynamic force is generated by the rotating
masses, there is no or very little dynamic displacement when the frequency is zero or close to zero.
Thus the magnification factor approaches zero when the frequency goes toward zero. The behavior
around resonance is similar to the case with constant force, except from the resonant frequency
being slightly larger than the natural frequency. As the frequency is increased, the magnification
factor converges toward unity for all damping ratios, i.e. the displacement amplitude approaches the
nominal amplitude. The curves in Figure 2 and Figure 3 are called frequency response functions since
they describe the response of a system to frequency‐dependent dynamic input variable. Instead of
magnification factor, they can be displayed for any other dynamic amplitude quantity, such as
dynamic displacement, velocity, acceleration or force but are then not, by definition, frequency
response functions. The displayed dynamic output is then herein simply denoted frequency response
or response diagram.

OSCILLATING FOUNDATIONS ON SOFTENING SOIL
8
2.2 Vertically Oscillating Foundations
The previous section described fundamental dynamic properties of SDOF systems. This section
focuses on calculation of the dynamic response of a vertically oscillating foundation on an elastic
half‐space, as described by Lysmer & Richart (1966). For horizontal or rocking motion, see Hall (1967),
and for torsion, see Richart et al. (1970). Gazetas (1983) presented equations for foundations on
layered soil. Model tests have been conducted to experimentally determine the response of
oscillating foundations under various conditions (e.g. Novak 1970; Baidya & Murali Krishna 2001;
Mandal et al. 2012).
Lysmer & Richart (1966) showed how the behavior a vertically oscillating foundation on an elastic
half‐space can be simulated by a SDOF model, where spring stiffness and damping ratio are given by
Equations 14 and 15.
41
(14)
0.425 (15)
where G is soil shear modulus, r0 is the footing radius, is Poisson’s ratio of the soil and Bz is the mass ratio obtained by Equation 16.
14
(16)
Figure 3. Dynamic magnification factor for rotating mass oscillators and different damping ratios.
0 0.5 1 1.5 2 2.5 30
1
2
3
4
5
6
Dimensionless frequency, (-)
Ma
gn
ifica
tion
fact
or,
M' (
-)0%
10%
20%
30%
50%
100%
200%

OSCILLATING FOUNDATIONS ON SOFTENING SOIL
9
where m is the total mass and is the mass density of the soil. The total mass consists of two
components. One is the mass of the foundation, m0, including any external static load on it. The
other part is called apparent mass, ms, which corrects for the fact that stiffness decreases with
frequency (Gazetas 1983). Different equations exist for calculating the apparent mass. In this study it
becomes very small and is thus neglected. The total mass is given by Equation 17 and one expression
for the apparent mass is given by Equation 18.
(17)
1.081
(18)
By applying the above equations to the SDOF model presented in the previous section, the dynamic
behavior of a vertically oscillating foundation can be estimated. The main limitation with this and
many other studies on the subject is the assumption that the subgrade is elastic. Since the stress‐
strain behavior of soil (especially non‐plastic soil) is highly nonlinear, this simplification can lead to
very large discrepancies between calculated and real dynamic responses. Soils with high plasticity,
however, behave more elastic and the implications of treating the soil as perfectly linear are thus less
severe. Nonlinear stress‐strain behavior of soil, and a method to take these properties into account,
is explained below.
2.3 Soil Nonlinearity
Deformation behavior of granular soil is often modeled by a hyperbolic stress‐strain formulation
(Kondner 1963a; Kondner 1963b; Hardin & Drnevic 1972a; Hardin & Drnevic 1972b). The hyperbolic
shear stress is given by Equation 19.
1 (19)
where Gmax is the small‐strain shear modulus, is the shear strain and r is a reference strain. At very low strains the shear modulus is at its maximum, hence the denotation Gmax. Equation 19 describes the so‐called backbone curve (also called virgin curve or skeleton curve), which applies to virgin
loading. When soil is subjected to cyclic loading, the stress‐strain relationship forms a hysteresis loop
often modeled by Masing Rule (Masing 1926), which implies magnifying the backbone curve by a
factor of two during unloading and reloading. The backbone curve and hysteresis loop are shown in
Figure 4.

OSCILLATING FOUNDATIONS ON SOFTENING SOIL
10
The small strain shear modulus can be estimated by Equation 20 according to Hardin (1978).
∙0.3 0.7
′ (20)
where A and n are a dimensionless parameters, OCR is the overconsolidation ratio, k is a parameter
depending on plasticity index (PI), e is the void ratio, Pa is the atmospheric pressure (100 kPa) and ′
is the effective isotropic confining pressure. Equation 20 is often seen with fixed values of A and n. However, these parameters vary with soil type and applying the equation with fixed values can thus
be misleading. Studies investigating the values of the above parameters (e.g. Stokoe et al. 1999) have
found A to vary in wide interval and n to vary slightly.
As can be seen in Figure 4, stiffness decreases with strain. Many authors have studied the strain‐
softening effect on the shear modulus (Seed et al. 1986; Vucetic & Dobry 1991; Rollins et al. 1998;
Stokoe et al. 1999; Assimaki et al. 2000; Kausel & Assimaki 2002; Tatsuoka et al. 2003; Massarsch
2004; Zhang et al. 2005, among others). In the hyperbolic formulation described above, the shear
modulus G decreases according to Equation 21.
1
1 (21)
Figure 4. Normalized hyperbolic stress‐strain relationship.
-3 -2 -1 0 1 2 3-0.8
-0.6
-0.4
-0.2
0
0.2
0.4
0.6
0.8
/r
/(Gmax
r)
Backbone curve
Hysteresis loop

OSCILLATING FOUNDATIONS ON SOFTENING SOIL
11
The reference strain is a curve‐fitting parameter that depends on soil properties. It represents the
strain at which the shear modulus has half the value of the small strain shear modulus. As shear
strain increases, it affects not only the shear modulus, but also the damping ratio increases
significantly. Hardin & Drnevic (1972b) proposed the formulation for damping ratio presented in
Equation 22.
1 (22)
where max is the maximum damping ratio, which depends on the soil type and number of loading
cycles N. Equation 23 shows the maximum damping ratio (in percent) for clean dry sand and
Equation 24 presents the same parameter for saturated sand.
33 1.5log (23)
28 1.5log (24)
Rollins et al. proposed a model for shear modulus, Equation 25, and damping ratio, Equation 26,
based on tests conducted on gravel.
1
1.2 16| | 1 10 | | (25)
0.8 18 1 0.15| | . . (26)
There is an apparent uncertainty in Rollins’ equations. The shear modulus reduction ratio does not
approach one for small strains due to the factor 1.2 in the denominator. As the ratio has to become
unity for zero strain, the most obvious assumption is that this is a misprint in the paper.
A further formulation for shear modulus was proposed by Massarsch (2004), as presented in
Equation 27.
1
1 | | 1 10 | | (27)
where and are empirical factors depending on PI. The variation of and are shown in Figure 5. The study was conducted with focus on fine‐grained soils and thus no values are available for PI less
than 10 %. However, Stokoe et al. (1999) found that strain‐softening relationships of natural non‐
plastic soils and soils with low plasticity are very similar. The behavior of granular soil (non‐plastic)
can thus be estimated by applying values for PI = 10 %.

OSCILLATING FOUNDATIONS ON SOFTENING SOIL
12
The shear modulus reduction ratios according to Equations 21, 25 and 27 are shown in Figure 6. A
reference strain of 0.05 % was chosen, which is a typical value for sand (Stokoe et al. 1999). A
modified version of Rollins’ equation is also shown, where the term 1.2 has been replaced by 1.0. The
reduction according to Massarsch is very similar to Hardin & Drnevic at low strains but implies slightly
higher values of the shear modulus at large strains. The original expression by Rollins et al. is
obviously not correct at small strains. The modified equation shows smaller shear modulus than the
other expression at small and moderate strains, while larger at quite high strain level and similar to
the other curves at very high strains.
Figure 7 shows the damping ratio calculated by Equation 26 (Rollins et al.), Equations 22 and 23
(Hardin & Drnevic, dry sand, first loading cycle) and Equations 22 and 24 (Hardin & Drnevic, saturated
sand, first loading cycle). Seed et al. (1986) compiled results from many laboratory and field studies
for strain‐dependent damping ratio of sand. Equation 22 (using the reference strain 0.05 %, as above)
is fitted to that data and shown in the same figure. The data from Seed et al. show a damping ratio
close to that of clean saturated sand according to Hardin & Drnevic. For clean dry sand, the damping
ratio is higher. The curve from Rollins et al. has a significantly lower damping ratio at high strains. All
curves based on hyperbolic strain have one major disadvantage, namely that they approach zero for
small strains. Since the damping ratio always is greater than zero, these models are unreliable at
small strains.
Figure 5. Variation of and with PI (after Massarsch 2004).
10 20 30 40 50 60 70 800
1
2
3
4
5
6
7
8
9
10
Plasticity Index, PI (%)
0
0.15
0.3
0.45
0.6
0.75
0.9
1.05
1.2
1.35
1.5

OSCILLATING FOUNDATIONS ON SOFTENING SOIL
13
2.4 Calculation of Foundation Response
The expressions given in Sections 2.1 and 2.2 can be used to calculate the frequency response for a
vertically oscillating foundation on an elastic half‐space. However, this is usually not sufficient for
capturing the dynamic behavior of foundations on softening soil unless the strains are very small or
the soil is highly plastic, as discussed above. During vibratory compaction, the case is normally the
Figure 6. Strain‐softening by different models.
Figure 7. Comparison of damping ratio by different models.
0.0001 0.001 0.01 0.1 10
0.2
0.4
0.6
0.8
1
Shear Strain, (%)
No
rma
lize
d S
he
ar
Mo
du
lus,
G/G
max
(-)
Rollins et al. (1998)Modified Rollins et al.Massarsch (2004)Hardin & Drnevic (1972b)
0.0001 0.001 0.01 0.1 10
5
10
15
20
25
30
35
Shear Strain, (%)
Da
mp
ing
ra
tio,
(%
)
Rollins et al. (1998)Hardin & Drnevic (1972b),dry sandHardin & Drnevic (1972b),saturated sandSeed et al. (1986)

OSCILLATING FOUNDATIONS ON SOFTENING SOIL
14
opposite, i.e. very large strains and non‐plastic soil. This section describes a simple method to
incorporate strain‐softening behavior into the calculation of frequency response, proposed by
Wersäll et al. (2013). The procedure is explained in relation to the small‐scale tests conducted with
rotating mass oscillators described in Chapter 3 but is equally applicable to oscillations of other types
of foundations under different dynamic load.
The first step is to determine the uncorrected displacement amplitude frequency response. This is
done by first estimating the shear wave speed, cS, and the mass density of the soil. The small‐strain
shear modulus can then be calculated by Equation 28.
(28)
Note that the shear wave speed in Equation 28 represents that at small strain and that it will
decrease at larger strains. The small‐strain shear wave speed can be measured by, for example,
seismic tests. Alternatively, the small‐strain shear modulus can be estimated directly by Equation 20.
Determining Poisson’s ratio of the soil and knowing the radius and mass of the foundation, the spring
stiffness and damping ratio can be calculated by Equations 14‐16. Depending on the relative size of
the calculated apparent mass, it may be neglected and the mass of the foundation can be adopted as
the total mass. Since the stiffness varies with frequency, each point on the curve will have a different
natural frequency. The natural and dimensionless frequencies are calculated by Equations 6 and 7.
Normally, the eccentric moment of the oscillator, mee, is known and the force amplitude can thus be
calculated by Equation 10 for the frequency range of interest. The uncorrected frequency response
for displacement amplitude is then obtained by Equation 8.
The next step is to calculate the shear strain in the soil. Each point in the response diagram
represents a value of vertical displacement amplitude. This must first be converted to compressive
strain and then to shear strain. Since a single value of strain is necessary for each frequency, strain
must be assumed to be evenly distributed down to a certain depth. However, strain is not constant
over depth but can rather be assumed to follow the Boussinesq distribution shown in Figure 8
(assuming the soil moduli are constant over depth). Figure 8 shows conceptually how the Boussinesq
strain distribution can be approximated as triangular and then further simplified to a rectangular
distribution.

OSCILLATING FOUNDATIONS ON SOFTENING SOIL
15
The depth to which the simplified rectangular strain distribution extends must thus be assumed,
which gives the length of the strained element, L. The compressive strain, , can then be calculated for each frequency by Equation 29 by using the displacement given by the response diagram.
(29)
By assuming axisymmetric conditions, the shear strain is calculated by Equation 30 (Atkinson &
Bransby 1978).
23
1 (30)
After the shear strain has been obtained, new strain‐dependent values of the shear modulus and
damping ratio can be calculated for every frequency by a suitable formulation. In this study, Equation
27 was applied for shear modulus and Equation 22 for damping ratio. The maximum damping ratio
was assumed to be 33 %, based on Equation 23.
The new shear modulus and damping ratio are then used, applying the same procedure, to calculate
the frequency response for displacement, compressive strain and shear strain. The new shear strain
again yields new values of the shear modulus and damping ratio and the process is repeated. This is
iterated until the response diagrams converge with sufficiently small variations between iterations,
for each value of frequency. The final displacement function then gives the frequency response for
velocity amplitude v0, acceleration amplitude a0 and force amplitude by Equations 31 to 33.
Figure 8. Simplification of Boussinesq strain to evenly distributed strain.
0
0
Strain
D
ep
th
BoussinesqTriangularRectangular

OSCILLATING FOUNDATIONS ON SOFTENING SOIL
16
(31)
(32)
(33)

DESCRIPTION OF SMALL-SCALE TESTS
17
3 DESCRIPTION OF SMALL-SCALE TESTS
Small‐scale compaction tests were conducted in laboratory environment. The tests were divided over
two main setups and several test series. An electro‐dynamic oscillator was used in the first setup,
creating high controllability. The second setup utilized rotating mass oscillators with less
controllability but higher resemblance to field conditions. Both setups were purpose‐built for the
tests. Since the tests are described in detail in the appended papers, this chapter provides only a
summary of the test setups and results.
Sand was placed in a box having inner measurements 1100 mm x 700 mm x 370 mm (width x length x
height). The boundaries were coated with 30 mm of expanded polystyrene to reduce vibration
reflections and the bottom of the box consisted of the concrete floor below the box. The filling
method is crucial to obtain similar test conditions as it has a strong influence on the initial density of
the sand (Rad & Tumay 1987). Due to the large number of tests and the large sand volume, the
material was filled by pouring. Since there was no target density but rather a similar density in all
tests that was important, this method was considered sufficient. Other more precise methods, such
as raining, would be unrealistically time‐consuming. The pouring was performed in the same way by
the same person to minimize any differences in initial density.
3.1 Tests with Electro-Dynamic Oscillator
This type of oscillator consists of a static mass and a significantly smaller oscillating mass on top. In
the first setup, shown in Figure 9, the static mass was connected to a steel rod with a circular steel
plate, 84 mm in diameter, at the other end. The rod was running through two low‐friction
polytetrafluoroethylene (Teflon) rings, allowing the rod to move only in the vertical direction. The
plate was placed directly on the sand surface. The advantage with an electro‐dynamic oscillator is
that dynamic quantities can be adjusted in real‐time, thus making the tests very controllable. The
system can be illustrated as a coupled mass‐spring‐dashpot model, shown in Figure 10. The dynamic
force F(t) is generated in the spring between the oscillating and static masses. Since the oscillating
mass is much smaller than the static mass, the soil response does not influence its vibrations, which
means that measurements on the oscillating mass are independent of soil‐compactor resonances.
This provides the opportunity to conduct tests under constant dynamic load. The total mass of the
vertically moving system was 37.4 kg.
One accelerometer was placed on the oscillating mass and one on the static mass. A force transducer
was placed between the plate and the rod measuring the reaction force. Furthermore, the rod was
connected to a linear variable differential transformer (LVDT), measuring the vertical settlement of
the plate. Acceleration signals from the accelerometers were integrated in the amplifiers so that
particle velocity was recorded. An external amplifier controlled the amplitude of the oscillator and
the frequency was adjusted by a function generator. Geophones were placed in the sand, on the box
perimeter and on the concrete floor. A vertical accelerometer was buried in the sand, 20 cm below
the plate.

DESCRIPTION OF SMALL-SCALE TESTS
18
(a)
(b)
(c)
(d)
(e)
(f)
Figure 9. Tests with electro‐dynamic oscillator. (a) Preparation of test box. (b) Preloading. (c) The
complete test setup. (d) Settlement and heave after compaction. (e) Measurement with geophones
inside and outside of the test box. (f) Test for investigation of soil displacement.

DESCRIPTION OF SMALL-SCALE TESTS
19
Figure 10. Representation of tests with the electro‐dynamic oscillator as a coupled mass‐spring‐
dashpot system.
Each test was conducted with frequency sweep and a constant particle velocity on the moving mass.
The frequency was controlled by the function generator and the velocity amplitude was adjusted
manually on the oscillator amplifier. The measured acceleration signal was integrated and plotted on
a computer screen in real‐time for adjusting the amplitude. The tests are described thoroughly in
Wersäll and Larsson (2013).
3.2 Tests with Rotating Mass Oscillators
To obtain conditions that are more similar to those during roller compaction, a new compactor was
manufactured using two rotating mass oscillators together giving rise only to a vertical component.
Except for the new type of oscillators, the equipment, shown in Figure 11, was very similar as in the
previous small‐scale tests. A mass‐spring‐dashpot representation would here only include one mass
where the force is directly applied. An accelerometer was mounted on the bottom plate and a force
transducer was placed between the plate and the rod. In the same manner as the previous tests, the
vertical settlement was measured by an LVDT. In some tests, geophones were placed in the sand and
on the box perimeter or outside the box. The mass of the vertically moving system was 28.8 kg.
The tests, described in Wersäll et al. (2013), were conducted at discrete frequencies, i.e. not using
frequency sweep as in the previous tests. The sand was replaced between each test. When using
rotating mass oscillators, the eccentric moment is constant and the applied force increases with the
square of frequency. It was thus not possible to control particle velocity or any other dynamic
quantity. This is true also for compaction with vibratory roller. In each test, the sand was compacted
for 30 seconds and the settlement was recorded.

DESCRIPTION OF SMALL-SCALE TESTS
20
(a)
(b)
(c)
(d)
(e)
(f)
Figure 11. Tests with rotating mass oscillators. (a) Test setup. (b) Oscillators with protective caps
removed. (c) Preloading by vibrating a wooden plate. (d) After completion of a test on dry sand. (e)
After completion of a test on wet sand. (f) Imprint in wet sand after test and removal of the plate.

DESCRIPTION OF SMALL-SCALE TESTS
21
3.3 Results of Small-Scale Tests
In the tests using the electro‐dynamic oscillator, compaction was significantly enhanced close to the
resonant frequency with hardly any compaction sufficiently below or above this frequency. The tests
with rotating mass oscillators, on the other hand, showed a more complex relationship between
frequency and compaction. The applied force increased with frequency, producing a very high degree
of compaction at the higher frequencies and hardly any compaction at the low frequencies. In the
mid‐range, however, there was a resonant amplification, which was quite modest compared to the
amplification in the previous tests. The main differences between the two test setups were the
following:
The dynamic load in comparison with the static weight.
The variation of input load with frequency – constant particle velocity in the first test setup
and force increasing with the square of frequency in the second setup.
Higher dynamic loads in the second setup.
The difference in resonant amplification originates from the differences between tests, as listed
above. Since the dynamic‐to‐static load ratios are significantly lower than one and far above one,
respectively, the fundamental dynamic behavior is essentially different. Furthermore, since force is
increasing drastically with frequency during operation of the rotating mass oscillators, resonant
amplification becomes less pronounced. The most influential aspect, however, is most likely the high
dynamic load, giving rise to large strains, which produces a significant reduction in the soil stiffness
while the damping ratio increases, as has been explained in Section 2.3. This causes the curve to
flatten out (Wersäll et al. 2013). The effect of increased damping ratio can be understood by
observing Figure 3. In spite of the modest amplification at resonance, it is probable that this effect
can be utilized in compaction by vibratory roller, as has been discussed in Paper II.
Frequency response of dynamic quantities was calculated by the equivalent linear calculation
procedure described in Chapter 2. When parameters of the rotating mass oscillator tests were
applied to the equations, the results matched measured data well. The conclusion is thus drawn that
this method accurately can predict the dynamic behavior of oscillating foundations during
compaction or other applications where large strains are involved.

DESCRIPTION OF SMALL-SCALE TESTS
22

SUMMARY OF APPENDED PAPERS
23
4 SUMMARY OF APPENDED PAPERS
4.1 Paper I
Small‐Scale Testing of Frequency‐Dependent Compaction of Sand Using a Vertically Vibrating Plate
Carl Wersäll and Stefan Larsson
Published in ASTM Geotechnical Testing Journal 2013:36(3)
The paper presents results from 85 small‐scale tests that were conducted using a vertical electro‐
dynamic oscillator, connected to a plate and placed on a sand bed. Frequency was adjusted
continuously to assess its influence on compaction of the underlying sand. The results showed that
the rate of compaction with this type of compactor is significantly magnified at, and close to, the
resonant frequency. The results indicated that velocity amplitude is a crucial quantity in obtaining
sufficient compaction in for the test setup used. While a large velocity amplitude gave rise to a large
degree of compaction, it also caused significant soil displacement and heave. Tests showed that
compaction is closely related to strain‐softening since the strain above which moduli start to
decrease coincides with the strain required for compaction of the soil.
4.2 Paper II
Frequency Variable Surface Compaction of Sand Using Rotating Mass Oscillators
Carl Wersäll, Stefan Larsson, Nils Rydén and Ingmar Nordfelt
Submitted to ASTM Geotechnical Testing Journal in November 2013
The objective of this paper is to study the influence of frequency in compaction tests using rotating
mass oscillators. Results from 105 small‐scale tests, conducted using a vertically oscillating plate, are
presented. The soil underlying the plate was dry sand, or sand close to the optimum water content.
The results showed that there is a resonant amplification, providing slightly higher degree of
compaction. Most effective compaction is obtained at very high frequencies. The paper discusses the
implications for roller compaction and suggests that a slightly lower frequency may prove more
efficient. An iterative method for calculating dynamic response of the plate, incorporating strain‐
dependent properties of the soil, is also presented. The calculated frequency response agrees well
with measured quantities.

SUMMARY OF APPENDED PAPERS
24

CONCLUSIONS AND FURTHER RESEARCH
25
5 CONCLUSIONS AND FURTHER RESEARCH
This thesis presents results from small‐scale tests using a vertically oscillating plate. Two test setups
were manufactured, the first using an electro‐dynamic oscillator and the second utilizing two rotating
mass oscillators. The frequency response was calculated by combining theory for vibrating
foundations on elastic half‐space with an iterative procedure for estimating strain‐dependent
properties of soil. The main conclusions of all studies incorporated in this thesis are listed below:
Soil compaction by a vibratory plate is frequency‐dependent, providing an amplified degree
of compaction close to the resonant frequency.
The resonant amplification is more modest during compaction using a high dynamic force,
mainly due to large strain causing high damping and strain‐softening.
The small‐scale tests using an electro‐dynamic oscillator gave quite a large amount of soil
displacement and heave while these were small in the rotating mass oscillator tests.
No dynamic quantity is solely governing for the degree of compaction.
The water content of the soil has no apparent effect on the dynamic behavior of the
vibrating plate or on the frequency dependence of compaction. It does, however, have
positive effect on the degree of compaction.
Compaction is closely related to strain‐softening. The strain level, above which the stiffness
of the soil starts to decrease, coincides with the strain required to obtain rearrangement of
soil particles.
The proposed method to calculate frequency response captures well the measured dynamic
behavior the second small‐scale test.
The settlement velocities in all tests using the electro‐dynamic oscillator are shown in Figure 12. A
higher velocity implies a higher rate of compaction. The total settlement in the tests using the
rotating mass oscillators is shown in Figure 13. The figures illustrate the frequency dependence of
compaction using the different equipment.
The results above are valuable for a fundamental understanding of soil compaction and also for the
dynamics of oscillating foundations. To develop this further and to make it practically applicable to
compaction using vibratory roller, the following proposals for further research are suggested:
Investigate the influence of changing the eccentricity, i.e. the dynamic force, in rotating mass
oscillator tests.
Investigate the influence of sand layer thickness and stiffness of the subsoil.
Compare calculated frequency response to small‐scale tests with electro‐dynamic oscillator
and to other practical applications.
Do extensive full‐scale tests with vibratory roller, compacting granular soil at discrete
frequencies, but in a wide frequency span.
Simulate the small‐scale tests and roller compaction by distinct element modeling.

CONCLUSIONS AND FURTHER RESEARCH
26
Figure 12. Displacement velocity in tests using electro‐dynamic oscillator. Modified after Wersäll and Larsson (2013).
Figure 13. Total settlement in tests using rotating mass oscillators. From Wersäll et al. (2013).
0 50 100 150 200 250 300-0.2
0
0.2
0.4
0.6
0.8
Frequency (Hz)
Se
ttle
me
nt v
elo
city
(m
m/s
)
0 20 40 60 80 1000
10
20
30
40
50
60
Frequency (Hz)
Se
ttle
me
nt (
mm
)
Dry sandWet sand

27
REFERENCES
Adam, D., 1996., Flächendeckende Dynamische Verdichtungskontrolle (FDVK) mit Vibrationswalzen
[Continuous Compaction Control with Vibratory Rollers], PhD thesis, University of Vienna, Vienna,
Austria, 267 p., (in German).
Anderegg, R. and Kaufmann, K., 2004, “Intelligent Compaction with Vibratory Rollers,”
Transportation Research Record. 1868, Transportation Research Board, Washington, D.C., pp. 124–
134.
Assimaki, D., Kausel, E., and Whittle, A., 2000, ”Model for Dynamic Shear Modulus and Damping for
Granular Soils.” Journal of Geotechnical and Geoenvironmental Engineering, Vol. 126, No. 10, pp.
859–869.
Atkinson, J. H., Bransby, P. L., 1978, The Mechanics of Soils: An Introduction to Critical State Soil
Mechanics, McGraw‐Hill, London, 375 p.
Baidya, D. K. and Murali Krishna, G., 2001, “Investigation of Resonant Frequency and Amplitude of
Vibrating Footing Resting on a Layered Soil System,” Geotechnical Testing Journal, Vol. 24, No. 4, pp.
409–417.
Bernhard, R. K., 1952, “Static and Dynamic Soil Compaction,” Highway Research Board Proceedings,
Vol. 31, pp. 563–592.
Converse, F. J., 1953, “Compaction of Sand at Resonant Frequency,” ASTM Special Technical
Publication, No. 156, pp. 124–137.
D’Appolonia, D. J., Whitman, R. V. and D’Appolonia, E., 1969, “Sand Compaction with Vibratory
Rollers,” Journal of the Soil Mechanics and Foundations Division, Vol. 95, No. 1, pp. 263–284.
Dobry, R. and Whitman, R. V., 1973, “Compaction of Sand on a Vertically Vibrating Table,” Evaluation
of Relative Density and Its Role in Geotechnical Projects Involving Cohesionless Soils, ASTM Special
Technical Publication, No. 523, pp. 156–170.
Facas, N. W., Rinehart, R. V. and Mooney, M. A., 2011, “Development and Evaluation of Relative
Compaction Specifications Using Roller‐Based Measurements,” Geotechnical Testing Journal, Vol. 34,
No. 6, pp. 634–642.
Forssblad, L., 1965, “Investigations of Soil Compaction by Vibration,” Acta Polytechnica Scandinavica,
No. 34.
Forssblad, L., 1980, “Compaction Meter on Vibrating Rollers for Improved Compaction Control,”
Proceedings of International Conference on Compaction, Vol. 2, Paris, France, pp. 541–546.
Forssblad, L., 1981, Vibratory Soil and Rock Fill Compaction, Dynapac Maskin AB, Stockholm, Sweden,
175p.

28
Gazetas G., 1983, "Analysis of Machine Foundation Vibrations: State‐of‐the‐Art," International
Journal of Soil Dynamics and Earthquake Engineering, Vol. 2, No. 1, pp. 2‐43.
Hall, J. R., Jr., 1967, “Coupled Rocking and Sliding Oscillations of Rigid Circular Footings,” Proceedings
of the International Symposium on Wave Propagation and Dynamic Properties of Earth Materials,
Albuquerque, New Mexico, pp. 139‐148.
Hardin, B. O., 1978, “The Nature of Stress‐Strain Behavior of Soils,” Proceedings of the ASCE
Geotechnical Engineering Division Specialty Conference on Earthquake Engineering, Vol. 1, Pasadena,
California, pp. 3‐90.
Hardin, B. O. and Drnevich, V. P., 1972a, “Shear Modulus and Damping in Soils: Design Equations and
Curves,” Journal of the Soil Mechanics and Foundations Division, Vol. 98, No. 7, pp. 667–692.
Hardin, B. O. and Drnevich, V. P., 1972b, “Shear Modulus and Damping in Soils: Measurement and
Parameter Effects,” Journal of the Soil Mechanics and Foundations Division, Vol. 98, No. 6, pp. 603‐
624.
Hertwig, A., 1936, “Means for Consolidating the Ground,” US Patent 2039078.
Johnson, A. W. and Sallberg, J. R., 1960, Factors that Influence Field Compaction of Soils, Highway
Research Board, Bulletin No. 272, 206 p.
Kausel, E. and Assimaki, D., 2002, ”Seismic Simulation of Inelastic Soils via Frequency‐Dependent
Moduli and Damping.” Journal of Engineering Mechanics, Vol. 128, No. 1, pp. 34–47.
Kondner, R. L., 1963a, A Hyperbolic Stress‐strain Formulation for Sands, Northwestern University, 60
p.
Kondner, R. L., 1963b, “A Hyperbolic Stress‐Strain Response: Cohesive Soils,” Journal of the Soil
Mechanics and Foundations Division, Vol. 89, No. 1, pp. 115‐143.
Lorenz, H., 1960, Grundbau‐Dynamik [Foundation Dynamics], Springer‐Verlag, Berlin, 308 p., (in
German).
Lysmer, J. and Richart, F. E., Jr., 1966, “Dynamic Response of Footings to Vertical Loading,” Journal of
the Soil Mechanics and Foundations Division, Vol. 92, No. 1, pp. 65–91.
Mandal, A., Baidya, D. K. and Roy, D., 2012, ”Dynamic Response of the Foundations Resting on a Two‐
layered Soil Underlain by a Rigid Layer,” Journal of Geotechnical and Geological Engineering, Vol. 30,
No. 4, pp. 775‐786.
Masing, G., 1926, "Eigenspannungen und Verfestigung beim Messing," Proceedings of the second
International, Congress on Applied Mechanics, pp. 332‐335, (in German).

29
Massarsch, K. R., 2004, “Deformation Properties of Fine‐Grained Soils from Seismic Tests,” Keynote
lecture, Proceedings of the Second International Conference on Site Characterization, ISC’2, Porto,
Portugal, pp. 133–146.
Mooney, M. A. and Rinehart, R. V., 2009, “In Situ Soil Response to Vibratory Loading and Its
Relationship to Roller‐Measured Soil Stiffness,” Journal of Geotechnical and Geological Engineering,
Vol. 135, No. 8, pp. 1022–1031.
Novak, M., 1970, “Prediction of Footing Vibrations,” Journal of the Soil Mechanics and Foundations
Division, Vol. 96, No. 3, pp. 837‐861.
Rad, N. S. and Tumay, M. T., 1987, “Factors Affecting Sand Specimen Preparation by Raining,”
Geotechnical Testing Journal, Vol. 10, No. 1, pp. 31–37.
Richart, F. E., Jr., Hall, J. R., Jr. and Woods, R. D., 1970, Vibrations of soils and foundations, Prentice‐
Hall, Englewood Cliffs, New Jersey, 414 p.
Rollins, K. M., Evans, M. D., Diehl, N. B. and Daily, W. D. III, 1998, ”Shear Modulus and Damping
Relationships for Gravels.” Journal of Geotechnical and Geoenvironmental Engineering, Vol. 124, No.
5, pp. 396–405.
Schnabel, P. B., Lysmer, J. and Seed, H. B., 1972, SHAKE: a Computer Program for Earthquake
Response Analysis of Horizontally Layered Sites, Earthquake Engineering Research Center, University
of California, Berkeley, 92 p.
Seed, H. B., Wong, R. T., Idriss, I. M. and Tokimatsu, K., 1986, ”Moduli and Damping Factors for
Dynamic Analyses of Cohesionless Soils,” Journal of Geotechnical Engineering, Vol. 112, No. 11, pp.
1016–1032.
Stokoe, K. H., II, Darendeli, M. B., Andrus, R. D., and Brown, L. T., 1999, “Dynamic soil properties:
Laboratory, field and correlation Studies,” Proceedings of the Second International Conference on
Earthquake Geotechnical Engineering, Vol. 3, Lisbon, Portugal, pp. 811–845.
Susante, P. J. and Mooney, M. A., 2008, “Capturing Nonlinear Vibratory Roller Compactor Behavior
through Lumped Parameter Modeling,” Journal of Engineering Mechanics, Vol. 134, No. 8, pp. 684‐
693.
Tatsuoka, F., Masuda, T., Siddiquee, M., and Koseki, J., 2003, ”Modeling the Stress‐Strain Relations of
Sand in Cyclic Plane Strain Loading.” Journal of Geotechnical and Geoenvironmental Engineering, Vol.
129, No. 5, pp. 450–467.
Thurner, H. and Sandström, Å., 1980, “A New Device for Instant Compaction Control,” Proceedings of
International Conference on Compaction, Vol. 2, Paris, France, pp. 611–614.

30
Tschebotarioff, G. P. and McAlpin, G. W., 1947, Effect of Vibratory and Slow Repetitional Forces on
the Bearing Properties of Soils, Civil Aeronautics Administration, Technical Development Report No.
57, 70 p.
Vucetic, M. and Dobry, R., 1991, “Effect of Soil Plasticity on Cyclic Response,” Journal of Geotechnical
Engineering, Vol. 117, No. 1, pp. 89–107.
Wersäll, C. and Larsson, S., 2013, “Small‐Scale Testing of Frequency‐Dependent Compaction of Sand
Using a Vertically Vibrating Plate,” Geotechnical Testing Journal, Vol. 36, No. 3, pp. 1‐10.
Wersäll, C., Larsson, S., Rydén, N. and Nordfelt, I., 2013, Frequency Variable Surface Compaction of
Sand Using Rotating Mass Oscillators, Submitted to Geotechnical Testing Journal.
Yoo, T‐S. and Selig, E. T., 1979, “Dynamics of Vibratory‐Roller Compaction,” Journal of the
Geotechnical Engineering Division, Vol. 105, No. 10, pp. 1211–1231.
Zhang, J., Andrus, R., and Juang, C., 2005, ”Normalized Shear Modulus and Material Damping Ratio
Relationships.” Journal of Geotechnical and Geoenvironmental Engineering, Vol. 131, No. 4, pp. 453–
464.

Paper I
Small‐Scale Testing of Frequency‐Dependent Compaction of Sand Using a Vertically Vibrating Plate
Wersäll, C. and Larsson, S.
Published in ASTM Geotechnical Testing Journal 2013:36(3)

Carl Wersall1 and Stefan Larsson1
Small-Scale Testing of Frequency-DependentCompaction of Sand Using a Vertically VibratingPlate
REFERENCE: Wersall, Carl and Larsson, Stefan, “Small-Scale Testing of Frequency-Dependent Compaction of Sand Using a VerticallyVibrating Plate,” Geotechnical Testing Journal, Vol. 36, No. 3, 2013, pp. 1–10, doi:10.1520/GTJ20120183. ISSN 0149-6115.
ABSTRACT: Vibratory rollers generally operate at a fixed vibration frequency. It is hypothesized that the compaction of soil could be mademore efficient if the frequency could be adapted to specific project conditions. In order to study the applicability to surface compaction, the fre-quency dependence of compacting dry sand with a vertically vibrating plate was investigated experimentally in 85 small-scale tests. Tests wereperformed in a test box simulating the free-field condition and with concrete underlying the sand bed. The results show that there is a distinct fre-quency dependence, implying a significantly improved compaction effect close to the compactor–soil resonant frequency. It is suggested that parti-cle velocity is the governing amplitude parameter for vibratory soil compaction, rather than displacement or acceleration. As the soil is compacted,it is also displaced, resulting in surface heave. A larger vibration amplitude implies greater displacement relative to the compacted volume. It wasalso observed that the compaction and strain-dependent reduction of soil stiffness are closely related.
KEYWORDS: compaction, resonant frequency, strain softening, vibration, particle velocity
Introduction
The use of vibratory rollers as compaction equipment for embank-ments and landfills has been well established for many decades.Roller manufacturers have recently struggled with stricter environ-mental regulations necessitating the use of more fuel-efficient, low-emission diesel engines. Machines have also increased in size,improving their compaction efficiency. Furthermore, control sys-tems, safety issues, and the driver’s working environment have beentopics for research and development. However, little effort has beenmade since the 1970s to improve the compaction effect by reevalu-ating and investigating fundamental compaction parameters. Onesuch parameter is the operating frequency f of the vibrator. Since the1970s, the main research topic has been continuous compaction con-trol (CCC) using vibration measurements from sensors on the roller(e.g., Forssblad 1980; Thurner and Sandstrom 1980; Adam 1996;Anderegg and Kaufmann 2004; Mooney and Rinehart 2009; Rine-hart and Mooney 2009; Facas et al. 2011). The analysis approachfor evaluating measured vibrations in CCC is based on the lumped-parameter model suggested by Yoo and Selig (1979). This modelconsists of two coupled mass-spring-dashpot systems. In recentyears, finite element models simulating the compaction process havebeen developed. Topics studied numerically include the predictionof compacted density (Lee and Gu 2004; Xia 2012) and the
comparison of compaction methods (Arnold and Herle 2009). How-ever, no one has investigated the influence of f on the compacteddensity. Full-scale testing has been performed by manufacturers,optimizing parameters such as the layer thickness, number of passes,and static weight of the roller. However, these studies have generallybeen performed for commercial purposes and remain unpublished.
In the early years of soil compaction research, optimal compac-tion frequency was intensively discussed. Some authors argued thatcompaction was most effectively carried out at the compactor–soilresonant frequency fr (Johnson and Sallberg 1960), whereas othersargued that f is not of great importance (Forssblad 1965). However,many of these statements were mere speculation, partly because ofthe lack of frequency-variable compaction equipment and advancedmeasurement techniques at the time. Bernhard (1952) performedlaboratory tests, concluding that compaction is more efficient at fr.The same was observed by Converse (1954) in extensive field testsusing a plate-mounted vertical vibrator compacting sand in a testpit. It has long been known that vibrating plates are more efficientthan rollers in compacting soil (Lewis 1961). However, they are notpractical for use over large areas, in contrast to rollers. Dobry andWhitman (1973) performed compaction tests on sand in a mold ona vibrating table and found that f was important for compaction incertain acceleration intervals. Naturally, threshold values of the am-plitude of acceleration a0, velocity v0, or displacement u0 must beexceeded in order for satisfactory compaction to be obtained. Sev-eral studies have shown that compaction is most efficient when a0
exceeds 1 g (D’Appolonia et al. 1969; Dobry and Whitman 1973).The above results have not been shown for roller compaction, andthe optimal f of rollers remains to be investigated.
Manuscript received October 5, 2012; accepted for publication February 25,2013; published online March 21, 2013.
1Dept. of Civil and Architectural Engineering, KTH Royal Institute ofTechnology, SE 100 44, Stockholm, Sweden.
Copyright VC 2013 by ASTM International, 100 Barr Harbor Drive, PO Box C700, West Conshohocken, PA 19428-2959. 1
Geotechnical Testing Journal, Vol. 36, No. 3, 2013Available online at www.astm.org
doi:10.1520/GTJ20120183
Copyright by ASTM Int'l (all rights reserved); Wed May 15 04:33:29 EDT 2013Downloaded/printed byKungliga Tekniska Hogskola pursuant to License Agreement. No further reproductions authorized.

A review of existing literature shows that very few have inves-tigated roller compaction experimentally and that no one has, tothe authors’ knowledge, studied the frequency dependence ofroller compaction. The objective of this paper is to study funda-mental frequency-dependent properties of granular soil. The pur-pose is to present the results of some recent small-scale tests inwhich dry sand was compacted using a vertically vibrating plate.It is hypothesized that the fr of the compactor–soil system can beutilized to obtain a higher degree of compaction in a shorter timeperiod, as opposed to frequencies below or above resonance. Therelationship between strain softening and the magnitude of com-paction is also investigated. Other authors have performed similarvibration tests with varying values of f (Baidya and MuraliKrishna 2001; Nagappagowda and Thulasiram in press). How-ever, the relation between f and the compaction effect has notbeen investigated experimentally. The scale of the tests is justifiedbecause the size of the vibrating plate needs to be sufficientlylarge in relation to the soil grains and the test box needs to be aslarge as possible, with the scale small enough to allow controlover and repeatability of laboratory conditions.
The test results presented in this paper cannot be directly appliedto roller compaction. The influence of the ratio of dynamic forceand static weight must be considered. In the present tests, the staticweight is larger than the dynamic force, whereas the opposite istrue for compaction by roller. Furthermore, the influence of a mov-ing load with a different contact area needs to be investigated.These are topics for further studies. However, this paper containsunique results regarding the compaction of sand that provide an op-portunity to study these concepts in relation to roller compaction.The findings are also applicable to other granular materials and set-tlement in soil due to other types of vibratory loading.
Methods and Experimental Setup
The influence of f on the compaction effect was investigated insmall-scale tests in a sand-filled box using a vertical electrical vibra-tion exciter. The test equipment and setup are shown in Fig. 1. Thebox consisted of a wooden frame bolted directly to the concretefloor. The inside of the vertical boundaries was coated with 30 mmof expanded polystyrene to reduce wave reflections. The inner
measurements of the box were 1100 mm� 700 mm� 370 mm(W� L�H). The ratios of the inner width/plate diameter and innerlength/plate diameter were 8.1 and 13.1, respectively. The size ofthe box was considered sufficiently large for the boundaries not toaffect the compaction frequency dependence of the plate. Baidyaand Murali Krishna (2001) found that the resonant amplitude, butnot fr, was affected by the size of the test box in similar tests.
Selection of Test Parameters
In order to investigate the influence of f, the compaction efficiencymust be compared at different values of f at a selected constantamplitude. A frequent subject of discussion is what the governingvibration amplitude parameter is for soil compaction—u0, v0, ora0. In this study, the hypothesis is that, except for f, v0 controls thedegree of compaction. One reason is that the shear strain c isproportional to the particle velocity v and is crucial for obtaining arearrangement of particles. Another reason is that the power P(energy per unit time) of vibrations that propagate into the soilfrom a dynamic exciter placed on the soil surface is proportionalto v0
2. This is shown briefly below (for a detailed explanation, seeWersall et al. 2012). Displacement of the vibrator u can beexpressed by Eq 1.
u ¼ u0cosðxtÞ (1)
in which x is the circular frequency. If we consider the vibratingmass on the soil as a mass-spring-dashpot system, the input forcecan be divided into the spring force Fk and the dashpot force Fc,given by Eqs 2 and 3, respectively.
Fk ¼ ku ¼ ku0cosðxtÞ (2)
Fc ¼ cdu
dt¼ �xcu0sinðxtÞ (3)
where:k¼ spring stiffness, andc¼ damping coefficient.Because the spring consumes no energy, all energy consump-
tion takes place in the dashpot, and the damped energy is equal tothe energy that is manifested as propagating waves. Plotting Fc
versus u results in an elliptical path. The area of the ellipse givesthe energy consumed in one cycle, expressed by Eq 4.
Wc ¼ pxcu20 (4)
With the application of x ¼ 2pf and v0 ¼ xu0, the vibrationpower consumed by the dashpot, and thus propagating into thesoil, can be calculated using Eq 5.
P ¼ fWc ¼1
2cðxu0Þ2 ¼
1
2cv2
0 (5)
It is concluded from Eq 5 that P is proportional to v02, and thus a
constant value of v0 results in a constant vibration energy per unittime. Other dynamic parameters, such as the spans of f and v0, wereselected based on initial tests and limitations of the test equipment.
Test Equipment
Vibrations were generated by an electrical vibration exciter that wasmounted on a steel rod running through two polytetrafluoroethylene
FIG. 1—Test box and experimental setup. The dashed line in the section viewindicates the sand surface.
2 GEOTECHNICAL TESTING JOURNAL
Copyright by ASTM Int'l (all rights reserved); Wed May 15 04:33:29 EDT 2013Downloaded/printed byKungliga Tekniska Hogskola pursuant to License Agreement. No further reproductions authorized.
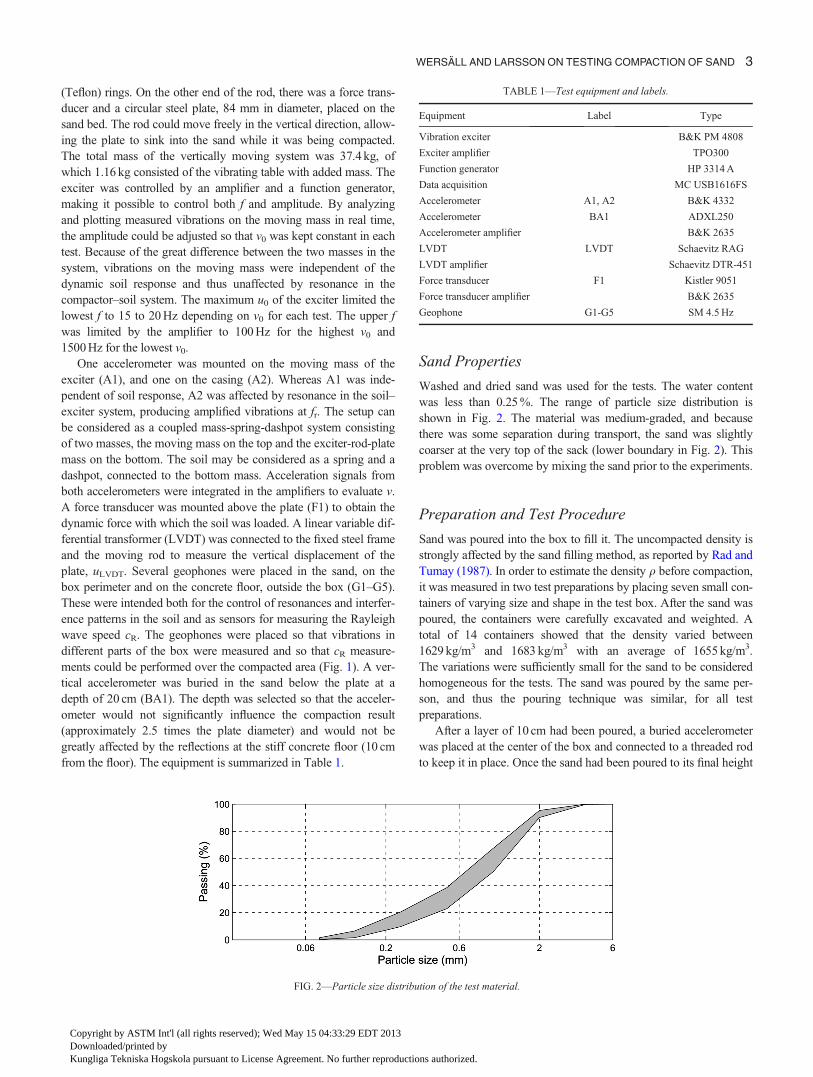
(Teflon) rings. On the other end of the rod, there was a force trans-ducer and a circular steel plate, 84 mm in diameter, placed on thesand bed. The rod could move freely in the vertical direction, allow-ing the plate to sink into the sand while it was being compacted.The total mass of the vertically moving system was 37.4 kg, ofwhich 1.16 kg consisted of the vibrating table with added mass. Theexciter was controlled by an amplifier and a function generator,making it possible to control both f and amplitude. By analyzingand plotting measured vibrations on the moving mass in real time,the amplitude could be adjusted so that v0 was kept constant in eachtest. Because of the great difference between the two masses in thesystem, vibrations on the moving mass were independent of thedynamic soil response and thus unaffected by resonance in thecompactor–soil system. The maximum u0 of the exciter limited thelowest f to 15 to 20 Hz depending on v0 for each test. The upper fwas limited by the amplifier to 100 Hz for the highest v0 and1500 Hz for the lowest v0.
One accelerometer was mounted on the moving mass of theexciter (A1), and one on the casing (A2). Whereas A1 was inde-pendent of soil response, A2 was affected by resonance in the soil–exciter system, producing amplified vibrations at fr. The setup canbe considered as a coupled mass-spring-dashpot system consistingof two masses, the moving mass on the top and the exciter-rod-platemass on the bottom. The soil may be considered as a spring and adashpot, connected to the bottom mass. Acceleration signals fromboth accelerometers were integrated in the amplifiers to evaluate v.A force transducer was mounted above the plate (F1) to obtain thedynamic force with which the soil was loaded. A linear variable dif-ferential transformer (LVDT) was connected to the fixed steel frameand the moving rod to measure the vertical displacement of theplate, uLVDT. Several geophones were placed in the sand, on thebox perimeter and on the concrete floor, outside the box (G1–G5).These were intended both for the control of resonances and interfer-ence patterns in the soil and as sensors for measuring the Rayleighwave speed cR. The geophones were placed so that vibrations indifferent parts of the box were measured and so that cR measure-ments could be performed over the compacted area (Fig. 1). A ver-tical accelerometer was buried in the sand below the plate at adepth of 20 cm (BA1). The depth was selected so that the acceler-ometer would not significantly influence the compaction result(approximately 2.5 times the plate diameter) and would not begreatly affected by the reflections at the stiff concrete floor (10 cmfrom the floor). The equipment is summarized in Table 1.
Sand Properties
Washed and dried sand was used for the tests. The water contentwas less than 0.25 %. The range of particle size distribution isshown in Fig. 2. The material was medium-graded, and becausethere was some separation during transport, the sand was slightlycoarser at the very top of the sack (lower boundary in Fig. 2). Thisproblem was overcome by mixing the sand prior to the experiments.
Preparation and Test Procedure
Sand was poured into the box to fill it. The uncompacted density isstrongly affected by the sand filling method, as reported by Rad andTumay (1987). In order to estimate the density q before compaction,it was measured in two test preparations by placing seven small con-tainers of varying size and shape in the test box. After the sand waspoured, the containers were carefully excavated and weighted. Atotal of 14 containers showed that the density varied between1629 kg/m3 and 1683 kg/m3 with an average of 1655 kg/m3.The variations were sufficiently small for the sand to be consideredhomogeneous for the tests. The sand was poured by the same per-son, and thus the pouring technique was similar, for all testpreparations.
After a layer of 10 cm had been poured, a buried accelerometerwas placed at the center of the box and connected to a threaded rodto keep it in place. Once the sand had been poured to its final height
TABLE 1—Test equipment and labels.
Equipment Label Type
Vibration exciter B&K PM 4808
Exciter amplifier TPO300
Function generator HP 3314 A
Data acquisition MC USB1616FS
Accelerometer A1, A2 B&K 4332
Accelerometer BA1 ADXL250
Accelerometer amplifier B&K 2635
LVDT LVDT Schaevitz RAG
LVDT amplifier Schaevitz DTR-451
Force transducer F1 Kistler 9051
Force transducer amplifier B&K 2635
Geophone G1-G5 SM 4.5 Hz
FIG. 2—Particle size distribution of the test material.
WERSALL AND LARSSON ON TESTING COMPACTION OF SAND 3
Copyright by ASTM Int'l (all rights reserved); Wed May 15 04:33:29 EDT 2013Downloaded/printed byKungliga Tekniska Hogskola pursuant to License Agreement. No further reproductions authorized.

of 30 cm, the rod was disconnected from the accelerometerand pulled out of the sand. The surface at the center of the box wasthen preloaded by a static mass of 72 kg with an area of205 mm� 250 mm (corresponding to a stress of 13.8 kN/m2).The reason for preloading was to get less variation in the initial(uncompacted) q between tests. Before and after compaction, cR
between geophones G1 and G2 was measured by impacting a steelplate. The plate was placed 20 cm from G1 and 40 cm from G2(Fig. 1). The Rayleigh wave was then generated via vertical impactof a rubber hammer on the impact plate, generating a wave propa-gating through G1 and G2 (at a distance of 20 cm from each other).By observing the first arrival of the Rayleigh wave, an average of cR
was obtained for the sand volume surrounding the vibrating plate.The exciter was operated with linear (and in some cases logarith-
mic) frequency sweeps, with a lower boundary at 15 to 20 Hz andan upper boundary at 100 to 1500 Hz depending on the test condi-tions, as described above. During each frequency sweep, the v0 onthe moving mass of the exciter (A1) was kept constant. Because Pis proportional to v0
2 (Eq 5), the vibration energy per unit time prop-agating into the sand was constant with varying f. This facilitatedinvestigation of the frequency dependence at a constant P input.
Evaluation Method
In addition to direct observations of measured data, some evalua-tion was done based on dynamic relationships for vibrating foun-dations. In order to analyze and evaluate the test results, it wasassumed that the soil could be modeled as a spring and dashpot.Expressions for the dynamic spring stiffness k of a verticallyvibrating foundation have been derived for an elastic half-spaceby Lysmer and Richart (1966). When applying these expressions,it is important to consider strain-dependent moduli (strain soften-ing). Shear and compressive moduli decrease with c (Hardin andDrnevich 1972; Vucetic and Dobry 1991; Massarsch 2004;Johnson and Jia 2005) and thus with vibration amplitude. Mas-sarsch (2000) argued that shear strain softening is closely relatedto the rearrangement of particles. That means that the lowerthreshold of c for when the shear modulus G starts to decrease isclose to the lower threshold for particle rearrangement. Thus, indynamic loading of the soil, G is constant in the lower amplituderange (i.e., when no compaction takes place) and starts to decreasewhen the amplitude is sufficient for the soil to be compacted. Thisconcept has not previously been verified experimentally withregard to soil compaction. To investigate strain softening, onemay analyze fr instead of G. The relation between these parame-ters is presented in the following equations. The expression for kof a vibrating rigid footing on an elastic half-space can be calcu-lated using Eq 6, according to Lysmer and Richart (1966).
k ¼ 4Gr0
1� t(6)
where:r0¼ diameter of the footing, and�¼ Poisson’s ratio of the soil.Further, fr of a mass-spring-dashpot model is expressed by Eq 7.
fr ¼xn
2p
ffiffiffiffiffiffiffiffiffiffiffiffiffiffiffi1� 2f2
q(7)
where:xn¼ circular natural frequency, andf¼ damping ratio.The circular natural frequency xn is determined using Eq 8, in
which m is the static mass.
xn ¼ffiffiffiffik
m
r(8)
Combining Eqs 6–8 shows that fr is proportional to the squareroot of G. Because the shear wave speed cS is also proportional tothe square root of G, fr is proportional to cS. This relation may beused when evaluating the threshold value for strain softening.Another convenient relation that may be taken advantage of is thatc is proportional to v. Thus, in a comparative analysis in which theexact magnitude of c is not important, one may observe the influ-ence of v without having to determine c.
Experimental Program
This paper presents results from 85 tests divided over six test se-ries under varying conditions. The tests were carried out so that v0
on the moving mass of the vibrator was kept constant while f wasvaried, either from low to high or from high to low. Sand was notreplaced between the tests in each series. Between test series,however, the test box was emptied and refilled. The test series aresummarized in Table 2. Test series A was done to get initialresults and to verify the optimal test procedure. The main resultswere obtained from test series B, C, and D. The purpose of test se-ries E and F was to investigate the ratio between compacted anddisplaced soil to verify that the sand was truly compacted.
Soil Displacement
A crucial consideration is whether the soil is really compacted ormerely displaced. This was investigated in test series E and F,each conducted in a small box, measuring the difference betweenthe compacted and uncompacted volumes. The test assumptionsare shown schematically in Fig. 3. The area of the plate, multi-plied by uLVDT, is illustrated by the dashed lines. It is consideredas the sum of the reduction in sand volume due to compaction(henceforth referred to as the compacted volume) DVc and the vol-ume of the heave (displaced volume) DVd. It is thus assumed thatall soil being displaced horizontally manifests as heave, neglectingany horizontal compaction that might occur outside the plate.Heave is illustrated by the dotted lines. The tests were performedin small boxes that were filled with sand and embedded within thegreater sand volume in the main test box (see Fig. 4). In that way,some wave energy could radiate through the thin walls of thesmaller box while the weight of the sand in the box remained con-stant. The compacted volume DVc was obtained by determiningthe sand volume in the box before and after compaction. AfterDVc and (DVcþDVd) had been determined, DVd could be calcu-lated. It was thus possible to calculate the ratio of displaced andcompacted volume, DVd/DVc.
In test series E, a box with inner dimensions of 130 mm� 130 mm� 130 mm was filled with sand that was moderately
4 GEOTECHNICAL TESTING JOURNAL
Copyright by ASTM Int'l (all rights reserved); Wed May 15 04:33:29 EDT 2013Downloaded/printed byKungliga Tekniska Hogskola pursuant to License Agreement. No further reproductions authorized.

compacted with the 84 mm diameter plate. The test series resultedin DVd/DVc¼ 0.21, corresponding to 83 % of the total volumechange below the plate resulting from soil compaction. In the sec-ond test series, a smaller box was used, with dimensions of115 mm� 115 mm� 63 mm (W� L�H), and the sand was heav-ily compacted. This test series resulted in DVd/DVc¼ 3.1, corre-sponding to 23 % of the volume change resulting fromcompaction. It is likely that large-amplitude tests give rise to soilfailure, with the result that a greater soil volume is displaced,causing heave. Moreover, there is less material that can contributeto DVc. The results from test series E and F verify that the sandwas being compacted in the smaller boxes. This suggests thatcompaction also took place in the main test series conducted inthe larger sand box. However, for large v0, a significant amount isalso displaced, and it is assumed that this also applies to tests inthe larger box. Results shown in the next section suggest that themain test series (B–D) are comparable to the series using smallerboxes (E and F).
Results
The results of the 85 tests were very similar but varied slightlywith v0. In this section, selected representative tests are presentedin detail, particularly one low-amplitude test (C003) and one high-amplitude test (C023). General observations regarding all the testsare also presented.
Figure 5 shows the response of the accelerometers, force trans-ducer, and LVDT in test C003 (small amplitude), in which the v0
on accelerometer A1 was kept constant at 3 mm/s. Resonance ofthe compactor–soil system can be clearly observed in accelerome-ter A2 and force transducer F1, with a maximum at 54 s. Becausevibrations are transmitted to the LVDT, very small displacementscould not be detected without filtering data. The original data areshown in gray, and the black curve shows data smoothed by afourth-order Savitzky–Golay filter (Savitzky and Golay 1964).Although the total uLVDT was only 0.0074 mm, a distinct increasein uLVDT was observed at fr. The same was observed in all tests,regardless of v0. In Fig. 6, showing the normalized displacement
TABLE 2—Description of the six test series.
TestSeries
Numberof Tests A1 A2 LVDT F1 G1 G2 G3 G4 G5
FrequencySweep Description
A 19 x x x x x Low–high/
high–low
Initial test in a smaller container
under varying conditions to
provide tentative results and
information regarding optimal
test procedure.
B 12 x x x x x x x x Low–high Full-size box, gradually
increasing amplitude between
tests, varying speed of frequency
sweep.
C 25 x x x x x x x x Low–high Repetition of test series B with
more tests and smaller amplitude
increment between tests.
D 16 x x x x x x x x Low–high Constant speed of frequency
sweep. Amplitude was increased
between each test in the first half
of the series and then gradually
decreased.
E 8 x x x x Low–high Compaction in a small container,
130 mm� 130 mm� 130 mm,
placed in the full-size box and
embedded in sand.
F 5 x x x x Low–high Like test series E, but the size of
the container was
115 mm� 115 mm� 63 mm
(W�L�H).
FIG. 3—Schematic illustration of compaction and heave. The area shown bythe dashed lines is the sum of the compacted and displaced volumes,DVcþDVd, and the dotted lines show soil heave (displaced volume), DVd.
FIG. 4—Test series E and F. In each test series, a small box was embedded inthe sand.
WERSALL AND LARSSON ON TESTING COMPACTION OF SAND 5
Copyright by ASTM Int'l (all rights reserved); Wed May 15 04:33:29 EDT 2013Downloaded/printed byKungliga Tekniska Hogskola pursuant to License Agreement. No further reproductions authorized.

velocity of the LVDT versus f, the increase in the rate of uLVDT atresonance is even more clearly visible. The frequency at whichthe largest deformation occurs (here, 66 Hz) is identified as fr(Nagappagowda and Thulasiram in press). The response of thegeophones and the buried accelerometer is shown in Fig. 7. Reso-nance of the compactor–soil system is clearly observed in G1 andG2 (10 cm from the center of the plate) but is hardly detectable inG3 (30 cm from the plate) and G4 (on the boundary). The geo-phone behavior contains both amplification and reduction of theamplitude. This is most likely because of the interference of wavesand has been observed by other researchers in field measurementswhere no boundaries were present (Genberg and Bergh Hansson2002). However, the boundaries might also have affected amplifi-
cations and reductions in the present study. BA1 did not react sig-nificantly to resonance in any test, suggesting that the resonantamplification was rather local below and around the plate. If thewhole sand layer had been in resonance, it would have beenclearly visible in BA1. The observation also verifies that the sandlayer can, dynamically, be considered as a half-space.
Results from test C023 (large amplitude) are shown in Fig. 8and Fig. 9. Here, too, resonance is clearly observed with distinctsettlement at fr where uLVDT was 8.7 mm. The normalized dis-placement velocity is presented in Fig. 10, together with thesmall-amplitude test described above for reference (Fig. 6). Agreater v0 generally implies a wider peak in the curve of displace-ment velocity versus frequency.
The tests showed high repeatability; that is, it was possible toaccurately obtain the same results in two tests performed underthe same conditions. Figure 11 shows vLVDT for the 66 tests in se-ries B–F. Test series A, which was conducted under different con-ditions (smaller container) with less controllability, is consideredas less representative for the general results and has thus beenomitted. The distinct increase in vLVDT that was observed in theresults presented above is also visible here. It is concluded that alltests yielded similar results. Higher amplitude generally implieshigher vLVDT and a wider peak. Because tests were conductedunder different frequency sweep speeds, there are slight variationsin vLVDT. Test series B–D are shown in gray, and series E and Fin black. The similar shapes and locations of the peaks suggestthat the confinement of the small boxes in series E and F did notinfluence the dynamics of the tests considerably. However, thesettlement rate was smaller because of the restricted displacementcaused by the box boundaries.FIG. 6—Displacement velocity of LVDT in test C003 (small v0).
FIG. 7—Response of geophones and buried accelerometer in test C003(small v0).
FIG. 5—Response of accelerometers, force transducer, and LVDT in testC003 (small v0).
6 GEOTECHNICAL TESTING JOURNAL
Copyright by ASTM Int'l (all rights reserved); Wed May 15 04:33:29 EDT 2013Downloaded/printed byKungliga Tekniska Hogskola pursuant to License Agreement. No further reproductions authorized.
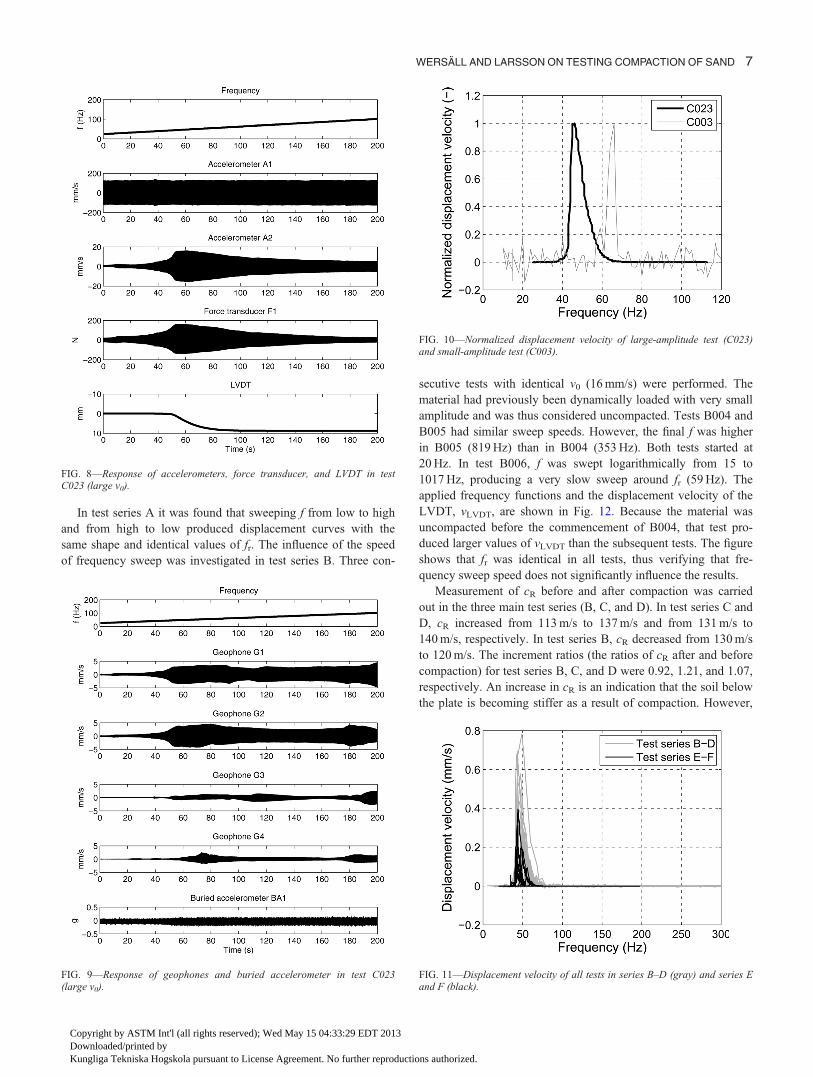
In test series A it was found that sweeping f from low to highand from high to low produced displacement curves with thesame shape and identical values of fr. The influence of the speedof frequency sweep was investigated in test series B. Three con-
secutive tests with identical v0 (16 mm/s) were performed. Thematerial had previously been dynamically loaded with very smallamplitude and was thus considered uncompacted. Tests B004 andB005 had similar sweep speeds. However, the final f was higherin B005 (819 Hz) than in B004 (353 Hz). Both tests started at20 Hz. In test B006, f was swept logarithmically from 15 to1017 Hz, producing a very slow sweep around fr (59 Hz). Theapplied frequency functions and the displacement velocity of theLVDT, vLVDT, are shown in Fig. 12. Because the material wasuncompacted before the commencement of B004, that test pro-duced larger values of vLVDT than the subsequent tests. The figureshows that fr was identical in all tests, thus verifying that fre-quency sweep speed does not significantly influence the results.
Measurement of cR before and after compaction was carriedout in the three main test series (B, C, and D). In test series C andD, cR increased from 113 m/s to 137 m/s and from 131 m/s to140 m/s, respectively. In test series B, cR decreased from 130 m/sto 120 m/s. The increment ratios (the ratios of cR after and beforecompaction) for test series B, C, and D were 0.92, 1.21, and 1.07,respectively. An increase in cR is an indication that the soil belowthe plate is becoming stiffer as a result of compaction. However,
FIG. 9—Response of geophones and buried accelerometer in test C023(large v0).
FIG. 10—Normalized displacement velocity of large-amplitude test (C023)and small-amplitude test (C003).
FIG. 11—Displacement velocity of all tests in series B–D (gray) and series Eand F (black).
FIG. 8—Response of accelerometers, force transducer, and LVDT in testC023 (large v0).
WERSALL AND LARSSON ON TESTING COMPACTION OF SAND 7
Copyright by ASTM Int'l (all rights reserved); Wed May 15 04:33:29 EDT 2013Downloaded/printed byKungliga Tekniska Hogskola pursuant to License Agreement. No further reproductions authorized.

the increase in cR is not a good measure of the compaction-induced increase in q below the plate because it represents an av-erage over a larger volume of soil than that being compacted. Fur-thermore, soil displacement and heave might cause the geophonesto displace slightly, making the interpretation of cR more complex.This might be the reason for the decrease in test series B, not nec-essarily implying a decrease in stiffness. Another measure ofgreater stiffness below the plate as a result of compaction is theincrease in fr. This is observed in Fig. 13, which shows resultsfrom test series D, starting at a low, gradually increasing v0 andthen gradually decreasing. After reaching peak v0 and with theamplitude again lowered, fr increases, implying that the sand hasbecome stiffer. This is further confirmation that the sand wasbeing compacted during the tests.
Strain Softening
When the depth of the soil layer is greater than 2.5 to 3 times theplate diameter, the response of the plate is approximately equal tothat of a half-space, as has been found in several studies (Baidyaand Murali Krishna 2001; Mandal and Baidya 2004). In thepresent test, the plate diameter was 84 mm and the sand depth was300 mm. Thus, the response can be approximated as the half-space response. As described above, fr is proportional to cS and
the square root of G (Eqs 6–8), which implies that fr is affected bystrain softening. Because v is proportional to c in the sand, fr isreduced with increasing v, as cS is with increasing c. The strainsoftening effect is shown in Fig. 14(a). Each data point representsresults from one test, with f for the largest vLVDT considered as fr,and different markers show data from the three main test series(B, C, and D). As expected, greater v0 implies reduced fr. It canalso be observed that the evaluated fr differs initially in the differenttest series, probably because of the slightly varying initial density,but it becomes similar as the material is compacted. Figure 14(b)
FIG. 13—Test series with increasing and then decreasing v0 between tests.The resonant frequency was increased after compaction.
FIG. 14—Strain softening and cumulative displacement with increasing v0.
FIG. 12—Comparison of tests B004, B005, and B006, with the same v0: (a)the shapes of the frequency sweep curves; (b) vLVDT versus f; and (c) anenlargement of (b) around fr.
8 GEOTECHNICAL TESTING JOURNAL
Copyright by ASTM Int'l (all rights reserved); Wed May 15 04:33:29 EDT 2013Downloaded/printed byKungliga Tekniska Hogskola pursuant to License Agreement. No further reproductions authorized.

shows the corresponding cumulative displacement of the plate withincreasing v0 (c). Considerable displacement occurs at v0 aboveapproximately 20 mm/s, which is also the threshold for when frstarts to decrease significantly. This observation confirms that thesoil particles are being rearranged above this strain level, as dis-cussed above. Below this value, the settlement is negligible.
Discussion
With the present test setup, it was possible to effectively utilize res-onant amplification to compact sand (i.e., to obtain more efficientcompaction close to fr). All tests showed a significant increase invLVDT at a distinct f. At the same f, vibration and force sensors on,or close to, the vibrating system showed resonant amplification.The conclusion is thus that compaction was significantly improvedat fr. However, larger v0 caused settlement in a slightly wider fre-quency interval (Fig. 10). This might have been caused by localbearing failure in the soil in the large-amplitude tests, also resultingin increased heave at the surface near the plate. It might also partlyhave been caused by loosening of the sand adjacent to the platebecause of a lack of confinement. However, the significant amountof heave suggests that the soil was mainly displaced, rather thanloosened. The test series intended for investigating soil displace-ment (E and F) resulted in a greater amount of displacement (com-pared to compaction) at larger v0, supporting this hypothesis.Neither the geophones further from the plate nor the buried acceler-ometer showed significant amplification at the compactor–soil fr(Figs. 7 and 9). This suggests that the resonance phenomenon wasrather local around the plate and that the size of the test box wassufficiently large for the boundaries not to have great influence.Constant-input v0 proved to be effective when investigating fre-quency dependence. The shape of the displacement curves, withdistinct settlement at resonance and a rapid decrease in settlementrate as f moved above or below fr, suggests that v0, rather than u0 ora0, is the governing amplitude parameter for the compaction ofgranular soil. However, this statement has not been confirmed bytests with constant u0 or a0.
Discussion in the Context of Roller Compaction
The results indicate that f has a significant influence on the effi-ciency of vibratory soil compaction. If surface compactors couldoperate close to fr of the compactor–soil system, the compactioneffect might be increased considerably. However, loading condi-tions in the present investigation are different from those for rollercompaction. The dynamic force is smaller than the static weight,reaching a maximum of 70 % of the compactor weight in the high-amplitude tests. Rollers, on the other hand, have a dynamic forcethat is considerably larger than the static weight. More efficientcompaction is obtained if the dynamic force is larger than the staticweight and the compaction equipment is in a state of jumping(Muro and Tran 2006). Furthermore, rollers operate at a certainspeed and load the surface with a cylindrical drum, as opposed tothe circular plate used in this study. Compaction is normally carriedout at optimum water content. Dry sand was used in the presentsmall-scale tests, and it remains to be investigated whether the sig-nificant frequency dependence also applies to soil at optimum water
content. Further small-scale and full-scale tests are required in orderto investigate how the concept can be applied to roller compaction.
In the manufacturing process of rollers, other considerationsrelated to frequency, such as resonance in machine parts and thevibration effect on the driver, also need to be taken into account.If the aspects described above could be considered while f wasallowed to be adjusted to specific conditions, it is probable thatroller compaction could be made more efficient. There are twooptions in applying frequency-dependent compaction, eitherfrequency-variable or fixed but project-specific. The first optionimplies adjusting f continuously based on dynamic measurements.The concept has been successfully applied in the deep compactionof natural sand and fill utilizing resonant amplification (Massarschand Fellenius 2002). The second option is to have a fixed f,although differing between rollers, thus making it possible tochoose a roller with a certain f. A roller suitable for project condi-tions can then be selected.
Conclusions
Small-scale compaction tests were performed on dry sand with avertically vibrating plate. The following conclusions can be drawnfrom the study:
• The small-scale tests effectively facilitated investigation ofthe frequency dependence of the compaction of dry sand inthe present setup.
• There is a distinct frequency dependence allowing the soil tobe more easily compacted close to the resonant frequency.
• Larger vibration amplitude results in compaction in a widerfrequency span, but also more soil displacement and heavedue to local bearing failure.
• A constant input particle velocity facilitates the investigationof frequency dependence at a constant energy input per unittime, and the test results indicate that it is a crucial compac-tion parameter, as opposed to displacement or acceleration.
• Strain softening is clearly visible through the reduced reso-nant frequency at larger amplitudes. Compaction and rear-rangement of soil particles are closely related to the strain-dependent reduction of moduli.
The results presented herein need to be verified for other loadingconditions and material properties. By performing small-scale testsunder different conditions and full-scale tests, the applicability offrequency-dependent soil compaction to vibratory rollers can beinvestigated. If frequency could be adjusted to current conditions, itis possible that roller efficiency could be significantly improved.
Acknowledgments
This research was funded by the Development Fund of the SwedishConstruction Industry (SBUF) and Dynapac Compaction Equip-ment AB. Dr. Kent Lindgren at the Marcus Wallenberg Laboratoryfor Sound and Vibration Research manufactured the test equipment,calibrated sensors, and assisted in measurements. Valuable com-ments during the tests and preparation of the manuscript were pro-vided by Dr. Anders Bodare, Dr. K. Rainer Massarsch, IngmarNordfelt, and Dr. Nils Ryden. Their contributions are highlyappreciated.
WERSALL AND LARSSON ON TESTING COMPACTION OF SAND 9
Copyright by ASTM Int'l (all rights reserved); Wed May 15 04:33:29 EDT 2013Downloaded/printed byKungliga Tekniska Hogskola pursuant to License Agreement. No further reproductions authorized.

References
Adam, D., 1996, “Flachendeckende Dynamische Verdichtung-skontrolle (FDVK) mit Vibrationswalzen [Continuous Com-paction Control With Vibratory Rollers],” Ph.D. thesis,University of Vienna, Vienna, Austria (in German).
Anderegg, R. and Kaufmann, K., 2004, “Intelligent CompactionWith Vibratory Rollers,” Transportation Research Record. 1868,Transportation Research Board, Washington, DC, pp. 124–134.
Arnold, M. and Herle, I., 2009, “Comparison of VibrocompactionMethods by Numerical Simulations,” Int. J. Numer. Analyt.Meth. Geomech., Vol. 33, pp. 1823–2838.
Baidya, D. K. and Murali Krishna, G., 2001, “Investigation ofResonant Frequency and Amplitude of Vibrating Footing Rest-ing on a Layered Soil System,” Geotech. Test. J., Vol. 24(4),pp. 409–417.
Bernhard, R. K., 1952, “Static and Dynamic Soil Compaction,”Highw. Res. Board, Proc. Annu. Meet., Vol. 31, pp. 563–592.
Converse, F. J., 1954, “Compaction of Sand at ResonantFrequency,” ASTM Spec. Tech. Publ., No. 156, pp. 124–137.
D’Appolonia, D. J., Whitman, R. V., and D’Appolonia, E., 1969,“Sand Compaction With Vibratory Rollers,” J. Soil Mech.Found. Div., Vol. 95, No. 1, pp. 263–284.
Dobry, R. and Whitman, R. V., 1973, “Compaction of Sand on aVertically Vibrating Table,” Evaluation of Relative Densityand Its Role in Geotechnical Projects Involving CohesionlessSoils, ASTM STP 523, ASTM International, West Consho-hocken, PA, pp. 156–170.
Facas, N. W., Rinehart, R. V., and Mooney, M. A., 2011,“Development and Evaluation of Relative Compaction Specifi-cations Using Roller-Based Measurements,” Geotech. Test. J.,Vol. 34, No. 6, pp. 634–642.
Forssblad, L., 1965, “Investigations of Soil Compaction byVibration,” Acta Polytech. Scand., No. 34.
Forssblad, L., 1980, “Compaction Meter on Vibrating Rollers forImproved Compaction Control,” Proceedings of the Interna-tional Conference on Compaction, Vol. 2, Paris, France, April22–24, 1980, Ecole Nationale des Ponts et Chaussees andLaboratoire Central des Ponts et Chaussees, pp. 541–546.
Genberg, T. and Bergh Hansson, T., 2002, “Overforingsfunktionerfor Taginducerade Markvibrationer [Transfer Functions forTrain-Induced Ground Vibrations],” M.Sc. thesis, Division ofSoil and Rock Mechanics, Royal Institute of Technology, Stock-holm, Sweden (in Swedish).
Hardin, B. O. and Drnevich, V. P., 1972, “Shear Modulus andDamping in Soils: Design Equations and Curves,” J. SoilMech. Found. Div., Vol. 98, No. 7, pp. 667–692.
Johnson, A. W. and Sallberg, J. R., 1960, Factors that InfluenceField Compaction of Soils, Bulletin No. 272, HighwayResearch Board, Washington, D.C.
Johnson, P. A. and Jia, X., 2005, “Nonlinear Dynamics, GranularMedia and Dynamic Earthquake Triggering,” Nature, Vol.437, No. 6, pp. 871–874.
Lee, F. H. and Gu, Q., 2004, “Method for Estimating DynamicCompaction Effect on Sand,” J. Geotech. Geoenviron. Eng.,Vol. 130, No. 2, pp. 139–152.
Lewis, W. A., 1961, “Recent Research into the Compaction ofSoil by Vibratory Compaction Equipment,” Proceedings of the5th International Conference on Soil Mechanics and Founda-tion Engineering, Vol. 2, Paris, France, July 17–22, 1961,International Society of Soil Mechanics and Foundation Engi-neering, London, England, pp. 261–268.
Lysmer, J. and Richart, F. E., Jr., 1966, “Dynamic Response ofFootings to Vertical Loading,” J. Soil Mech. Found. Div., Vol.92, No. 1, pp. 65–91.
Mandal, A. and Baidya, D. K., 2004, “Effect of Presence of RigidBase Within the Soil on the Dynamic Response of RigidSurface Foundation,” Geotech. Test. J., Vol. 27, No. 5,pp. 475–482.
Massarsch, K. R., 2000, “Settlements and Damage Caused byConstruction-Induced Vibrations,” Proceedings of the Interna-tional Workshop Wave 2000, Bochum, Germany, December13–15, 2000, Ruhr-University, pp. 299–315.
Massarsch, K. R., 2004, “Deformation Properties of Fine-GrainedSoils from Seismic Tests,” Proceedings of the Second Interna-tional Conference on Site Characterization, ISC’2, Porto, Por-tugal, September 19–22 2004, International Society of SoilMechanics and Geotechnical Engineering, London, England,pp. 133–146.
Massarsch, K. R. and Fellenius, B. H., 2002, “Vibratory Compac-tion of Coarse-Grained Soils,” Can. Geotech. J., Vol. 39, pp.695–709.
Mooney, M. A. and Rinehart, R. V., 2009, “In Situ Soil Responseto Vibratory Loading and Its Relationship to Roller-MeasuredSoil Stiffness,” J. Geotech. Geoenviron. Eng., Vol. 135, No. 8,pp. 1022–1031.
Muro, T. and Tran, D. T., 2006, “Effects of Vertical ExcitingForce of a Tracked Vehicle on the Dynamic Compaction of aHigh Lifted Decomposed Granite,” J. Terramech., Vol. 43, pp.365–394.
Nagappagowda, R. H. and Thulasiram, P. K. M., “Stiffness ofFinite Sand Stratum under Vertical Vibrations,” Proc. Inst.Civ. Eng. (in press).
Rad, N. S. and Tumay, M. T., 1987, “Factors Affecting SandSpecimen Preparation by Raining,” Geotech. Test. J., Vol. 10,No. 1, pp. 31–37.
Rinehart, R. V. and Mooney, M. A., 2009, “Measurement ofRoller Compactor Induced Triaxial Soil Stresses and Strains,”Geotech. Test. J., Vol. 32, No. 4, pp. 347–357.
Savitzky, A. and Golay, M. J. E., 1964, “Smoothing and Differen-tiation of Data by Simplified Least Squares Procedures,” Anal.Chem., Vol. 36, No. 8, pp. 1627–1639.
Thurner, H. and Sandstrom, A., 1980, “A New Device for InstantCompaction Control,” Proceedings of the International Con-ference on Compaction, Vol. 2, Paris, France, April 22–24,1980, Ecole Nationale des Ponts et Chaussees and LaboratoireCentral des Ponts et Chaussees, pp. 611–614.
Vucetic, M. and Dobry, R., 1991, “Effect of Soil Plasticity onCyclic Response,” J. Geotech. Engrg., Vol. 117, No. 1, pp.89–107.
Wersall, C., Bodare, A., and Massarsch, K. R., 2012, “VibrationSource Localization along Railway Tracks,” Noise andVibration Mitigation for Rail Transportation Systems: Noteson Numerical Fluid Mechanics and Multidisciplinary Design,Volume 118, T. Maeda, P.-E. Gautier, C. E. Hanson,B. Hemsworth, J. T. Nelson, B. Schulte-Werning, D.Thompson, and P. de Vos, Eds., Springer, Tokyo, Japan, pp.267–274.
Xia, K., 2012, “A Large Deformation Finite Element Model forSoil Compaction,” Geomech. Geoeng., Vol. 7, No. 2, pp.123–137.
Yoo, T.-S. and Selig, E. T., 1979, “Dynamics of Vibratory-RollerCompaction,” J. Geotech. Engrg. Div., Vol. 105, No. 10, pp.1211–1231.
10 GEOTECHNICAL TESTING JOURNAL
Copyright by ASTM Int'l (all rights reserved); Wed May 15 04:33:29 EDT 2013Downloaded/printed byKungliga Tekniska Hogskola pursuant to License Agreement. No further reproductions authorized.

Paper II
Frequency Variable Surface Compaction of Sand Using Rotating Mass Oscillators
Wersäll, C., Larsson, S., Rydén, N. and Nordfelt, I.
Submitted to ASTM Geotechnical Testing Journal in November 2013

1
Frequency Variable Surface Compaction of Sand Using
Rotating Mass Oscillators
Carl Wersäll1, Stefan Larsson1, Nils Rydén2 and Ingmar Nordfelt3
1Department of Civil and Architectural Engineering, KTH Royal Institute of Technology, SE 100 44, Stockholm, Sweden
2Engineering Geology, Faculty of Engineering, Lund University, Box 118, SE 221 00, Lund, Sweden
3Dynapac Compaction Equipment AB, Box 504, SE 371 23, Karlskrona, Sweden
Abstract
The influence of vibration frequency was studied in 105 small‐scale compaction
tests, conducted using a vertically oscillating plate. The underlying soil was dry sand,
or sand close to the optimum water content. The results showed that there is a
resonant amplification, providing a slightly higher degree of compaction. There is no
single dynamic quantity that is governing for soil compaction, but rather a
combination. Frequency has a major influence. An iterative method for calculating
the dynamic response of the plate, incorporating strain‐dependent properties of the
soil, is also presented. The calculated frequency response agrees well with measured
quantities.
Keywords: Compaction, resonance, strain softening, frequency response, vibratory
roller
Introduction
Soil compaction using a vibratory roller is governed by highly plastic strains,
nonlinear dynamic behavior and, occasionally, chaotic motion. These characteristics
make modeling of roller compaction a difficult task. Research on improving
compaction efficiency has mainly consisted of full‐scale trial‐and‐error studies and
the fundamental process of soil compaction is not wholly understood. To obtain
knowledge of a dynamic system, the response of the system to dynamic loading
needs to be investigated over a wide frequency span. However, the influence of
vibration frequency f on the compaction efficiency has not been fully investigated. In
the previous paper by Wersäll and Larsson (2013), it was concluded that very little
research has been conducted on the frequency dependence of soil surface
compaction and that no experimental studies have been published on the subject
since the 1970s. Among the most important advances were early studies by
2
Bernhard (1952), Converse (1954), D’Appolonia et al. (1969), and Dobry and
Whitman (1973). The conclusions of early researchers were, in general, that
compaction must be conducted above the coupled soil‐compactor resonant
frequency fr. Above resonance, f has influence but there was no consensus among
researchers regarding the magnitude of that influence or, in particular, its practical
applicability.
Several researchers have studied the dynamic behavior of vibratory rollers. Yoo and
Selig (1979) developed a model based on coupled mass‐spring‐dashpot systems,
which has been widely used. Adam (1996) identified, and showed by measurement
and simulation, the different modes of roller operation – contact, periodic loss of
contact, and chaotic motion. Extensive research has also been done on roller
behavior with regard to continuous compaction control (e.g. Forssblad 1980;
Thurner and Sandström 1980; Adam 1996; Anderegg and Kaufmann 2004; Mooney
and Rinehart 2009; Facas et al. 2011).
Wersäll and Larsson (2013) conducted small‐scale compaction tests using a vertical
electro‐dynamic oscillator. The tests showed that there was a significant frequency
dependence resulting in a higher degree of compaction close to fr. However, the
compaction equipment used in those tests was not representative of roller
compaction since the dynamic force was significantly lower than the static weight.
The purpose of this paper is to present a study of the compaction frequency
dependence in small‐scale tests with a purpose‐built compactor using rotating
eccentric mass oscillators and to describe a novel method for calculating the
frequency response. This compactor is significantly more similar to a vibratory roller
than the previous equipment with regard to dynamic‐to‐static load ratio. The tests
were conducted in order to study the influence of f on the degree of compaction.
The influence of w was also investigated by conducting tests on dry sand and sand
with w close to its optimum water content (OWC). It is well‐known that soil is more
easily compacted close to OWC. However, this effect is less pronounced for coarse‐
grained soils.
Methods and Materials
To investigate the influence of f on the compaction of sand using rotating eccentric
mass oscillators, small‐scale tests were conducted in a sand‐filled box with inner
measurements 1100 mm x 700 mm x 370 mm (W x L x H). The test equipment is
shown in Fig. 1. Two oscillators (Lofgren Engineering NEG 5020) were mounted on a
steel rod that could move vertically but not horizontally. The eccentric masses were
counter‐rotating, thus producing only a vertical vibration component. An 84 mm

3
diameter steel plate was connected to the bottom of the rod. A force transducer and
a vertical accelerometer were placed above the plate. The total mass of the vertically
moving system was 28.8 kg, resulting in 51 kPa static contact stress. In some tests,
geophones were placed in the sandbox, on the box’s perimeter or on the concrete
floor.
Material Properties
The test material consisted of washed sand with d60 = 0.9 mm and d10 = 0.2 mm.
Proctor tests were conducted for w above 3%. The tests showed constant Proctor
density for all values of w with a slight increase close to the maximum w (12.3%),
which is a typical behavior for free‐draining granular soil. The dry sand had a w of
less than 0.2%. In the tests with wet sand, a mean value of w of 9% was aimed for.
Due to the shape of the Proctor curve, small variations in w were considered to have
insignificant influence of the test results. The density of the dry sand was 1655 kg/m3 on average with a sufficiently small variation.
Test Procedure
Before each test, the box was excavated and refilled with sand. The sand was filled
by pouring, using the same procedure to obtain a similar initial in all tests. In the tests where wet sand was used, w was also measured in a number of locations
throughout the test box and modified if necessary. After filling, the center of the
FIG. 1 – The test box and experimental setup.

4
sand surface was preloaded by placing a 195 mm x 195 mm wooden plate between
the steel plate and the surface of the sand and then vibrating the system at 100 Hz
for 20 seconds. After preloading, the wooden plate was removed and the system
was vibrated at the current f of that test for 30 seconds. The duration was chosen
such that the settlement of the steel plate, S, for every tested f was below the
maximum S that the system was designed for, i.e. 60 mm. A constant duration
implies that the number of cycles and consumed energy is dependent on f but this is
also true in the case of roller compaction. During the test, S was measured by a
linear variable differential transformer (LVDT), the reaction force F by a force
transducer above the bottom plate and the vertical acceleration a by an
accelerometer mounted on top of the plate.
Data Evaluation
All measured quantities were analyzed directly in the time domain. Furthermore, the
measured a was analyzed in the frequency domain and also integrated to velocity v
and displacement u. The static displacement of the LVDT is denoted settlement S to
avoid confusion with dynamic particle displacement u. Each test was conducted at a
discrete f that was set in the frequency converter. However, due to some frequency
lag in the oscillators, the actual f was lower than the nominal value (that specified in
the frequency converter). To analyze the correct f, the value obtained by frequency
analysis of the measured acceleration signal, rather than the nominal operating
value of the frequency converter, was adapted as f of each particular test.
Since the sand below the plate was compacted during the tests, the stiffness
increased, changing the measured dynamic signals. There are thus no obvious values
to represent the measured and evaluated amplitudes since they varied over time.
The root mean square (RMS) was here used to find a representative value. It is often
used as an average measure of a periodic signal. The RMS value gRMS of a function g,
over a time period t1 to t2, is calculated by Eq 1.
| | (1)
Commonly, the RMS is not calculated over the whole signal but rather in short time
domain windows, called running RMS. The time window is chosen in relation to
frequency so that a sufficient number of oscillations are included in one interval,
while still capturing variations of the signal amplitude. For each F, a, v and u time
history, the 0.5 second running RMS was calculated. The maximum value of that
running RMS was then adopted as a representative value of the amplitude for
further evaluation. Since compaction is governed by the magnitude of shear strain , where a small increment in strain can have a dramatic effect on the rate of

5
compaction (Wersäll and Larsson 2013), the maximum RMS is assumed to be more
representative than the mean RMS.
Calculation of Frequency Response
There is at present no model for estimating compaction (increase in density) at
different f but there are methods to estimate the frequency response (output of the
system at different frequencies) of dynamic quantities such as u and a. Nonlinear soil
behavior can be estimated by an iterative methodology using empirical expressions,
as described below. A further consideration is the response of the finite sand layer in
comparison to the calculated response of a half‐space, as has been shown
experimentally by Mandal et al. (2012).
The displacement frequency response of a single degree of freedom system can be
calculated using Eq 2.
(2)
where
u0 = displacement amplitude
F0 = applied force amplitude,
k = spring stiffness,
= dimensionless frequency, and
= damping ratio.
The spring stiffness k and damping ratio for a vibrating foundation on a half‐space are calculated using Eqs 3 to 5 according to Lysmer and Richart (1966).
(3)
. (4)
(5)
where
G = shear modulus,
r0 = plate radius,
= Poisson’s ratio,
Bz = mass ratio, and
m = total mass.

6
The total mass m is usually assumed to consist of the mass of the foundation and a
widely discussed apparent mass. This is not an actual oscillating mass but rather a
correction for the decrease in stiffness, observed in measurements of foundation
response (Richart and Whitman 1967; Gazetas 1983). Several authors have ignored
this correction, as discussed by Susante and Mooney (2008). The calculated apparent
mass, using the test properties herein, becomes less than one percent of the
foundation mass and is therefore disregarded.
The dimensionless frequency is the ratio between the circular frequency and the natural circular frequency n, according to Eqs 6 and 7.
(6)
(7)
The applied force amplitude from a rotating eccentric mass vibrator is determined by
Eq 8.
(8)
where
mee = eccentric moment, consisting of the eccentric mass me and the
eccentricity e.
Reduction of G with increasing (strain‐softening) has been studied by many authors
(Hardin and Drnevich 1972a; Vucetic and Dobry 1991; Rollins et al. 1998; Massarsch
2004, among others) and there exist several empirical models for estimating G and at increasing . Wersäll and Larsson (2013) showed that modulus reduction is closely
related to rearrangement of soil particles and compaction. Hardin and Drnevich
(1972b) proposed that G and should be adjusted for according to Eqs 9 and 10.
(9)
1 (10)
where
Gmax = small strain modulus,
r = a reference strain, based on soil properties, and
max = maximum damping ratio.
For clean dry sand, max is 33% in the first loading cycle according to Hardin &
Drnevich (1972b). Rollins et al. (1998) developed an approximation for gravel
without the use of a reference strain, shown in Eqs 11 and 12.

7
. (11)
0.8 18 1 0.15 . . (12)
Massarsch (2004) proposed an expression for modulus reduction of fine‐grained soils
presented in Eq 13.
(13)
where
and are empirically determined parameters depending on plasticity index
(PI).
Note that in Equations 11‐13 above is expressed as a percentage. Furthermore, the
equations are here displayed as given in the papers but to be valid even for strains
less than zero, the absolute value of should be applied instead of the negative value. All models exhibit weaknesses. Eq 9 matches measured data quite poorly and
the reference strain is difficult to determine. Eq 11 does not approach unity for very
low strains, and hence does not capture the small‐strain modulus. Eq 13 is only valid
for PI larger than 10% and thus does not include data from tests on granular soils. Eq
2 was used to calculate the theoretical u0 of the rotating mass system in the
frequency domain. To obtain strain‐dependent G and , however, u0 must be
converted to . This means that the compressive strain must first be calculated
from u0 by dividing it by the total length of the strained element. Strain is not evenly
distributed but this simplification is, however, necessary. The sand volume which
influences the dynamic properties of the system has been found by other authors to
extend to a depth of 2.5 to 3 times the plate diameter (Baidya and Murali Krishna
2001; Mandal and Baidya 2004). Since the plate diameter is 84 mm in diameter and
the sand depth is 120 mm, the entire depth of the sand can be assumed to affect the
system. However, by far the most of influence is obtained from the top part of the
sand layer. The simplification of regarding the sand bed as a half‐space is therefore
assumed to be reasonable, although in reality the underlying concrete has a slight
influence on the results. The shape of the strain distribution over depth can be
assumed to follow the Boussinesq stress distribution. This is simplified to a triangular
distribution over two thirds of the depth of the sand layer, which is further simplified
to an evenly distributed strain over one third of the sand depth. Hence, the length of
the strained element is considered to be 40 mm. After is obtained, can be calculated by Eq 14 (for axisymmetric conditions).
1 (14)

8
Each point in the response diagram represents a magnitude of , which corresponds to a value of G and a value of . After these have been calculated, a new value of can be obtained using the procedure above. This is iterated until u0 converges for
every f. The number of iterations is quite small, generally between 5 and 10, which
agrees well with the number of iterations required in the similar iteration procedure
described by Schnabel et al. (1972). In this study, Eq 13 is used to calculate G even
though it is based on empirical data from fine‐grained soils. The parameters and are chosen for PI = 10 %, which is the lowest PI available for that expression. Stokoe
et al. (1999) showed that strain‐softening for soils with low PI and for non‐plastic
soils is very similar. This uncertainty is thus considered to be less significant than the
uncertainties in Eqs 9 and 11. The damping ratio is calculated by Eq 10, assuming
max = 33%. After iteration, the strain‐dependent frequency response for u0 is
obtained, which can be converted to the response for velocity amplitude v0,
acceleration amplitude a0 or F0.
Results and Discussion
This section presents the results from 105 small‐scale compaction tests conducted
using the same procedure, changing only f and w. Dry sand was used in 60 tests and
45 tests were conducted using wet sand with a water content of around 9%.
Summaries of all test results, presented with selected quantities, are shown below.
Control measurements using geophones showed v0 up to 10 mm/s in the sand, 25
cm from the plate, and up to 2 mm/s on the concrete floor.
In the small‐scale tests described in the previous paper, the correlation between S
and compaction was an issue due to observable heave on the sand surface. In the
present tests, however, no heave could be observed at the surface in spite of
significant S. Fig. 2 shows the bottom plate after end of compaction in a test using
wet sand. The depressed square area is the result of pre‐consolidation. Since there is
no apparent heave it is considered reasonable to assume that S is closely related to
compaction, i.e. decrease in volume and increase in density.
Fig. 3 shows an example of a time history of measured vertical a, F, and S in a test of
dry sand at 45 Hz. Over the 30‐second duration of the test, S nearly reaches its
maximum, as can be seen at the bottom of the figure. During roller compaction,
most of the achievable settlement, but not all, is cumulated (demonstrated by the
fact that increasing the number of passes above what is customary increases the
degree of compaction slightly) and the test duration is thus considered to fairly well
represent that of compaction by vibratory roller. Since the soil below the plate

9
becomes stiffer as it is compacted, F0 increases during the test. The constant
quantity during the tests was mee.
Frequency Response
The conventional calculated frequency response, not corrected for strain‐softening,
of a0 and u0 is shown in Fig. 4 for different values of the soil shear wave speed cS. Eq
2 was used to calculate u0 while a0 was obtained by multiplying u0 by 2. The
eccentric moment was mee = 3.81∙10‐3 kgm, which was constant throughout all tests.
FIG. 2 – End of compaction with no observable heave.
FIG. 3 – Vertical acceleration of the plate, reaction force and settlement in a 45 Hz
test.

10
The known quantities r0 = 42 mm, m = 28.8 kg and = 1655 kg/m3 (for dry sand)
were applied and Poisson’s ratio was assumed to be = 0.30. The value of a0 at resonance increases drastically with cS while it is constant for u0. The same is true for
the amplitudes a0 and u0 when f increases well above resonance.
As can be seen from Fig. 4a, a0 approaches extreme values with high cS and f due to
the significant increase in F0 with f (Eq 8). In reality, the high associated with high loads causes the stiffness of the soil to reduce drastically, implying much lower
values of a0 and u0, as well as of fr. When strain‐softening is considered, the response
displayed in Fig. 4 is therefore dramatically different.
The calculated frequency response, incorporating the effect of strain‐softening, is
shown below together with respective measured variables. The strain‐dependent u0
response was calculated by Eqs 2, 10 and 13 and iterated until convergence. The
quantities a0, v0 and F0 were calculated from the strain‐dependent u0. The shear
wave speed in the model was adjusted so that the calculated fr became identical to fr
of the compactor‐soil system, which is apparent from the measured data, i.e. 42 Hz.
This resulted in cS = 200 m/s.
FIG. 4 – Calculation of acceleration and displacement amplitudes without correction
for strain‐softening.
0 50 100 150 2000
20
40
60
Frequency (Hz)
Acc
ele
ratio
n (
g)
(a)
0 50 100 150 2000
0.5
1
1.5
Frequency (Hz)
Dis
pla
cem
en
t (m
m) (b)
cS = 50 m/s
cS = 100 m/s
cS = 200 m/s

11
The measured and calculated a0 is shown in Fig. 5. Considering the many
uncertainties, both in the calculation and the test procedures, the agreement is fairly
good. Resonance is not clearly visible due to the large degree of damping, resulting
in no peak but rather a continuously increasing a0. Comparing the scales between
Fig. 4a and Fig. 5, one can clearly observe how strongly strain‐softening affects the
dynamics of the system. The tests with wet sand produced slightly higher values of
a0. Fig. 6 shows the corresponding relation for v0. There is a good correlation up to fr.
Above this frequency, measured values are relatively constant while the calculated
values increase.
The particle displacement amplitude u0 as a function of f for all tests is shown in Fig.
7. The maximum u0 appears at fr, 42 Hz. The data, obtained by double integration of
measured a, agree with the calculated frequency response but with some scatter.
The tests with wet sand follow the same trend as those with dry sand. Fig. 8 shows
measured and calculated F0, which increases rapidly up to fr and is then fairly
constant. The results in the figures above agree well with the u0‐f and F0‐f
relationships in Anderegg and Kaufmann (2004), measured during roller operation
using a high mee.
FIG. 5 – Measured maximum RMS value of acceleration amplitude and calculated
frequency response.
0 20 40 60 80 1000
1
2
3
4
5
Frequency (Hz)
Acc
ele
ratio
n (
g)
Dry sandWet sandCalculated

12
FIG. 6 – Maximum RMS value of particle velocity amplitude from measured and
calculated frequency response.
FIG. 7 – Maximum RMS value of particle displacement amplitude from measurement
and calculated frequency response.
0 20 40 60 80 1000
20
40
60
80
100
Frequency (Hz)
Ve
loci
ty (
mm
/s)
Dry sandWet sandCalculated
0 20 40 60 80 1000
0.05
0.1
0.15
0.2
0.25
Frequency (Hz)
Dis
pla
cem
en
t (m
m)
Dry sandWet sandCalculated

13
Compaction
The tests provided the opportunity to study the influence of u0, v0, a0 and F0 on the
compaction efficiency in order to determine whether there is a single governing
quantity. The previous tests with the electro‐dynamic oscillator indicated that v0 is
governing for compaction with such an oscillator. Fig. 9 shows the total S at each
test, versus different measured dynamic quantities. In Fig. 9a, S is displayed as a
function of maximum F RMS value. Although S increases with higher F0, the
correlation is weak, indicating that there are other parameters that have significant
influence, provided the measurement error is small. The same is true for S versus u0
and v0, shown in Fig. 9b and c, respectively. The acceleration amplitude a0, however,
has a more obvious influence on S, as can be seen from Fig. 9d. Nonetheless, there is
a large scatter and a0 cannot be solely governing for compaction. These results
confirm that there is no exclusive quantity that is essential for soil compaction and
that f affects compaction to a large extent. The relationship between compaction
and dynamic quantities is, however, complex since the considered quantities are
correlated to each other.
FIG. 8 – Measured maximum RMS value of force amplitude and calculated frequency
response.
0 20 40 60 80 1000
100
200
300
400
500
Frequency (Hz)
Fo
rce
(N
)
Dry sandWet sandCalculated

14
The total S, closely related to compaction, is shown in Fig. 10 as a function of f. The
results from the tests with wet sand are similar to those with dry sand, except for S
being slightly larger, roughly up to 25%. The water content affects cS, which in turn
affects fr but the results show that the difference in fr between dry and wet sand is
negligible. In a practical regard, w thus only affects the degree of compaction and
the effect on the dynamic properties of the soil is insignificant. There is resonant
amplification, causing a higher degree of compaction around fr at 42 Hz.
There are some uncertainties in the results. What appears to be scatter just below fr
in Fig. 10 (approximately 30‐40 Hz) is on closer inspection caused by a sudden rapid
decrease in settlement around 35 Hz. This is more obvious in Fig. 11 where S has
been normalized by the measured F0. It can be clearly seen that the S‐to‐F0 ratio
increases up to a certain f and then falls suddenly. This f is below fr, implying that just
below this threshold, the soil is easily compacted by a small F0 while the opposite is
true directly above the threshold. The phenomenon has yet to be explained and is a
subject for further study. The explanation might be a nonlinear resonance effect or
the transition between different compaction modes (such as contact and loss of
contact). Another explanation may be the threshold representing the resonant
FIG. 9 – Measured settlement as a function of force, displacement, velocity and
acceleration amplitudes.
0 100 200 300 400 5000
10
20
30
40
50
60
Force (N)
Se
ttle
me
nt (
mm
)
(a)
DryWet
0 0.05 0.1 0.15 0.2 0.250
10
20
30
40
50
60
Displacement (mm)
Se
ttle
me
nt (
mm
)
(b)
DryWet
0 20 40 60 800
10
20
30
40
50
60
Velocity (mm/s)
Se
ttle
me
nt (
mm
)
(c)
DryWet
0 1 2 3 4 50
10
20
30
40
50
60
Acceleration (g)
Se
ttle
me
nt (
mm
)
(d)
DryWet

15
frequency of the test box causing the whole box to oscillate above the threshold
while acting as a rigid body below. What is clear, however, is that in this frequency
region, the degree of compaction obtained is highly variable.
FIG. 10 – Settlement of dry and wet sand.
FIG. 11 – Settlement normalized by force amplitude.
0 20 40 60 80 1000
10
20
30
40
50
60
Frequency (Hz)
Se
ttle
me
nt (
mm
)
Dry sandWet sand
0 20 40 60 80 1000
0.1
0.2
0.3
0.4
0.5
Frequency (Hz)
Se
ttle
me
nt/F
orc
e (
mm
/N)
DryWet

16
Discussion in the Context of Roller Compaction
In a practical regard, the degree of compaction can be divided into four different
frequency ranges, shown schematically in Fig. 12 together with the above test
results. Range I, very low f, gives S close to zero, i.e. no compaction in addition to the
static compaction. In Range II, the achieved degree of compaction is increases
rapidly, but it is not recommended to operate within this range since the compaction
effect is very variable, as discussed above. Range III contains the frequencies directly
above resonance, where the degree of compaction decreases slightly as f is
increased. In Range IV, high f, it again increases rapidly.
From Fig. 12 it would seem that Range IV is the optimal for roller compaction and
that a high f is more favorable. However, if the compaction aspect is disregarded,
there are machine‐related disadvantages to operating at a high f. Most obvious is
the increased wear to machine parts, e.g. the hydraulics. The lifespan of the vibrator
is also shortened as it depends on the total number of cycles. Furthermore, a high f
will increase fuel consumption and emissions. It is thus favorable not to operate at a
higher f than necessary.
The coupled roller‐soil fr depends on machine and soil properties and is often not
known. Full‐scale tests must be conducted to determine where roller operation
takes place in relation to the frequency ranges in Fig. 12. If f is at the high end of
Range IV, lowering f would imply a reduced compaction effect. However, if the roller
FIG. 12 – Assignment of four frequency ranges, shown schematically together with
measured data from the small‐scale tests.
Frequency
Se
ttle
me
nt
I II III IV

17
operates at the higher end of Range III or the low end of Range IV, reducing f slightly
to the lower end of Range III would have several advantages. Firstly, the compaction
effect might increase to some extent. Secondly, lower f would increase the lifespan
of the machine and decrease the power of the engine, which would decrease fuel
consumption. The decreased consumption together with the more effective
compaction could mean significant reductions in emissions. In conclusion, while the
effect of lowering f is positive for reducing machine wear and emissions, the effect
on the compaction efficiency depends on the current compaction frequency in
relation to fr. It is possible that the optimal operating frequency is somewhat above
resonance. However, this has yet to be studied in full‐scale tests.
Conclusions
Dry and wet sand was compacted in 105 unique small‐scale tests using rotating
eccentric mass oscillators. The following conclusions are drawn from this study:
Investigation of frequency‐dependent compaction of sand was made possible
in the present small‐scale tests.
The tests showed less controllability and higher scatter in the results than
previous tests but successfully imitated the dynamic‐to‐static load ratio of
roller compaction.
No heave could be observed and it is thus assumed that the displacement of
soil during compaction was minimal.
The presented method for calculating frequency response, considering strain‐
dependent soil properties, successfully predicted measured dynamic
quantities.
Measured displacement amplitude versus frequency and force amplitude
versus frequency relationships agreed well with published literature.
There is no single dynamic quantity that is governing for soil compaction, but
rather a combination. Frequency has a substantial influence.
Frequency‐dependent compaction exhibits a local maximum around
resonance, producing more efficient compaction close to this frequency. Well
above resonance, increasing the frequency implies a higher degree of
compaction.
The above results contain dynamic effects that need to be further investigated.
Possible reasons for these effects are discussed above. It is desirable to fully
understand these phenomena before studying the practical implications for roller
compaction in full‐scale tests. It is possible that roller compaction could be optimized

18
by adjusting the frequency with regard to compaction efficiency, emissions and
lifespan of machine parts.
Acknowledgments
This study was funded by the Development Fund of the Swedish Construction
Industry (SBUF) and Dynapac Compaction Equipment AB. The test equipment was
assembled and calibrated by Dr. Kent Lindgren at the Marcus Wallenberg Laboratory
for Sound and Vibration Research. The valuable comments by Dr. Anders Bodare and
Dr. K. Rainer Massarsch are highly appreciated.
References
Adam, D., 1996., Flächendeckende Dynamische Verdichtungskontrolle (FDVK) mit
Vibrationswalzen [Continuous Compaction Control with Vibratory Rollers], PhD
thesis, University of Vienna, Vienna, Austria (in German).
Anderegg, R. and Kaufmann, K., 2004, “Intelligent Compaction with Vibratory
Rollers,” Transportation Research Record. 1868, Transportation Research Board,
Washington, D.C., pp. 124–134.
Baidya, D. K. and Murali Krishna, G., 2001, “Investigation of Resonant Frequency and
Amplitude of Vibrating Footing Resting on a Layered Soil System,” Geotech. Test. J.,
Vol. 24(4), pp. 409–417.
Bernhard, R. K., 1952, “Static and Dynamic Soil Compaction,” Highw. Res. Board,
Proc. Annu. Meet., Vol. 31, pp. 563–592.
Converse, F. J., 1953, “Compaction of Sand at Resonant Frequency,” ASTM Spec.
Tech. Publ. No. 156, pp. 124–137.
D’Appolonia, D. J., Whitman, R. V. and D’Appolonia, E., 1969, “Sand Compaction with
Vibratory Rollers,” J. Soil Mech. Found. Div., Vol. 95, No. 1, pp. 263–284.
Dobry, R. and Whitman, R. V., 1973, “Compaction of Sand on a Vertically Vibrating
Table,” Evaluation of Relative Density and Its Role in Geotechnical Projects Involving
Cohesionless Soils, ASTM STP 523, ASTM International, West Conshohocken, PA, pp.
156–170.
Facas, N. W., Rinehart, R. V. and Mooney, M. A., 2011, “Development and Evaluation
of Relative Compaction Specifications Using Roller‐Based Measurements,” Geotech.
Test. J., Vol. 34, No. 6, pp. 634–642.
Forssblad, L., 1980, “Compaction Meter on Vibrating Rollers for Improved
Compaction Control,” Proceedings of International Conference on Compaction, Vol.

19
2, Paris, France, April 22‐24, 1980, Ecole Nationale des Ponts et Chaussées and
Laboratoire Central des Ponts et Chaussées, pp. 541–546.
Gazetas G., 1983, "Analysis of Machine Foundation Vibrations: State‐of‐the‐Art," Int.
J. Soil Dyn. Earthq. Eng., Vol. 2, No. 1, pp. 2‐43.
Hardin, B. O. and Drnevich, V. P., 1972a, “Shear Modulus and Damping in Soils:
Design Equations and Curves,” J. Soil Mech. Found. Div., Vol. 98, No. 7, pp. 667–692.
Hardin, B. O. and Drnevich, V. P., 1972b, “Shear Modulus and Damping in Soils:
Measurement and Parameter Effects,” J. Soil Mech. Found. Div., Vol. 98, No. 6, pp.
603‐624.
Lysmer, J. and Richart, F. E., Jr., 1966, “Dynamic Response of Footings to Vertical
Loading,” J. Soil Mech. Found. Div., Vol. 92, No. 1, pp. 65–91.
Mandal, A. and Baidya, D. K., 2004, “Effect of Presence of Rigid Base within the Soil
on the Dynamic Response of Rigid Surface Foundation,” Geotech. Test. J., Vol. 27,
No. 5, pp. 475–482.
Mandal, A., Baidya, D. K. and Roy, D., 2012, “Dynamic Response of the Foundations
Resting on a Two‐layered Soil Underlain by a Rigid Layer,” Geotech. Geol. Eng., Vol.
30, Issue 4, pp. 775‐786.
Massarsch, K. R., 2004, “Deformation Properties of Fine‐Grained Soils from Seismic
Tests,” Keynote lecture, Proceedings of the Second International Conference on Site
Characterization, ISC’2, Porto, Portugal, September 19‐22, 2004, International
Society of Soil Mechanics and Geotechnical Engineering, London, England, pp. 133–
146.
Mooney, M. A. and Rinehart, R. V., 2009, “In Situ Soil Response to Vibratory Loading
and Its Relationship to Roller‐Measured Soil Stiffness,” J. Geotech. Geoenviron. Eng.,
Vol. 135, No. 8, pp. 1022–1031.
Richart, F. E. and Whitman, R. V., 1967, “Comparison of Footing Vibration Tests with
Theory,” J. Soil Mech. Found. Div., Vol. 93, No. 6, pp. 143‐168.
Rollins, K. M., Evans, M. D., Diehl, N. B. and Daily, W. D. III, 1998, ”Shear Modulus
and Damping Relationships for Gravels.” J. Geotech. Geoenviron. Eng., Vol. 124, No.
5, pp. 396–405.
Schnabel, P. B., Lysmer, J. and Seed, H. B., 1972, SHAKE: a Computer Program for
Earthquake Response Analysis of Horizontally Layered Sites, Earthquake Engineering
Research Center, University of California, Berkeley, 92 p.
Stokoe, K. H., II, Darendeli, M. B., Andrus, R. D., and Brown, L. T., 1999, “Dynamic soil
properties: Laboratory, field and correlation Studies,” Proceedings of the Second

20
International Conference on Earthquake Geotechnical Engineering, Vol. 3, Lisbon,
Portugal, pp. 811–845.
Susante, P. J. and Mooney, M. A., 2008, “Capturing Nonlinear Vibratory Roller
Compactor Behavior through Lumped Parameter Modeling,” J. Eng. Mech., Vol. 134,
No. 8, pp. 684‐693.
Thurner, H. and Sandström, Å., 1980, “A New Device for Instant Compaction
Control,” Proceedings of International Conference on Compaction, Vol. 2, Paris,
France, April 22‐24, 1980, Ecole Nationale des Ponts et Chaussées and Laboratoire
Central des Ponts et Chaussées, pp. 611–614.
Vucetic, M. and Dobry, R., 1991, “Effect of Soil Plasticity on Cyclic Response,” J.
Geotech. Engrg., Vol. 117, No. 1, pp. 89–107.
Wersäll, C. and Larsson, S., 2013, “Small‐Scale Testing of Frequency‐Dependent
Compaction of Sand Using a Vertically Vibrating Plate,” Geotech. Test. J., Vol. 36, No.
3, pp. 1‐10.
Yoo, T‐S. and Selig, E. T., 1979, “Dynamics of Vibratory‐Roller Compaction,” J.
Geotech. Engrg. Div., Vol. 105, No. 10, pp. 1211–1231.