influence of energy benchmarking policies on the energy
TRANSCRIPT

Walden UniversityScholarWorks
Walden Dissertations and Doctoral Studies Walden Dissertations and Doctoral StudiesCollection
2018
Influence of Energy Benchmarking Policies on theEnergy Performance of Existing BuildingsSamar HamadWalden University
Follow this and additional works at: https://scholarworks.waldenu.edu/dissertations
Part of the Sustainability Commons
This Dissertation is brought to you for free and open access by the Walden Dissertations and Doctoral Studies Collection at ScholarWorks. It has beenaccepted for inclusion in Walden Dissertations and Doctoral Studies by an authorized administrator of ScholarWorks. For more information, pleasecontact [email protected].

Walden University
College of Social and Behavioral Sciences
This is to certify that the doctoral dissertation by
Samar Hamad
has been found to be complete and satisfactory in all respects,
and that any and all revisions required by
the review committee have been made.
Review Committee
Dr. Linda Day, Committee Chairperson,
Public Policy and Administration Faculty
Dr. Raj Singh, Committee Member,
Public Policy and Administration Faculty
Dr. Lynn Wilson, University Reviewer,
Public Policy and Administration Faculty
Chief Academic Officer
Eric Riedel, Ph.D.
Walden University
2018

Abstract
Influence of Energy Benchmarking Policies on the Energy Performance of Existing
Buildings
by
Samar Hamad
MSc, Oxford Brookes University
BSc, University of Khartoum
Dissertation Submitted in Partial Fulfillment
of the Requirements for the Degree of
Doctor of Philosophy
Public Policy & Administration—Local Government Management
for Sustainable Communities
Walden University
May 2018
Abstract
Energy benchmarking and disclosure policies exist in several local and state governments
to manage the energy consumption of existing buildings and encourage energy efficient
retrofits and upgrades, yet little is known about whether these efforts have improved
overall energy efficiency. The purpose of this repeated-measures study was to examine
the influence of New York City’s (NYC’s) Benchmarking Law (LL84) on the energy
performance of the city’s existing commercial buildings through investigating whether
the energy performance of the city’s existing commercial buildings significantly
improved after the implementation of this policy. The study was based on Ostrom’s
institutional analysis and development framework. Paired-sample t tests were performed
to statistically analyze the annually disclosed energy benchmarking data for 1,072 of
NYC’s existing commercial buildings that were benchmarked in both 2011 and 2016.
Compared to 2011, the study results revealed statistically significant improvements in the
energy performance of NYC’s commercial buildings by 2016. On average, their site
energy use intensity (EUI) significantly reduced by 5%, source EUI significantly
decreased by 10%, greenhouse gas emissions significantly dropped by 12%, and
ENERGY STAR performance rating significantly improved by 5%. However, these
improvements were primarily achieved in 2012, 1 year after the city’s energy
benchmarking data were publicly disclosed. Additional measures should be considered to
maintain continuous energy savings and greenhouse gas mitigation patterns. Positive
social change implications include the potential to promote energy-efficient upgrades and
inspire the adoption of sustainable building concepts.

Influence of Energy Benchmarking Policies on the Energy Performance of Existing
Buildings
by
Samar Hamad
MSc, Oxford Brookes University
BSc, University of Khartoum
Dissertation Submitted in Partial Fulfillment
of the Requirements for the Degree of
Doctor of Philosophy
Public Policy & Administration—Local Government Management
for Sustainable Communities
Walden University
May 2018

Dedication
This dissertation is dedicated to my family for all the love, care, and support you
have accorded me through the years. You all provided me with the motivation and desire
to complete this work.

Acknowledgments
I wish to express my sincere appreciation to my committee chair and the best
professor ever, Dr. Linda Day, for her dedication, patience, wisdom, and support
throughout my entire dissertation journey; I will always remain grateful. I am also
grateful to my committee member, Dr. Raj Singh, for his professional expertise, and to
my URR committee member, Dr. Lynn Wilson, for her professional guidance.
i
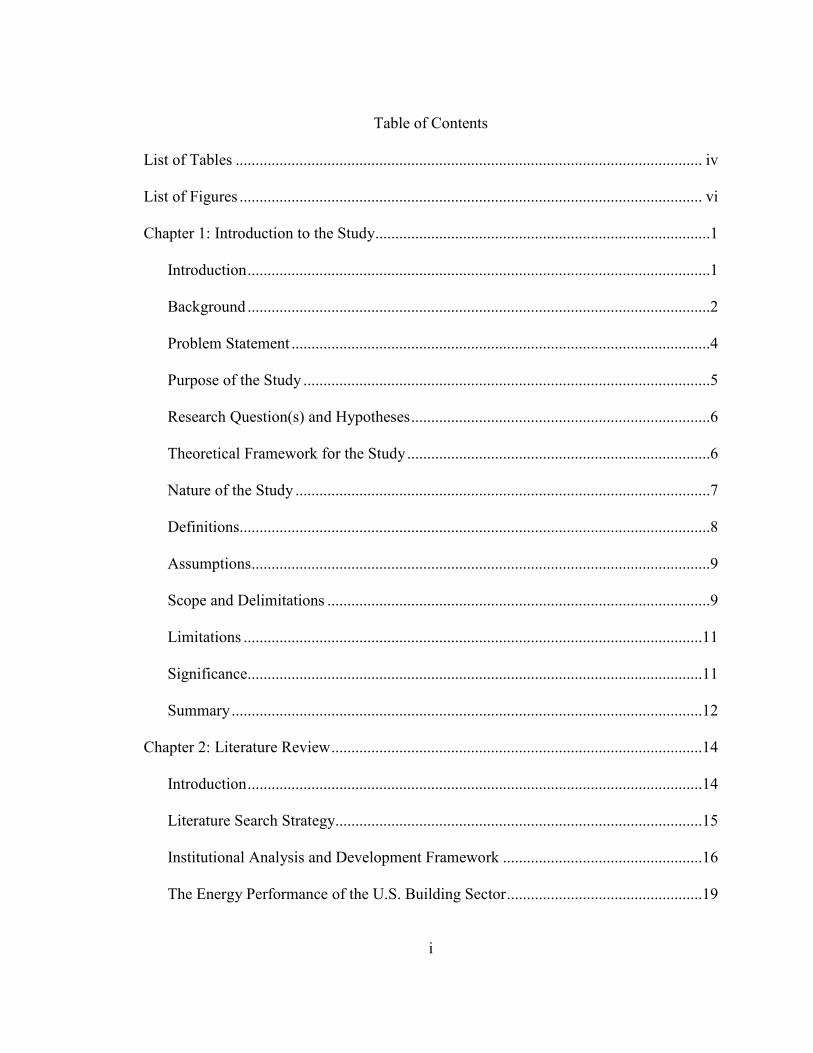
Table of Contents
List of Tables ..................................................................................................................... iv
List of Figures .................................................................................................................... vi
Chapter 1: Introduction to the Study ....................................................................................1
Introduction ....................................................................................................................1
Background ....................................................................................................................2
Problem Statement .........................................................................................................4
Purpose of the Study ......................................................................................................5
Research Question(s) and Hypotheses ...........................................................................6
Theoretical Framework for the Study ............................................................................6
Nature of the Study ........................................................................................................7
Definitions......................................................................................................................8
Assumptions ...................................................................................................................9
Scope and Delimitations ................................................................................................9
Limitations ...................................................................................................................11
Significance..................................................................................................................11
Summary ......................................................................................................................12
Chapter 2: Literature Review .............................................................................................14
Introduction ..................................................................................................................14
Literature Search Strategy............................................................................................15
Institutional Analysis and Development Framework ..................................................16
The Energy Performance of the U.S. Building Sector .................................................19

ii
The Energy Performance of Existing Commercial Buildings in the United
States ......................................................................................................... 20
Public Policies to Enhance Energy Efficiency in Existing Buildings..........................22
Energy Benchmarking and Disclosure Policies ...........................................................23
Energy Benchmarking to Address Information Failures .............................................24
The Benefits of Energy Benchmarking and Disclosure Policies .................................26
Energy Benchmarking and Disclosure Processes and Tools .......................................28
ENERGY STAR Portfolio Manager Benchmarking Tool.................................... 29
Timing and Extent of Disclosure .................................................................................32
Energy Benchmarking and Disclosure Policy Implementation ...................................33
Energy Benchmarking and Disclosure in New York City .................................... 35
Summary and Conclusion ............................................................................................37
Chapter 3: Research Method ..............................................................................................40
Introduction ..................................................................................................................40
Research Design and Rationale ...................................................................................40
Methodology ................................................................................................................43
Population ............................................................................................................. 43
Sampling and Sampling Procedure ....................................................................... 43
Data Collection ..................................................................................................... 46
Data Analysis ........................................................................................................ 47
Threats to Validity .......................................................................................................48
External Validity ................................................................................................... 48
iii
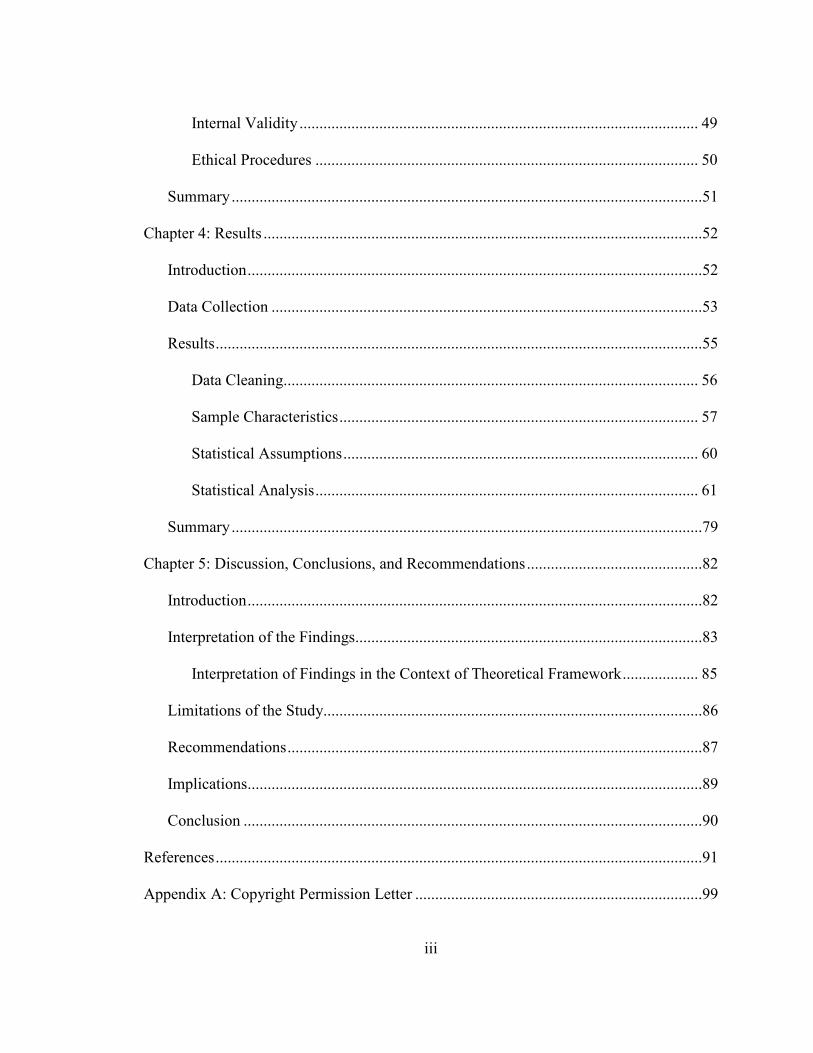
Internal Validity .................................................................................................... 49
Ethical Procedures ................................................................................................ 50
Summary ......................................................................................................................51
Chapter 4: Results ..............................................................................................................52
Introduction ..................................................................................................................52
Data Collection ............................................................................................................53
Results ..........................................................................................................................55
Data Cleaning........................................................................................................ 56
Sample Characteristics .......................................................................................... 57
Statistical Assumptions ......................................................................................... 60
Statistical Analysis ................................................................................................ 61
Summary ......................................................................................................................79
Chapter 5: Discussion, Conclusions, and Recommendations ............................................82
Introduction ..................................................................................................................82
Interpretation of the Findings.......................................................................................83
Interpretation of Findings in the Context of Theoretical Framework ................... 85
Limitations of the Study...............................................................................................86
Recommendations ........................................................................................................87
Implications..................................................................................................................89
Conclusion ...................................................................................................................90
References ..........................................................................................................................91
Appendix A: Copyright Permission Letter ........................................................................99

iv
List of Tables
Table 1. Target Population .................................................................................................45
Table 2. Threats to Internal Validity ..................................................................................50
Table 3. Sample Characteristics—Sample Distribution in NYC’s Boroughs ...................57
Table 4. Sample Characteristics—Building Categories.....................................................59
Table 5. Sample Characteristics—Office Buildings Dominating the Sample ...................60
Table 6. Site EUI—Paired Sample Statistics .....................................................................64
Table 7. Site EUI—Paired Sample Test ............................................................................64
Table 8. Paired Samples Statistics—Site EUI Annual Consumption Pattern From
2011 to 2016 ..........................................................................................................65
Table 9. Paired Samples Test—Site EUI Annual Consumption Pattern From 2011
to 2016 ...................................................................................................................66
Table 10. Source EUI—Paired Samples Statistics ............................................................68
Table 11. Source EUI—Paired Samples Test ....................................................................68
Table 12. Paired Samples Statistics—Source EUI Annual Consumption Pattern
From 2011 to 2016 .................................................................................................69
Table 13. Paired Samples Test—Source EUI Annual Consumption Pattern From
2011 to 2016 ..........................................................................................................70
Table 14. GHG Emissions—Paired Samples Statistics .....................................................72
Table 15. GHG Emissions—Paired Samples Test .............................................................73
Table 16. Paired Samples Statistics—Annual GHG Emissions Pattern From 2011
to 2016 ...................................................................................................................74

v
Table 17. Paired Samples Test—Annual GHG Emissions Pattern From 2011 to
2016........................................................................................................................74
Table 18. ENERGY STAR Score—Paired Samples Statistics ..........................................76
Table 19. ENERGY STAR Score—Paired Samples Test .................................................77
Table 20. Paired Samples Statistics—Annual ENERGY STAR Score Pattern
From 2011 to 2016 .................................................................................................78
Table 21. Paired Samples Test—Annual ENERGY STAR Score Pattern From
2011 to 2016 ..........................................................................................................78

vi
List of Figures
Figure 1. Institutional analysis and development (IAD) framework .................................17
Figure 2. Buildings’ sector energy consumption ...............................................................19
Figure 3. Percentage of total carbon emissions from building sector ................................20
Figure 4. Sample distribution in NYC’s boroughs—number of buildings (a) total gross
floor area (b) .........................................................................................................58
Figure 5. Site EUI histogram for NYC commercial buildings’ 2011 benchmarking data
(a) and 2016 data (b) ..............................................................................................63
Figure 6. Site EUI annual consumption pattern from 2011 to 2016 ..................................66
Figure 7. Source EUI histogram for NYC commercial buildings’ 2011 benchmarking data
(a) and 2016 data (b) ..............................................................................................68
Figure 8. Source EUI annual consumption pattern from 2011 to 2016 .............................70
Figure 9. GHG emissions histogram for NYC commercial buildings’ 2011 benchmarking
data (a) and 2016 data (b) ......................................................................................71
Figure 10. Annual GHG emissions pattern from 2011 to 2016 .........................................75
Figure 11. ENERGY STAR scores histogram for NYC commercial buildings’ 2011
benchmarking data (a) and 2016 data (b) ..............................................................76
Figure 12. Annual ENERGY STAR scores pattern from 2011 to 2016 ............................79

1
Chapter 1: Introduction to the Study
Introduction
Buildings are contributing to continuously rising global energy demands and
greenhouse gas (GHG) emissions worldwide. Activities in the building industry involve
the use of land, depletion of materials/resources, and consumption of energy (Gruber et
al., 2015; Hsu, 2014a). Recent statistics from the United Nations Environment
Programme’s Sustainable Building and Climate Initiative (UNEP-SBCI, 2014) indicate
that buildings are estimated to consume approximately 40% of global resources and 60%
of the world’s electricity. The rapid growth of urban communities across the world in
addition to the rising costs of energy led to a growing demand for sustainable buildings in
order to reduce the great impact of the building sector on the environment (Gruber et al.,
2015; Ma et al., 2012). Although most new buildings are constructed in compliance with
energy-efficiency codes, existing buildings are considered an ongoing cause of energy
resource depletion and GHG emissions in cities with considerable numbers of older
buildings. Because it is difficult to mandate energy-efficient retrofits of privately owned
existing buildings, energy benchmarking and disclosure policies are implemented to
measure the energy use of existing buildings. The policies are intended to provide a
reliable source of energy information that makes it possible to track and compare the
energy performance of existing buildings (Palmer & Walls, 2015). This study is socially
significant because it may help to publicize the notion of energy efficiency within the
existing building sector in particular, as well as enhance the sustainable building concept
in general. Although energy benchmarking and disclosure policies have been in place for

2
almost a decade, the effect of those policies on the energy performance of existing
buildings is still unknown. This study assessed the effectiveness of the policies by
examining and comparing the energy performance patterns of existing buildings after the
policies’ adoption. The results of this study provide information concerning whether or
not energy was saved, and precisely how much energy was saved.
In this chapter, a brief summary of the research literature related to the study topic
is presented, and the relevant gap in knowledge leading to the need for the study is
identified. In addition, the purpose of the study is further explained, and the research
question and hypotheses are stated. The theoretical framework on which the study is
based is identified, and the research design and methodology are briefly summarized.
Furthermore, definitions of key terms are provided, and study assumptions and
limitations are identified.
Background
Buildings around the world are responsible for 40% of global energy
consumption; they consume one-fourth of global water, and as a key contributor to global
carbon emissions they represent the source of one-third of global GHG emissions
(UNEP-SBCI, 2014). The building sector in the United States is the largest single energy
consumer in the nation. U.S. buildings represent the primary users of electric power; they
account for around one-third of the nation’s natural gas consumption (Energy
Information Administration [EIA], 2015), and they are responsible for 36% of the
nation’s total GHG emissions that are related to climate change (Environmental
Protection Agency [EPA], 2014). In many major U.S. cities that have a larger stock of

3
old buildings, the building sector contributes up to 75% of GHG emissions (Institute for
Market Transformation [IMT], 2013). Reducing the great impact of the building sector on
the ecological system and thereby maintaining sustainability requires the reduction of
existing buildings’ energy consumption. Establishing proper energy governance methods
and processes to improve the energy performance of existing buildings is critical for
governments at all levels to meet their energy-saving and carbon-emission goals
(Mattern, 2013). Improving the energy performance of existing buildings can provide a
significant opportunity to save energy (UNEP-SBCI, 2014).
A variety of public policies were recently implemented in the United States and
across the world to regulate the building industry and integrate energy efficiency within
the building sector (Gruber et al., 2015; Mattern, 2013). Among these policies are the
energy benchmarking and disclosure policies that were recently adopted by several states
and local governments throughout the nation to emphasize sustainable urban
development of U.S. centers. The policies focus on establishing an energy performance
baseline to observe and track the energy performance of existing buildings over time and
compare their average energy use to that of similar buildings (Cox et al., 2013; Hsu,
2014b). The policies also aim to tackle the issue of the energy-efficiency gap in the real
estate market by creating reliable sources of standardized energy-efficiency data that will
help building owners and managers to recognize energy-saving opportunities and
encourage investments in energy-efficiency projects in the market (Cluett & Amann,
2013; Cox et al., 2013; Ma et al., 2012; Palmer & Walls, 2015). In addition to improving
the energy performance of existing buildings, the policies have a wide range of benefits,

4
including increased competition and market choice, job creation, and energy and cost
savings (Palmer & Walls, 2015). Improving the energy performance of existing building
stock allows cities to meet their energy-saving goals, cut their GHG emissions, and
ultimately reduce the negative impact of the building sector on the environment (Cluett &
Amann, 2013).
Problem Statement
There is a growing need to address the energy performance of the existing
building stock in the United States. Currently, the building sector accounts for 41% of
U.S. energy consumption and 36% of the nation’s total GHG emissions, approximately
half of which is attributed to the commercial building sector (EPA, 2014). Building codes
and regulations set by many jurisdictions demand that new buildings achieve a minimum
level of energy efficiency. However, it is very challenging to regulate and enforce energy
retrofits to existing buildings, especially given that the average age of commercial
buildings in the United States is 50 years (Commercial Building Inventory [CBI], 2012).
Recently, several major U.S. cities adopted policies mandating the energy
benchmarking of commercial buildings and the disclosure of their annual energy use.
Such policies aim to explain the energy use of commercial buildings, create reliable tools
to measure the energy performance of existing buildings, and ultimately encourage
energy efficient retrofits and upgrades by addressing information failures due to lack of
reliable standardized energy-efficient consumption data in the real estate market (Cluett
& Amann, 2013; Cox et al., 2013; Ma et al., 2012; Palmer & Walls, 2015). However, do
these policies actually influence change in the energy performance of existing buildings?

5
Using a quantitative research approach, this study examined the influence of New York
City’s Benchmarking Law (LL84) on the energy performance of the city’s existing
commercial building stock by means of paired sample t tests to compare the means of the
disclosed energy benchmarking information (energy performance indices) of NYC’s
existing commercial buildings over the past 6 years. The comparison made it possible to
assess the influence of the adopted energy benchmarking policies on the energy
performance of the existing building stock and provided an indicator of the effectiveness
of the policies (Cox et al., 2013; Hsu, 2014; Kontokosta, 2013; Palmer & Walls, 2015).
Purpose of the Study
The purpose of this study was to quantitatively assess the influence of the energy
benchmarking and disclosure policies on the energy performance of existing buildings.
The study compared the energy performance patterns of NYC’s existing commercial
buildings over the past 6 years to examine the nature of the relationship between the
policies and the energy performance of NYC’s existing commercial buildings and
determine whether the adoption of these policies is associated with improving the energy
performance of the existing commercial building stock. Paired sample t tests were
performed to compare the means of the annually disclosed energy benchmarking data
(energy performance indices) between 2011 (the first year in which the NYC
Benchmarking Law was enacted) and 2016 (the year for which energy benchmarking
data were most recently disclosed). The study compared the annual energy performance
pattern of existing commercial buildings in NYC and statistically evaluated the
6
significance of the reductions in energy consumption during this period of time in order
to assess the efficacy of the energy benchmarking and disclosure policies.
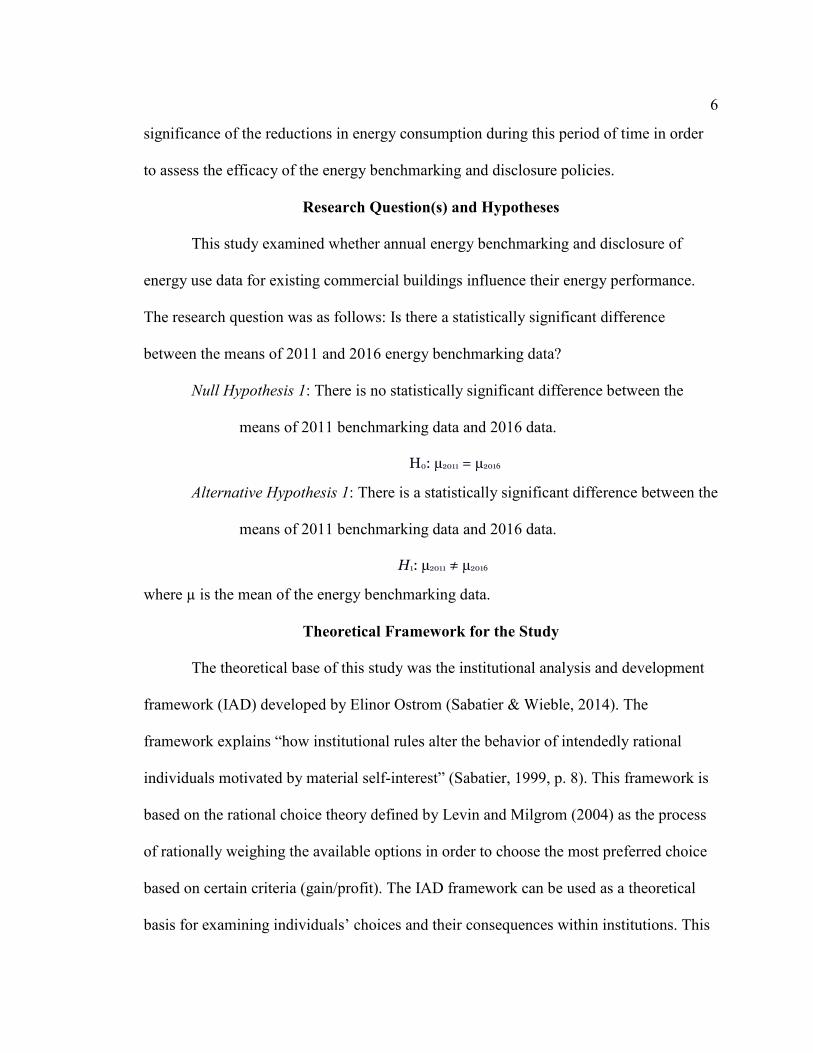
Research Question(s) and Hypotheses
This study examined whether annual energy benchmarking and disclosure of
energy use data for existing commercial buildings influence their energy performance.
The research question was as follows: Is there a statistically significant difference
between the means of 2011 and 2016 energy benchmarking data?
Null Hypothesis 1: There is no statistically significant difference between the
means of 2011 benchmarking data and 2016 data.
H0: µ2011 = µ2016
Alternative Hypothesis 1: There is a statistically significant difference between the
means of 2011 benchmarking data and 2016 data.
H1: µ2011 ≠ µ2016
where µ is the mean of the energy benchmarking data.
Theoretical Framework for the Study
The theoretical base of this study was the institutional analysis and development
framework (IAD) developed by Elinor Ostrom (Sabatier & Wieble, 2014). The
framework explains “how institutional rules alter the behavior of intendedly rational
individuals motivated by material self-interest” (Sabatier, 1999, p. 8). This framework is
based on the rational choice theory defined by Levin and Milgrom (2004) as the process
of rationally weighing the available options in order to choose the most preferred choice
based on certain criteria (gain/profit). The IAD framework can be used as a theoretical
basis for examining individuals’ choices and their consequences within institutions. This

7
framework involves the analysis of regular actors within the context of institutional
interaction (Sabatier & Wieble, 2014). Based on the IAD framework, private sector
building owners, operators, and prospective buyers consider disclosed energy
benchmarking data to weigh the risks and rewards of their energy-efficient investment
decisions. Thus, this theoretical framework allows for making choices—based on rational
choice theory—to weigh benefits (e.g., future saving in running costs, higher occupancy
rates, and property value) and limitations (e.g., initial cost of energy-efficient projects) in
order to reach a decision that generates the most gains.
Nature of the Study
This quantitative study statistically analyzed the energy performance indices (the
annually disclosed energy-use benchmarking data) of all existing commercial buildings
that benchmarked in both 2011 and 2016 in the selected city (New York City, NY) and
used paired sample t tests to compare the energy performance patterns of the city’s
existing commercial buildings over the past 6 years. This repeated measure design
allowed to determine whether there was a statistically significant difference between the
means of the paired observations — the annually measured energy performance indices
between 2011 and 2016 that were publicly disclosed after implementing the energy
benchmarking and disclosure policies (Frankfort-Nachmias & Nachmias, 2008). Hence,
the detected differences in energy consumption rates between 2011 and 2016 records
were assumed to be due to implementing the energy benchmarking policies. The broad
scope of the study suggested the use of a quantitative approach to research to provide
generalizable research findings (Creswell, 2009).

8
Definitions
Building energy use benchmarking: “A mechanism to measure energy
performance of a single building over time, relative to other similar buildings, or to
modeled simulations of a reference building built to a specific standard (such as an
energy code)” (Office of Energy Efficiency and Renewable Energy [EERE], n.d., para.
1).
Energy disclosure: The process of releasing and reporting energy benchmarking
information to another party—in most cases, to the government, prospective buyers,
potential tenants, and/or lenders, and in some cases, to the public (IMT, 2016).
ENERGY STAR Portfolio Manager: “EPA's online energy management and
tracking tool to measure and track energy and water consumption, as well as greenhouse
gas emissions” (ENERGY STAR, 2016a, para. 1).
Energy use intensity (EUI): “The unit to express a building’s energy use as a
function of its size or other characteristics. EUI is expressed as energy per square foot per
year. It’s calculated by dividing the total energy consumed by the building in one year
(measured in kBtu or GJ) by the total gross floor area of the building” (ENERGY STAR,
2016b, para. 2).
Site energy use intensity: “Energy use intensity as calculated by Portfolio
Manager at the property site in kBtus per gross square foot (kBtu/ft²), for the reporting
year” (Benchmarking Data Disclosure Definitions, 2017, p. 2).
Weather normalized source energy use intensity: “Energy use intensity as
calculated by Portfolio Manager at the source of energy generation in kBtus per gross

9
square foot (kBtu/ft²) for the reporting year, normalized for weather” (Benchmarking
Data Disclosure Definitions, 2017, p. 2).
Total greenhouse gas emissions (GHG): “The total direct and indirect greenhouse
gases emitted by the property, reported in metric tons of carbon dioxide equivalent
(MtCO2e) for the reporting year” (Benchmarking Data Disclosure Definitions, 2017, p.
3).
Water use intensity (municipally supplied potable water—indoor intensity):
“Total indoor water use at the property in gallons per square foot (gal/ft²) for the
reporting year” (Benchmarking Data Disclosure Definitions, 2017, p. 3).
ENERGY STAR scores: “1 to 100 percentiles ranking for specified building types,
calculated in Portfolio Manager, based on self-reported energy usage for the reporting
year” (Benchmarking Data Disclosure Definitions, 2016, p. 2).
Assumptions
This study is based on the assumption that energy use data annually reported to
the NYC Mayor’s Office of Sustainability are accurate and reliable, as the information
disclosure is based on automated upload of energy use data through EPA’s Portfolio
Manager (NYC Mayor’s Office of Sustainability, 2017).
Scope and Delimitations
This study was confined to existing commercial buildings located in New York
City, NY. That geographical area was chosen for two reasons. First, NYC was among the
first cities to implement energy benchmarking and disclosure policies in December
2009—a year after Washington, DC and Austin, TX—did so, which indicates the

10
availability of sufficient data for the study. Second, NYC is the largest urban center in
the United States, with the highest concentration of commercial office buildings
nationwide (IMT, 2016). The total gross floor area covered by the NYC Benchmarking
Law of 2.8 billion ft² presents more than 25% of the 10.7 billion ft² covered by all of the
energy benchmarking and disclosure policies adopted nationwide (IMT, 2017). The large
sample size enhanced the external validity of the research findings and the validity of the
statistical inferences.
This study was further confined to existing commercial buildings with floor areas
of 50,000 ft² or more, because the American urban landscape is highly dominated by
commercial buildings that are responsible for 20% of U.S. energy consumption—
approximately half of the energy consumed by the building sector (EIA, 2016). Excluded
from the study were smaller buildings with floor area less than 50,000 ft², as the policy
was not applied to commercial buildings with 25,000 ft² until 2017 (NYC Benchmarking
Law LL84, 2016). In addition, newer commercial buildings—those built after 2011—
were also excluded due to the requirements of the paired sample t test.
Finally, the current study was limited to the period from 2011 to 2016. This time
frame was selected because it was in 2011 that the NYC Benchmarking Law (LL84)
became effective, and 2016 energy benchmarking data were the most recent publicly
reported data. As the study was limited to NYC, it is not possible to generalize the results
of this study to other cities or municipalities; however, other cities may find this kind of
analysis useful.

11
Limitations
A potential limitation of this study is that no cause-and-effect inferences can be
made, as the paired sample t test does not imply causality (Ross & Willson, 2017). Only
the difference between the mean of energy consumed by NYC’s existing commercial
buildings between 2011 and 2016 and the direction of change were signified, with no
automatic indication of cause and effect. The research findings measured the changes in
energy performance patterns of the benchmarked buildings after the implementation of
the energy benchmarking and disclosure policies. Another potential threat to the internal
validity of the study is the possibility that factors other than the policy implementation
are also associated with the energy performance of NYC commercial buildings—such as
changes in occupant behavior, occupancy levels, and operation management.
Furthermore, despite the large sample size, there is a potential threat to external validity
due to the geographical limitation of the study to one site (NYC).
Significance
This study contributed to the emerging field of research about sustainable
building that aims to reduce the negative impact of the built environment on the earth’s
ecological system. The study assessed the influence of NYC Local Law 84 on existing
building owners’ decisions to retrofit in order to improve the energy performance of their
buildings (Cluett & Amann, , 2013). The results of this research filled the gap in the
literature and provided initial information about the efficacy of the benchmarking and
disclosure policies in addressing the issue of information failures due to lack of reliable,
standardized energy-efficient consumption data to be incorporated into property values in

12
the private building sector (Hsu, 2014). Furthermore, the study findings offer existing
building owner/operators a constant scale to measure operations and maintenance in an
effort to maximize the operational efficiency of buildings by investigating the benefits of
understanding energy-use patterns in commercial buildings (Cox et al., 2013). This study
provides information about the role of information in predicting future savings in
operation and maintenance costs (running costs) based on actual disclosed energy data
(Hsu, 2014). This study may further positive social change by contributing to a culture of
sustainability through initial awareness of changes over the study period. It is hoped that
the study will raise general awareness regarding the benefits of energy-efficiency
investments, will encourage energy-efficient upgrades, and will promote greater
understanding of sustainable building concepts. Such change may strengthen the
commitment to the notion of sustainable development and inspire policy makers to
encourage innovations that further reduce the environmental footprint of the building
industry by reducing energy consumption and encouraging more efficient use of
materials.
Summary
The American urban landscape is highly dominated by commercial buildings. The
energy performance of existing commercial buildings significantly contributes to national
energy demands and GHG emissions, in addition to negatively impacting the urban air
quality of U.S. cities. The energy benchmarking and disclosure policies recently adopted
by several states and local governments aim to provide reliable sources of standardized
energy-efficiency data as an energy performance baseline to observe and track the energy

13
performance of existing buildings over time and tackle the issue of energy-efficiency
gaps in the real estate market (Hsu, 2014a). Due to the recent implementation of energy
benchmarking and disclosure policies and the limited research in this field, the efficiency
of these policies is still unknown. The purpose of this quantitative study was to assess the
influence of energy benchmarking and disclosure policies on the energy performance of
NYC’s existing commercial buildings and determine whether the adoption of these
policies is associated with improving the energy performance of the city’s existing
commercial building stock. The study was based on the IAD framework. Data collection
consisted of obtaining NYC’s energy benchmarking data that had been publicly disclosed
on the NYC Mayor’s Office of Sustainability website for the past 6 years. The data were
statistically analyzed using repeated measure t tests to assess the efficacy of the energy
benchmarking and disclosure policies. A detailed review of relevant literature that
explains the connection between the energy performance of existing buildings and the
implementation of energy benchmarking and disclosure policies in the current scholarly
literature is presented in Chapter 2.

14
Chapter 2: Literature Review
Introduction
The energy performance of existing buildings impacts current energy use patterns
and will dominate future energy demands due to the long lifespan of buildings.
Efficiently managing the energy consumption of existing building stock requires
measuring the energy consumption of existing buildings and providing reliable
information about future energy savings (Hsu, 2014b). Energy benchmarking and
disclosure policies have been implemented to explain the energy use of commercial
buildings, create reliable tools to measure the energy performance of existing buildings,
and ultimately encourage energy-efficient retrofits and upgrades by addressing
information failures, also referred to as the energy efficiency gap, due to lack of reliable,
standardized energy-efficient consumption data in the real estate market (Cluett &
Amann, 2013; Cox et al., 2013; Ma et al., 2012; Palmer & Walls, 2015). Using a
quantitative research approach, this study examined the influence of NYC Benchmarking
Law LL84 on the energy performance of the city’s existing commercial building stock by
paired sample t tests to compare the means of the disclosed energy benchmarking
information (energy performance indices) of NYC’s existing commercial buildings over
the past 6 years. The comparison allowed me to assess the influence of the adopted
energy benchmarking policies on the energy performance of the existing building stock
and provided an indicator of the effectiveness of the policies (Cox et al., 2013; Hsu,
2014; Kontokosta, 2013; Palmer & Walls, 2015).

15
Literature Search Strategy
Due to the interdisciplinary nature of the sustainable building issue—which has
environmental, economic, and social aspects—the literature review was based on
searching multidisciplinary research databases. The databases and/or scholarly resources
searched for the literature review included ProQuest Central, ScienceDirect, Political
Science Complete, Academic Search Complete, and Google Scholar. Combinations of
the following key search terms relevant to the research topic were used to retrieve
articles: energy benchmarking, disclosure policies, energy governance, urban
sustainability, energy efficiency, commercial buildings, information failures, building
energy performance, ENERGY STAR, and policy implementation.
Through the process of the literature review, I performed a comprehensive search
of all available evidence in scholarly sources (such as peer-reviewed and indexed journal
literature), covering recent research about the topic of energy benchmarking policies and
the disclosure of benchmarking information. Moreover, I reviewed a variety of annually
released government reports that analyzed disclosed energy benchmark data such as the
NYC Mayor’s Office of Sustainability building energy benchmarking data analysis
reports, Seattle’s building energy benchmarking analysis report, and IMT building energy
performance policy factsheets. Additionally, I searched websites of government agencies
with statistical records on the energy performance of buildings, including the U.S.
Department of Energy (DOE), the EIA, and the EPA.

16
Institutional Analysis and Development Framework
The IAD framework—originally developed by Ostrom in the 1980s—was used as
a foundation for this study. The framework explains “how institutional rules alter the
behavior of intendedly rational individuals motivated by material self-interest.” (Sabatier,
1999, p. 8). The framework questions the need for government regulation to manage
common resources, given that people can collaborate across institutional and state
boundaries to manage public resources, share benefits, and reach sustainability (Ostrom,
2005). The IAD framework offers a systematic approach to organizing policy analysis
actions using a wide range of analytic techniques that are applicable to both physical and
social sciences. Policymakers apply the framework to analyze and manage complex
policy situations in order to achieve desired policy outcomes and avoid policy failures
due to oversight and simplification (Ostrom et al., 2014).
Crothers (2010) defined the framework as
a general language for analyzing and testing hypotheses about behavior in diverse
situations at multiple levels of analysis … [that] concerns analyses of how rules,
physical and material conditions, and attributes of community affect the structure
of the action arenas, the incentives that the individuals face, and the resulting
outcomes. (p. 261)
Based on this definition, the schematic representation of the IAD framework in Figure 1
serves as a conceptual map for the analysis of situations (action arena) in which users of
common resources (actors) reach agreement (based on rules-in-use) to attain
sustainability of common resources (outcomes) without state intervention to control the

17
actors’ behavior. On the other side, the action arena, the actors’ behavior and the
potential outcomes are highly influenced by a set of external variables that include
material conditions (biophysical characteristics), community culture (attributes of the
community), and rules-in-use (Ostrom, 2005). Accordingly, the action situation, the
actors’ patterns of interactions, and the potential outcomes are key aspects of the
framework that allow the analyst to understand how the actors interact based on
incentives and to evaluate potential outcomes of the interaction.
Figure 1. Institutional analysis and development (IAD) framework. From Understanding
Institutional Diversity (p. 15), by E. Ostrom, 2005, Princeton, NJ: Princeton University
Press.
This framework is based on rational choice theory, as defined by Levin and
Milgrom (2004), who posited that individuals engage in a process of rationally weighing
available options in order to choose the most preferred option based on certain criteria
(gain/profit). According to this theory, human behavior is adaptive. Although individuals
tend to compare and weigh benefits and costs, their personal values and social
development also affect their rational choices. The focus of the IAD framework—based
18
on rational choice theory—is explaining the influence of institutional rules in altering the
rational behavior of actors when they seek personal goals based on their self-interest. It
also allows recognition of the conditions that must be met in order for the actors to
address the issue(s) without state intervention and provides empirical examples of this
process (Ostrom, 2005). Within this context, individuals make their decisions based on
offered incentives, although their analysis should be based on the whole situation
structure and not limited to the individual behavior model. Accordingly, the IAD
framework can be used as theoretical basis for examining individuals’ choices and
consequences within institutions, as this framework involves the analysis of regular
actors within the context of institutional interaction, in terms of the cost of the actions and
benefits of their outcomes (Sabatier & Wieble, 2014). When the IAD framework is
applied to policy analysis, a comprehensive, thorough, and precise analysis of all aspects
related to the specific policy problem is necessary to address the policy issue and
successfully solve the problem. The multiple disciplinary perspectives required by this
frame ensure a better understanding of the situation and provide a basis for building
consensus among actors, which can lead to developing more effective policy solutions.
Based on the IAD framework, private sector building owners, operator,s and
prospective buyers may consider the disclosed energy benchmarking data to weigh the
risks and rewards of their energy-efficient investment decisions. This theoretical
framework allows for making choices—based on rational choice theory—to weigh
benefits (e.g., future saving in running costs, higher occupancy rates, and higher property
values) and limitations (e.g., initial cost of energy-efficient projects) in order to reach

19
decisions that generate the most gains. The IAD framework helps to identify the
influence of energy benchmarking and disclosure policies on individuals’ rational
decisions as a democratic way to solve problems by changing the rules employed by
participants at different levels of the institution.
The Energy Performance of the U.S. Building Sector
Energy around the world is primarily consumed by three major sectors: the
building sector, the industrial sector, and transportation (EIA, 2016). According to the
IEA, the building sector (including both residential and commercial sectors) is considered
the largest energy consumer and is estimated to account for over 30% of the total energy
consumed worldwide, 19% of which is consumed by the United States, which is the
second highest energy consumer in the world after China (IEA, 2015).
Figure 2. Building sector energy consumption. From Buildings Energy Data Book (p.
22), by U.S. Department of Energy, 2011, Washington, DC: Author
(http://buildingsdatabook.eren.doe.gov).
The IMT (2016) has ranked the building sector as the largest single energy
consumer in the United States. It is responsible for 41% of the country’s energy
consumption (more than the industrial and transportation sectors) and 7% of the world’s

20
overall energy consumption (DOE, 2012). Furthermore, U.S. buildings account for 38%
of the nation’s total GHG emissions that are related to climate change, while at the global
level, the total contribution of the building sector is only 8% of global GHG emissions
(EPA, 2014). In many major cities in the United States with a larger stock of older
buildings, the building sector contributes up to 75% of GHG emissions (IMT, 2016).
Figure 3. Percentage of total carbon emissions from building sector. From “Building
Energy Benchmarking and Disclosure in U.S. Cities,” by Institute for Market
Transformation, 2014 (http://www.imt.org). Copyright 2014 by Institute for Market
Transformation. Used with permission.
The Energy Performance of Existing Commercial Buildings in the United States
Burr et al. (2011), Cox et al. (2013), Hsu (2014a), and Mattern (2013) described
the negative environmental impact of the U.S. building sector and its energy consumption
rates in general and of existing commercial building stock in particular, including
existing buildings’ contribution to GHG emissions related to climate change. According
to the IEA (2015), the U.S. commercial building sector represents a large portion of the

21
nation’s economic activity and is considered the largest energy consumer in the world
based on average per-capita income. At the national level, commercial buildings consume
approximately 20% of U.S. energy—about half of the energy consumed by the building
sector (EIA, 2016). The EIA (2016) has estimated that 72% of U.S. commercial buildings
have existed for more than 20 years. Thus, a large portion of the commercial buildings
were built before current energy codes and regulations were adopted.
Gruber et al. (2015) and Mattern (2013) indicated that the energy consumption of
the existing building stock exceeds actual needs, noting that existing buildings are
responsible for a substantial portion of the energy consumed by the commercial building
sector. Furthermore, Cox et al. (2013) noted that the energy performance of existing
buildings significantly impacts the urban air quality of U.S. cities. Lowering the energy
consumption of the existing building stock could play a crucial role in reducing GHG
emissions, minimizing the negative impact of the building sector on the environment, and
eventually slowing climate change trends.
Hsu (2014a) argued that lack of reliable energy use information and misalliances
of the financial incentives have deterred existing buildings’ owners from investing in
energy-efficiency retrofits. Efficient-energy policy measures are necessary to improve the
energy performance of the existing building sector. Cox et al. (2013), Hsu (2014a), and
Mattern (2013) agreed that a regulatory approach based on mandatory energy disclosing
and benchmarking policies is critical to promote the concept of energy-efficient building,
to reduce GHG emissions, and to maintain urban sustainability for U.S. cities.

22
Public Policies to Enhance Energy Efficiency in Existing Buildings
The publication of the Brundtland Commission Report Our Common Future in
1987 marked the starting point for the sustainable building movement and the association
of sustainability with building processes and practices (including design, construction,
and operation processes). The sustainable building movement focused on fostering the
concept of sustainability within the context of the built environment, which was defined
within the Brundtland Commission Report as “meeting today’s needs without
compromising the ability of future generations to meet their needs” (World Commission
on Environment and Development, 1987). Since then, the sustainable building movement
has been further enhanced by a variety of public policies that tend to integrate energy
efficiency within the building sector. Such governmental efforts have helped to regulate
the building industry and have encouraged the incorporation of many innovative energy-
efficient solutions into construction practices and building operations (Gruber et al.,
2015; Mattern, 2013). Allcott and Greenstone (2012) indicated that the appropriate
implementation of energy conservation policies—using a holistic approach to address the
issue of energy efficiency gaps—could reduce projected energy demand in the United
States by up to 23% by 2020. However, in order for states, cities, and municipalities to
meet their energy-saving goals and lower their GHG emissions, it is crucial for these
energy governance efforts to improve the energy performance of existing building stock
(Northeast Energy Efficiency Partnerships, 2013). Among these policies are energy
benchmarking and disclosure policies that were recently adopted by several state and
local governments throughout the nation to emphasize sustainable urban development of

23
U.S. centers. According to Cluett and Amann (2013), Cox et al. (2013), Ma et al. (2012),
and Palmer and Walls (2015), the policies aim to value energy efficiency in the real estate
market by mandating the disclosure of energy usage information for existing buildings to
the government, potential buyers, tenants, and, in some cases, the public.
Energy Benchmarking and Disclosure Policies
Energy benchmarking of commercial buildings is a regulatory approach that has
been adopted by numerous U.S. cities over the past decade to understand the energy use
patterns of existing buildings (Burr et al., 2011; Cox et al. 2013; Hsu, 2014a; Mattern
2013). Kaskhedikar et al. (2015), defined energy benchmarking of buildings as “the
process of comparing and ranking the energy performance of a particular building against
a distribution of buildings (along with their energy systems) with similar features” (p.
17). Energy benchmarking of buildings involves measuring and comparing energy
efficiency between similar buildings by creating standardized metrics (Mattern, 2013).
Cluett and Amann (2013) addressed the role of energy benchmarking and disclosure
policies in integrating energy efficiency within the building industry and regulating the
existing building sector. Hsu (2014b) explained how the policies aim to generate the
information necessary to encourage energy efficiency upgrades within the existing
building sector and improve the valuation of energy-efficient buildings in the real estate
market. Cox et al., (2013) indicated that benchmarking can create a baseline accessible to
building owners, prospective buyers, tenants, and utilities to compare the energy
consumption data of benchmarked buildings. This allows the owners and occupants to

24
understand the energy performance of their buildings and recognize opportunities to
reduce energy waste (Cluett & Amann, 2013).
On the other hand, disclosure refers to the process of releasing and reporting the
energy benchmarking information to another party – in most cases to the government,
Prospective buyers, potential tenants, lenders, and in some cases to the public, (Cox et al.,
2013; Hsu, 2014a). Florini and Saleem (2011) considered the disclosure of energy
benchmarking data as an effective tool of energy governance that can either be
voluntarily or mandatorily based on policy requirements. Cluett and Amann (2013)
explained how the disclosure of benchmarking information can provide prospective
buyers and potential tenants the information necessary to consider energy efficiency
when making their decision to buy or rent.
Energy Benchmarking to Address Information Failures
Cox et al. (2013) recognized the role of the energy benchmarking and disclosure
policies in addressing the various information failures in the real estate market due to the
lack of reliable standardized energy efficient consumption data. Some of the major
information failures that affect the commercial building sector are:
• Information asymmetry: This refers to the lack or inaccuracy of the energy
efficiency information that causes the energy efficiency gap in the real estate
market (Palmer & walls, 2015). Unlike buildings owners and/or managers, the
prospective buyers and tenants have limited knowledge about the energy
performance of the buildings that can lead to inefficient transactions within
the real estate market (Cox et al., 2013; Florini & Saleem, 2011).

25
• Principal-agent problems: The nature of the commercial building sector
provides limited incentive for the buildings’ owners to invest in energy
efficient projects. Cox et al. (2013) explained that the occupants/tenants
(principal) always bear the consequences of the decisions made by the agent
(architect, engineer, builder and/or the owner/landlord), as they make the
decision regarding the equipment, duct systems, windows, appliances, and
lighting fixtures while the future tenants/occupants pay the energy bills.
However, when investing in energy efficiency projects the principal
(occupants and/or prospective buyers) will share the benefits from the
investment with the agent (Palmer &Walls, 2015).
• Misleading research directions: The energy performance of the existing
commercial buildings is directly affected by how the building equipment is
operated. Considering that the energy usage in commercial buildings
represents approximately 30% of the operating costs, it becomes appealing for
many existing buildings’ owners to consider energy efficient investments to
reduce their operating costs (Palmer &Walls, 2015). However, the cost of
energy efficient equipment is far higher than the discount rates theoretically
anticipated by research and there is not enough information to make informed
decisions for such risky investments. The uncertainty about energy savings led
to limited investment in energy efficient projects in the existing commercial
building sector (Allcott & Greenstone, 2012).

26
• Rational intentions: Buyers tend to pay less attention to energy efficiency
attributes due to the lack of energy efficiency information and the complexity
of the real estate transactions and contracts. This causes inattentiveness to the
energy efficiency qualities in the real estate market, (Allcott & Greenstone,
2012; Palmer &Walls, 2015).
Kontokosta (2015) argued that the uncertainty surrounding the energy
performance measures and the complexity of accurately comparing relative energy
performance led to the confusion around measuring energy efficiency in existing
buildings. Energy benchmarking and disclosure policies can establish a reliable source of
standardized energy performance information that is required as a baseline to address the
information failures discussed above and alleviate the energy efficiency gap issues
related to the commercial building sector. In addition, Cox et al. (2013) suggested that in
order to provide accurate measures of the existing buildings energy performance, the
benchmarking methodologies need to adequately model the actual patterns of energy
consumption.
The Benefits of Energy Benchmarking and Disclosure Policies
Florini and Saleem (2011) emphasized the role of the energy information flow for
successful energy governance processes and robust policy development. Based on a
recent analysis by the U.S. Environmental Protection Agency, a 7% saving in energy
consumption can be attained over 3 years period among benchmarked buildings, (EPA,
2015). The energy benchmarking and disclosure programs primarily aim to explain the
energy use of the commercial buildings, create reliable tools to measure the energy

27
performance of existing buildings, and ultimately encourage energy efficient retrofits and
upgrades, (Cluett & Amann, 2013; Ma et al., 2012; Palmer & Walls, 2015). However, the
appropriate implementation of the policies can have a great influence on the energy
performance of the existing buildings and may motivate energy efficiency improvements
in many ways:
• The policies can help improve energy management. According to the Institute
of Market Transformation, in order to properly manage the energy
performance of existing buildings, it is crucial to measure the energy
efficiency of buildings (IMT, 2015). Besides tracking the buildings’ energy
usage patterns, comparing their energy performance with other similar
buildings, and monitoring energy performance over time, Cox et al. (2013)
indicated that energy benchmarking and disclosure programs can establish an
energy performance baseline to recognize the energy efficiency opportunities,
and verify the projected savings in energy cost. Furthermore, Palmer and
Walls (2015) noted the benchmarking of energy use against other buildings
might reinforce the “peer effects” among tenants and operators, thus motivate
them to reduce energy consumption, (p. 9).
• Such energy policies can further boost market transparency. Hsu (2014a)
discussed how the public disclosure of the benchmarking information
enhances the transparency of the real estate market, drives competition and
increases the demand for energy efficient buildings. This can allow building
owners, buyers, and investors compare the energy performance of buildings,
28
predict their energy costs, and invest in energy efficient buildings – with
lower energy bills. In addition, it empowers building tenants and operators to
save energy and lower their utility bills (Palmer &Walls, 2015).
• Due to the growing awareness and increased demands for energy efficient
buildings, new job opportunities can be created for businesses in the fields
related to construction, engineering, design, energy assessment, and property
management (IMT, 2015). Palmer and Walls (2015) also highlighted the
technological advances and the related development in energy data analytics
businesses that might further boost the energy efficiency movements within
the building sector.
• Florini and Saleem (2011) argued that the policies – as a form of energy
information provision - can help local governments better understand the
energy performance of their building stock. This can allow policymakers to
develop more effective energy policies and incentive programs to further
minimize energy consumption and cost.
Energy Benchmarking and Disclosure Processes and Tools
According to Palmers and wall (2015) most benchmarking laws demand the
annual reporting of the buildings energy use data (including natural gas, electricity, and
in some cases water usage). Building owners are typically required to gather the energy
usage data of their buildings (from the monthly utility bills), then report them together
with some basic information about the buildings (such as size, location, age, number of
occupants, number and type of equipment, etc.) to the U.S. Environmental Protection
29
Agency's ENERGY STAR Portfolio Manager website (ESPM) (Hsu, 2014a; Kontokosta,
2014). Hsu (2014a) also pointed out that the gathered energy information can either be
benchmarked based on the buildings total energy use or their energy use intensity (EUI)
in order to understand how the buildings energy consumption measures up against similar
buildings nationwide.
ENERGY STAR Portfolio Manager Benchmarking Tool
While there are a number of tools that are used for energy benchmarking across
the country and around the world, the primary energy management tool most widely used
to benchmark the energy use of the existing buildings in the U.S. is the ESPM program.
This is a free web-based energy benchmarking tool developed by the U.S. Environmental
Protection Agency (EPA) in 1999, (ENERGY STAR, 2016a). The program is used to
carry out energy benchmarking by the real estate industry, governments, and businesses.
The software provides a numeric energy rating for the buildings with a score range
between 1 and 100. The assigned score for each building is based on the ratio of the
actual energy usage of the building compared to the model predicted energy use (Palmer
& Walls, 2015). The resulting ratio per square foot is then compared to the typical ratio
of the similar buildings, which was initially taken from a nationally representative
building sample of the same type (Mattern, 2013). A score of 50 represents the median
energy performance among the specific buildings type. While, a score higher than 50
indicates better energy performance (lower energy consumption rate). Buildings with an
ENERGY STAR (ES) score of 75 and above are eligible to receive the ENERGY STAR
certification, (ENERGY STAR, 2016a).

30
The score assesses how buildings are performing as a whole - based on actual,
measured data about their assets, their operations, their use, physical characteristics,
energy data, and how the people inside use the buildings – by comparing their
performance to other buildings nationwide that have the same primary use. In order to
calculate the Energy Star score, the scale algorithm estimates how much energy the
building would use if it were the best performing, the worst performing, and every level
in between based on data entered about the building design and occupants – such as its
size, location, number of occupants, number and type of equipment, etc. (Palmer & Wall,
2015). Then the scale compares the building’s actual energy data to the estimate and
determines the building’s ES rating, which indicates the building rank relative to its peers
(ENERGY STAR, 2016a). The ESPM software benchmark the energy performance of
the buildings based on their energy use intensity (EUI). This is a widely used standard
measuring unit/index that “expresses a building’s energy use as a function of its size or
other characteristics”. EUI is “expressed as energy per square foot per year”- measured in
kWh/ft²/yr or Btu/ft²/yr. “It’s calculated by dividing the total energy consumed by the
building in one year (measured in kBtu or GJ) by the total gross floor area of the
building”, (ENERGY STAR, 2016b, para. 2). EUI tends to analyze the energy
performance of buildings by “normalizing” the buildings energy use in relation to their
floor area (square footage), (Kaskhedikar et al., 2015, p. 17).
For each type of building covered by ES performance rating, EPA goes through a
rigorous process to ensure the quality and quantity of the data to support an ES score.
This is done by “creating a statistical regression model that correlates the energy data to

31
the property use details to identify the key drivers of energy use, then testing the model
against thousands of buildings in Portfolio Manager” (ENERGY STAR Certification.,
n.d.). Despite the sophistication and comprehensiveness of the building and energy use
data on which the ENERGY STAR tool based, several studies criticized the data sources
of this tool and its scoring methodology. The critique offered by Hsu (2014b) highlighted
that the data used by the ESPM tool is more than 10 years old. The data sources of the
ESPM tool should be updated every five years – using the data collected through surveys
performed by the Commercial Buildings Energy Consumption Survey (CBECS) and the
Residential Energy Consumption Survey (RECS) - however, the currently used data was
collected back in 2003 due to the sampling errors in the 2010 survey data. Additionally,
Palmers and wall (2015) questioned the robustness of the Energy Star rating scale due to
the sample distribution limitations that may affect the reliability of the tool within the
local contexts. Kaskhedikar et al. (2015) highlighted the poor statistical significance of
the correlation between the energy use and the various building characteristics used by
the ESPM to model the energy performance of buildings. Kaskhedikar et al. (2015) also
questioned the “accuracy and completeness” of the CBECS database, (p. 17). On the
other hand, Scofield (2013) questioned the reliability of the ESPM benchmarking tool
and the validity of its scores. Kontokosta (2015) referred the failure of the ESPM to its
reliance on the energy use intensity (EUI) to measure the energy performance of
buildings. He claimed that the EUI failed to explain the disparities among the physical
and occupancy characteristics of the buildings when measuring the energy performance

32
of buildings. Kontokosta (2015) also recommended developing specific benchmarking
metrics for each city based on its local building data to achieve better results.
Timing and Extent of Disclosure
Energy disclosure is considered as an efficient policy tool to enhance energy
efficiency in buildings (Kontokosta, 2013). Cluett and Amann (2013) pointed out the
disclosure of benchmarking information helps to provide prospective buyers and potential
tenants the information necessary to consider energy efficiency when making their
decision to buy or rent. Within this context, Florini and Saleem (2011) assessed the
efficiency of the currently used information disclosure mechanisms – including voluntary
disclosure of energy data, mechanisms that involves users of information as the drivers of
change, and disclosure mechanisms that based on engaging wide networks of information
holders to change energy use behavior. These disclosure mechanisms can be considered
as forms of regulation as well as tools of energy governance that are based on self-
regulatory and more voluntary basis. Additionally, governmental transparency is critical
for the effectiveness of the disclosure policies. The disclosure policies often specify the
timing and extent for disclosing the benchmarking information. These policies primarily
fall under two categories, triggered disclosure and scheduled disclosure. Florini and
Saleem (2011) referred to the required disclosure of the energy benchmarking data at the
time of selling, renting, or financing the property as triggered disclosure of the
benchmarking information. Kontokosta (2013) explained the role of triggered disclosure
in enhancing the real estate market valuation of the energy efficiency of buildings by
helping potential buyers, tenants, and lenders understand the energy performance of the

33
buildings they consider to buy, rent, or finance. On the other side, the scheduled
disclosure refers to the regular disclosure of energy benchmarking data (typically on
annual basis) to the local government, owner, tenant, and in some cases to the public
(Kontokosta, 2013). Hsu (2014a) added that scheduled disclosure tends to boost and
encourage energy efficiency improvements, as it provides the existing buildings owners
and managers with the standardized energy information they need to make informed
decisions about their future energy efficiency investments. In all cases the benchmarked
data is required to be reported to the local government in order to further analyze the
quality of the disclosed data (Palmer & Walls, 2015). Some localities require the
disclosed data to be accessible to the public - on a public website (such as the cities of
New York and San Francisco). In other cases (such as the cities of Austin and Seattle) the
access to the disclosed data is limited only to prospective buyers and potential tenants
during the time of transaction (Hsu, 2014a). General information about the energy use
patterns of the existing buildings in each city can also be found in the annually
governmental published reports.
Energy Benchmarking and Disclosure Policy Implementation
California was the first state to introduce the energy benchmarking and disclosure
policies in 2007 mandating the rating and disclosure of the commercial building energy
information at the time of sale, lease, and during financing transaction. The state of
Washington implemented a similar approach in 2009 (CBEI, 2014). At the local level, 20
major cities adopted their own benchmarking and disclosure policies over the past
decade. Washington, DC was the first city to pass energy benchmarking and disclosure

34
initiatives in 2008, followed by Austin, Texas, later that year. A year later in December
2009 New York City enacted a benchmarking and disclosure law. Next to adopt the
policies were Seattle, Washington in 2010 and San Francisco, California in 2011 in the
West Coast region. Then, the cities of Philadelphia, Minneapolis, Boston, Chicago,
Cambridge, Berkeley, Portland, and Kansas City followed between May 2012 and June
2015 in addition to Montgomery County, Maryland – the only county nationwide to
adopt benchmarking ordinance of its own in early 2014 (IMT, 2015). Additional cities
adopted similar benchmarking policies recently, including Atlanta, Denver, boulder,
Orlando, Pittsburg, and Evanston. The policies require energy usage benchmarking for
buildings - including municipal, commercial, and multifamily buildings – with threshold
size of 10,000–50,000 ft² and larger (IMT, 2015). In addition to the benchmarking and
disclosure of the energy data, some policies (such as the cities of Austin, New York, and
San Francisco) also require conducting comprehensive energy efficiency audits to be
performed by engineers licensed by the American Society of Heating, Refrigerating and
Air-Conditioning Engineers (ASHRAE) (Palmer & Walls, 2015). Mattern (2013)
emphasized the importance of coordinating among state regulators and local utility
companies, in order to address the complex issues of energy regulation and
benchmarking at all levels of governance – local, state, and federal levels. Nelson et al.
(2015) explained that developing appropriate mechanisms to coordinate policies can
enhance independence among jurisdictions and avoid policy conflicts.

35
Energy Benchmarking and Disclosure in New York City
NYC is among the leading municipalities to adopt benchmarking and disclosure
policies. NYC Local Law 84: Benchmarking (LL84) was passed by New York City
Council in 2009 (NYC Benchmarking Law LL84, 2009; City of New York, 2012). The
law is based on the goals set by NYC to reduce GHG emissions 80% by 2050 and the
energy efficiency policy efforts set by the Greener, Greater Buildings Plan (GGBP) to
enhance the energy efficiency in large existing buildings by providing a reliable source of
energy information to the city’s policy makers to pursue cost-effective energy efficiency
measures (Urban Green Council, 2017). NYC Benchmarking Law, which administered
by NYC Mayor’s Office of Sustainability, requires owners of privately-owned properties
with single large buildings over 50,000 ft² or multiple buildings with combined floor area
over 100,000 ft² (including non-residential and multifamily buildings) to annually
measure and report energy and water use data to the city through EPA’s ENERGY STAR
Portfolio Manager in order to fulfill the requirements of NYC Benchmarking Law. The
law was enacted in December 2009; however, the first compliance deadline for privately-
owned buildings was in August 2011. According to 2016 amended LL84, beginning 2018
the list of properties required to benchmarked for energy and water efficiency is
expanded to include mid-size buildings over 25,000 ft² (NYC Benchmarking Law LL84,
2016).
The law also mandates the public disclosure of the benchmarking data through
NYC Office of Sustainability website. The annually collected benchmarking data is
typically analyzed, and the analysis results are published in reports and visually presented

36
in “NYC Energy and Water Performance Map” that developed by NYC Mayor’s Office
of Sustainability and New York University’s Center for Urban Science and Progress
(NYC Mayor’s Office of Sustainability, 2018). The publicly disclosed data also helped to
develop energy efficiency policies and provided the tools and resources necessary to help
building owners reduce their energy consumption and cost (Urban Green Council, 2017).
The annual reports issued by NYC Mayor’s Office of Sustainability indicates that
relatively high compliance rates with LL84 were achieved throughout the past six years.
When the law was initially enacted in 2011, approximately 64% of the properties covered
by the law complied with the benchmarking requirements by August 31 deadline.
However, the compliance rate reached approximately 75% when the deadline was
extended to December 31, 2011 (City of New York, 2012). The percentage of compliance
increased to reach 84% in 2012 (City of New York, 2014). By 2015, more than 90% of
the privately-owned properties complied with the benchmarking law requirement (Urban
Green Council, 2017). More than 4,000 commercial buildings were benchmarked at first
year of the law enactment with square footage of 670 million ft² (City of New York,
2012). More than 700 million ft² of commercial buildings were benchmarked in 2015
(Urban Green Council, 2017). According to the Institute for Market Transformation, the
total gross floor area covered by NYC Benchmarking Law of 2.8 billion ft² presents more
than 25% of the 10.7 billion ft² covered by all the energy benchmarking and disclosure
policies adopted nationwide (IMT, 2017).

37
Summary and Conclusion
Over the past decade, the policies that involve the benchmarking and disclosure of
the existing building stock energy data have been passed by two states, one county, and
20 major U.S. cities (Palmer & Walls, 2015). The benchmarking and disclosure policies
aim to measure the energy use of the existing buildings to be compared to the average
energy use of similar buildings. Cluett and Amann (2013) indicated that these polices
allow the owners and occupants to understand the energy performance of their buildings
and recognize the opportunities to reduce energy waste. Furthermore, Mattern (2013)
explained how the energy benchmarking can create a baseline accessible to building
owners, prospective buyers, tenants, and utilities to observe and track the energy
performance of buildings over time, as well as compare the energy consumption data of
benchmarked buildings to similar buildings in the market. Providing reasonable and
convenient access to reliable standardized energy performance information is crucial to
value the energy performance of buildings in the real estate market (Cox et al., 2013).
The policies enhance market transparency and allow stakeholders to make informed
energy efficiency investment decisions (Palmer &Walls, 2015). The appropriate
implementation of energy benchmarking and disclosure policies allows policymakers to
develop more effective energy policies and incentive programs to further minimize
energy consumption and cost (Florini & Saleem, 2011). In addition to improving the
energy performance of the existing buildings, the policies serve a wide range of benefits
including increased competition and market choice, job creation, and energy and cost
savings (Bergh, 2013b).
38
Most of the currently implemented policies involving the benchmarking and
disclosure of the energy use information of existing buildings were adopted during the
period between 2008 and 2014. Hence, this is considered as a new field of study, and
therefore a lot of research is still needed in the field in order to determine the influence of
these policies on the energy performance of the existing building stock. The common
trend in this field of research so far is the qualitative case studies of the energy
performance of the benchmarked buildings. Most of the case studies focused on the
leading cities to implement such policies, especially the City of New York – as the largest
urban center in the U.S. – as well as Austin and Seattle (Florini & Saleem, 2011; Hsu,
2014b; & Mattern, 2013). In addition, many cities that adopted the benchmarking and
disclosure policies release annual reports analyzing the reported energy information of
the specific year (City of New York, 2012-14; Urban Green Council, 2017). Such reports
offer descriptive statistics of the reported energy performance indices, as well as
analyzing the effect of the buildings characteristics (such as the building type, age, size,
etc.) on their energy performance and evaluate the factors that determine the energy
performance of buildings (Urban Green Council, 2016 & Urban Green Council, 2017).
Hsu (2012) analyzed NYC 2011 benchmarking data and developed a data cleaning
process to ensure the quality of the obtained benchmarking data. Kontokosta (2012) also
analyzed NYC 2011 benchmarking data that involved developing predictive models to
analyze the energy consumption of buildings, presenting an energy rating system for
multi-family properties, and analyzing the special distribution of the city’s energy
consumption patterns. Recently, a number of empirical studies have been conducted to

39
statically analyze the reported energy benchmarking information and evaluate the
currently used benchmarking measures, develop new energy benchmarking tools, and
model the future impact of the policies (Cox et al., 2013; Hsu, 2014a; Kontokosta, 2015;
Ma et al., 2012).
Additional research in this field is required to examine the influence of the
policies on the existing building owners’ decisions to retrofit - in order to improve the
energy performance of their buildings – based on the actual reported energy data (Bergh,
2013a). The current study filled the gap in the literature and examined the influence of
the benchmarking and disclosure policies on the existing buildings’ energy performance
by statistically analyzing the annual energy performance patterns of NYC existing
commercial buildings. It also provided the initial information about the efficacy of these
policies in addressing the issue of information failures in the private building sector,
almost a decade down the road (Cox et al., 2013).
This quantitative study used repeated measures t tests to analyze the disclosed
annual energy usage data of NYC’s existing commercial buildings over the past six years
to determine the influence of the NYC benchmarking Law (LL84) on improving the
energy performance of the existing buildings and generate predictions for the future
energy use patterns. The focus of the following chapter (Chapter 3) will be on explaining
the research design and methodology to conduct the study, in addition to describing the
data collection and analysis procedures.

40
Chapter 3: Research Method
Introduction
The increasing energy consumption of existing commercial buildings compared to
recently built buildings that were subject to greater energy-saving requirements in
building codes is a major problem in the United States. It is difficult to mandate energy-
efficient retrofits of privately owned existing buildings. Energy benchmarking and
disclosure policies have been implemented to manage the energy consumption of existing
buildings and encourage energy-efficient retrofits and upgrades. The efficacy of these
policies has not been assessed. Accordingly, the current study was designed to examine
whether NYC’s Benchmarking Law had influenced the energy performance of the
existing commercial buildings in the city. Based on the IAD framework, which is
founded in rational choice theory, the study involved reviewing and analyzing the
disclosed annual energy usage data of NYC’s existing commercial buildings as reported
to the NYC Mayor’s Office of Sustainability over the past 6 years—between 2011 and
2016. In this chapter, I explain the research design and methodology, in addition to
describing the data collection and analysis procedures.
Research Design and Rationale
A research design is a plan to conduct a study. An appropriate research design
should address the research problem, answer the research question, test the hypothesis,
and assist in pursuing approximately truthful inference regarding the relationships
between variables (Creswell, 2009). A quantitative research design was selected to
conduct this study because it involved the systematic investigation of data and their

41
relationships (Frankfort-Nachmias & Nachmias, 2008). This research design was
employed to examine the influence of energy benchmarking and disclosure policies on
the energy performance of existing commercial buildings by assessing the relationship
between the energy performance of NYC’s existing commercial buildings (the dependent
variable) and the city’s implementation of the Energy Benchmarking and Reporting
Program (the independent variable):
• Dependent variable (criterion): The energy performance indices of NYC’s
existing commercial buildings (site and source EUI measured in kBtu/ft²,
greenhouse gas emissions measured in MtCO2e, and ENERGY STAR score
measured in a percentile scale ranges between 1 and 100).
• Independent variable (predictor): The implementation of NYC’s
Benchmarking Law LL84 between 2011 and 2016.
The quantitative design was also appropriate to conduct the research because it
aligned with the repeated measures design recommended to answer the research question,
which addressed whether the mean annual energy use of NYC’s existing commercial
buildings reduced significantly after implementation of LL84. The research question was
derived from the purpose of the study, which was to assess the influence of NYC Energy
Benchmarking Law LL84 by comparing the mean energy performance indices of the
city’s existing commercial buildings during the period between 2011 and 2016. This was
an observational form of research based on document analysis. The analyzed documents
were the disclosed energy use data of NYC’s existing commercial buildings that annually
reported to the NYC Mayor’s Office of Sustainability. For the purpose of this study,

42
repeated measures t tests (also referred to as paired sample t tests) were performed to
analyze those records of energy benchmarking data. This technique statistically evaluated
the significance and direction of the difference between the means of the paired
observations (the annually measured energy performance indices between 2011 and
2016) in order to determine the influence of the NYC Benchmarking Law. The paired
sample t tests allowed to determine whether the energy performance of the city’s existing
commercial buildings significantly improved after the policy implementation and to
analyze the annual energy performance patterns of NYC’s existing commercial buildings.
Paired sample t tests are commonly used in social sciences to determine the mean change
in scores for a single group or one sample; (Frankfort-Nachmias & Nachmias, 2008). In
this research, the difference between the means of the annual energy performance indices
of NYC’s existing commercial buildings were signified and the annual energy
performance patterns were compared after adopting the energy benchmarking and
disclosure policies between 2011 and 2016 in order to recognize trends and detect
patterns in the data. The consistency of the research questions, design, and methodology
enhanced the quality of the study and allowed the successful flow of the research
processes (Creswell, 2009). However, the study was limited to the time frame between
2011 and 2016 because it was in 2011 that NYC Benchmarking Law LL84 became
effective, and 2016 benchmarking data were the most recent publicly disclosed data
available. This study was further confined to large existing commercial buildings with
floor areas of 50,000 ft² or more. Smaller buildings with floor areas of less than 50,000 ft²
43
were excluded because the policy would not be applied to commercial buildings with
floor areas of 25,000 ft² until 2018.
Methodology
Population
The target population for the current study was existing commercial buildings
located in all U.S. municipalities that implemented the energy benchmarking and
disclosure policies (including 20 major cities, the states of California and Washington,
and Montgomery County, Maryland) and built prior to the policies’ adoption (see Table
1).
Sampling and Sampling Procedure
The accessible population for this study consisted of existing commercial
buildings in NYC that were built before 2011 (the year that NYC’s Benchmarking Law
LL84 was enacted). This accessible population was determined based on a purposive
sampling strategy, a nonprobability sampling technique that relies on the judgement of
the researcher to select the research sample that represents the population based on
certain criteria (Frankfort-Nachmias & Nachmias, 2008). Accordingly, NYC’s existing
commercial buildings were selected as a purposive sample to represent the population
based on several criteria:
• NYC was among the leading municipalities to adopt the energy benchmarking
and disclosure policies in 2009, following Washington, DC, and Austin, TX.
This indicated that sufficient data were available for the analysis.

44
• NYC is the largest urban center in the United States, with the highest
concentration of commercial office buildings nationwide (IMT, 2016). The
NYC buildings benchmarked in 2011 represented 61% of the built space
covered by all benchmarking laws nationwide at that time, including Austin,
Seattle, San Francisco, Washington DC, the State of Washington, and the
State of California (City of New York, 2012). Meanwhile, the total gross floor
area of NYC benchmarked buildings in 2016 (2.8 billion ft²) comprised more
than 25% of the total gross floor area covered by benchmarking laws/ policies
nationwide, as shown in Table 1 (IMT, 2017).
• Furthermore, NYC is considered one of the nation’s sustainable urban centers.
The 2015 median ENERGY STAR score of the city’s office buildings of 75
was significantly above the national average of 50 (Urban Green Council,
2017).

45
Table 1
Target Population
U.S. municipalities implementing energy benchmarking
and disclosure policies
Number of buildings Gross floor area ft²
Atlanta, GA
Austin, TX
Berkeley, CA
2.900
2,800
257
402 million
113 million
13.7 million
Boston, MA
Boulder, CO
California
Cambridge, MA
Denver, CO
Kansas City, KA
1,600
475
20,573
1,120
3,000
1,500
250 million
26 million
2.4 billion
88 million
360 million
400 million
Chicago, IL
Evanston, IL
Los Angeles, CA
3,500
557
14,000
900 million
45.6 million
900 million
Minneapolis, MN
Montgomery Co., MD
New York City, NY
Orlando, FL
Philadelphia, PA
Pittsburgh, PA
Portland, OR
San Francisco, CA
Seattle, WA
Washington, DC
Washington State
625
750
15,300
826
2,300
861
1,024
2,700
3,300
2,000
4,600
110 million
68 million
2.8 billion
125.6 million
350 million
164 million
87 million
205 million
281 million
357 million
247 million
Total 86,500 10.7 billion
Note. Adapted from “Building Energy Benchmarking and Disclosure in U.S. Cities,” by
Institute for Market Transformation, 2017 (http://www.imt.org). Copyright 2010-2014 by
Institute for Market Transformation. Reprinted with permission.
The purposive sampling strategy required the entire population of the selected
unit (NYC’s existing commercial buildings) to be included in the study using total
sampling techniques (Frankfort-Nachmias & Nachmias, 2008). This strategy allowed for
examination of the energy performance of the entire population of existing commercial
buildings located in NYC. Having sufficient sample size is key to strengthening the
scientific value of a study, enhancing the quality of statistical inferences and promoting

46
the external validity of the research findings (Frankfort-Nachmias & Nachmias, 2008).
Within this context, using any of the probability sampling techniques would not have
been appropriate, in that they tend to select units from the population to be studied and
therefore would not have served the ultimate goal of including the entire population of
NYC’s existing commercial buildings in the study that aligned with the purpose of the
study. Therefore, there was no need to perform power analysis or use any sampling tools
to calculate an adequate sample size for the study.
Data Collection
The study primarily relied on a secondary source of data (archival data)—the
disclosed energy benchmarking data of NYC’s existing commercial buildings between
2011 and 2016. The NYC benchmarking law mandates the public disclosure of energy
data, and the reported data are accessible through the NYC Mayor’s Office of
Sustainability website (public website). Accordingly, no permission letters were required
to request/gain access to the data. However, approval to conduct the study was requested
from the Walden University Institutional Review Board (IRB approval number: 08-29-
17-0273895). The required data consisted of the annually disclosed energy benchmarking
information on NYC’s existing commercial buildings with floor areas of 50,000 ft2 or
more, as reported between 2011 and 2017. The collected data included both property
information that was self-reported by building owners/managers (basic information about
the buildings such as size, location, year built, occupancy level, number and type of
equipment, etc.) and usage output metrics and performance indices calculated by the
ENERGY STAR Portfolio Manager. This information is annually reported (using

47
automated upload methods) by the buildings’ owners/operators to EPA’s ENERGY
STAR Portfolio Manager Website (ESPM) as required by LL84.
Data Analysis
This study examined whether annual energy benchmarking and disclosure of
energy use for existing commercial buildings influenced these buildings’ energy
performance. The research question was the following: Is there a statistically significant
difference between the means of 2011 and 2015 energy benchmarking data?
Null Hypothesis 1: There is no statistically significant difference between the
means of 2011 benchmarking data and 2016 data.
H0: µ2011 = µ2016
Alternative Hypothesis 1: There is a statistically significant difference between the
means of 2011 benchmarking data and 2016 data.
H1: µ2011 ≠ µ2016
where µ is the mean of the energy benchmarking data.
SPSS 24 software was used to statistically analyze the collected data from the
NYC Mayor’s Office of Sustainability using repeated measures t tests (also referred to as
paired sample t tests and dependent-sample t tests). According to Frankfort-Nachmias
and Nachmias (2008), t tests are widely used “to assess the significance of difference
between the means” of tested samples (p. 448). The means between two related
observations measured on the same continuous dependent variable can be compared
using paired sample t tests, as the tests allow examining a single group at two different
points in time (Ross & Willson, 2017). Paired sample t tests are commonly applied to
repeated-measures designs to evaluate the efficacy of policies by comparing the means of

48
two sets of observations that measure the performance of a single group before and after
policy implementation. The difference between the means of the paired sets can be
statistically analyzed using paired sample t tests (Field, 2013). This study assessed the
statistical significance of the means difference between 2011 and 2016 energy
performance indices. Furthermore, the annual energy performance pattern of NYC’s
existing commercial buildings during the period between 2011 and 2016 was evaluated
by determining whether there was statistical evidence that the mean differences between
the annually measured energy performance indices were significantly different from zero.
As the direction of the difference is not important (only comparing the difference
between means), two-tailed tests of significance were performed (Ross & Willson, 2017).
Assessing the annual energy performance patterns allowed me to make predictions about
future energy consumption rates and anticipated future energy demands/savings.
Threats to Validity
External Validity
External validity refers to the ability to generalize study outcomes (Campbell &
Stanley, 1963). The ample sample size used for this study enhanced the external validity
of the research findings by including the annually reported energy benchmarking data of
the entire population of NYC’s existing commercial buildings of 50,000 ft² or more. that
consistently benchmarked during the period between 2011and 2016. However, it is not
possible to generalize the results of this study to other cities or municipalities due to the
geographical limitation of the study to one site (NYC), although other cities might find
this kind of analysis useful.

49
Internal Validity
Internal validity affects a researcher’s ability to support claims and draw
inferences (Creswell, 2009). Within this context, I only compared the difference of means
between the measured dependent variables and assessed the extent to which the
implementation of the energy benchmarking and disclosure policies had influenced the
energy performance of the benchmarked buildings. The statistical significance of the
difference between the means of 2011 and 2016 energy performance indices does not
imply causation. Additionally, the study only included the energy data for buildings that
continuously reported throughout the period between 2011 and 2016. Structures that were
built after 2011 or that started to report energy data after 2011 were not included to avoid
threats to internal validity. Table 2 shows possible threats to internal validity and plans to
address these issues in order to ensure the reliability and consistency of the research data.

50
Table 2
Threats to Internal Validity
Threats to internal validity Plans to meet internal validity requirements
History: The effect of external events
over time.
Regression: The effect of extreme
scores.
The effect of external events can be
neglected due to the short term of the policy
implementation.
The ample sample size that included the
energy benchmarking data of the entire
population of NYC’s existing commercial
buildings of 50,000 ft² or more eliminated
the effect of extreme scores.
Selection: The equal distribution of
characteristics.
Mortality: Changes in the sample size
Including the entire population ensured the
equal distribution of characteristics within
the research sample.
Newer buildings (i.e., built after 2011) and
those that started to report energy data after
2011 were not included.
Note. Table developed following a model provided by Creswell (2009).
Ethical Procedures
The study was based on archival data and did not involve recruitment of human
participants to collect data. The collected electronic data were securely saved on a
personal computer. Identifiable building information—such as street addresses and
borough-block-and lot (BBL) numbers—was not revealed, and accordingly there is no
potential risk of distressing research findings being costly to building owners, in terms of
affecting their property value, real estate marketability, or rental rates.

51
Summary
The study was conducted based on a quantitative research approach using a
repeated-measures design to assess the influence of energy benchmarking and disclosure
policies on the energy performance of existing buildings. Information used to address the
hypothesis consisted of archival data on the energy performance of NYC’s existing
commercial buildings based on energy benchmarking data annually disclosed to the NYC
Mayor’s office of Sustainability during the period between 2011 and 2016. The data were
statistically analyzed using paired sample t tests to compare the difference between the
means of 2011 and 2016 energy performance indices. In Chapter 4, the statistical analysis
of the data is presented, and the study findings are reported.

52
Chapter 4: Results
Introduction
The purpose of this study was to examine the influence of the NYC
Benchmarking Law (LL84) on the energy performance of the city’s existing commercial
buildings 6 years after the law was enacted and to assess the efficacy of the energy
benchmarking and disclosure policies in improving the energy performance of the
existing building stock. The law requires the owners/managers of buildings with gross
floor areas greater than 50,000 ft² to annually report their buildings’ energy and water use
data to the EPA’s ENERGY STAR Portfolio Manager (Local Laws 84, 2009). The latest
benchmarking data disclosed by the NYC Mayor’s Office of Sustainability in 2016 were
compared to 2011 data to evaluate the statistical significance of the mean difference
between the compared datasets and determine whether these policies actually influence
change in the energy performance of existing commercial buildings (NYC Mayor’s
Office of Sustainability, 2017). Thus, the study was based on one overarching question:
Is there a statistically significant difference between the means of 2011 and 2016 energy
benchmarking data? Paired sample t tests were performed to compare the means of the
dependent variables (2016 benchmarking data to 2011 data) to answer the research
question and test the hypothesis. The null hypothesis stated that the mean difference
between the 2011 benchmarking data and 2016 data is zero, and the alternative
hypothesis stated that there is a statistically significant difference between the means of
2011 benchmarking data and 2016 data.

53
Data Collection
The data for this study were collected from the NYC Mayor’s Office of
Sustainability website (NYC Mayor’s Office of Sustainability, 2017). The electronic data
were accessed on August 29, 2017, when Walden University’s IRB approval of the study
proposal was confirmed (IRB approval number: 08-29-17-0273895). The 2016 dataset,
which was posted to the public in mid-December 2017 on the NYC Mayor’s Office of
Sustainability website, was accessed on February 26. All of the publicly disclosed energy
and water benchmarking datasets for NYC’s buildings were captured in Excel
spreadsheets to be analyzed. The retrieved datasets were reviewed and validated in
comparison to NYC OpenData tables and LL84 benchmarking reports (which are
accessible through the NYC Mayor’s Office of Sustainability website) to ensure the
accuracy of the data and eliminate any data entry transposition errors. The collected data
consisted of benchmarking output information provided by the ENERGY STAR Portfolio
Manager (ESPM). The data can be divided into two categories:
1. Property information that is self-reported by the buildings’ owner/managers,
including borough-block-and lot (BBL), building identification number (BIN),
street address, total gross area, number of buildings on the lot, property use,
and other building/occupancy pattern characteristics.
2. Usage output metrics, including the performance indices that were calculated
by the Portfolio Manager based on the reported building information. These
performance indices were used to analyze the energy performance of
buildings. The number of output metrics calculated by the ESPM considerably

54
increased over the years; however, only the basic metrics originally used to
measure the energy performance of buildings in 2011 were considered in this
study to compare the means difference between the two datasets. These
metrics included the following:
• Site EUI: This is one of the measures of energy consumption. It is the
calculated amount of energy used per area at the property site. The metric
measures the energy use intensity at the property site on a per-square-foot
basis (kBtu/ft²; Benchmarking Data Disclosure Definitions, 2017).
• Weather-normalized source EUI: This is another energy performance
index that measures the weather-adjusted energy use intensity at the
source of energy generation (referred to as source EUI in this study). It is
the amount of energy required to generate the energy consumed on the
property site. It considers the energy generation and distribution losses.
The metric is measured in kBtus per gross square foot (kBtu/ft²;
Benchmarking Data Disclosure Definitions, 2017).
• Water use intensity: This metric measures the amount of water consumed
per square foot (gal/ft² Benchmarking Data Disclosure Definitions, 2017).
• GHG emissions: This is the calculated direct and indirect GHG emitted by
the property. It is measured in metric tons of carbon dioxide equivalent
(MtCO2e Benchmarking Data Disclosure Definitions, 2017).

55
• ENERGY STAR scores: This percentile ranking offers an overall energy
performance rating calculated by the ESPM on a scale of 1-100
(Benchmarking Data Disclosure Definitions, 2017).
Results
NYC benchmarking law LL84 requires privately owned property
owners/managers of a single building with a floor area of at least 50,000 ft² or multiple
buildings on one lot totaling 100,000 ft² or more to annually benchmark their buildings’
energy use information (NYC Benchmarking Law LL84, 2009). Commercial buildings
comprise one third of NYC’s benchmarked floor area. However, according to NYC’s
Energy and Water Use Report (2013), they account for approximately half of the city’s
energy consumption (Urban Green Council, 2016). A total of 4,082 privately owned
buildings (with total gross floor area of 1.7 billion ft²) were benchmarked in 2011 with a
compliance rate of approximately 64% (City of New York, 2012). The number of
benchmarked buildings significantly increased over the years, reaching 13,221 buildings
(2.3 billion ft²) in 2015 and 15,122 (2.4 billion ft²) in 2016, with compliance rates
exceeding 90% (Urban Green Council, 2017). Based on the research plan described in
Chapter 3, the entire population of NYC existing commercial buildings that were
benchmarked in both 2011 and 2016 were included in the sample. The focus of this study
was primarily on examining the energy performance of existing commercial buildings;
thus, the datasets were sorted and filtered to exclude multifamily buildings, which were
outside the scope of this study. Only 2,547 buildings that fell under the commercial
buildings categories were considered. These categories were based on the commercial-

56
building classification developed by the Commercial Buildings Energy Consumption
Survey (CBECS), which includes office buildings, hotels/resorts, retail, restaurants,
warehouses, educational, and health care buildings (EIA, 2017).
Data Cleaning
Hsu (2012) developed data-cleaning steps to analyze and assess the quality of
NYC 2011 benchmarking data. He removed building records with reported “EUI below 5
or above 1,000 kBtu/ft²” and the “top and bottom 5% of EUIs” (Hsu, 2012, p. 5). Scofield
(2013) followed a similar data-cleaning approach to eliminate data entry errors from
NYC 2011 benchmarking data in his study to compare the mean energy performance
indices of LEED-certified buildings to those of conventional NYC buildings. He
eliminated building records considered “unbelievably high,” with site EUI values higher
than 1,035 kBtu/ft², or “unreasonably low,” with site EUI values approaching 0.0 kBtu/ft²
(pp. 519-520). The data-cleaning process adopted in this study was based on the data-
cleaning approaches followed by Hsu (2012) and Scofield (2013) to remove building
records with data entry errors. The benchmarking records of the 2,547 commercial
buildings were further inspected to ensure the credibility of the data. Hence, repeated
records that appeared more than once, building records that were not located in any of the
NYC counties, records with missing information (such as floor area), and records that did
not show energy use data were eliminated. Credible records of 1,730 commercial
buildings were retained and further inspected to eliminate records with data entry errors.
Additional building records were eliminated because they showed extremely high values
(EUIs above 1,000 kBtu/ft² and GHG emissions higher than 20,000) or unreasonably low

57
values (EUIs and GHG emissions approaching 0.0). Such records were considered not
credible because they indicated data entry errors or unoccupied buildings. The remaining
datasets were compared to exclude the buildings that were not benchmarked in both of
the assigned years. It was found that the energy use data (both site and source EUI) and
GHG emissions were calculated for 1,072 commercial buildings in both 2011 and 2016,
with total gross floor area of approximately 300 million ft², as listed in Table 3.
Table 3
Sample Characteristics—Sample Distribution in NYC’s Boroughs
Number of buildings Total gross floor area (ft²)
Manhattan 772 244,632,057
Bronx 47 10,938,054
Brooklyn 90 16,078,967
Queens 135 21,964,700
Staten Island 28 3,739,563
Total
1,072
297,353,341
Note. Energy benchmarking data from NYC Mayor’s Office of Sustainability website.
The overall energy performance rating (ENERGY STAR score) of 803 buildings
out of the above 1,072 was calculated by Portfolio Manager, as this metric is only
measured for specific building categories, such as offices, hotels, retail, and hospitals.
However, water use intensity was not analyzed in this study due to the limited water
consumption data filed in the 2011 calendar year, with only 147 building records.
Sample Characteristics
The analyzed sample was mostly located in in Manhattan. Seven hundred and
seventy-two of the 1,072 commercial buildings analyzed in this study were located in

58
Manhattan, comprising approximately 82% of the tested sample gross floor area, and 47
buildings were located in Bronx, 90 were located in Brooklyn, 135 were located in
Queens, and only 28 were located on Staten Island (see Table 3 and Figure 4). Although
the sample was composed of commercial buildings in various categories, office buildings
constituted 64% of the sample, followed by hotels, which represented approximately 7%
of the tested sample, as listed in Table 4. However, Table 5 shows that the total gross
floor area of the office buildings included in this study was 74.3% of the total sample
floor area, with approximately 220 million ft². This can be attributed to the concentration
of high-rise commercial office buildings in Manhattan.
(a)
(b)
Figure 4. Sample distribution in NYC’s boroughs—number of buildings (a) total gross
floor area (b).

59
Table 4
Sample Characteristics—Building Categories
Building category Number of buildings
Percentage %
Office 687 64.1
Hotel 74 6.9
Nonrefrigerated warehouse 58 5.4
Other 52 4.9
Retail store 41 3.8
Distribution center 32 3.0
Mixed use property 22 2.1
Other—Entertainment/public assembly 15 1.4
Self-storage facility 15 1.4
Financial office 11 1.0
College/university 8 .7
Manufacturing/industrial plant 7 .7
Other—Mall 7 .7
Supermarket/grocery store 6 .6
Automobile dealership 5 .5
Refrigerated warehouse 5 .5
Wholesale club/supercenter 4 .4
Enclosed mall 3 .3
Hospital (general medical & surgical) 2 .2
Movie theater 2 .2
Museum 2 .2
Other—Lodging/residential 2 .2
Repair services (vehicle, shoe, locksmith, etc.) 2 .2
Residence hall/dormitory 2 .2
K-12 school 1 .1
Medical office 1 .1
Other—Education 1 .1
Other—Recreation 1 .1
Other—Services 1 .1
Parking 1 .1
Social/meeting hall 1 .1
Strip mall 1 .1
Total
1,072
100
Note. Energy benchmarking data from NYC Mayor’s Office of Sustainability website.

60
Table 5
Sample Characteristics—Office Buildings Dominating the Sample
Total number of buildings Total gross floor area
Building category
No.
%
ft²
%
Office buildings 687 64 220,862,232 74.3
Other building categories 385 36 76,491,109 25.7
Total 1,072 100 297,353,341 100
Note. Energy benchmarking data from NYC Mayor’s Office of Sustainability website.
Statistical Assumptions
The benchmarking data, originally captured in spreadsheet format, were imported
to SPSS 24 to check the appropriateness of using paired sample t tests to analyze the data.
The data met all the statistical assumptions to ensure the validity of the test results. First,
the tested variables (building performance indices) were measured on a continuous level:
site and source EUI measured were ratio variables measured in kBtus per gross square
foot (kBtu/ft²), total GHG emission was a ratio variable measured in metric tons of
carbon dioxide equivalent (MtCO2e), and ENERGY STAR score was a ratio variable
measure on a percentile scale ranging from 1-100. The second assumption that required
the independence of observations was met, in that the data collection process involved
independent reporting of energy use data to ESPM. Additionally, the data consisted of
matched pairs, with records for the same buildings appearing in both datasets (2011 and
2016). Third, the tested variables did not contain any outliers, as the data records with
extremely high or unreasonably low values were eliminated earlier to avoid biased test
results. Finally, the assumption of normality, which requires the normal sampling
distribution of the tested variables for significance tests such as the paired sample t test

61
(Frankfort-Nachmias & Nachmias, 2008), was considered reasonably met by including
the entire population of NYC’s commercial buildings that consistently benchmarked in
2011 and 2016. According to Field (2013), based on the central limit theorem, using a
large sample size ensures the normality of the sampling distribution. Field argued that
“the data do not need to be normally distributed, but the sampling distribution of means
does” (p. 174). Thus, fairly large samples are considered normally distributed regardless
of data distribution.
Statistical Analysis
SPSS 24 software was used to analyze the data gathered for this study to answer
the research question: Is there a statistically significant difference between the means of
2011 and 2016 energy benchmarking data?
Paired sample t tests were performed to determine the means difference between
2011 and 2016 energy performance datasets.
Null Hypothesis 1: There is no statistically significant difference between the
means of 2011 benchmarking data and 2016 data.
H0: µ2011 = µ2016
Alternative Hypothesis 1: There is a statistically significant difference between
the means of 2011 benchmarking data and 2016 data.
H1: µ2011 ≠ µ2016
where µ is the mean of the energy benchmarking data.
These were two-tailed tests, as the hypothesis tested the mean difference between
the two conditions with α level = .05, (Field, 2013). The statistical analysis was based on
the performance indices calculated by ESPM (output metrics) because they tend to

62
characterize the energy performance of the benchmarked buildings. The analysis results
for each metric are discussed separately. The benchmarking data of 1,072 buildings were
tested for energy consumption (both site and source EUI) and GHG emission, while the
mean ENERGY STAR performance ratings of 803 buildings were compared. In addition,
in-depth analyses of the annual energy performance pattern of NYC’s commercial
buildings consistently benchmarked between 2011 and 2016 were performed to assess the
efficacy of the adopted benchmarking policy. Mean differences between NYC
commercial buildings’ energy performance metrics calculated by the ESPM were
compared on an annual basis throughout the period between 2011 and 2016 using paired
sample t tests. The analysis results generated by SPSS for each metric are discussed
below.
Site EUI. The mean of 2011 and 2016 energy use intensity measured at the
property site of the 1,072 commercial buildings were compared to answer:
Q1.1: Is there a statistically significant difference between the means of 2011
site EUI and 2016 site EUI?
Null Hypothesis 1.1: There is no statistically significant difference
between the means of 2011 site EUI and 2016 site EUI.
H0: µ2011 site EUI = µ2016 site EUI
Alternative Hypothesis 1.1: There is a statistically significant difference
between the means of 2011 site EUI and 2015 site EUI.
H1: µ2011 site EUI ≠ µ2016 site EUI
where µ is the mean site EUI.

63
Table 6 displays the descriptive statistics for the two tested conditions. The
records of 1,072 commercial buildings were tested (N = 1072). The mean of 2016 site
EUI (M = 84.72 kBtu/ft², SD = 56.90) was lower that of 2011 (M = 88.97 kBtu/ft², SD =
57.83). The site EUI histograms for 2011 dataset and 2016 shown in Figures 5(a) and (b)
indicate that the site EUI records in both conditions were similarly dispersed. Table 7
shows the t value was 2.67. There are (1071) degrees of freedom (df) associated with the
t test. The results indicate that the two means were significantly different as the value in
the Sig. (2-tailed) row (p = .008) was less than .05. Accordingly, the paired sample t test
revealed a statistically reliable difference between 2011 mean site EUI (M = 88.97
kBtu/ft², SD = 57.83) and that of 2016 mean site EUI (M = 84.72 kBtu/ft², SD = 56.90),
t(1071) = 2.67, p = .008, α = .05. On average, 2016 site EUI decreased by approximately
5% (4.25 kBtu/ft²) compared to 2011 site EUI. Thus, the null hypothesis can be rejected.
(a) (b)
Figure 5. Site EUI histogram for NYC commercial buildings’ 2011 benchmarking data
(a) and 2016 data (b).

64
Table 6
Site EUI—Paired Sample Statistics
Pair Mean N Std. deviation Std. error mean
2011 site EUI 88.969 1,072 57.8296 1.7663
2016 site EUI 84.716 1,072 56.9028 1.7379
Table 7
Site EUI—Paired Sample Test
Paired differences
t df
Sig. (2-
tailed) Mean
Std.
deviation
Std. error
mean
95% confidence
interval of the
difference
Lower Upper
2011 site EUI -
2016 site EUI
4.2529
52.0743
1.5905
1.1321
7.3737
2.674
1071
.008
The results of the annually-based analysis of the site EUI shown in Tables 8 and 9
present the mean difference between the consistently measured site EUI of 619
commercial buildings out of the 1,072 building sample during the period between 2011
and 2016. It can be seen that the energy consumed at NYC commercial buildings sites
significantly dropped in 2012 - one year after the first energy benchmarking data
disclosure from 92.76 kBtu/ft² in 2011 to 83.92 kBtu/ft² in 2012 - t(618) = 6.07, p <
0.001 (see Tables 8 and 9 - Pair 1). Note that the mean of 2012 site EUI in was actually
lower than that of 2016 (see Table 8 - Pairs 1 and 5). The mean site EUI increased in the
following 2 years by 6.79 kBtu/ft² and 1.65 kBtu/ft² in 2013 and 2014, respectively (see
Table 9 - Pairs 2 and 3). It worth noting that the increase in 2013 was statistically

65
significant t(618) = -2.99, p = 0.003. As shown in Table 9 (Pair 4), the mean site EUI
dropped again in 2015 and 2016 by 2.47 and 2.02 kBtu/ft², respectively. However, only
the decrease reported in 2016 was statistically significant t(618) = 2.05, p = 0.041, α =
.05. Although the analysis shows an overall drop of almost 5% (4.9 kBtu/ft²) in the
average site EUI between 2011 and 2016 as explained earlier in this section, the
consumption pattern was not consistent throughout the 6 years, as shown in Figure 6.
Furthermore, the mean difference between 2011 and 2012 site EUI (8.8 kBtu/ ft²) was
almost twice the mean difference between 2011 and 2016 (4.9 kBtu/ ft²).
Table 8
Paired Samples Statistics—Site EUI Annual Consumption Pattern From 2011 to 2016
Mean N Std. deviation Std. error mean
Pair 1 2011 site EUI 92.756 619 63.0637 2.5347
2012 site EUI
83.917 619 53.3143 2.1429
Pair 2 2012 site EUI 83.917 619 53.3143 2.1429
2013 site EUI
90.708 619 67.1094 2.6974
Pair 3 2013 site EUI 90.708 619 67.1094 2.6974
2014 site EUI
92.353 619 61.0954 2.4556
Pair 4 2014 site EUI 92.353 619 61.0954 2.4556
2015 site EUI 89.885 619 62.3195 2.5048
Pair 5 2015 site EUI 89.885 619 62.3195 2.5048
2016 site EUI 87.866 619 63.4809 2.5515

66
Table 9
Paired Samples Test—Site EUI Annual Consumption Pattern From 2011 to 2016
Paired differences
t df
Sig. (2-
tailed) Mean Std. deviation
Std.
error
mean
95% confidence
interval of the
difference
Lower Upper
Pair 1 2011 site EUI -
2012 site EUI
8.8389 36.2572 1.4573 5.9771 11.7008 6.065 618 .000
Pair 2 2012 site EUI -
2013 site EUI
-6.7908 56.5650 2.2735 -11.2556 -2.3260 -2.987 618 .003
Pair 3 2013 site EUI -
2014 site EUI
-1.6454 64.8596 2.6069 -6.7649 3.4741 -.631 618 .528
Pair 4 2014 site EUI -
2015 site EUI
2.4682 41.2677 1.6587 -.7892 5.7255 1.488 618 .137
Pair 5 2015 site EUI -
2016 site EUI
2.0186 24.4743 .9837 .0868 3.9504 2.052 618 .041
Figure 6. Site EUI annual consumption pattern from 2011 to 2016

67
Source EUI. The mean of 2011 and 2016 weather-adjusted energy use intensity
at the source of energy generation measured for the 1,072 commercial buildings were
compared to answer:
Q1.2: Is there a statistically significant difference between the means of 2011
source EUI and 2016 source EUI?
Null Hypothesis 1.2: There is no statistically significant difference
between the means of 2011 source EUI and 2016 source EUI.
H0: µ2011 source EUI = µ2016 source EUI
Alternative Hypothesis 1.2: There is a statistically significant difference
between the means of 2011 source EUI and 2016 source EUI.
H1: µ2011 source EUI ≠ µ2016 source EUI
where µ is the mean source EUI.
The descriptive statistics displayed in Table 10 shows that the tested 1072
commercial buildings (N = 1072) had mean weather-normalized source EUIs of 213.03
and 192.46 kBtu/ft² in 2011 and 2016, respectively. The source EUI histograms shown in
Figures 7(a) and (b) indicate the normal distribution of the source EUI data records in
both conditions. As shown in Table 11, the t value of 6.40 was obtained with (1071)
degrees of freedom (df) associated with the t test. The test results indicate that the two
means were significantly different as the p-value denoted by “Sig. (2-tailed)” (p < 0.001)
was less than .05. Thus, the null hypothesis can be rejected considering that 2016
weather-adjusted source EUI (M = 192.46 kBtu/ft², SD = 113.41) was significantly lower
than that of 2011 (M = 218.29 kBtu/ft², SD =104.90), t(1071) = 6.40, p < 0.001. On

68
average, 2016 source EUI dropped by 10% (20.57 kBtu/ft²) compared to 2011 source
EUI, as shown in Table 11.
(a) (b)
Figure 7. Weather-normalized source EUI histogram for NYC commercial buildings’
2011 benchmarking data (a) and 2016 data (b).
Table 10
Source EUI—Paired Samples Statistics
Mean N Std. deviation Std. error mean
2011 source EUI 213.027 1,072 124.3328 3.7974
2016 source EUI 192.459 1,072 114.5585 3.4989
Table 11
Source EUI—Paired Samples Test
Paired differences
t df
Sig. (2-
tailed) Mean
Std.
deviation
Std. error
mean
95% confidence
interval of the
difference
Lower Upper
2011 source EUI -
2016 source EUI
20.5685
104.9025
3.2040
14.2817
26.8552
6.420
1071
.000

69
Table 12 shows the mean difference between the consistently calculated weather-
normalized source EUI of only 471 commercial buildings out of the 1,072 building
sample between 2011 and 2016. Tables 12 and 13 and Figure 8 show that the source EUI
was continuously decreasing throughout the 6 years except for a slight increase that was
reported in 2015 (see Table 13 - Pair 4). The average cut in source EUI was
approximately10% (24.22 kBtu/ft²), which agrees well with the results achieved by the
analysis performed earlier in this section. However, the only statistically significant drop
was reported in 2012 t(470) = 4.53, p < 0.001, α = .05, as shown in Table 13 (Pair 1). On
average the tested buildings source EUI significantly dropped in 2012 by 6.6% (16.03
kBtu/ft²). Thus, 66% of the cut in source EUI was achieved in the first year after the
policy implementation, as shown in Figure 8.
Table 12
Paired Samples Statistics—Source EUI Annual Consumption Pattern From 2011 to 2016
Mean N Std. deviation Std. error mean
Pair 1 2011 source EUI 228.664 471 135.5059 6.2438
2012 source EUI
212.633 471 129.7016 5.9763
Pair 2 2012 source EUI 212.633 471 129.7016 5.9763
2013 source EUI
206.881 471 114.6403 5.2823
Pair 3 2013 source EUI 206.881 471 114.6403 5.2823
2014 source EUI
205.556 471 115.2185 5.3090
Pair 4 2014 source EUI 205.556 471 115.2185 5.3090
2015 source EUI 206.256 471 125.8243 5.7977
Pair 5 2015 source EUI 206.256 471 125.8243 5.7977
2016 source EUI 204.442 471 128.2617 5.9100

70
Table 13
Paired Samples Test—Source EUI Annual Consumption Pattern From 2011 to 2016
Paired differences
t df
Sig. (2-
tailed) Mean
Std.
deviation
Std. error
mean
95% confidence
interval of the
difference
Lower Upper
Pair 1 2011 source EUI -
2012 source EUI
16.0312 76.8630 3.5417 9.0718 22.9907 4.526 470 .000
Pair 2 2012 source EUI -
2013 source EUI
5.7522 68.2013 3.1425 -.4230 11.9274 1.830 470 .068
Pair 3 2013 source EUI -
2014 source EUI
1.3246 63.3342 2.9183 -4.4099 7.0591 .454 470 .650
Pair 4 2014 source EUI -
2015 source EUI
-.7002 70.3207 3.2402 -7.0673 5.6669 -.216 470 .829
Pair 5 2015 source EUI -
2016 source EUI
1.8149 44.4291 2.0472 -2.2079 5.8376 .887 470 .376
Figure 8. Source EUI annual consumption pattern from 2011 to 2016

71
Total GHG emissions. The mean of 2011 and 2016 direct and indirect
greenhouse gases emitted by the 1,072 commercial buildings were compared to answer:
Q1.3: Is there a statistically significant difference between the means of 2011
GHG emissions and 2016 GHG emissions?
Null Hypothesis 1.3: There is no statistically significant difference
between the means of 2011 GHG emissions and 2016 GHG
emissions.
H0: µ2011 GHG = µ2016 GHG
Alternative Hypothesis 1.3: There is a statistically significant difference
between the means of 2011 GHG emissions and 2016 GHG
emissions.
H1: µ2011 GHG ≠ µ2016 GHG
where µ is the mean GHG emissions.
(a) (b)
Figure 9. Greenhouse gas emissions histogram for NYC commercial buildings’ 2011
benchmarking data (a) and 2016 data (b).

72
The descriptive statistics displayed in Table 14 shows that the mean amount of
greenhouse gases emitted by the 1,072 NYC commercial buildings (N = 1072) was
2168.05 and 1922.44 MtCO2e in 2011 and 2016, respectively. As shown in Table 15, the
t value of 5.18 was obtained with (1071) degrees of freedom (df) associated with the
paired sample t test. The results indicate that the two means were significantly different
as the p-value denoted by “Sig. (2-tailed)” (p < 0.001) was less than .05. Thus, the null
hypothesis can be rejected considering that the amount of GHG emissions in 2016 (with
an average of 1922.44 MtCO2e) was significantly lower than in 2011 (with an average of
2168.05 MtCO2e), t(1071) = 5.18, p < 0.001. The results revealed that, on average, the
amount of greenhouse gasses emitted by NYC commercial buildings in 2016
significantly reduced by approximately 12% (245.61 MtCO2e) compared to 2011, as
shown in Table 15.
Table 14
GHG Emissions—Paired Samples Statistics
Mean N Std. deviation Std. error mean
2011 GHG 2168.048 1,072 3301.3272 100.8303
2016 GHG 1922.437 1,072 2933.7663 89.6041

73
Table 15
GHG Emissions—Paired Samples Test
Paired differences
t df
Sig. (2-
tailed) Mean
Std.
deviation
Std. error
mean
95% confidence
interval of the
difference
Lower Upper
2011 GHG –
2016 GHG
245.6104
1551.7852
47.3952
152.6124
338.6083
5.182
1071
.000
Table 16 shows the mean difference between the consistently measured
greenhouse gasses emitted by 671 commercial buildings out of the 1,072 building sample
between 2011 and 2016. Tables 16 and 17 and Figure 10 revealed a steady reduction
pattern in the amount of GHG emissions throughout the 6 years with an average
reduction of approximately 13% (291.61 MtCO2e). These results agree well with the
results obtained previously in this section. It was noted that the only statistically
significant drop in the amount of GHG emitted by NYC commercial buildings was also
was achieved in 2012 t(670) = 4.09, p < 0.001, α = .05 (see Table 17, Pair 1), while no
statistically significant cuts in GHG emissions were obtained during the period between
2013 and 2016.
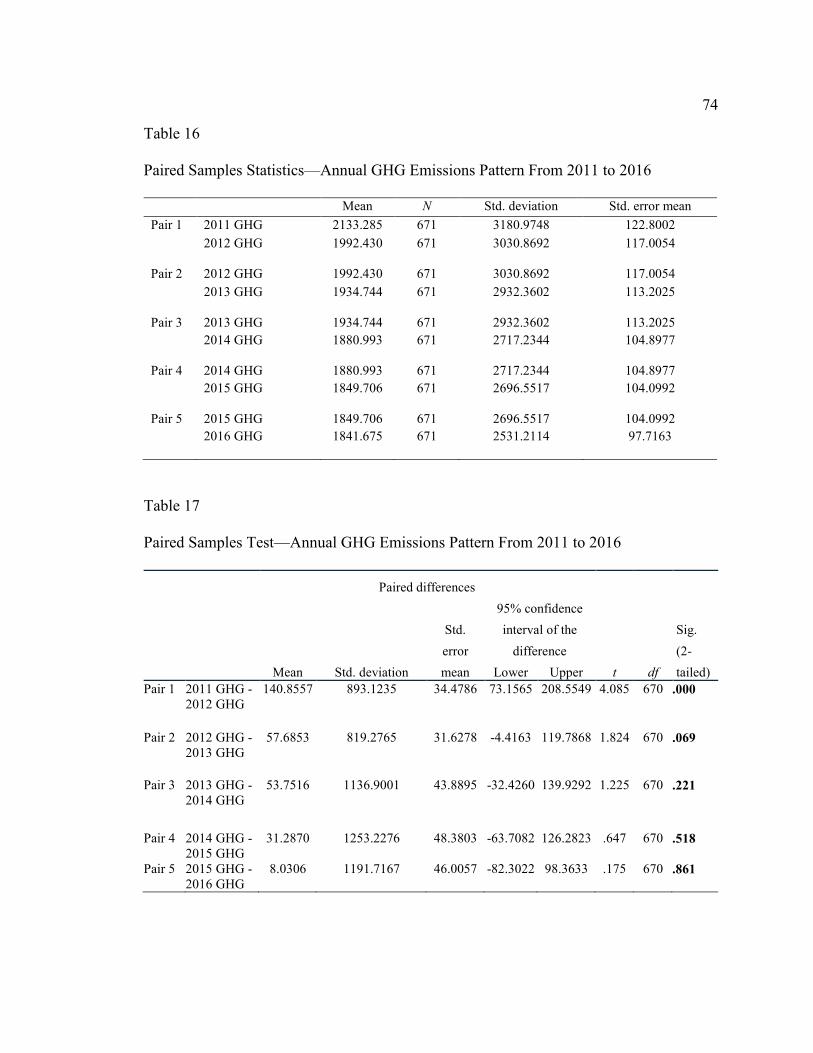
74
Table 16
Paired Samples Statistics—Annual GHG Emissions Pattern From 2011 to 2016
Mean N Std. deviation Std. error mean
Pair 1 2011 GHG 2133.285 671 3180.9748 122.8002
2012 GHG 1992.430 671 3030.8692 117.0054
Pair 2 2012 GHG 1992.430 671 3030.8692 117.0054
2013 GHG 1934.744 671 2932.3602 113.2025
Pair 3 2013 GHG 1934.744 671 2932.3602 113.2025
2014 GHG 1880.993 671 2717.2344 104.8977
Pair 4 2014 GHG 1880.993 671 2717.2344 104.8977
2015 GHG 1849.706 671 2696.5517 104.0992
Pair 5 2015 GHG 1849.706 671 2696.5517 104.0992
2016 GHG 1841.675 671 2531.2114 97.7163
Table 17
Paired Samples Test—Annual GHG Emissions Pattern From 2011 to 2016
Paired differences
t df
Sig.
(2-
tailed) Mean Std. deviation
Std.
error
mean
95% confidence
interval of the
difference
Lower Upper
Pair 1 2011 GHG -
2012 GHG
140.8557 893.1235 34.4786 73.1565 208.5549 4.085 670 .000
Pair 2 2012 GHG -
2013 GHG
57.6853 819.2765 31.6278 -4.4163 119.7868 1.824 670 .069
Pair 3 2013 GHG -
2014 GHG
53.7516 1136.9001 43.8895 -32.4260 139.9292 1.225 670 .221
Pair 4 2014 GHG -
2015 GHG
31.2870 1253.2276 48.3803 -63.7082 126.2823 .647 670 .518
Pair 5 2015 GHG -
2016 GHG
8.0306 1191.7167 46.0057 -82.3022 98.3633 .175 670 .861

75
Figure 10. Annual GHG emissions pattern from 2011 to 2016
ENERGY STAR scores. The mean of 2011 and 2016 building performance
rating of 803 out of the 1,072 commercial buildings calculated by the ESPM in a scale of
1-100 were compared to answer:
Q1.4: Is there a statistically significant difference between the means of 2011
and 2016 ENERGY STAR scores?
Null Hypothesis 1.4: There is no statistically significant difference
between the means of 2011 and 2016 ENERGY STAR scores.
H0: µ2011 ESS = µ2016 ESS
Alternative Hypothesis 1.4: There is a statistically significant difference
between the means of 2011 and 2016 ENERGY STAR scores.
H1: µ2011 ESS ≠ µ2016 ESS
where µ is the mean ENERGY STAR score.
The descriptive statistics displayed in Table 18 shows that the tested 867
commercial buildings (N = 803) had mean ENERGY STAR score of 65.6 and 68.2 in
2011 and 2016, respectively. The reported standard deviations for 2011 dataset (SD =

76
25.10) and 2016 (SD = 24.74) indicate the normal distribution of the data records in both
conditions. Table 19 shows that the obtained t value was -3.44 (the sign of t for a two-
tailed t-test can be ignored). There are (802) degrees of freedom (df) associated with the t
test. The results indicate that the two-means difference was statistically significant as the
p-value denoted by “Sig. (2-tailed)” (p = 0.001) was less than .05. Thus, the null
hypothesis can be rejected despite the slight difference between the mean ENERGY
STAR performance rating of 2011 (with an average ES score of 65.6) and 2016 (with an
average ES score of 68.2), t(802) = -3.44, p = 0.001. On average, 2016 ES scores
increased by approximately 5% (3 points) compared to 2011 scores (see Table 19).
(a) (b)
Figure 11. ENERGY STAR score histogram for NYC commercial buildings’ 2011
benchmarking data (a) and 2016 data (b).
Table 18
ENERGY STAR Score—Paired Samples Statistics
Mean N Std. deviation Std. error mean
2011 ESS 65.56 803 25.097 .886
2016 ESS 68.21 803 24.744 .873

77
Table 19
ENERGY STAR Score—Paired Samples Test
Paired differences
t df
Sig. (2-
tailed) Mean
Std.
deviation
Std. error
mean
95% confidence
interval of the
difference
Lower Upper
2011 ESS –
2016 ESS
-2.654
21.860
.771
-4.168
-1.140
-3.440
802
.001
Table 20 shows the mean difference between the consistently calculated
ENERGY STAR performance rating of 489 commercial buildings out of the 803
commercial buildings with ES scores between 2011 and 2016. As shown in Tables 20
and 21 (Pair 1), the average ES performance rating significantly improved from 65.3 in
2011 to 68.5 in 2012 t(488) = -4.99, p <0.001, α = .05. However, the average ES score
significantly dropped to 66.4 in 2013 t(488) = 3.53, p <0.001, α = .05. An improved
average score was obtained in 2014; however, the achieved improvement was not
statistically significant, (see Table 21 - Pair 3). As shown in Table 20 (Pair 4), the
average ES score slightly dropped again in 2015. Then it significantly improved in 2016
t(488) = -3.74, p < 0.001, α = .05 (see Table 21 – Pair 5). This analysis shows an average
improvement in ES scores of almost 5% (3 point), similar to the results obtained
previously in this section. However, the improvement pattern was inconsistent, as shown
in Figure 12.

78
Table 20
Paired Samples Statistics—Annual ENERGY STAR Score Pattern From 2011 to 2016
Mean N Std. deviation Std. error mean
Pair 1 2011 ESS 65.25 489 25.166 1.138
2012 ESS
68.53 489 24.777 1.120
Pair 2 2012 ESS 68.53 489 24.777 1.120
2013 ESS
66.41 489 24.915 1.127
Pair 3 2013 ESS 66.41 489 24.915 1.127
2014 ESS 66.07 489 24.098 1.090
Pair 4 2014 ESS 66.07 489 24.098 1.090
2015 ESS 66.89 489 24.253 1.097
Pair 5 2015 ESS 66.89 489 24.253 1.097
2016 ESS 68.71 489 24.436 1.105
Table 21
Paired Samples Test—Annual ENERGY STAR Score Pattern From 2011 to 2016
Paired differences
t df
Sig.
(2-
tailed
) Mean Std. deviation
Std. error
mean
95% confidence
interval of the
difference
Lower Upper
Pair 1 2011 ESS –
2012 ESS
-3.288 14.587 .660 -4.584 -1.992 -4.985 488 .000
Pair 2 2012 ESS –
2013 ESS
2.127 13.325 .603 .943 3.311 3.529 488 .000
Pair 3 2013 ESS –
2014 ESS
.342 12.579 .569 -.776 1.459 .600 488 .549
Pair 4 2014 ESS –
2015 ESS
-.828 12.110 .548 -1.904 .248 -1.512 488 .131
Pair 5 2015 ESS –
2016 ESS
-1.820 10.769 .487 -2.777 -.863 -3.737 488 .000

79
Figure 12. Annual ENERGY STAR score pattern from 2011 to 2016
Summary
Paired sample t tests were performed using SPSS 24 to compare the mean
difference between the 2011 and 2016 energy benchmarking data of NYC commercial
buildings based on the performance indices calculated by the ESPM. A total of 1,072
commercial building that benchmarked in both 2011 and 2016 were included in the study
(803 buildings with ENERGY STAR performance rating). The study results revealed that
in comparison to 2011, the average energy consumed by NYC commercial buildings in
2016, considering both the site EUI and source EUI significantly dropped by 5% and
10%, respectively. Furthermore, the total amount of GHG emitted by NYC commercial
buildings was significantly lower than the amount emitted in 2011 by approximately 12%
(246 MtCO2e). The overall ENERGY STAR performance rating calculated by Portfolio
Manager indicated that the energy performance of NYC commercial buildings
significantly improved in 2016 by approximately 5% (3 points) compared to 2011).
These results are in good agreement with the results reported in NYC’s Energy and Water

80
Use 2014 and 2015 Report that also showed 10% drop in source EUI and 14% reduction
in GHG emissions by NYC benchmarked buildings in 2015, (NYC Urban Green Council,
2017).
Additional statistical analyses of the city’s commercial buildings annual energy
performance patterns were performed in order to thoroughly understand the energy
consumption pattern of NYC’s commercial buildings and assess the efficacy of the
adopted benchmarking policy. The mean differences between NYC commercial buildings
energy performance metrics calculated by the ESPM were compared on an annual basis
throughout the period between 2011 and 2016 using paired sample t tests. The annual
analysis of the site EUI revealed a substantially inconsistent consumption pattern with
fluctuating mean differences throughout the 6 years with the most significant decrease
achieved in 2012 - the first year following the public disclosure of the benchmarking
data. Despite the steady reduction in the source EUI pattern during the period between
2011 and 2016, the only statistically significant decrease was also obtained in 2012.
Similar steady reduction pattern in the average amount of GHG emissions was obtained
throughout the 6 years with the only statistically significant GHG emissions cut obtained
in 2012. On the other hand, the ES scores analysis revealed an inconsistent pattern and
fluctuating mean differences with the only significant improvements obtained in 2012
and 2016. Overall, 66% of savings in source EUI, 48% of cuts in GHG emissions, and
91% of the improvement in ES scores were achieved a year after the public disclosure of
the benchmarking data. Additionally, the mean site EUI in 2012 was actually lower than

81
that obtained in 2016.These results will be further discussed, conclusions will be drawn,
and recommendations will be made in Chapter 5.

82
Chapter 5: Discussion, Conclusions, and Recommendations
Introduction
The focus of this quantitative study was understanding the influence of the energy
benchmarking and disclosure policies that have been adopted by many local and state
governments nationwide over the past decade. A repeated measures design was adopted
to answer the research question, which addressed whether the mean annual energy use of
NYC’s existing commercial buildings significantly reduced after the city implemented
Benchmarking Law LL84. Paired sample t tests were performed to compare the mean
energy performance indices calculated by the ESPM of 1,072 of NYC commercial
buildings that were benchmarked in both 2011 and 2016. The statistical analysis
evaluated the significance and direction of the difference between the means of the paired
observations and determined whether the energy performance of the city’s existing
commercial buildings significantly improved after the policy implementation. The annual
energy performance patterns of NYC’s existing commercial buildings were also
analyzed.
The study results revealed that compared to 2011, the energy performance of
NYC’s commercial buildings had significantly improved by 2016, as their site EUI had
significantly reduced by 5%, source EUI had significantly decreased by10%, GHG
emissions had significantly dropped by 12%, and ENERGY STAR performance rating
had significantly improved by 5%. However, inconsistent annual energy performance
patterns were detected, and the statistically significant improvements were primarily
achieved one year after the energy benchmarking data were publicly disclosed in 2012, as

83
66% of savings in source EUI, 48% of cuts in GHG emissions, and 91% of the
improvement in ENERGY STAR scores were achieved in 2012. In addition, the average
savings in site EUI achieved in 2012 was twice as much as that obtained over the 6 years.
Interpretation of the Findings
The study findings confirmed the body of knowledge in the research regarding the
energy performance of NYC’s benchmarked buildings reported in NYC annual
benchmarking reports. The results obtained for this study agree well with those reported
in NYC’s Energy and Water Use 2014 and 2015 Report, which also showed a 10% drop
in source EUI and 14% reduction in GHG emissions by NYC benchmarked buildings
(including multifamily, office, and other building categories) in 2015 compared to 2011
data (Urban Green Council, 2017). The congruence between the results can be attributed
to the fact that commercial buildings are considered the dominant building category in
NYC, comprising more than 35% of the benchmarked gross floor area. Meanwhile,
including 2016 benchmarking data in this study might have led to the slight difference
between the obtained 12% drop in GHG emissions by 2016 and the data reported by the
Urban Green Council (2017), which showed a 14% cut in GHG emissions in 2015.
Furthermore, the analyses of the annual energy performance patterns of NYC’s
commercial buildings revealed that 66% of reduction in source EUI, 48% of cuts in GHG
emissions, and 91% of the improvement in ENERGY STAR scores were achieved in
2012. Likewise, the report by the Urban Green Council (2017) highlighted that 50% of
the decrease in NYC large buildings’ (including multifamily, office, and other building
categories) source EUI and GHG emissions were achieved in 2012. Similar ENERGY

84
STAR score patterns showing the dramatic improvement achieved in 2012 with a 3-point
mean difference between 2011 and 2012 (from 65 in 2011 to 68 in 2012) were also
reported in the NYC 2013 Local Law 84 Benchmarking Report that showed median
ENERGY STAR performance ratings of 64 and 67 for 2011 and 2012, respectively (City
of New York, 2016). The substantial energy performance improvements achieved in
2012 can be related to the public disclosure of the benchmarking data, given that the
study results indicate that the most statistically significant improvements were achieved
in 2012, one year after the city’s energy benchmarking data were publicly disclosed.
Meanwhile, the energy performance patterns between 2013 and 2016 were inconsistent.
Hence, additional measures that aim to motivate energy efficiency upgrades should be
adopted to maintain continuous energy saving and GHG mitigation patterns and allow
NYC to maintain long-term sustainability and achieve goals to save energy and cut GHG
emissions by 80% by 2050.
Furthermore, Kontokosta (2015), Hsu (2014b), Scofield (2013), and Kaskhedikar
et al. (2015) questioned the accuracy and reliability of the ESPM (EPA’s benchmarking
tool) and the validity of its scores. The analyses performed to examine the annual energy
performance patterns further confirmed this issue. The obtained annual patterns of ES
scores were not consistent with those of the source EUI and GHG emissions, except for
the statistically significant improvements achieved in 2012. The mean ES score
significantly dropped in 2013 (from 68.5 to 66.4), while the means of both source EUI
and GHG emissions slightly improved. In contrast, when the average source EUI slightly
increased in 2016, the ES score significantly improved (from 66.9 to 68.7). On the other

85
hand, the obtained annual patterns of the ES scores were in good agreement with the
annual site EUI patterns. The ES scores significantly dropped when the mean site EUI
significantly increased in 2013, and they significantly improved when the site EUI
significantly decreased in 2016. This indicates that the ES performance rating follows the
site EUI rather than the source EUI, although, according to the EPA, the ES performance
rating relies primarily on source EUI as the most accurate unit for the evaluation of
energy performance because it measures the total amount of energy required to operate
the buildings (ENERGY STAR, 2016b). Accordingly, the annual benchmarking reports
provided by the NYC Urban Green Council and NYC Mayor’s Office of Sustainability
(Urban Green Council, 2016, 2017), as well as the research studies conducted on the
energy benchmarking of buildings, all relied on source EUI to evaluate the energy
performance of buildings (Hsu, 2014b; Scofield, 2013). These findings further doubt the
reliability of the ENERGY STAR Portfolio Manager, which is currently considered the
most widely used benchmarking tool nationwide.
Interpretation of Findings in the Context of Theoretical Framework
The study findings indicate that the energy benchmarking and public disclosure of
benchmarking data generated the information necessary to encourage energy-efficiency
upgrades for owners/managers of NYC’s existing commercial buildings, resulting in
statistically significant energy performance improvements over the 6 years of the policy’s
implementation. As the IAD framework allows for making choices—based on rational
choice theory—to weigh benefits (future savings in running costs, higher occupancy
rates, and higher property values) and limitations (initial cost of energy-efficient projects)

86
to reach decisions that generate the most gains, existing buildings’ owner/managers
considered the disclosed energy benchmarking data that showed the energy performance
of their buildings to weigh the risks and rewards of their energy-efficient investment
decisions (Ostrom et al., 2014). Within this context, the IAD framework offered a
systematic approach to organizing policy analysis actions using a wide range of analytic
techniques, and the theoretical framework was applied to analyze and manage complex
policy situations to achieve desired policy outcomes. Thus, the IAD framework allowed
me to make inferences concerning the influence of energy benchmarking and disclosure
policies on the individuals’ rational decisions as a democratic way to solve problems by
changing the rules employed by participants at different levels of the institution.
Limitations of the Study
The main limitation of this study is that the paired sample t tests did not imply
causality and the obtained research findings only measured the changes in energy
performance patterns of NYC’s benchmarked commercial buildings after the
implementation of the energy benchmarking and disclosure policies (Campbell &
Stanley, 1963). However, the statistically significant difference between the mean of the
energy consumed by NYC’s existing commercial buildings between 2011 and 2016 and
the direction of change, in addition to the significant drop in GHG emissions and
significant improvement in their ENERGY STAR performance, all indicate the influence
of the policies on the energy performance of the city’s commercial buildings. Another
threat to the internal validity of the study is the potential that factors other than policy
implementation might also be associated with the energy performance of the NYC

87
commercial buildings, such as changes in occupant behavior, occupancy levels, and
operation management.
The use of a purposeful sample that limited the study to one geographical site
(NYC) is regarded as a threat to the external validity of the study (generalizability).
However, the fact that NYC is the largest urban center in the United States, with the
highest concentration of commercial buildings, makes it a viable example to examine,
and other cities might find this kind of analysis useful. The total gross floor area covered
by the NYC Benchmarking Law of 2.8 billion ft² represents more than 25% of the 10.7
billion ft² covered by all of the energy benchmarking and disclosure policies adopted
nationwide (IMT, 2014). In addition, the study analyzed a large sample that included the
entire population of commercial buildings benchmarked in both 2011 and 2016. All of
these factors enhance the external validity of the study, boost the validity of its statistical
inferences, and support the generalizability of its findings.
Recommendations
Based on the strengths and limitations of the current study as well as the literature
reviewed in Chapter 2, additional research is recommended in the following areas:
• Enhance generalizability: The initially stated overarching aim of this study
was to assess the influence of currently adopted energy benchmarking and
disclosure policies. Recognizing the limitation of the study sample, in that it
was confined to one geographical site (NYC), I recommend that future
research in this field include larger samples with multiple geographical sites
covered by energy benchmarking and disclosure policies in order to enhance

88
the external validity of the research and ensure the generalizability of the
outcomes. Additionally, similar research methodology could be replicated in
other cities and jurisdictions of the United States.
• Direct effect of the policies: As the research method adopted in this study did
not imply causality, I recommend that future research focus on investigating
the direct effect of the energy benchmarking policies on the energy
performance of buildings, as well as evaluating the factors that determine the
energy performance of buildings (Gruber et al., 2015; Hsu, 2014a). Additional
research could compare the effectiveness of the energy benchmarking policies
with and without the public disclosure of data to further investigate the effect
of the public disclosure of benchmarking data.
• Policy implementation: Based on this study’s findings, future research could
further analyze the energy performance patterns of NYC’s buildings in order
to maintain long-term sustainability and achieve their goals to save energy and
cut GHG emissions by 80% by 2050 (Urban Green Council, 2017). A
qualitative or mixed-methods study that incorporates interviews with NYC
policy-makers could examine additional measures to motivate energy
efficiency upgrades and identify appropriate policy implementation,
incentives, and financing programs that could be adopted to maintain
continuous energy saving and GHG mitigation patterns (Cluett & Amann,
2013; Kontokosta, 2015, Ma et al., 2012; Nelson et al., 2014).
89
• Assess the accuracy of ESPM: Kontokosta (2015) recommended developing
specific benchmarking metrics for each city based on local building data to
achieve better results as he referred the failure of the ESPM due to its reliance
on EUI to measure the energy performance of buildings. The current study
findings also questioned the accuracy of the ES energy performance rating as
it aligned with the site EUI rather than source EUI. Hence, future research in
this field could involve evaluating currently used benchmarking measures
and/or developing new energy benchmarking tools, particularly assessing the
accuracy of the ENERGY STAR Portfolio Manager, as the most widely used
energy benchmarking tool nationwide (Kaskhedikar et al., 2015; Kontokosta,
2015).
Implications
The current study examined a successful intergovernmental collaboration
involving various governmental agencies, including the EPA, which used national data
collected by the Commercial Buildings Energy Consumption Survey (CBECS) to
develop the ENERGY STAR Portfolio Manager—the energy benchmarking tool adopted
by the city of New York Benchmarking Law LL84—to measure the energy performance
of NYC buildings. Such collaboration could potentially enhance the development of
policy options that promote collaboration between key stakeholders to maintain policy
coordination and cooperation at the national, state, and local levels. Meanwhile, at the
local government level, NYC is considered one of the leading cities to adopt energy
benchmarking policies and publicly disclose its benchmarking data. The statistically

90
significant results obtained by the current study, which indicate the efficacy of NYC
Benchmarking Law LL84, could encourage other cities and jurisdictions to follow NYC’s
lead and adopt similar policies to meet their energy saving and GHG mitigation goals. At
the individual level, the study outcomes could help to promote the culture of
sustainability, raise public awareness regarding the benefits of energy-efficiency
building, encourage private building owners/managers to invest in energy-efficient
upgrades, and promote positive overall perceptions of the sustainable building concept.
Such changes may strengthen the commitment to the notion of sustainable development
and inspire policy makers develop policies that further reduce the environmental footprint
of the building industry by reducing energy consumption and encouraging more efficient
energy use.
Conclusion
Improving the energy performance of privately owned existing buildings is
critical to save energy, cut GHG emissions, and mitigate climate change. The results of
this quantitative study indicate that the energy performance of NYC’s existing
commercial buildings significantly improved after the implementation of NYC
Benchmarking Law LL84. The study findings could help public officials, policy-makers,
and legislators understand the benefits of energy benchmarking and the role of publicly
disclosing benchmarking data in saving energy, in addition to helping private buildings’
owners/operators understand the benefits of measuring the energy use patterns of their
buildings in order to maximize the operational efficiency of existing buildings.

91
References
Allcott, H., & Greenstone, M. (2012). Is there an energy efficiency gap? Journal of
Economic Perspectives, 26(1), 3-28. doi:10.1257/jep.26.1.3
Bergh, J. C. J. M. Van den. (2013a). Environmental and climate innovation: Limitations,
policies and prices. Technological Forecasting and Social Change, 80(1), 11-23.
doi:10.1016/j.techfore.2012.08.004
Bergh, J. C. J. M. Van den. (2013b). Policies to enhance economic feasibility of a
sustainable energy transition. Proceedings of the National Academy of Sciences,
110(7), 2436-2437.
Burr, A. C., Keicher, C., & Leipziger, D. (2011). Building energy transparency: A
framework for implementing US commercial energy rating and disclosure policy.
Washington, DC: Institute for Market Transformation. Retrieved from
http://www.imt.org
Campbell, D. T., & Stanley, J. C. (1963). Experimental and quasi-experimental designs
for research. Boston, MA: Houghton Mifflin.
Chen, P. Y., & Popovich, P. M. (2002). Quantitative applications in the social sciences:
Correlation: SAGE. doi:10.4135/9781412983808
City of New York. (2012). plaNYC 2012 New York City Local Law 84 benchmarking
report. Retrieved from http://www.nyc.gov/
City of New York. (2013). plaNYC 2013 New York City Local Law 84 benchmarking
report. Retrieved from http://www.nyc.gov/

92
City of New York. (2014). plaNYC 2014 New York City Local Law 84 benchmarking
report. Retrieved from http://www.nyc.gov/
Cluett, R., & Amann, J. (2013). Residential energy use disclosure: A review of existing
policies. Washington, DC: American Council of an Energy-Efficient Economy.
Retrieved September 1, 2016, from http://aceee.org
Commercial Building Inventory. (2012). The age of US commercial buildings. Retrieved
September 1, 2016, from https://www.eia.gov
Cox, M., Brown, M. A., & Sun, X. (2013). Energy benchmarking of commercial
buildings: A low-cost pathway toward urban sustainability. Environmental
Research Letters, 8. doi:10.1088/1748-9326/8/3/035018
Creswell, J. (2009). Research design: Qualitative, quantitative, and mixed methods
approaches (3rd ed). Thousand Oaks, CA: Sage.
Crothers, C. (Ed.). (2010). Encyclopedia of life support systems: Vol. 2. Historical
developments and theoretical approaches in sociology. Oxford, England: EOLSS.
ENERGY STAR. (2016a). Buildings & plants: Portfolio Manager. Retrieved December
10, 2016, from https://www.energystar.gov/buildings/tools-and-resources
/portfolio-manager-0
ENERGY STAR. (2016b). Buildings & plants: What is energy use intensity (EUI)?
Retrieved December 10, 2016, from https://www.energystar.gov/buildings/facility
-owners-and-managers/existing-buildings/use-portfolio-manager/understand-
metrics/what-energy

93
Field, A. (2013). Discovering statistics using IBM SPSS statistics (4th ed.). London,
England: Sage.
Florini, A., & Saleem, S. (2011). Information disclosure in global energy governance.
Global Policy, 2, 144-154. doi:10.1111/j.1758-5899.2011.00135.x
Frankfort-Nachmias, C., & Nachmias, D. (2008). Research methods in the social sciences
(7th ed.). New York, NY: Worth.
Gruber, J. K., Prodanovic, M., & Alonso, R. (2015). Estimation and analysis of building
energy demand and supply costs. Energy Procedia, 83, 216-225.
doi:10.1016/j.egypro.2015.12.176
Hsu, D. (2012). City of New York LL84 data analysis & quality assessment. Retrieved
February 6, 2018, from http://www.nyc.gov/
Hsu, D. (2014a). How much information disclosure of building energy performance is
necessary? Energy Policy, 64, 263-272.
dio:https://doi.org/10.1016/j.enpol.2013.08.094
Hsu, D. (2014b). Improving energy benchmarking with self-reported data. Building
Research & Information, 42(5), 641-656. doi:10.1080/09613218.2014.887612
Institute for Market Transformation. (2014). Building energy benchmarking and
disclosure in U.S. cities. Retrieved March 5, 2017, from http://www.imt.org
Institute of Market Transformation. (2015). Comparison of U.S. commercial building
energy benchmarking and disclosure policies. Retrieved March 5, 2017, from
http://www.imt.org

94
Institute for Market Transformation. (2016). Building energy performance policy.
Retrieved October 1, 2017 from, http://www.imt.org
Institute for Market Transformation. (2017). BuildingRating: Sharing transparency for a
more efficient future. Retrieved October 1, 2017 from, http://www.imt.org
International Energy Agency (IEA). (2015). The state of buildings’ energy performance,
and what needs to be done. Retrieved October 1 from: https://www.iea.org
Kaskhedikar, A., Reddy, T. A., & Runger, G., PhD. (2015). Use of random forest
algorithm to evaluate model-based EUI benchmarks from CBECS
database. ASHRAE Transactions, 121, 17-28.
Kontokosta, C. E. (2012). Local Law 84 energy benchmarking data report to the New
York City mayor’s office of long-term planning and sustainability. Retrieved
February 9, 2018, from http://www.nyc.gov/
Kontokosta, C. E. (2013). Energy disclosure, market behavior, and the building data
ecosystem. New York Academy of Sciences. Annals of the New York Academy
of Sciences: The Implications of a Data Driven–Built Environment, 1295, 34–43.
doi:10.1111/nyas.12163
Kontokosta, C. E. (2015). A market-specific methodology for a commercial building
energy performance index. Journal of Real Estate Finance and Economics, 51(2),
288-316. doi:http://dx.doi.org/10.1007/s11146-014-9481-0
Levin, J., & Milgrom, P. (2004). Introduction to choice Theory. Retrieved March 27,
2015, from http://web.stanford.edu
95
Local Laws 84 of 2009. (2009). Energy and Water Benchmarking. Retrieved from
https://www1.nyc.gov/
Ma, Z., Cooper, P., Daly, D., & Ledo, D. (2012). Existing building retrofits: methodology
and state-of-the-art. Energy and Buildings, 55, 889–902.
doi:10.1016/j.enbuild.2012.08.018
Mattern, S. (2013). Municipal energy benchmarking legislation for commercial buildings:
You can't manage what you don't measure. Environmental Affairs, 40(2), 487-
521. Retrieved September 1, 2016, from: http://lawdigitalcommons.bc.edu
Memdani, L. (2013). Going green-TCS' Mantra to sustainable development. Vidwat, 6(2),
12-18. Retrieved January 13, 2017 from
http://search.proquest.com.ezp.waldenulibrary.org
Nelson, H. T., Rose, A., Wei, D., Peterson, T., & Wennberg, J. (2015). Intergovernmental
climate change mitigation policies: Theory and outcomes. Journal of Public
Policy, 35(1), 97-136. doi:http://dx.doi.org/10.1017/S0143814X1400011
NYC Benchmarking Law LL84. (2009). Local Laws of the City Of New York for the
year 2009. Retrieved from http://www.nyc.gov/
NYC Benchmarking Law LL84. (2016). Local Laws of The City Of New York for the
Year 2016. Retrieved from http://www.nyc.gov/
New York City Mayor’s Office of Sustainability. (2017). Benchmarking data disclosure
definitions. Retrieved August 29, 2017, from http://www.nyc.gov/html/gbee
/downloads/pdf/2016_nyc_benchmarking_data_disclosure_definitions.pdf

96
Northeast Energy Efficiency Partnerships (NEEP). (2013). Building energy rating and
disclosure policies update and lessons from the field. Retrieved October 1, 2016,
from http://www.neep.org
Office of Office of Energy Efficiency and Renewable Energy. (n.d.). Building energy use
benchmarking. Retrieved October 1, 2016, from
https://www.energy.gov/eere/slsc/building-energy-use-benchmarking
O’Sullivan, E., Rassel, G. R., & Berner, M. (2008). Research methods for public
administrators (5th ed.). New York, NY: Pearson, Longman.
Ostrom, E. (2005). Understanding Institutional Diversity. Princeton, NJ: Princeton
University Press.
Ostrom, E., Cox,M., & Schlager, E. (2014). An assessment of the institutional analysis
and development framework and introduction of the socio-ecological systems
framework. In Theories of the Policy Process, eds. Paul Sabatier and Christopher
Weible. Boulder, CO: Westview, 267–306.
Palmer, K. & Walls, M. (2015). Can benchmarking and disclosure laws provide
incentives for energy efficiency improvements in buildings? Resources for the
future. Washington, DC. Retrieved September 1, 2016, from: http://www.rff.org
Pickup, M. (2015). Quantitative applications in the social sciences: Introduction to time
series analysis Thousand Oaks, CA: SAGE. doi:10.4135/9781483390857
Ross A., & Willson V.L. (2017) Paired samples t test. In: Basic and advanced statistical
tests. Rotterdam, Netherlands: Sense. dio:https://doi.org/10.1007/978-94-6351-
086-8_4
97
Sabatier, P. A., ed. (1999). Theories of the policy process. Boulder, CO: Westview.
Sabatier, P. A., & Weible, C. M. (Eds.). (2014). Theories of the policy process (3rd ed.).
Boulder, CO: Westview.
Scofield, J., H. (2013). Efficacy of LEED-certification in reducing energy consumption
and greenhouse gas emission for large New York City office buildings. Energy
and Buildings. 67, 517–524. dio:https://doi.org/10.1016/j.enbuild.2013.08.032
Seattle Office of Sustainability and Environment OSE. (2015). Building energy
benchmarking analysis report 2013 data. City of Seattle, WA. Retrieved
October15, 2016, from http://www.seattle.gov
United Nations Environment Programme - Sustainable Buildings and Climate Initiative
UNEP-SBCI. (2014). Why buildings. Paris, France. Retrieved January 5, 2017,
from: http://www.unep.org
Urban Green Council (2016). New York City’s energy and water use 2013 report.
Retrieved from http://www.nyc.gov/
Urban Green Council (2017). New York City’s energy and water use 2014 and 2015
report. Retrieved from http://www.nyc.gov/
U.S. Department of Energy. (2012). Buildings energy data book. Washington, DC:
Author. Retrieved October 1, 2016, from http://buildingsdatabook.eren.doe.gov
U.S. Environmental Protection Agency EPA. (2014). EPA's report on the environment
(ROE) 2014 draft website. Draft inventory of us greenhouse gas emissions and
sinks 1990–2013U.S. Environmental Protection Agency, Washington, DC.
Retrieved September 1, 2016, from: http://cfpub.epa.gov

98
U.S. Energy Information Administration EIA. (2016). International energy outlook 2016:
Chapter 6. Buildings sector energy consumption. Department of Energy,
Washington, DC. Retrieved October1, 2016, from, https://www.eia.gov
U.S. Energy Information Administration. (2017). Commercial buildings energy
consumption survey (CBECS): Building type definitions. Retrieved September
10, 2017, from https://www.eia.gov/consumption/commercial/building-type-
definitions.php
World Commission on Environment and Development (WCED). (1987). Our Common
Future. Oxford University Press: Oxford, UK.

99
Appendix A: Copyright Permission Letter
HI Samar,
Yes, you have our permission to use the graphics. I believe we are in the process of
updating the pie chart showing covered buildings, but I do not know when that will
be complete.
Katie
Katie Weeks, LEED Green Associate Director of Communications Institute for Market Transformation 1707 L Street NW | Suite 1050 | Washington, DC 20036 (202) 525-2883 x306 (direct) | (347) 524-0458 (mobile) [email protected] | www.imt.org | @IMT_speaks
On Thu, Apr 12, 2018 at 7:32 PM, Samar
Hamad <[email protected]> wrote:
Institute for Market Transformation
Dear Ms. Weeks,
I am a doctoral student at Walden University currently working on my dissertation that
examines the influence of the energy benchmarking and disclosure policies on the energy
performance of existing commercial buildings. I would like your permission to include
the materials in the attached files in this project, including:
• Percentage of total carbon emissions from building sector (see Attachment 1).
• Number of properties annually covered by benchmarking policies (see
Attachment 2).
The material will be used in the literature review chapter to explain the negative impact
of existing buildings on the environment and the number of buildings covered by the
benchmarking policies nationwide. Permission includes one-time, nonexclusive
permission for the requested use. I would greatly appreciate your consent to my request.
If you require any additional information, please do not hesitate to contact me.
Sincerely,
Samar Hamad
PhD student in Public Policy and Administration – Local Government Management for
Sustainable Communities

100
School of Social and Behavioral Science
Walden University
Student ID: A00273895