inflation report may 2012 output and supply. chart 3.1 gdp (a) (a)chained-volume measure at market...
TRANSCRIPT

Inflation Report May 2012
Output and supply

Chart 3.1 GDP(a)
(a) Chained-volume measure at market prices.

Chart 3.2 Service sector output and surveys of service sector output
Sources: BCC, CBI, CBI/PwC, Markit Economics and ONS. (a) Measures included are the BCC, CIPS/Markit and the CBI financial services, business/consumer services and distributive trades surveys weighted together using nominal shares in value added. The BCC data are non seasonally adjusted. Survey measures have been scaled to match the mean and variance of service sector growth since 2000. The diamond shows the monthly CIPS/Markit indicator for April 2012.(b) Quarterly growth, chained-volume measure at basic prices.

Chart 3.3 Survey indicators of business confidence
Sources: BCC, CBI, CBI/PwC, Markit Economics and Bank calculations. (a) Includes measures of service sector business expectations from the BCC, CBI and CIPS/Markit surveys. The CBI measure weights together financial services, business/consumer services and distributive trades surveys using shares in nominal value added. The surveys used are: BCC turnover confidence, CBI business optimism and CIPS/Markit business expectations. The BCC data are non seasonally adjusted.(b) Includes measures of manufacturing business expectations from the BCC (non-services), CBI and CIPS/Markit surveys. The surveys used are: BCC turnover confidence, CBI business optimism and CIPS/Markit orders. The BCC data are non seasonally adjusted.
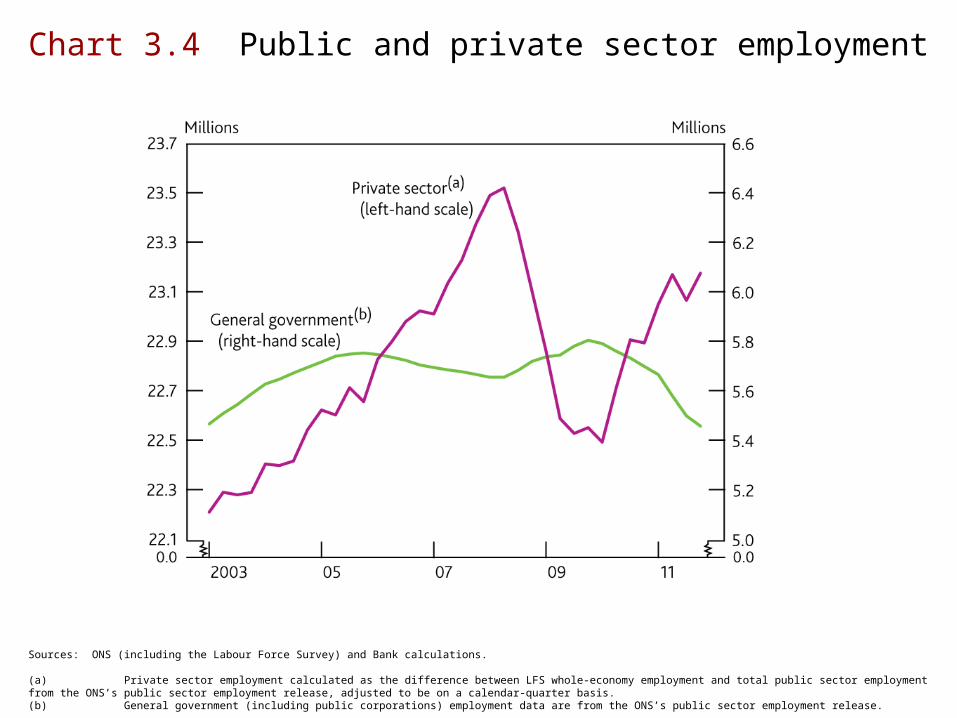
Chart 3.4 Public and private sector employment
Sources: ONS (including the Labour Force Survey) and Bank calculations. (a) Private sector employment calculated as the difference between LFS whole-economy employment and total public sector employment from the ONS’s public sector employment release, adjusted to be on a calendar-quarter basis.(b) General government (including public corporations) employment data are from the ONS’s public sector employment release.

Chart 3.5 Private sector employment and surveys of employment intentions
Sources: Bank of England, BCC, CBI, CBI/PwC, Manpower, ONS (including the Labour Force Survey) and Bank calculations. (a) Data are to 2012 Q1. Measures from the Bank’s Agents (manufacturing and services), the BCC (non-services and services) and the CBI (manufacturing, financial services and business/consumer services) are weighted together using employee shares from Workforce Jobs. The Agents’ data are end-quarter observations. The BCC data are non seasonally adjusted. The Manpower data cover the whole economy.(b) Percentage change on a quarter earlier. Data are to 2011 Q4. Calculated as in Chart 3.4.

Chart 3.6 Unemployment rates(a)
Source: ONS (including the Labour Force Survey). (a) Rolling three-month measures unless otherwise stated.(b) Recessions are defined as in Chart 2.3.(c) Defined as those people who have been unemployed for more than twelve months divided by the economically active population. Data prior to 1992 are based on non seasonally adjusted, annual LFS microdata. These annual observations correspond to the March-May quarter.

Chart 3.7 Flows into employment(a)
Sources: ONS (including the Labour Force Survey) and Bank calculations. (a) Based on LFS microdata that have been seasonally adjusted by Bank staff. Data are to 2011 Q4 and based on the 16–64 population.(b) Flows into LFS employment by those who had been unemployed for fewer (more) than twelve months divided by the number of people who were unemployed for fewer (more) than twelve months in the previous quarter.(c) Flows into LFS employment by those who had been inactive by reason divided by the number of people who were inactive by reason in the previous quarter.

Chart 3.8 Contributions to the weighted non-employment rate(a)
Sources: ONS (including the Labour Force Survey) and Bank calculations. (a) Percentages of the 16–64 population where each group is scaled by average 1998–2007 transition rates into employment, relative to the short-term unemployed, as shown in Chart 3.7. Rolling three-month measure.

Chart 3.9 Whole-economy and sectoral labour productivity(a)
(a) Output per hour.(b) Continuations of pre-recession trends are calculated by projecting forward labour productivity from 2008 Q2 using the average quarterly growth rate between 1997 Q2 and 2008 Q1.

Chart 3.10 Survey indicators of capacity utilisation by sector
Sources: Bank of England, BCC, CBI, CBI/PwC and ONS. (a) Includes measures of services capacity utilisation from the Bank’s Agents, BCC and CBI. The Agents’ data are end-quarter observations. The CBI measure weights together financial services, business/consumer services and distributive trades surveys using shares in nominal value added. The BCC data are non seasonally adjusted.(b) Includes measures of manufacturing capacity utilisation from the Bank’s Agents, CBI and a measure of non-services capacity utilisation from the BCC. The Agents’ data are end-quarter observations. The BCC data are non seasonally adjusted.

Chart 3.11 CBI survey measures of intentions to invest to expand capacity(a)
Sources: CBI, CBI/PwC and Bank calculations. (a) Calculated by scaling the net percentage balance of respondents who report that they are increasing their capital expenditure on vehicles, plant and machinery over the next twelve months by the proportion of respondents who report that they intend to invest in order to expand capacity.(b) This measure weights together financial services and business/consumer services measures by their shares in nominal value added.

Tables
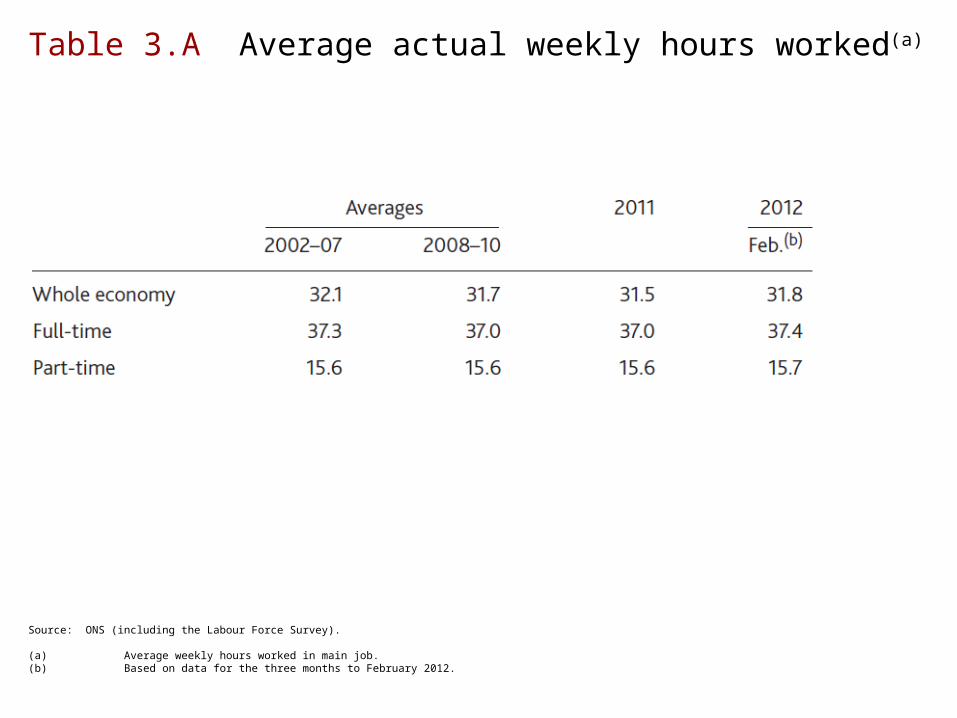
Table 3.A Average actual weekly hours worked(a)
Source: ONS (including the Labour Force Survey). (a) Average weekly hours worked in main job.(b) Based on data for the three months to February 2012.

Table 3.B Changes in part-time employment by reason for working part-time
Source: ONS (including the Labour Force Survey). (a) Includes those who are ill or disabled, students and those who gave no reason.

Table 3.C Survey indicators of recruitment difficulties
Sources: Bank of England, BCC, CBI, CBI/PwC and ONS. (a) Unless otherwise stated.(b) End-quarter observations on a scale of -5 to +5, with positive scores indicating greater recruitment difficulties in the most recent three months compared with the situation a year earlier.(c) Percentage of respondents reporting recruitment difficulties over the past three months. Non seasonally adjusted. Services and non-services balances are weighted using employee jobs shares from Workforce Jobs.(d) Balances of respondents expecting skilled/unskilled labour to limit output/business over the next three months (in the manufacturing sector) or over the next twelve months (in the financial, business and consumer services sectors), weighted using employee jobs shares from Workforce Jobs. Averages are since 1998 Q4.

The impact of special factors onthe path of GDP growth in 2012

(a) Gross value added (GVA) at basic prices for services and manufacturing weighted by their shares in nominal value added.
Chart A Manufacturing and services GVA around the Golden Jubilee in June 2002 and the royal wedding in April 2011(a)