inflation report - central reserve bank of peru · conclusion ... the inflation rate observed in...
TRANSCRIPT
September 2013
Recent trendsand macroeconomic forecasts 2013 - 2015
INFLATION REPORT:
June 2013
Recent trendsand macroeconomic forecasts 2013-2015
INFLATION REPORT:
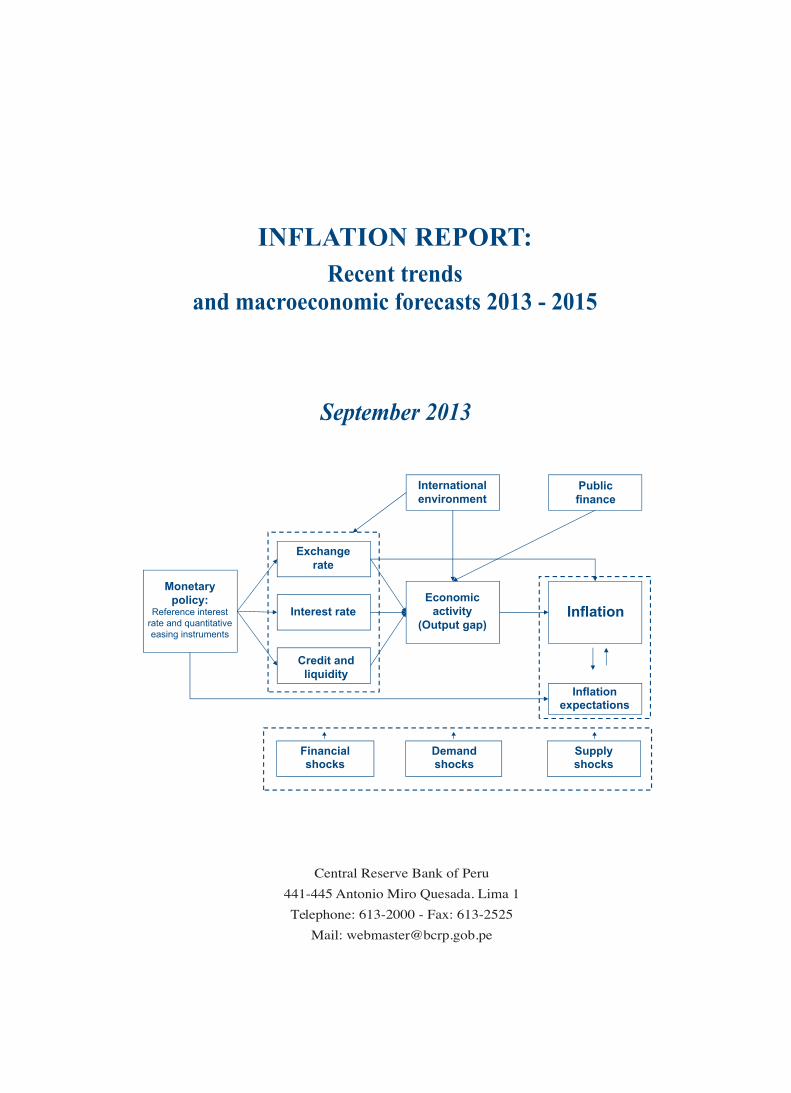
Exchange rate
Interest rate
Credit and liquidity
International environment
Public
Economic activity
(Output gap)
expectations
Supplyshocks
Demandshocks
Financialshocks
Monetarypolicy:
Reference interest rate and quantitativeeasing instruments
Central Reserve Bank of Peru441-445 Antonio Miro Quesada. Lima 1Telephone: 613-2000 - Fax: 613-2525
Mail: [email protected]

INFLATION REPORT Recent trends and macroeconomic forecasts
CENTRAL RESERVE BANK OF PERU

This Inflation Report was drawn up using data on the balance of payments as of the second quarter of 2013, data on the gross domestic product and monetary accounts as of July 2013, and data on the operations of the non-financial public sector, inflation, financial markets, and the foreign exchange rate as of August 2013.
Foreword ............................................................................................ 5
Summary ............................................................................................ 6
I. International environment ............................................................ 11
II. Economic activity .......................................................................... 29
III. Balance of payments .................................................................... 48
IV. Publicfinances .............................................................................. 64
V. Monetary policy ............................................................................. 73
VI. Inflation ........................................................................................ 104
VII. Balance of risks ............................................................................. 121
Conclusion ........................................................................................... 123
BOXES1. Supply-demand balance of the electricity sector at 2018 ....................................... 46
2. Macroeconomic fundamentals and sovereign risk ................................................. 100
3. Dollarization of contracts with suppliers .................................................................. 102
4. Exchangerate-to-inflationpass-through................................................................. 119
Pag.
CONTENT
INFLATION REPORT:
Recent trends and macroeconomic forecasts 2013 - 2015
September 2013

5
Inf la t ion Report . September 2013
Foreword
• InaccordancewiththePeruvianConstitution,theCentralReserveBankofPeru(BCRP)isapublicautonomousentitywhoseroleistopreservemonetarystability.
• In order to consolidate this goal, theBank’smonetary policy is basedon aninflation targeting scheme, with an inflation target of 2.0 percent, plus orminusonepercentagepoint(between1.0and3.0percent).TheCentralBank’sinflationtargetisaimedatanchoringinflationexpectationsatasimilarleveltothe inflation rate observed in developed economies and reflects the BCRP’spermanentcommitmentwithmonetarystability.
• Thenatureofmonetarypolicyispreventiveandthereforeaimedatanticipatinginflationaryordeflationarypressures,takingintoaccountthatinflationmaybeinfluencedby factorsbeyond the controlof theCentralBank, suchas supplyshocks or the prices of imported products, which may result in transitorydeviationsofinflationfromthetarget.TheBCRPconsiderstheannualincreaseintheconsumerpriceindexrecordedeachmonthandnotonlyatyearend.
• Eachmonth,andaccordingtoapreviouslyannouncedschedule,theBoardoftheBCRPapprovesareferenceratefortheinterbanklendingmarket.Thisinterestrate,whichisthemonetaryoperationaltarget,affectstherateofinflationthroughseveralchannelsindifferenttimeframesand,therefore,itisdeterminedonthebasisofmacroeconomicforecastsandsimulations.
• Additionally, the Central Bank implements preventive measures to preservefinancial stability and monetary policy transmission mechanisms. Throughinterventionsintheforeignexchangemarket,theCentralBankreducesexcessivevolatility in the exchange rate and accumulates international reserves, thusdevelopingstrengthstofacenegativeeventsinaneconomywithstillhighlevelsoffinancialdollarization.TheCentralBankalsousesothermonetarypolicytoolsthataffectthevolumeofliquidityandcreditinamoredirectmanner,suchasreserverequirementsindomesticcurrencyandinforeigncurrency.
• TheforecastsonwhichmonetarypolicydecisionsarebasedaredisseminatedthroughtheInflationReporttoshowtheconsistencyofthedecisionsadoptedwith the aim that economic agents’ expectations take these forecasts intoaccount.TheCentralBankalsodisseminatesthestudiesanalyzingtheriskfactorsthatmaycausedeviationsintheforecastsoftheeconomicvariablesconsidered.
• TheBCRPwillpublishitsnextInflationReportinDecember2013.
6
CENTRAL RESERVE BANK OF PERU
Summaryi. Sofarthisyeartheworld economyhasshownamoderatepaceofexpansion,a
growthrateof3.4percentbeingestimatedforthesecondquarterandasimilarrateforthethirdquarter.Althoughthereisabetteroutlookforthedevelopedcountries,growthinthemajoremergingeconomieshassloweddownrelativetotheforecastsdiscussedinourJuneReport.
EconomicactivityintheUnitedStateshasregisteredapositiveevolutioninrecentmonths, supportedby consumption –particularly by the consumptionofdurablegoods–and, toa lesserextent, by residential investment. Factorsaccounting forevolutionofconsumptionhavebeentherecoveryofthelabormarketandthewealtheffectassociatedwithhigherhousepricesandtheimprovementofstockmarkets.ArelativelybettersituationisalsoobservedintheEurozone,wherefearsofapossiblefinancialcrisishavedissipatedamidsignalsofrecoveryineconomicactivity.
Theexpectationsof lowermonetarystimulusfromtheFEDhaveconsolidatedinthecontextofrecoveryoftheUSeconomy,althoughthereisstilluncertaintyaboutthemagnitudeofthewithdrawalofmonetarystimulusandaboutwhenitwillbegin.AsdescribedinourJunereport,theseexpectationshaveresultedinareductionofnetcapitalflowstoemergingeconomies,whichhasgeneratedepisodesofdepreciationandariseofsovereignriskinsomeoftheseeconomies.
With this international outlook, the forecast of global growth has been reviseddownfrom3.0to2.9percentfor2013andfrom3.7to3.6percentfor2014.Theterms of tradehavealsobeenreviseddownwards,inlinewiththedeclineincommoditypricesobserved in recentmonthsand thedownward revisionofgrowthinthemajoremergingeconomies.In2013and2014termsoftradeareexpectedtofallby4.5and1.6percent,respectively,althoughtheleveloftermsoftradewillstillbehigherthantheaveragelevelobservedbetween2003and2012.
ii. Inthefirstsemesterof2013,Peru’sgross domestic productgrew5.2percent,recordingahighergrowthrateinthesecondquarteroftheyearthaninthefirstquarter. Domestic demand inQ2 showed for the fifth consecutive quarter ahighergrowthrate(6.5percent)thanGDP,althoughthisratewaslowerthantheoneobservedinQ1(8.1percent).Ontheotherhand, like inQ1,netexportscontinuedtoregisteranegativecontributiontotheGDPgrowthrate.
ThegrowthrateofGDPprojectedfor2013hasbeenreviseddownto5.5percentfromtherateof6.1percentestimatedinourJuneReport.Thisisexplainedbythelowerrateofexpansionobservedinexportsandthedownwardrevisionoftheforecastofglobalgrowth.However,itshouldbepointedoutthatexportsofbothtraditionalasnon-traditionalproductsareexpectedtorecoverinthesecondsemester.
7
Inf la t ion Report . September 2013
TheGDPgrowthrateestimatedfor2014hasbeenreviseddownto6.2percent,inlinewiththegrowthofthepotentialoutput.Ontheotherhand,afasterpaceofgrowthwouldbeobserved in2015due to theonsetofoperations insomeinvestment projects,mainly in themining sector,whichwould result in aGDPgrowthrateof6.7percent.
iii. Inthefirsthalfoftheyear,thebalance in the current accountofthebalanceofpaymentsshowedadeficitequivalentto5.4percentofGDP,higherthantheoneobservedinthesameperiodof2012,inacontextinwhichinvestmentgrewatahigherratethandomesticsavingsandtermsoftradedeclined.Inthisperiodthedeficitwasfinancedbyinflowsoflong-termcapital(US$13.6billion),whichwerehigherthanthoserecordedinthefirsthalfof2012.
Acurrentaccountdeficitof4.9percentofGDPisprojectedfor2013inthebalanceofpayments.ThishigherdeficitthantheoneestimatedinJune(4.4percentofGDP)wouldresultfromlowerexportsinacontextoflowerinternationalpricesandslowerglobalgrowth,offsetbyaslowergrowthofimports,inlinewiththedownwardrevisionofGDPgrowth.
Thecurrentaccountdeficitprojectedfor2014isstillestimatedat4.6percentofGDP,whilein2015thisdeficitwouldbelowerthananticipatedinourpreviousreport(4.1percentofGDPinsteadof4.3percentofGDP).Thedecliningpathforeseeninthedeficitconsiderstherecoveryofexternaldemandandtheonsetof operations of severalmining projects in 2014 and 2015 (Toromocho, LasBambas,andConstancia).
iv. As anticipated in our report of June, slower global growth and lower exportpricesareexpectedtoimplylowertaxrevenueswhich,coupledwitharateofexpenditureofthegeneralgovernmentgrowingatahigherratethanGDPovertheforecasthorizon,wouldtranslateintoadecliningpathinthebalanceofthenon-financial public sector asaresultofwhichthisbalancewouldgofromasurplusof2.2percentofGDPin2012toanilbalancein2015.
v. TheBoardoftheCentralBankhasmaintainedthemonetarypolicybenchmark interest rate at4.25percent,which is the level this ratehashad sinceMay2011. TheBoard’sdecision is basedon the fact that inflation is expected toremainwithinthetargetrangeandthattherateofinflationinthelast12monthsis forecast to return to the target range as food supply conditions improve.Moreover, the domestic scenario is expected to bemarked by an economicgrowthclosetotheeconomy’spotentialoutputwhiletheinternationalscenariowillcontinuetobecharacterizedbyfinancialuncertaintyassociatedwiththesizeandtimingofthepossiblewithdrawalofmonetarystimulusbytheFed.
Inaddition,sinceMay2013theBCRPhasloosenedreserverequirementmeasurestoensureanorderlyevolutionof liquidityandcredit inthefinancialsystemin

8
CENTRAL RESERVE BANK OF PERU
ordertopreserveinthiswayfinancialconditionsinacontextofuncertaintyininternationalfinancialmarkets.
Inthiscontext,theBCRPhasmadeinterventionsintheforeignexchangemarketsince May 24, when international financial volatility increased after the FedannouncedthatitcouldstartreducingmonetarystimulusinSeptember2013.TheBCRPfirstintervenedintheforeignexchangemarketplacingcertificatesofdepositindexedtotheexchangerate(CDRBCRP)foratotalofUS$1.77billionbetweenMayandAugustandthen,sinceJuly,theCentralBankalsointervenedintheforeignexchangemarketthroughdirectsalesofdollars,whichamountedtoUS$2.99billioninthesameperiod.
vi. InAugustinflationinthelast12monthsshowedarateof3.28percent,slightlyabovethetargetrange.Inthecentralforecastscenario,inflationisconsideredtohavebeenrecentlyaffectedbytransitoryfactorsandthereforethatitwouldreturntothetargetrangeinthelastquarterof2013andconvergethereaftertothemidpointof2.0percentin2014.Thisscenarioconsidersthattherewouldbenomajorinflationarypressuresassociatedwithincreasesinthepricesoffoodcommoditiesnortodomesticdemandandthatmonetarypolicyactionswouldmaintaininflationexpectationsanchoredwithinthetargetrange.
vii. ThebalanceofrisksinthisInflationReportisneutralsincetheprobabilitythatinflationwill bebelow the forecast considered in thebaseline scenario is thesameastheprobabilitythatinflationwillbeabovetheforecastlevel.
viii.Thedownward risksintheinflationforecastareexternalfactorsassociatedwith
thepossibledeteriorationoftheworldeconomy,includingastrongerslowdowninthegrowthoftheemergingeconomies,andinternalfactorsassociatedwiththedynamicsofexpectationsofbusinessconfidence.
a. Slowdown of domestic demand
Businessconfidenceisanimportantdeterminantofprivateinvestment,soifitdeteriorateditwouldcontributetoalowerdynamismindomesticdemand,which
INFLATION FORECAST: 2013-2015(Last12months%change)
7
6
5
4
3
2
1
0
-1
7
6
5
4
3
2
1
0
-12010 2011 2012 2013 2014 20152008 2009
Band
of %
pro
babi
lity
arou
nd th
e ba
se s
cena
rio
90
90
80
80
70
70
60
60
50
50
40
40
30
30
20
20
1010
9
Inf la t ion Report . September 2013
wouldresultinaloweroutputgapandconsequentlyinlowerinflation.Therecentevolutionof public expenditure and the implementationof public investmentprojectssuggestthatthefiscalimpulsewouldinpartoffsetthenegativeeffectsofthedeteriorationofbusinessconfidenceintheforecasthorizon.
Should these risks materialize, the Central Bank would respond easingmonetaryconditionstomaintaininflationwithinthetargetrange.
b. Deterioration of the international environment
TheprobabilitiesthattheUnitedStateswillgothrougharecessionperiodor that the recession in Europewill deepen have declined compared totheprobabilities considered inour last report.However, therearehigherprobabilities that the emerging economies may experience a greaterslowdown.Adeepeningoftheseriskconditionswouldentail lowerglobaldynamismand aweakeningof external demand,whichwould affect thedomesticeconomythroughfinancialandtradechannels.
TheFEDisexpectedtostartgraduallywithdrawingmonetarystimulussincethe end of 2013. An earlier and less gradual withdrawal of quantitativeeasingcouldbringaboutarapidanddisorderlyadjustmentintheexchangerateandintheinterestratesofPublicTreasurybondsinoureconomygiventhehighparticipationofnon-residentinvestorsinthesedomesticsecurities.
Shouldtheserisksmaterialize, theCentralBankwouldusethesignificantamount of international reserves the country has and several liquidityinjectionmechanisms, both in national currency and in foreign currency,tooffsettheimpactoftheseshocksondomesticfinancialconditions.TheCentralBankwouldrespondtosuchmacroeconomicconditionsbyeasingmonetaryconditions.
ix. On the other hand, the upward risks for inflation are associated with thedynamicsofcommoditypricesandotherpricessensitivetosupplyfactors
c. Domestic and external shocks
Thebaselinescenarioconsidersthatcommoditypriceswillremainrelativelystablenextyear.Intheexternalfront,therisksconsideredincludetheriskofhigherinternationalpricesofcrudeoilandoilderivativesgiventhepoliticaltensions associated with a possible military intervention in Syria. In thedomesticfront,ontheotherhand,thebaselinescenarioconsiderstheriskthatfisheriescouldhavehigherpricesduetoadverseweatherconditions.
Inthisscenario,theCentralBankwouldadjustitsmonetarypositiononlyif these inflationaryshocksweretoaffectand increaseeconomicagents’expectationsofinflation.
10
CENTRAL RESERVE BANK OF PERU
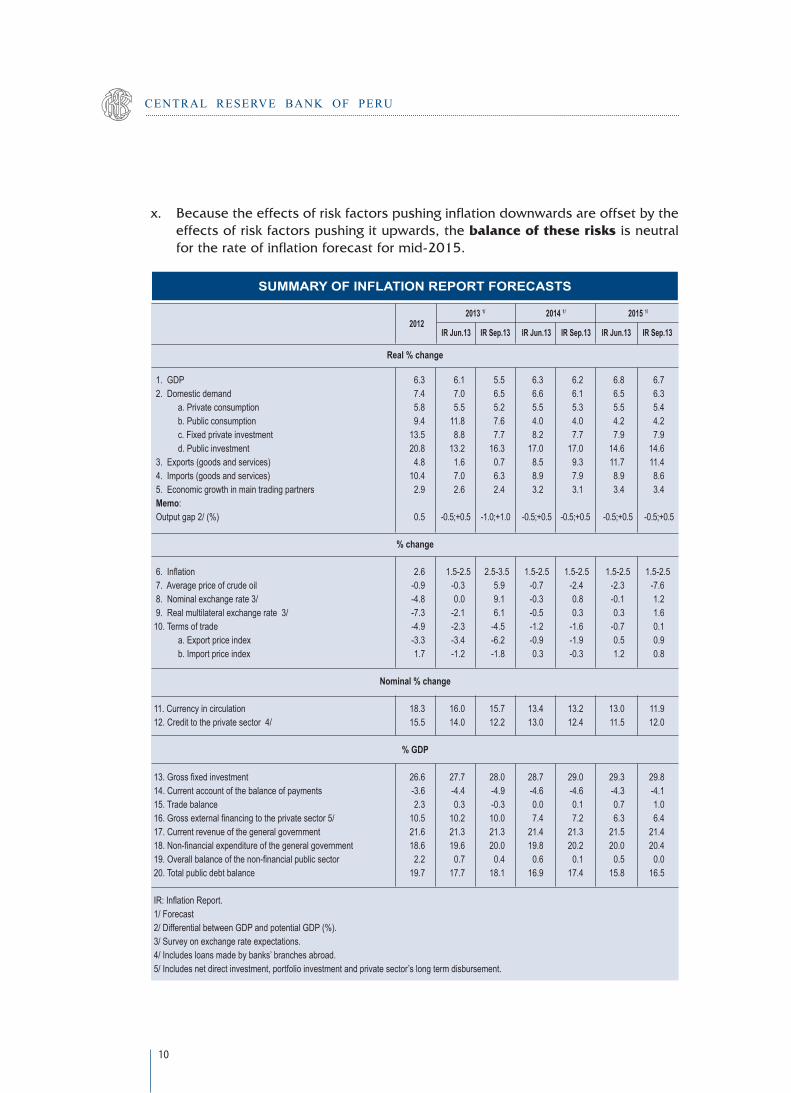
x. Becausetheeffectsofriskfactorspushinginflationdownwardsareoffsetbytheeffectsofriskfactorspushingitupwards,thebalance of these risksisneutralfortherateofinflationforecastformid-2015.
I. InternationalEnvironment
Real % change
1. GDP 6.3 6.1 5.5 6.3 6.2 6.8 6.7 2. Domestic demand 7.4 7.0 6.5 6.6 6.1 6.5 6.3 a. Private consumption 5.8 5.5 5.2 5.5 5.3 5.5 5.4 b. Public consumption 9.4 11.8 7.6 4.0 4.0 4.2 4.2 c. Fixed private investment 13.5 8.8 7.7 8.2 7.7 7.9 7.9 d. Public investment 20.8 13.2 16.3 17.0 17.0 14.6 14.6 3. Exports (goods and services) 4.8 1.6 0.7 8.5 9.3 11.7 11.4 4. Imports (goods and services) 10.4 7.0 6.3 8.9 7.9 8.9 8.6 5. Economic growth in main trading partners 2.9 2.6 2.4 3.2 3.1 3.4 3.4 Memo: Output gap 2/ (%) 0.5 -0.5;+0.5 -1.0;+1.0 -0.5;+0.5 -0.5;+0.5 -0.5;+0.5 -0.5;+0.5
% change 6.Inflation 2.6 1.5-2.5 2.5-3.5 1.5-2.5 1.5-2.5 1.5-2.5 1.5-2.5 7. Average price of crude oil -0.9 -0.3 5.9 -0.7 -2.4 -2.3 -7.6 8. Nominal exchange rate 3/ -4.8 0.0 9.1 -0.3 0.8 -0.1 1.2 9. Real multilateral exchange rate 3/ -7.3 -2.1 6.1 -0.5 0.3 0.3 1.610. Terms of trade -4.9 -2.3 -4.5 -1.2 -1.6 -0.7 0.1 a. Export price index -3.3 -3.4 -6.2 -0.9 -1.9 0.5 0.9 b. Import price index 1.7 -1.2 -1.8 0.3 -0.3 1.2 0.8
Nominal % change 11. Currency in circulation 18.3 16.0 15.7 13.4 13.2 13.0 11.912. Credit to the private sector 4/ 15.5 14.0 12.2 13.0 12.4 11.5 12.0
% GDP 13.Grossfixedinvestment 26.6 27.7 28.0 28.7 29.0 29.3 29.814. Current account of the balance of payments -3.6 -4.4 -4.9 -4.6 -4.6 -4.3 -4.115. Trade balance 2.3 0.3 -0.3 0.0 0.1 0.7 1.016.Grossexternalfinancingtotheprivatesector5/ 10.5 10.2 10.0 7.4 7.2 6.3 6.417. Current revenue of the general government 21.6 21.3 21.3 21.4 21.3 21.5 21.418.Non-financialexpenditureofthegeneralgovernment 18.6 19.6 20.0 19.8 20.2 20.0 20.419.Overallbalanceofthenon-financialpublicsector 2.2 0.7 0.4 0.6 0.1 0.5 0.020. Total public debt balance 19.7 17.7 18.1 16.9 17.4 15.8 16.5
IR:InflationReport.1/ Forecast2/ Differential between GDP and potential GDP (%).3/ Survey on exchange rate expectations.4/ Includes loans made by banks’ branches abroad.5/ Includes net direct investment, portfolio investment and private sector’s long term disbursement.
SUMMARY OF INFLATION REPORT FORECASTS
IR Jun.132012
2013 1/ 2014 1/ 2015 1/
IR Jun.13 IR Jun.13IR Sep.13 IR Sep.13 IR Sep.13
11
Inf la t ion Report . September 2013
I. International Environment
1. Theworldeconomyhascontinuedtogrowatmoderaterates.Aglobalgrowthrateof3.4percent isestimated inQ2andasimilarrate isestimatedforQ3.Theeconomicoutlookforthedevelopedeconomieshasimproved,particularlyfor the Eurozone countries,whereas, on theother hand, themajor emergingeconomiesshowsignsofaslowdownand,inmanycases,thisslowdownwouldbegreater thanwhatwasestimated inourprevious InflationReport.Becauseofthis,theforecastsofglobalgrowthhavebeenreviseddownfrom3.0to2.9percentfor2013andfrom3.7to3.6percentfor2014.
ExpectationsthattheFedwillreducemonetarystimulushaveconsolidatedsincethepublicationof our previous InflationReport due to thepositive evolutionof employment and economic activity in the United States. As a result ofthis, net capital flows to emerging economies have declined and episodesof depreciation of the currencies of these economies have been observed,especiallyinthecountriesthathaveahighcurrentaccountdeficit.Thissituationhasalsogenerateda rise inbondyields in theseeconomiesanda fall in thepricesofcommodities,whichwerealsoaffectedbyprospectsofslowergrowthinChinaandotheremergingeconomies. It isworthpointingout that theFeddecidednottoreduceitsassetpurchaseprogramatitsmeetingofSeptember17and18, so this trendhas reversed in financialmarketsover thepast fewdays.
Although thedownward trend in thepriceofcommoditieshasstabilized, thetermsoftradehavebeenreviseddownwards,inlinewiththetrendsobservedin recentmonthsandwith the lowergrowthprojected in themajoremergingeconomies.Thus,thetermsoftradeareexpectedtofallby4.5percentin2013andtoregisterafurtherreductionof1.6percentin2014.
Economic activity
2. In aggregate terms, economic activity has shown relative stability in recentmonths.Itisestimatedthattheglobaleconomygrew3.4percentinQ2-2013,recordingahigherratethaninthepreviousquarter(2.2percent).ThestabilizationofgrowthintheEurozoneisworthpointingoutaftersevenconsecutivequartersofcontraction.ItisestimatedthattheworldeconomywouldgrowatasimilarrateinQ3.

12
CENTRAL RESERVE BANK OF PERU
Other aggregate indicators also show signs of a recovery trend. The globalmanufacturingindex–compositeindexofPMIs–hasremainedabove50inthepastninemonths,indicatinggrowthatmoderaterates.Theglobalindicatoroftheservicesector–whichreflectsactivitymoredirectlyassociatedwiththeevolutionofdomesticdemand–showedagreaterrecoveryinthepasttwomonthsandrecordedlevelsnotseensinceFebruary2012.
Ontheonehand,thisresultreflectsarecoveryinthedevelopedeconomies,withtheimprovementoftheseindicatorsinthecaseoftheUnitedStatesandsignsofrecoveryinEuropestandingout.Ontheotherhand,theemergingeconomieshavebeengrowingat lower rates thanexpected inacontextofdeterioratinginternational financial conditions (given the expectedwithdrawal ofmonetarystimulusbytheFed),lowercommodityprices,aslowdownindomesticdemandand,inseveralcases,inflationarypressures.
Source:JPMorgan.*Forecast(September13,2013).
Graph 1GDP: SEASONALLy ADjuSTED QuARTERLy GROwTh
(%annualizedrates)
1086420-2-4-6-8-10Q1.08 Q1.09 Q1.10 Q1.11 Q1.12 Q1.13Q3.08 Q3.09 Q3.10 Q3.11 Q3.12 Q3.13*
-3.62.1
0.0
-5.7-5.2
3.54.6 5.6 5.4 4.6 3.9 4.3 3.5 2.6 3.7 3.1 3.6 2.3 2.7 2.7 2.2
3.4 3.1
World Developedcountries Emergingcountries
Source:JPMorgan.
Graph 2jP MORGAN GLOBAL PMI MANuFACTuRING AND SERVICES
(January2007-August2013)
65
60
55
50
45
40
35
30Jan.08Jan.07 Jan.09 Jan.10 Jan.11 Jan.12 Jan.13Jul.08Jul.07 Jul.09 Jul.10 Jul.11 Jul.12 Jul.13
Services Manufacturing
56.1
51.7
It isestimated that theworldeconomywill grow2.9percent in2013,whichimpliesadownwardrevisionofourpreviousestimate(3.0percent)duemainly

13
Inf la t ion Report . September 2013
to thedownwardrevisionof thegrowth forecastof theemergingeconomies.Becauseofthis,thegrowthforecastfor2014hasbeenreviseddownfrom3.7percentto3.6percent.
Asinourpreviousreport,thisforecastshowsdownsiderisksassociatedwithadeteriorationofconditionsintheEurozone,negotiationsregardingthedebtlimitintheUnitedStates,ahigher-than-expectedslowdowninemergingeconomies,andariseinthepriceofoil.TheprobabilitythatacrisiswilloccurintheEurozonehas declined compared with our previous report, whereas the probability ofoccurrence of the former two events has increased, in line with recent dataabout the emerging economies and with geopolitical conflicts in theMiddleEast.
Table 1WORLD GDP GROWTH
(Annual % change)
2012 2013 2014 2015
IR Jun.13 IR Sep.13 IR Jun.13 IR Sep.13 IR Jun.13 IR Sep.13
Developed countries 1.4 1.2 1.1 2.0 2.0 2.3 2.3Of which: 1. United States 2.8 1.9 1.6 2.4 2.5 3.0 3.02. Eurozone -0.6 -0.6 -0.5 1.0 1.0 1.3 1.3 Germany 0.7 0.3 0.5 1.5 1.5 1.5 1.5 France 0.0 -0.4 0.0 1.0 1.0 1.2 1.2 Italy -2.4 -1.6 -1.8 0.6 0.5 0.9 0.9 Spain -1.6 -1.6 -1.5 0.4 0.4 0.9 0.93. Japan 2.0 1.5 1.9 1.4 1.4 1.1 1.14. United Kingdom 0.2 0.9 1.1 1.5 1.7 1.8 1.8
Developing countries 5.1 5.0 4.7 5.5 5.2 5.7 5.6Of which: 1. Developing Asia 6.9 6.9 6.5 7.3 6.8 7.3 7.2 China 7.8 7.7 7.5 8.0 7.6 8.0 8.0 India 5.0 6.0 5.0 6.9 6.0 6.9 6.52. Central and Eastern Europe 1.4 2.0 2.0 3.2 3.2 3.2 3.23. Latin America and the Caribbean 3.0 3.3 2.6 3.7 3.4 3.8 3.8 Brazil 0.9 2.9 2.2 3.6 2.7 4.0 4.0
World Economy 3.2 3.0 2.9 3.7 3.6 4.0 3.9
Memo:Peru’s trading partners 1/ , 2.9 2.6 2.4 3.2 3.1 3.4 3.4BRICs 2/ 5.9 6.2 5.8 6.7 6.2 6.8 6.7
IR:InflationReport.1/ Basket of Peru’s 20 main trading partners.2/ Brazil, Russia, India, and China.Source: Bloomberg, IMF, and Consensus Forecast.

14
CENTRAL RESERVE BANK OF PERU
3. Theeconomyintheunited Statescontinuestoshowamoderaterecovery.InQ2,GDPgrew2.5percentinannualizedtermsandrecentindicatorsofemploymentandmanufacturingcontinuedshowingthepositivetrendobservedoverthepastmonths.
This favorable economic trend continues to be supported by consumption,particularly the consumptionof durable goods –which has accumulated eightconsecutivequartersofgrowthwithanaveragerateof7.8percent–and,toalesserextent,by residential investment.Asdiscussed inprevious reports, thedeterminingfactorsoftheevolutionofconsumptionhavebeentherecoveryofthelabormarketandthewealtheffectassociatedwithhigherhousingpricesandtheimprovementofstockmarkets.
Asregardsemployment,applicationsforunemploymentbenefitshaveshownadownwardtrendbetweenJuneandAugust.Atotalof445thousandjobshavebeen created in this period.With this, 6.8million jobs have been recoveredsince2010(thatis,81percentofthejobslostduringthecrisis).Moreover,theunemployment rate has dropped from 7.6 percent in June to 7.3 percent inAugust.However,thisdropinunemploymentisalsoassociatedtoadecreaseinthelaborforce–thesmallestworkforceobservedsince1978–,whichgeneratesgreateruncertaintyaboutthestrengthofthelabormarket
Graph 3uSA: EMPLOyMENT AND uNEMPLOyMENT RATE
Jul.07 Jul.08 Jul.09 Jul.10 Jul.11 Jul.12 Jul.13
11
10
9
8
7
6
5
4
5004003002001000-100-200-300-400-500-600-700-800-900
unemployment (%) Employment Chg. (Thousands)
Source:Bloomberg.
Unemploymentrate(leftaxis)
Employmentchangeinthousands(rightaxis)
4. Asregards investment,arecoverywasobservedinnon-residential investmentin Q2, supported by the favorable evolution of corporate profits in recentquarters.
Ontheotherhand,residentialinvestmentcontinuedtobedrivenbytheincreaseinhouseprices.Sofarthisyear,thelevelofhousepriceshasincreased9percentyearly andhouse inventorieshave increased24percent.Recent indicatorsofsalesofnewhomesandnewconstructionsandconstructionpermitswouldbeshowingsomeslowdownintherealestatebusiness.However,thesectorisstill

15
Inf la t ion Report . September 2013
expected to continue showingapositive trendbecause thepricesof homes,despitetherecentrise,arestill23percentbelowthepeaklevelsreachedbetween2006and2007.Similarly,housinginventoriesrepresentonly54percentofthelevelrecordedbeforethefinancialcrisis.
Graph 4uSA: PRICES OF hOuSE (S&P/CS*) AND INVENTORIES
Jan.07 Jan.08 Jan.09 Jan.10 Jan.11 Jan.12 Jul.13Jan.13
5.5
5.0
4.5
4.0
3.5
3.0
2.5
2.0
1.5
210
200
190
180
170
160
150
140
130
Million units Index
*S&P/CS:S&P/Case-ShillerHomePriceIndex.Source:Bloomberg.
Inventories(leftaxis)HousepricesS&P/CS*(rightaxis)
5. Inflationhasincreasedfrom1.1percentinApril(levelunheardofsinceNovember2010) to1.5percent inAugust.Thisupward trend isexplained inpartbyanincreaseinthelevelofgasprices.However,coreinflation–whichexcludesfoodandfuelprices–hasremainedstable(1.8percent).
6. Inthiscontextofrecoverywithcontrolledinflationpressuresandadownwardtrend inunemployment, theFedhasreaffirmedtheannouncement itmade inMayregardingthewithdrawalofitsassetpurchaseprogram,soitisexpectedtoreducetheamountofpurchasestowardstheendoftheyearandtowithdrawmonetarystimuluscompletelybymid-2014.
Source:Bloomberg.
Graph 5uSA: CPI
(12month%change)
Aug.08 Aug.09 Aug.10 Aug.11 Aug.12 Aug.13
6.05.04.03.02.01.00.0-1.0-2.0-3.0
Total 1.8
1.5Core

16
CENTRAL RESERVE BANK OF PERU
7. TheU.S.economyisestimatedtogrow1.6percentin2013,2.5percentin2014,and3.0percentin2015.Therisksofthisforecastcontinuetoberelatedtothefiscalissue.TheTreasuryhasreportedthatthedebtlimitwouldbereachedinmid-October,sothere is theriskthattheGovernmentwillgo intoatechnicaldefaultifanincreaseinthelimitisnotnegotiated.Ifnoagreementisreachedin this regard,consumerconfidencemaybecompromisedasoccurred in the2011episode,whenStandard&Poor’sloweredthecreditratingoftheU.S.long-termdebtduetothelackofastablefiscalconsolidationprogram.
Theotherriskistheoneassociatedwiththewithdrawalofmonetarystimulus,especiallybecauseoftheimpactitwouldhaveonlong-termratesand,throughthis variable, on the recoveryof thehousingmarket and the consumptionofdurablegoodssuchasautomobiles.Theinterestrateson30-yearmortgageloanshaveincreasedinrecentmonths,risingby128bpsto5.15percentinmid-JulyfromtheminimumlevelsobservedatthebeginningofMay,whichhasreflectedinadecline inapplications formortgage loansand in salesofnewhomes inJuly.
8. EconomicactivityintheEurozone hasstabilizedinQ2andshowssignsofsomerecoveryinrecentmonths.Germanycontinuestoleadtheregion’sgrowthandtheprospectsfortheperipheraleconomieshaveimproved.Inlinewiththis,theprobabilityofacrisisintheseeconomieshasdeclinedsincethepublicationofourlastInflationReport.
Graph 6EuROzONE: GDP LEVEL
(Q1.08=100)
104
102
100
98
96
94
92
90
104
102
100
98
96
94
92
90Q1.08 Q1.09 Q1.10 Q1.11 Q1.12 Q1.13
Eurozone Germany France Italy Spain
Source:Bloomberg.
Aftersevenconsecutivequartersofdecline,theEurozone’sGDPgrew1.2percentin annualized terms in Q2-2013.Moreover, all the components of spendingregistered a positive evolution. Private consumption and private investmentwere supported by the stabilization of employment, better credit conditions,and increased confidence, particularly in the major economies. Governmentspendingalsohadapositiveimpactandtheincreaseinnetexportswasdecisiveinimprovingtheeconomiesoftheregion’speripheralcountries.
17
Inf la t ion Report . September 2013
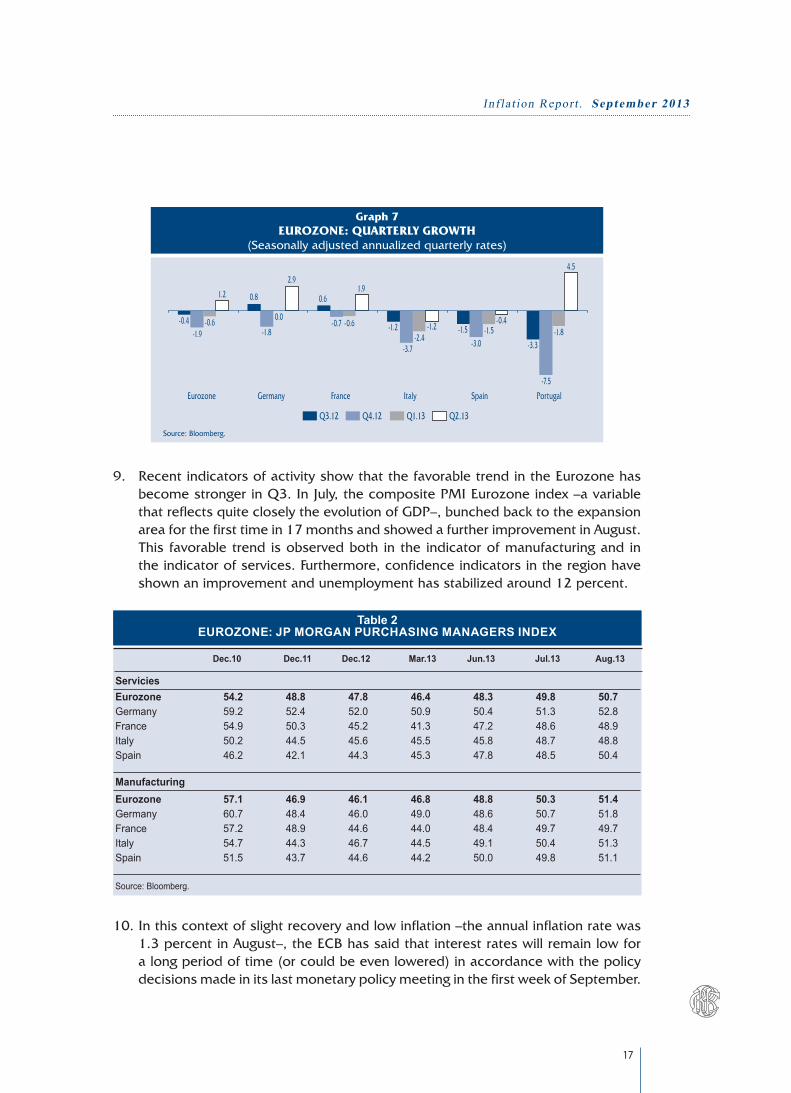
9. RecentindicatorsofactivityshowthatthefavorabletrendintheEurozonehasbecomestrongerinQ3.InJuly,thecompositePMIEurozoneindex–avariablethatreflectsquitecloselytheevolutionofGDP–,bunchedbacktotheexpansionareaforthefirsttimein17monthsandshowedafurtherimprovementinAugust.This favorabletrend isobservedboth inthe indicatorofmanufacturingand intheindicatorofservices.Furthermore,confidenceindicatorsintheregionhaveshownanimprovementandunemploymenthasstabilizedaround12percent.
Graph 7EuROzONE: QuARTERLy GROwTh
(Seasonallyadjustedannualizedquarterlyrates)
-0.4-1.9
-0.6
1.2 0.8
-1.8
0.0
2.9
0.6
-0.7 -0.6
1.9
-1.2
-3.7-2.4
-1.2 -1.5-3.0
-1.5-0.4
-3.3
-7.5
-1.8
4.5
Eurozone Germany France Italy Spain Portugal
Q3.12 Q4.12 Q1.13 Q2.13
Source:Bloomberg.
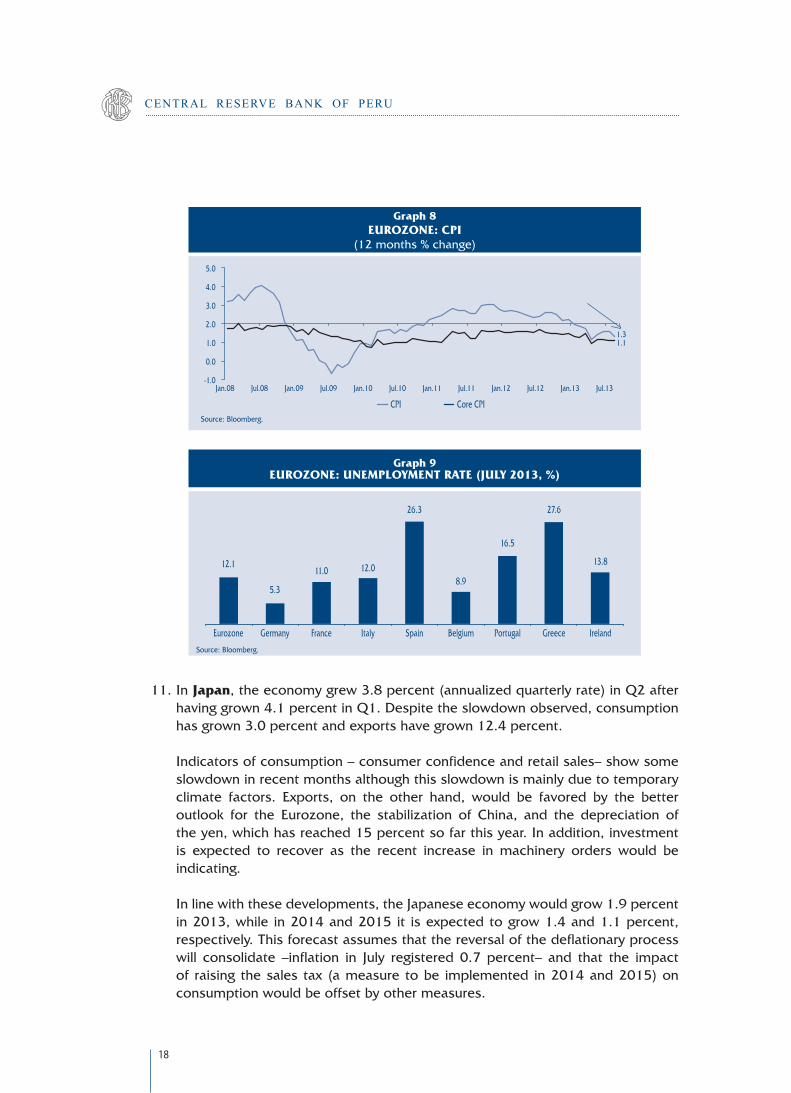
10.Inthiscontextofslightrecoveryandlowinflation–theannualinflationratewas1.3percentinAugust–,theECBhassaidthatinterestrateswillremainlowforalongperiodoftime(orcouldbeevenlowered)inaccordancewiththepolicydecisionsmadeinitslastmonetarypolicymeetinginthefirstweekofSeptember.
Table 2EUROZONE: JP MORGAN PURCHASING MANAGERS INDEX
Dec.10 Dec.11 Dec.12 Mar.13 Jun.13 Jul.13 Aug.13
ServiciesEurozone 54.2 48.8 47.8 46.4 48.3 49.8 50.7Germany 59.2 52.4 52.0 50.9 50.4 51.3 52.8France 54.9 50.3 45.2 41.3 47.2 48.6 48.9Italy 50.2 44.5 45.6 45.5 45.8 48.7 48.8Spain 46.2 42.1 44.3 45.3 47.8 48.5 50.4 ManufacturingEurozone 57.1 46.9 46.1 46.8 48.8 50.3 51.4Germany 60.7 48.4 46.0 49.0 48.6 50.7 51.8France 57.2 48.9 44.6 44.0 48.4 49.7 49.7Italy 54.7 44.3 46.7 44.5 49.1 50.4 51.3Spain 51.5 43.7 44.6 44.2 50.0 49.8 51.1
Source: Bloomberg.
18
CENTRAL RESERVE BANK OF PERU
11.Injapan,theeconomygrew3.8percent(annualizedquarterlyrate)inQ2afterhavinggrown4.1percentinQ1.Despitetheslowdownobserved,consumptionhasgrown3.0percentandexportshavegrown12.4percent.
Indicatorsofconsumption–consumerconfidenceandretailsales–showsomeslowdowninrecentmonthsalthoughthisslowdownismainlyduetotemporaryclimate factors. Exports, on the other hand, would be favored by the betteroutlook for the Eurozone, the stabilization of China, and the depreciation oftheyen,whichhasreached15percentsofarthisyear.Inaddition,investmentis expected to recover as the recent increase inmachinery orders would beindicating.
Inlinewiththesedevelopments,theJapaneseeconomywouldgrow1.9percentin2013,while in2014and2015 it isexpectedtogrow1.4and1.1percent,respectively.Thisforecastassumesthatthereversalofthedeflationaryprocesswill consolidate –inflation in July registered 0.7 percent– and that the impactof raising thesales tax (ameasuretobe implemented in2014and2015)onconsumptionwouldbeoffsetbyothermeasures.
Source:Bloomberg.
Graph 8EuROzONE: CPI
(12months%change)
5.0
4.0
3.0
2.0
1.0
0.0
-1.0Jan.08 Jan.09 Jan.10
1.31.1
Jan.11 Jan.12 Jan.13Jul.08 Jul.09 Jul.10 Jul.11 Jul.12 Jul.13
CPI CoreCPI
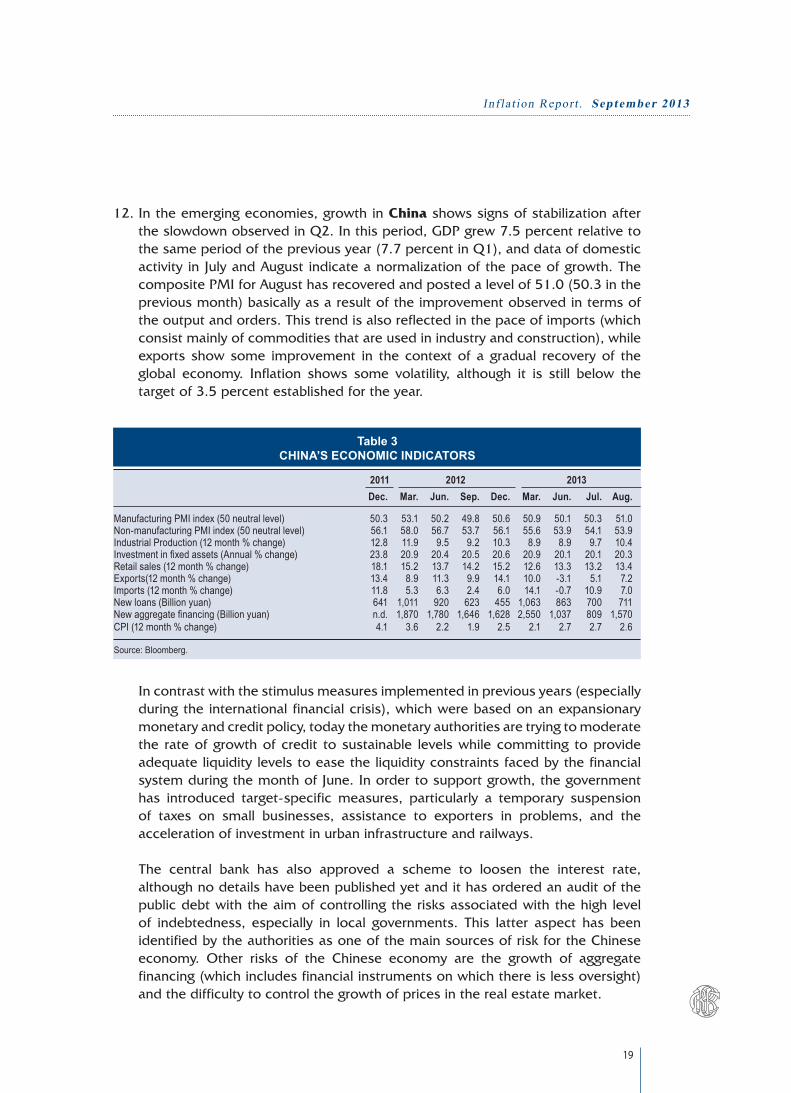
Graph 9EuROzONE: uNEMPLOyMENT RATE (juLy 2013, %)
Eurozone
12.1
Germany
5.3
France
11.0
Italy
12.0
Spain
26.3
Belgium
8.9
Portugal
16.5
Greece
27.6
Ireland
13.8
Source:Bloomberg.
19
Inf la t ion Report . September 2013
12.Intheemergingeconomies,growthinChinashowssignsofstabilizationaftertheslowdownobservedinQ2.Inthisperiod,GDPgrew7.5percentrelativetothesameperiodofthepreviousyear(7.7percentinQ1),anddataofdomesticactivityinJulyandAugustindicateanormalizationofthepaceofgrowth.ThecompositePMIforAugusthasrecoveredandpostedalevelof51.0(50.3inthepreviousmonth)basicallyasaresultoftheimprovementobservedintermsoftheoutputandorders.Thistrendisalsoreflectedinthepaceofimports(whichconsistmainlyofcommoditiesthatareusedinindustryandconstruction),whileexports showsome improvement in the contextof a gradual recoveryof theglobal economy. Inflation shows some volatility, although it is still below thetargetof3.5percentestablishedfortheyear.
Incontrastwiththestimulusmeasuresimplementedinpreviousyears(especiallyduringtheinternationalfinancialcrisis),whichwerebasedonanexpansionarymonetaryandcreditpolicy,todaythemonetaryauthoritiesaretryingtomoderatethe rateofgrowthofcredit tosustainable levelswhilecommitting toprovideadequateliquiditylevelstoeasetheliquidityconstraintsfacedbythefinancialsystemduringthemonthofJune.Inordertosupportgrowth,thegovernmenthas introduced target-specificmeasures, particularly a temporary suspensionof taxes on small businesses, assistance to exporters in problems, and theaccelerationofinvestmentinurbaninfrastructureandrailways.
The central bank has also approved a scheme to loosen the interest rate,althoughnodetailshavebeenpublishedyetandithasorderedanauditofthepublicdebtwiththeaimofcontrollingtherisksassociatedwiththehigh levelof indebtedness, especially in local governments. This latter aspect has beenidentifiedbytheauthoritiesasoneofthemainsourcesofriskfortheChineseeconomy. Other risks of the Chinese economy are the growth of aggregatefinancing(whichincludesfinancialinstrumentsonwhichthereislessoversight)andthedifficultytocontrolthegrowthofpricesintherealestatemarket.
Table 3CHINA’S ECONOMIC INDICATORS
2011 2012 2013 Dec. Mar. Jun. Sep. Dec. Mar. Jun. Jul. Aug.
Manufacturing PMI index (50 neutral level) 50.3 53.1 50.2 49.8 50.6 50.9 50.1 50.3 51.0Non-manufacturing PMI index (50 neutral level) 56.1 58.0 56.7 53.7 56.1 55.6 53.9 54.1 53.9Industrial Production (12 month % change) 12.8 11.9 9.5 9.2 10.3 8.9 8.9 9.7 10.4Investmentinfixedassets(Annual%change) 23.8 20.9 20.4 20.5 20.6 20.9 20.1 20.1 20.3Retail sales (12 month % change) 18.1 15.2 13.7 14.2 15.2 12.6 13.3 13.2 13.4Exports(12 month % change) 13.4 8.9 11.3 9.9 14.1 10.0 -3.1 5.1 7.2Imports (12 month % change) 11.8 5.3 6.3 2.4 6.0 14.1 -0.7 10.9 7.0New loans (Billion yuan) 641 1,011 920 623 455 1,063 863 700 711Newaggregatefinancing(Billionyuan) n.d. 1,870 1,780 1,646 1,628 2,550 1,037 809 1,570CPI (12 month % change) 4.1 3.6 2.2 1.9 2.5 2.1 2.7 2.7 2.6
Source: Bloomberg.

20
CENTRAL RESERVE BANK OF PERU
Inthiscontext,Chinaisexpectedtogrow7.5percentin2013(inlinewiththeexpectationsoftheauthorities),7.6percentin2014,and8.0percentin2015.
Source:Bloomberg.
Graph 10ChINA: REAL STATE MARKET
(Index,newresidencialconstructions)
122120118116114112110108106104102100
Jan.11 Jan.12 Jan.13Jul.11 Jul.12 Jul.13
GUANGZHOU BEIJING SHANGAI
13.India showedamarkedslowdowninthelevelofeconomicactivityinQ2.Inthisperiod,GDPgrew4.4percentcomparedtothesameperiodofthepreviousyear,thelowestrateregisteredinseveralyears,andeconomicactivityisexpectedtocontinuebeingaffectedbythedeteriorationofinternationalfinancialconditions.InAugusttheHSBC/MarkitcompositePMIdroppedbelowthethresholdof50percentforthefirsttimesinceMarch2009.
India’s economy in recent months has been characterized by a markeddeterioration of the rupee. Despite themeasures taken by the central bank,theexchangeratehasdroppedaround22percentbetweenlateAprilandlateAugust.Therupeehasbeenparticularlyaffectedbytheeconomy’svulnerabilities(problems in implementing structural reforms, the current account deficit,taxation,andinflationarypressures),whichhasdamagedconsumersandinvestorsconfidenceandhasledtocapitaloutflows.Thesharpdepreciationoftherupeehasalsocontributedtomaintaininflationpressuresthroughthehighercostsofimports.
Source:Bloomberg.
Graph 11INDIA: EXChANGE RATE
70686664626058565452
Rupe
e / u
S do
llar
Jan.13 Mar.13 May.13 Jul.13Feb.13 Apr.13 Jun.13 Aug.13 Sep.13

21
Inf la t ion Report . September 2013
Inthiscontext,theIndianeconomyisexpectedtogrow5.0percentin2013,6.0percentin2014,and6.5percentin2015.TheseratesarelowerthantheonesconsideredinourpreviousInflationReport.
14.InQ2,mostLatin American countries continued to show a slower pace ofgrowth.Thistrend,whichbeganat theendof2012, isexplainedmainlybyamoderation in the growth of domestic demand and, to a lesser extent, by adecreaseofexternalstimulus.
Recent indicatorsconfirmthis trend inacontextofdeteriorating internationalfinancial conditions and prospects of slower growth in China. The region isexpectedtoregisteragrowthof2.6percentthisyear,alowerratethantheonerecordedlastyear(3.0percent),andtoregisteragrowthrateof3.4percentnextyear.
Graph 12LATIN AMERICA: QuARTERLy GROwTh
(Seasonallyadjustedannualizedquarterlyrates)
Chile Colombia Brazil Mexico Peru
Q2.13Q3.12 Q4.12
8.0
6.0
4.0
2.0
0.0
-2.0
-4.0
Q1.13
Source:Centralbanksandstatisticalinstitutes.
Graph 13LATIN AMERICA: GDP GROwTh FORECAST
Source:ConsensusEconomicsandBCRP(Peru).
1.41.0
3.42.0
3.43.9 3.7 4.1 3.84.5 4.2 4.2
5.2 4.85.56.2
11.3
4.2
Venezuela Argentina Ecuador Uruguay Colombia Chile Bolivia Peru Paraguay
2013 2014
2.4 2.6
Brazil
1.6
3.6
Mexico
22
CENTRAL RESERVE BANK OF PERU
Inflation hashadadifferentevolutionineachcountryoverthepasttwomonths.InBrazilandMexico,inflationdeclinedandreturnedtothetargetrange(4.5-6.5percentinBraziland2.0-4.0percentinMexico)aftershowinglevelsabovetheupperbandofthetargetduringthelastfourmonths.Incontrast,ontheotherhand,theannualratesofinflationinChileandColombiaincreasedandshowedlevelsslightlyabovethe lowerbandofthetargetrange(between2.0and4.0percentinbothcountries).
Graph 14LATIN AMERICA: INFLATION FORECAST
Source:ConsensusEconomicsandBCRP(Peru).
31.3
43.9
10.7 11.37.7 7.2 5.8 5.7
3.6 3.9 3.0 4.1 2.9 2.1 2.7 3.1 2.4 2.9
Venezuela Argentina Uruguay Brazil Mexico Ecuador Peru Colombia Chile
2013 2014
4.0 4.7
Paraguay
5.3 4.8
Bolivia
Financial markets
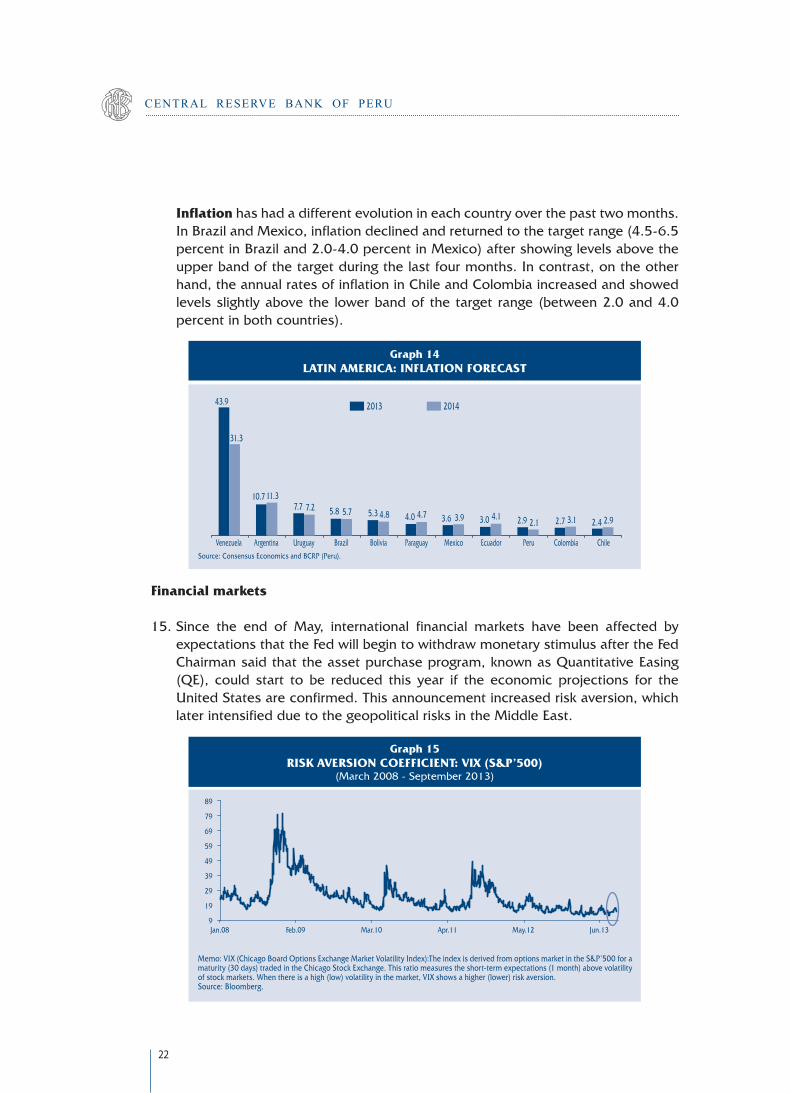
15.Since the end of May, international financial markets have been affected byexpectationsthattheFedwillbegintowithdrawmonetarystimulusaftertheFedChairmansaidthattheassetpurchaseprogram,knownasQuantitativeEasing(QE), could start to be reduced this year if the economicprojections for theUnitedStatesareconfirmed.Thisannouncementincreasedriskaversion,whichlaterintensifiedduetothegeopoliticalrisksintheMiddleEast.
Jan.08 Mar.10 May.12Feb.09 Apr.11 Jun.13
89
79
69
59
49
39
29
19
9
Graph 15RISK AVERSION COEFFICIENT: VIX (S&P’500)
(March2008-September2013)
Memo:VIX(ChicagoBoardOptionsExchangeMarketVolatilityIndex):TheindexisderivedfromoptionsmarketintheS&P’500foramaturity(30days)tradedintheChicagoStockExchange.Thisratiomeasurestheshort-termexpectations(1month)abovevolatilityofstockmarkets.Whenthereisahigh(low)volatilityinthemarket,VIXshowsahigher(lower)riskaversion.Source:Bloomberg.
23
Inf la t ion Report . September 2013
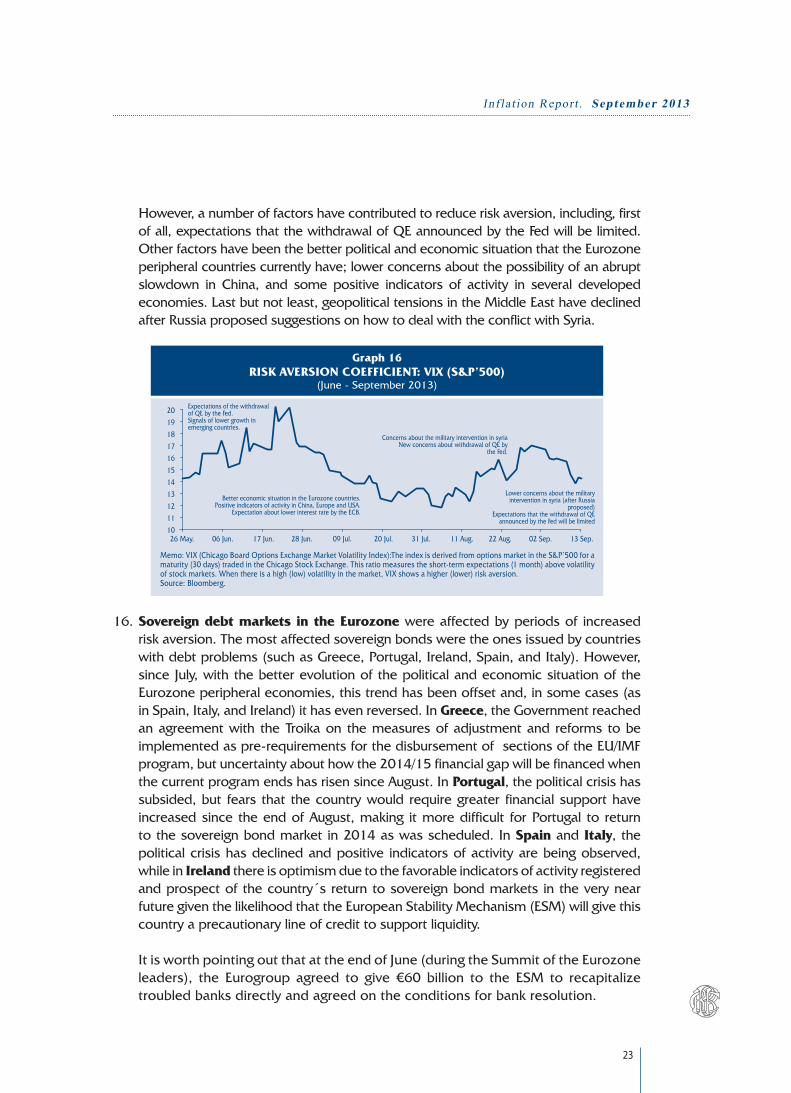
However,anumberoffactorshavecontributedtoreduceriskaversion,including,firstofall,expectationsthatthewithdrawalofQEannouncedbytheFedwillbelimited.OtherfactorshavebeenthebetterpoliticalandeconomicsituationthattheEurozoneperipheralcountriescurrentlyhave;lowerconcernsaboutthepossibilityofanabruptslowdown in China, and somepositive indicators of activity in several developedeconomies.Lastbutnotleast,geopoliticaltensionsintheMiddleEasthavedeclinedafterRussiaproposedsuggestionsonhowtodealwiththeconflictwithSyria.
16.Sovereign debt markets in the Eurozonewereaffectedbyperiodsof increasedriskaversion.Themostaffectedsovereignbondsweretheonesissuedbycountrieswithdebtproblems(suchasGreece,Portugal,Ireland,Spain,andItaly).However,sinceJuly,withthebetterevolutionofthepoliticalandeconomicsituationoftheEurozoneperipheraleconomies,thistrendhasbeenoffsetand,insomecases(asinSpain,Italy,andIreland)ithasevenreversed.InGreece,theGovernmentreachedanagreementwiththeTroikaonthemeasuresofadjustmentandreformstobeimplementedaspre-requirementsforthedisbursementofsectionsoftheEU/IMFprogram,butuncertaintyabouthowthe2014/15financialgapwillbefinancedwhenthecurrentprogramendshasrisensinceAugust.InPortugal,thepoliticalcrisishassubsided,but fearsthatthecountrywouldrequiregreater financialsupporthaveincreasedsincetheendofAugust,making itmoredifficult forPortugal toreturntothesovereignbondmarketin2014aswasscheduled.InSpainandItaly,thepoliticalcrisishasdeclinedandpositive indicatorsofactivityarebeingobserved,whileinIrelandthereisoptimismduetothefavorableindicatorsofactivityregisteredandprospectofthecountry´sreturntosovereignbondmarketsintheverynearfuturegiventhelikelihoodthattheEuropeanStabilityMechanism(ESM)willgivethiscountryaprecautionarylineofcredittosupportliquidity.
ItisworthpointingoutthatattheendofJune(duringtheSummitoftheEurozoneleaders), the Eurogroup agreed to give€60billion to the ESM to recapitalizetroubledbanksdirectlyandagreedontheconditionsforbankresolution.
26May. 17Jun. 11Aug.28Jun. 22Aug.09Jul. 02Sep.06Jun. 31Jul.
ExpectationsofthewithdrawalofQEbytheFed.Signalsoflowergrowthinemergingcountries.
ConcernsaboutthemilitaryinterventioninsyriaNewconcernsaboutwithdrawalofQEby
theFed.
BettereconomicsituationintheEurozonecountries.PositiveindicatorsofactivityinChina,EuropeandUSA.
ExpectationaboutlowerinterestratebytheECB.
Lowerconcernsaboutthemilitaryinterventioninsyria(afterRussia
proposed)ExpectationsthatthewithdrawalofQEannouncedbytheFedwillbelimited
20Jul. 13Sep.
2019181716151413121110
Graph 16RISK AVERSION COEFFICIENT: VIX (S&P’500)
(June-September2013)
Memo:VIX(ChicagoBoardOptionsExchangeMarketVolatilityIndex):TheindexisderivedfromoptionsmarketintheS&P’500foramaturity(30days)tradedintheChicagoStockExchange.Thisratiomeasurestheshort-termexpectations(1month)abovevolatilityofstockmarkets.Whenthereisahigh(low)volatilityinthemarket,VIXshowsahigher(lower)riskaversion.Source:Bloomberg.
24
CENTRAL RESERVE BANK OF PERU
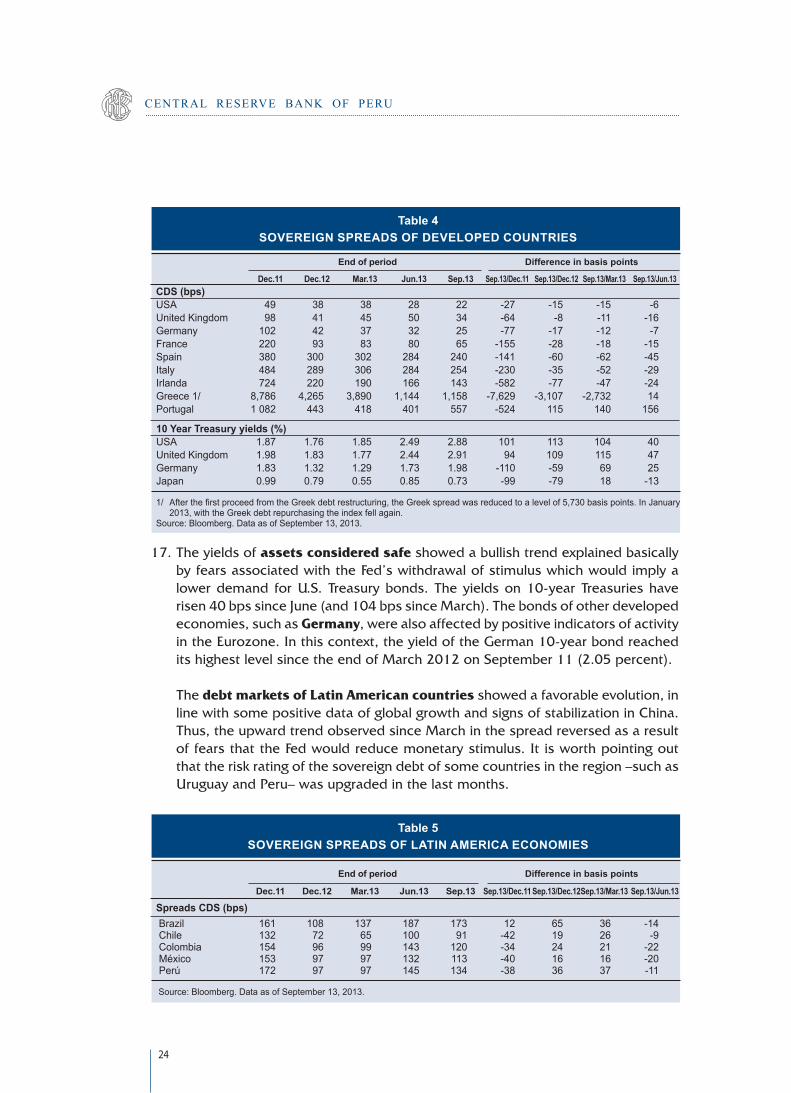
17.Theyieldsofassets considered safeshowedabullishtrendexplainedbasicallybyfearsassociatedwiththeFed’swithdrawalofstimuluswhichwouldimplyalowerdemand forU.S.Treasurybonds.Theyieldson10-yearTreasurieshaverisen40bpssinceJune(and104bpssinceMarch).Thebondsofotherdevelopedeconomies,suchasGermany,werealsoaffectedbypositiveindicatorsofactivityintheEurozone.Inthiscontext,theyieldoftheGerman10-yearbondreacheditshighestlevelsincetheendofMarch2012onSeptember11(2.05percent).
Thedebt markets of Latin American countriesshowedafavorableevolution,inlinewithsomepositivedataofglobalgrowthandsignsofstabilizationinChina.Thus,theupwardtrendobservedsinceMarchinthespreadreversedasaresultoffearsthattheFedwouldreducemonetarystimulus.Itisworthpointingoutthattheriskratingofthesovereigndebtofsomecountriesintheregion–suchasUruguayandPeru–wasupgradedinthelastmonths.
Table 4SOVEREIGN SPREADS OF DEVELOPED COUNTRIES
End of period Difference in basis points
Dec.11 Dec.12 Mar.13 Jun.13 Sep.13 Sep.13/Dec.11 Sep.13/Dec.12 Sep.13/Mar.13 Sep.13/Jun.13CDS (bps) USA 49 38 38 28 22 -27 -15 -15 -6United Kingdom 98 41 45 50 34 -64 -8 -11 -16Germany 102 42 37 32 25 -77 -17 -12 -7France 220 93 83 80 65 -155 -28 -18 -15Spain 380 300 302 284 240 -141 -60 -62 -45Italy 484 289 306 284 254 -230 -35 -52 -29Irlanda 724 220 190 166 143 -582 -77 -47 -24Greece 1/ 8,786 4,265 3,890 1,144 1,158 -7,629 -3,107 -2,732 14Portugal 1 082 443 418 401 557 -524 115 140 156
10 Year Treasury yields (%)USA 1.87 1.76 1.85 2.49 2.88 101 113 104 40United Kingdom 1.98 1.83 1.77 2.44 2.91 94 109 115 47Germany 1.83 1.32 1.29 1.73 1.98 -110 -59 69 25Japan 0.99 0.79 0.55 0.85 0.73 -99 -79 18 -13
1/ AfterthefirstproceedfromtheGreekdebtrestructuring,theGreekspreadwasreducedtoalevelof5,730basispoints.InJanuary2013, with the Greek debt repurchasing the index fell again.
Source: Bloomberg. Data as of September 13, 2013.
Table 5SOVEREIGN SPREADS OF LATIN AMERICA ECONOMIES
End of period Difference in basis points
Dec.11 Dec.12 Mar.13 Jun.13 Sep.13 Sep.13/Dec.11 Sep.13/Dec.12 Sep.13/Mar.13 Sep.13/Jun.13
Spreads CDS (bps) Brazil 161 108 137 187 173 12 65 36 -14 Chile 132 72 65 100 91 -42 19 26 -9 Colombia 154 96 99 143 120 -34 24 21 -22 México 153 97 97 132 113 -40 16 16 -20 Perú 172 97 97 145 134 -38 36 37 -11
Source: Bloomberg. Data as of September 13, 2013.

25
Inf la t ion Report . September 2013
Stock markets, particularly those of Asian emerging countries, were alsoaffectedbyepisodesofincreasedriskaversion.Thestockmarketsofdevelopedcountries,particularlytheEuropeanones,haveshownabetterevolutionthantheoneobservedintheperioddiscussedinourpreviousreport.
InLatinAmerica,withtheexceptionofChile,themainstockexchangesrecordedarecoverybetweenJuneandSeptember.Despitethis,allthestocksstillshowlossesfollowingthetrendobservedinmostemergingeconomiesgiventhattheywereaffectedbytheliquidationofthemoreriskyassetsaftertheFeddeclaredthatitcouldstartwithdrawingQEsoon.
Graph 17STOCK MARKETS
(Endofperíod;%chg.Sep.13respecttoJun.13)
-10% -5% -0% 5% 10% 15% 20%
GREECESPAINITALY
BRAZILCHINA
ROMANIAPOLAND
CZECHREP.EUROZONEHONGKONG
FRANCERUSSIA
COLOMBIAAUSTRALIANORWAYKOREA
GERMANYPORTUGALIRELAND
UNITEDKINGDOMPERUJAPAN
CANADANEWZEALAND
TAIWANUSA
ISRAELMEXICOINDIA
MALAYSIASINGAPOREHUNGARYTHAILANDUKRAINE
PHILIPPINESCHILETURKEY
INDONESIA
Source:Bloomberg.
Foreign exchange rate
18.AccordingtotheFedindex,thedollardepreciated0.5percentbetweenJuneandSeptember.As regards themajor European currencies, thedollar depreciated2.2percentagainsttheeuroand4.4percentagainstthepound.Inbothcases,thisdepreciationwasbasicallyassociatedwiththebetteroutlookforgrowthinEurope.Ontheotherhand,thedollarshowedaslightvariation(+0.2percent)againsttheyen.

26
CENTRAL RESERVE BANK OF PERU
Jan.08 Jan.09 Jan.10 Jan.11 Jan.12 Jan.13May.08 May.09 May.10 May.11 May.12 May.13Sep.08 Sep.09 Sep.10 Sep.11 Sep.12 Sep.13
120
115
110
105
100
95
90
Graph 18uS DOLLAR INDEX*
(January2008-September2013)
*AriseintheindexrepresentsanappreciationoftheUSdollar.Source:FED.
Table 6EXCHANGE RATE
Sep.13 % chg. compared to: Dec.11 Dec.12 Mar.13 Jun.13 Sep.13* Dec.11 Dec.12 Mar.13 Jun.13
Canada 1.02 0.99 1.02 1.05 1.04 1.5 4.3 1.7 -1.6Japan 76.94 86.74 94.19 99.12 99.34 29.1 14.5 5.5 0.2United Kingdom (US$/c.u.) 1.55 1.63 1.52 1.52 1.59 2.2 -2.3 4.4 4.4Eurozone (US$/c.u.) 1.30 1.32 1.28 1.30 1.33 2.6 0.7 3.7 2.2Switzerland (US$/c.u.) 0.94 0.92 0.95 0.94 0.93 -0.8 1.6 -2.0 -1.6Brazil 1.86 2.05 2.02 2.23 2.28 22.4 11.3 12.6 2.1Chile 519 478 471 507 506 -2.6 5.7 7.3 -0.3Colombia 1936 1766 1819 1920 1923 -0.7 8.9 5.7 0.1Mexico 13.95 12.86 12.31 12.94 13.04 -6.5 1.3 5.9 0.8Argentina 4.30 4.92 8.38 5.39 5.73 33.1 16.5 -31.7 6.3Peru 2.697 2.552 2.591 2.781 2.77 2.8 8.7 7.0 -0.3Hungary 243 220 237 227 226 -7.2 2.6 -4.6 -0.3Poland 3.44 3.08 3.26 3.32 3.16 -8.2 2.4 -3.1 -5.0Russia 32.19 30.55 31.07 32.83 32.46 0.8 6.2 4.5 -1.1Turkey 1.88 1.78 1.81 1.92 2.03 7.5 13.9 12.1 5.4China 6.29 6.23 6.21 6.14 6.12 -2.8 -1.8 -1.5 -0.3India 53.01 54.99 54.28 59.52 63.37 19.5 15.2 16.7 6.5Israel 3.81 3.73 3.64 3.64 3.55 -6.9 -4.8 -2.6 -2.4
FED basket 100.64 99.21 100.58 102.62 102.07 1.4 2.9 1.5 -0.5
* Data as of September 13, 2013. Source: Bloomberg and Reuters.
Inthelasttwomonths,thecurrencies in the regionhavedepreciatedagainstthedollar,inacontextofuncertaintyassociatedwithexpectationsabouttheonsetoftheFed’swithdrawalofstimulus.TheBrazilianreal,theArgentinepesoandtheMexicanpesostandoutamongthecurrenciesthatdepreciatedthemost.
InBrazil,sincetherealaccumulatedadepreciationof11.3percentcomparedtoend-2012,theCentralBankofBrazilannouncedthatitwouldstartanauctionprogramwhich includes sales of currency for a total of US$ 500million fromMonday toThursdayandswaps fora totalofUS$1billiononFridays,and that thisprogramwouldbecarriedoutatleastuntiltheendof2013.Thismeasureisaimedatprovidingliquiditytotheforeigncurrencymarketandatcontaininginflationarypressures.

27
Inf la t ion Report . September 2013
Ukraine
Southafrica
Turkey
IndiaIndonesia
Brazil
PeruChile
ColombiaMexico
Argentina
Thailand Philippines
RussiaMalaysia
China
Hungary
Current account deficit
Accumulated depreciation17
12
7
2
-3
-8
-9 -7 -5 -3 -1 1 3 5 7
Graph 19DEPRECIATION RATE MARCh/ SEPTEMBER AND CuRRENT ACCOuNT DEFICIT 2012
(%GDP)
Source:BloombergandWEOApril2013.
Thetrendregisteredincurrencymarketsreinforceswhatwashasbeenobservedin recent months. Most of the currencies of the emerging economies havedepreciatedagainstthedollarcomparedtoMarch,althoughthemagnitudeofthedepreciationdiffersfromcountrytocountry.Asthegraphbelowshows,thecurrencieswhichhavedepreciatedthemostinrecentmonthsarethecurrenciesofthoseeconomiesthathavehighcurrentaccountdeficits.Peruisconsideredaparticularcasesincevariousinvestmenthousesconsideritspositiontobeoneoftheleastvulnerablewithintheemergingeconomiesinviewofitfiscalpositionanditslevelofinternationalliquidity,which,intermsofthedebtheldbynon-residentsorthecountry’sshort-termobligationsinforeigncurrency,isoneofthehighestwithintheemergingeconomies.
Interest rate decisions
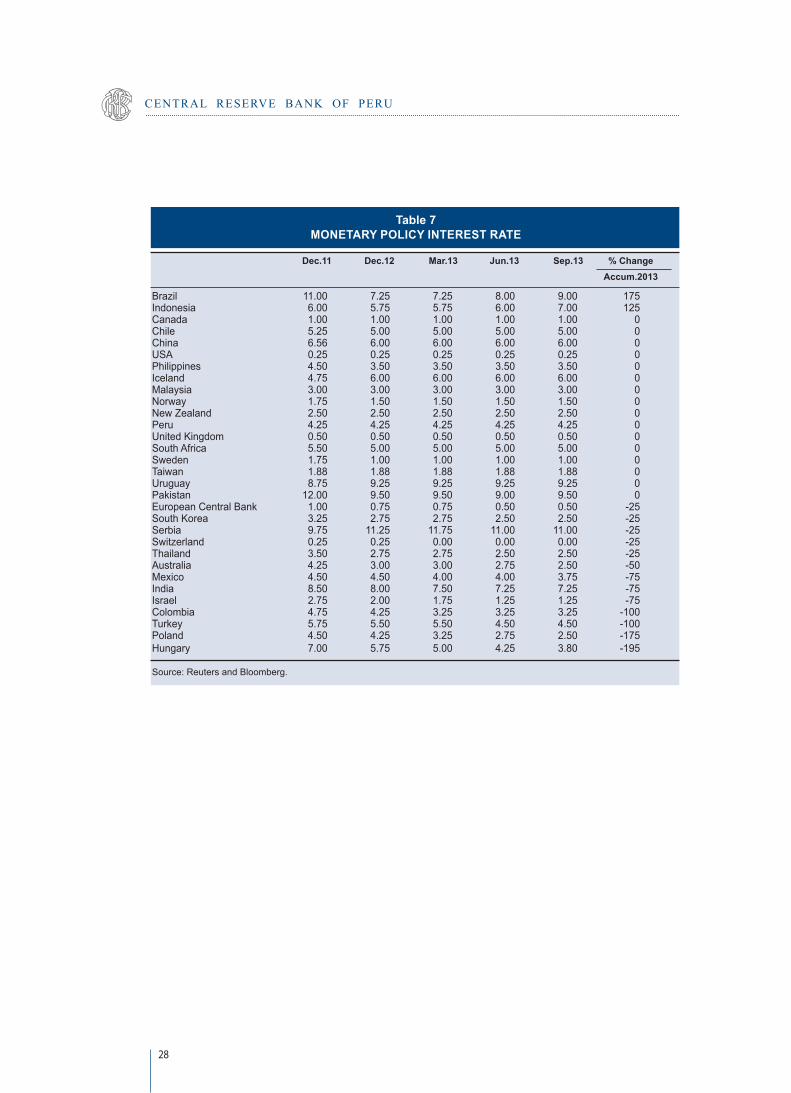
19.SinceJune,mostcentralbankshavemaintainedtheirinterestratesunchanged.Inthedevelopedeconomies,thedecisionofmaintainingtherates,inmanycases,atminimumlevels,hasbeensupportedbythemoderaterecoveryobservedineconomic activity and by contained inflationary pressures. In the USA, thesedevelopmentshaveincreasedtheprobabilitiesthattheFedwillstartwithdrawingnon-conventional monetary stimulus –the asset purchase program– in thefollowingmonthsofthisyear.
Intheemergingeconomies,theinterestrateshavebeenmaintainedunchangedinacontextofeconomicslowdownanddepreciatorypressuresassociatedwithexpectationsoftheFed’swithdrawalofQE.OnlyBrazil,Indonesia,andPakistanhaveraisedtheir interestratesgiventhecurrencypressuresandhigh inflationthey faced.On the other hand, Australia, Poland,Mexico, andHungary haveloweredtheirratesinresponsetoalowerdynamismineconomicactivityandlowerinflationarypressures.
28
CENTRAL RESERVE BANK OF PERU
Table 7MONETARY POLICY INTEREST RATE
Dec.11 Dec.12 Mar.13 Jun.13 Sep.13 % Change Accum.2013
Brazil 11.00 7.25 7.25 8.00 9.00 175Indonesia 6.00 5.75 5.75 6.00 7.00 125Canada 1.00 1.00 1.00 1.00 1.00 0Chile 5.25 5.00 5.00 5.00 5.00 0China 6.56 6.00 6.00 6.00 6.00 0USA 0.25 0.25 0.25 0.25 0.25 0Philippines 4.50 3.50 3.50 3.50 3.50 0Iceland 4.75 6.00 6.00 6.00 6.00 0Malaysia 3.00 3.00 3.00 3.00 3.00 0Norway 1.75 1.50 1.50 1.50 1.50 0New Zealand 2.50 2.50 2.50 2.50 2.50 0Peru 4.25 4.25 4.25 4.25 4.25 0United Kingdom 0.50 0.50 0.50 0.50 0.50 0South Africa 5.50 5.00 5.00 5.00 5.00 0Sweden 1.75 1.00 1.00 1.00 1.00 0Taiwan 1.88 1.88 1.88 1.88 1.88 0Uruguay 8.75 9.25 9.25 9.25 9.25 0Pakistan 12.00 9.50 9.50 9.00 9.50 0European Central Bank 1.00 0.75 0.75 0.50 0.50 -25South Korea 3.25 2.75 2.75 2.50 2.50 -25Serbia 9.75 11.25 11.75 11.00 11.00 -25Switzerland 0.25 0.25 0.00 0.00 0.00 -25Thailand 3.50 2.75 2.75 2.50 2.50 -25Australia 4.25 3.00 3.00 2.75 2.50 -50Mexico 4.50 4.50 4.00 4.00 3.75 -75India 8.50 8.00 7.50 7.25 7.25 -75Israel 2.75 2.00 1.75 1.25 1.25 -75Colombia 4.75 4.25 3.25 3.25 3.25 -100Turkey 5.75 5.50 5.50 4.50 4.50 -100Poland 4.50 4.25 3.25 2.75 2.50 -175Hungary 7.00 5.75 5.00 4.25 3.80 -195
Source: Reuters and Bloomberg.

29
Inf la t ion Report . September 2013
II. Economic Activity
20.In the first semesterof the year, theGDPgrew5.2percent showing a lowergrowth rate than the one registered in 2012. The composition of growth onthesideofexpenditurecontinuedtobebasedonthedynamismofdomesticdemand, with a rate of 7.2 percent, while net exports continued to declineand recorded a negative contribution to GDP growth equivalent to 2.4percentagepoints.
Graph 20GROSS DOMESTIC PRODuCT By ECONOMIC SECTORS:
S1.13(Real%change)
13.2
5.7
5.9
5.4
2.4
1.5
-0.9
-0.1
-2.2
Construction
Otherservices
Commerce
Electricityandwater
Agricultureandlivestock
Non-primarymanufacturing
Miningandhydrocarbons
Basedonrawmaterials
Fishing
GDP GrowthI Semester 2013: 5.2percent
21.TherateofGDPgrowthforecastfor2013hasbeenreviseddownto5.5percentfromthe rateof6.1percentconsidered inour June report.This lower rate isestimatedconsideringthelowerdynamismofexports(0.7percentversus1.6percentinthepreviousreport),whichtakesintoaccountthedataofindicatorsatJune2013andthedownwardrevisionoftheestimatedrateofglobalgrowth.Arecoveryofexportsisexpectedinthesecondhalfoftheyear–afterexportsdroppedby3.1percentinthefirstsemester–asaresultofincreasedexportsoftraditionalproducts,suchascopper,andnon-traditionalproducts,inlinewiththebetterevolutionexpectedintheworldeconomy.
22.TheexpectedGDPgrowthin2014isreviseddownwardsto6.2percent,inlinewithgrowthratesclosetotheeconomy’spotentialoutput.In2015,thecountry’sGDPwouldshowafasterpaceofgrowthandregisterarateof6.7percentdueto theonsetofoperationsofsome investmentprojects,mainly in theminingsector.
30
CENTRAL RESERVE BANK OF PERU
Forecast of expenditure components
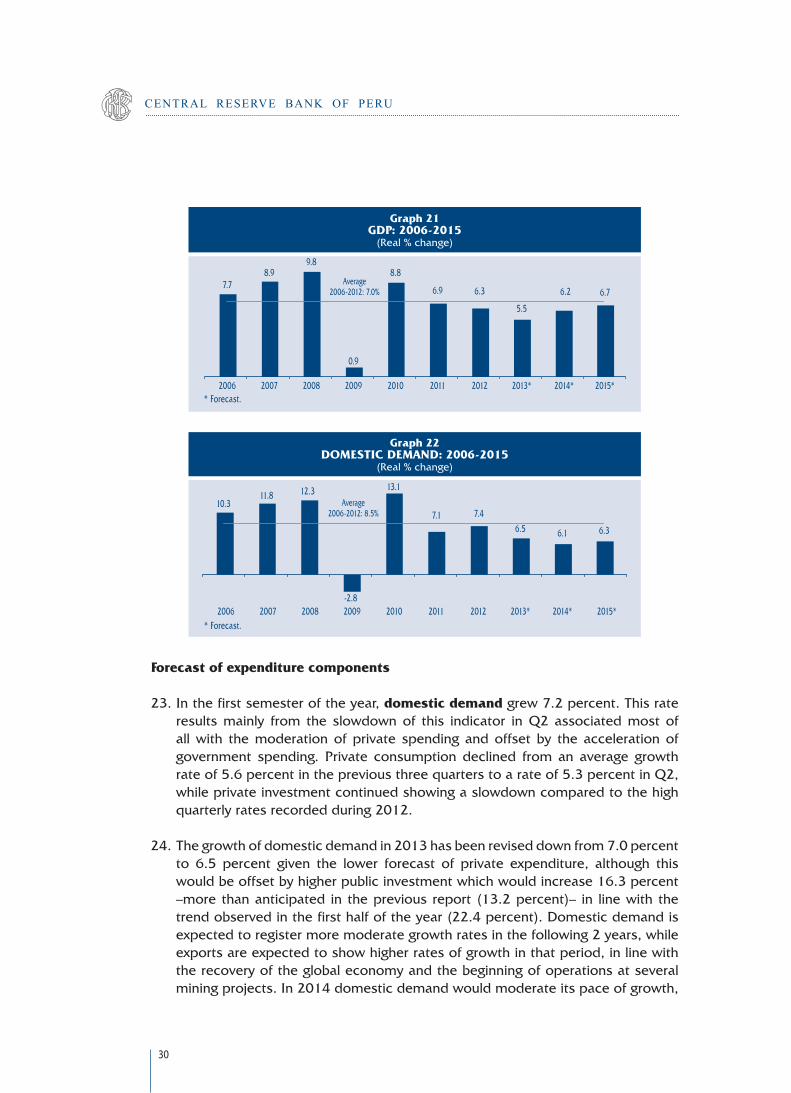
23.Inthefirstsemesteroftheyear,domestic demandgrew7.2percent.Thisrateresultsmainly from the slowdownof this indicator inQ2associatedmostofallwith themoderationofprivate spending andoffset by the accelerationofgovernment spending. Private consumption declined froman average growthrateof5.6percentinthepreviousthreequarterstoarateof5.3percentinQ2,whileprivateinvestmentcontinuedshowingaslowdowncomparedtothehighquarterlyratesrecordedduring2012.
24.Thegrowthofdomesticdemandin2013hasbeenreviseddownfrom7.0percentto 6.5 percent given the lower forecast of private expenditure, although thiswouldbeoffsetbyhigherpublicinvestmentwhichwouldincrease16.3percent–morethananticipated inthepreviousreport (13.2percent)– in linewiththetrendobservedinthefirsthalfoftheyear(22.4percent).Domesticdemandisexpectedtoregistermoremoderategrowthratesinthefollowing2years,whileexportsareexpectedtoshowhigherratesofgrowthinthatperiod,inlinewiththerecoveryoftheglobaleconomyandthebeginningofoperationsatseveralminingprojects.In2014domesticdemandwouldmoderateitspaceofgrowth,
Graph 21GDP: 2006-2015(Real%change)
*Forecast.2015*2006 2007 2008 2009 2010 2011 2012 2013* 2014*
6.77.7
8.99.8
0.9
8.8Average
2006-2012:7.0% 6.9 6.3
5.5
6.2
Graph 22DOMESTIC DEMAND: 2006-2015
(Real%change)
*Forecast.2015*2006 2007 2008 2009 2010 2011 2012 2013* 2014*
10.311.8 12.3
-2.8
13.1
Average2006-2012:8.5% 7.1 7.4
6.5 6.1 6.3

31
Inf la t ion Report . September 2013
bothintermsofitsprivateanditspubliccomponents,andwouldshowgrowthratessimilartotheGDPgrowthrates.
Table 9GDP AND DOMESTIC DEMAND
(Contributions to the real % change) 2012 2013* 2014* 2015* S1 Year S1 IR Jun.13 IR Sep.13 IR Jun.13 IR Sep.13 IR Jun.13 IR Sep.13
I. Domestic demand 6.5 7.7 7.5 7.4 6.8 7.0 6.4 6.9 6.7 a. Private expenditure 5.1 5.9 6.0 5.5 5.2 5.6 5.0 5.6 5.4 Of which: Consumption 4.0 3.9 3.6 3.7 3.5 3.6 3.5 3.6 3.5 Privatefixedinvestment 3.0 3.0 2.1 2.1 1.8 2.0 1.9 2.0 2.0 b. Public expenditure 1.4 1.9 1.5 1.9 1.6 1.4 1.4 1.4 1.4 Consumption 0.3 0.9 0.6 1.2 0.7 0.4 0.4 0.4 0.4 Investment 1.1 1.0 0.9 0.7 0.9 1.0 1.0 1.0 1.0 II. Net exports -0.2 -1.4 -2.4 -1.3 -1.3 -0.6 -0.3 -0.1 0.0 Exports 1.5 0.9 -0.5 0.3 0.1 1.4 1.6 2.0 2.0 Imports 1.7 2.3 1.8 1.6 1.5 2.1 1.8 2.1 2.0 GDP (I+II) 6.2 6.3 5.2 6.1 5.5 6.3 6.2 6.8 6.7
IR:InflationReport.* Forecast.
Table 8GDP AND DOMESTIC DEMAND
(Real % change) 2012 2013* 2014* 2015* S1 Year S1 IR Jun.13 IR Sep.13 IR Jun.13 IR Sep.13 IR Jun.13 IR Sep.13
I. Domestic demand 6.2 7.4 7.2 7.0 6.5 6.6 6.1 6.5 6.3 a. Private expenditure 5.5 6.5 6.5 6.1 5.8 6.2 5.5 6.2 6.0 Consumption 5.9 5.8 5.3 5.5 5.2 5.5 5.3 5.5 5.4 Privatefixedinvestment 13.5 13.5 8.7 8.8 7.7 8.2 7.7 7.9 7.9
b. Public expenditure 12.1 13.3 12.4 12.3 10.8 9.0 9.0 8.4 8.4 Consumption 3.6 9.4 7.4 11.8 7.6 4.0 4.0 4.2 4.2 Investment 34.1 20.8 22.4 13.2 16.3 17.0 17.0 14.6 14.6
II. Net exports -4.9 -34.6 -55.8 -25.0 -25.2 -10.0 -4.4 -1.3 -0.7 Exports 8.9 4.8 -3.1 1.6 0.7 8.5 9.3 11.7 11.4 Imports 8.1 10.4 8.4 7.0 6.3 8.9 7.9 8.9 8.6
GDP (I+II) 6.2 6.3 5.2 6.1 5.5 6.3 6.2 6.8 6.7
IR:InflationReport.* Forecast.
25.Maintaininganexpectedlowerdynamismthantheoneobservedduring2012,private consumptiongrew5.3percent in the firstsemesterof2013.Several
32
CENTRAL RESERVE BANK OF PERU
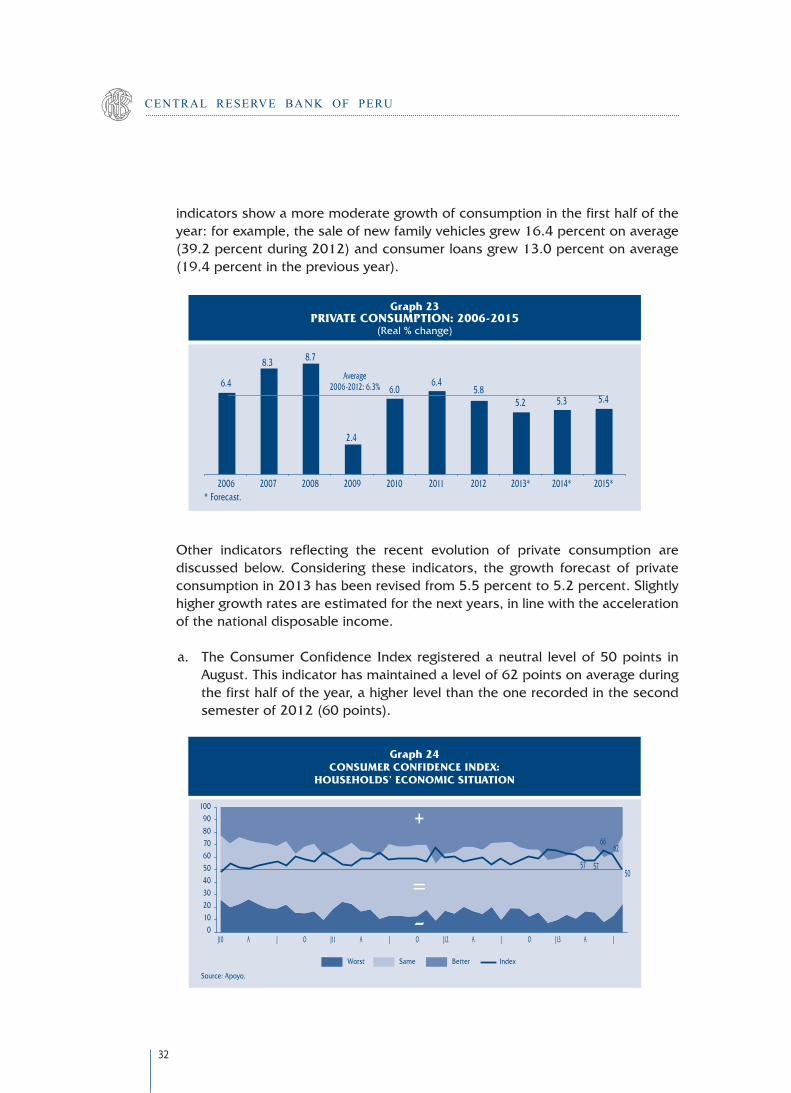
indicatorsshowamoremoderategrowthofconsumptioninthefirsthalfoftheyear:forexample,thesaleofnewfamilyvehiclesgrew16.4percentonaverage(39.2percentduring2012)andconsumerloansgrew13.0percentonaverage(19.4percentinthepreviousyear).
Graph 23PRIVATE CONSuMPTION: 2006-2015
(Real%change)
*Forecast.2015*2006 2007 2008 2009 2010 2011 2012 2013* 2014*
6.4
8.3 8.7
2.4
6.0Average
2006-2012:6.3% 6.45.8
5.3 5.45.2
Other indicators reflecting the recent evolution of private consumption arediscussedbelow.Considering these indicators, the growth forecastofprivateconsumptionin2013hasbeenrevisedfrom5.5percentto5.2percent.Slightlyhighergrowthratesareestimatedforthenextyears,inlinewiththeaccelerationofthenationaldisposableincome.
a. TheConsumerConfidence Index registeredaneutral levelof50points inAugust.Thisindicatorhasmaintainedalevelof62pointsonaverageduringthefirsthalfoftheyear,ahigherlevelthantheonerecordedinthesecondsemesterof2012(60points).
Graph 24CONSuMER CONFIDENCE INDEX:
hOuSEhOLDS’ ECONOMIC SITuATION
Source:Apoyo.
Worst Same Better Index
J10 J11 J12 J13A A A AJ J J JO O O
1009080706050403020100
57 57
6662
50

33
Inf la t ion Report . September 2013
b. The labor force employed grew 2.9 percent in the moving quarter ofJune-August2013,showingahighergrowth levelthan inthesameperiodof last year (1.6 percent) and a similar level to the one recorded in2010-2012.
Source:INEI.
J10 J11 J12 J13A A A AJ J J JO O O
109876543210
1.9 2.03.1
4.2
2.9 2.62.1
2.9
Graph 25LABOR FORCE EMPLOyED: 2010-2013(Quarterlymoving12month%change)
Average2010-2012:2.9
c. ThemainincomeinMetropolitanLimagrew5.2percent inthequarterofJune-August2013,registeringalowergrowthlevelthantheoneobservedinthesameperiodlastyear(8.2percent).
Source:INEI.
J10 J11 J12 J13A A A AJ J J JO O O
20
15
10
5
0
-5
-10
4.35.9 5.4
5.2
Graph 26MAIN INCOME IN METROPOLITAN LIMA: 2010 - 2013
(Quarterlymoving12month%change)
Average2009-2012:7.0
5.8
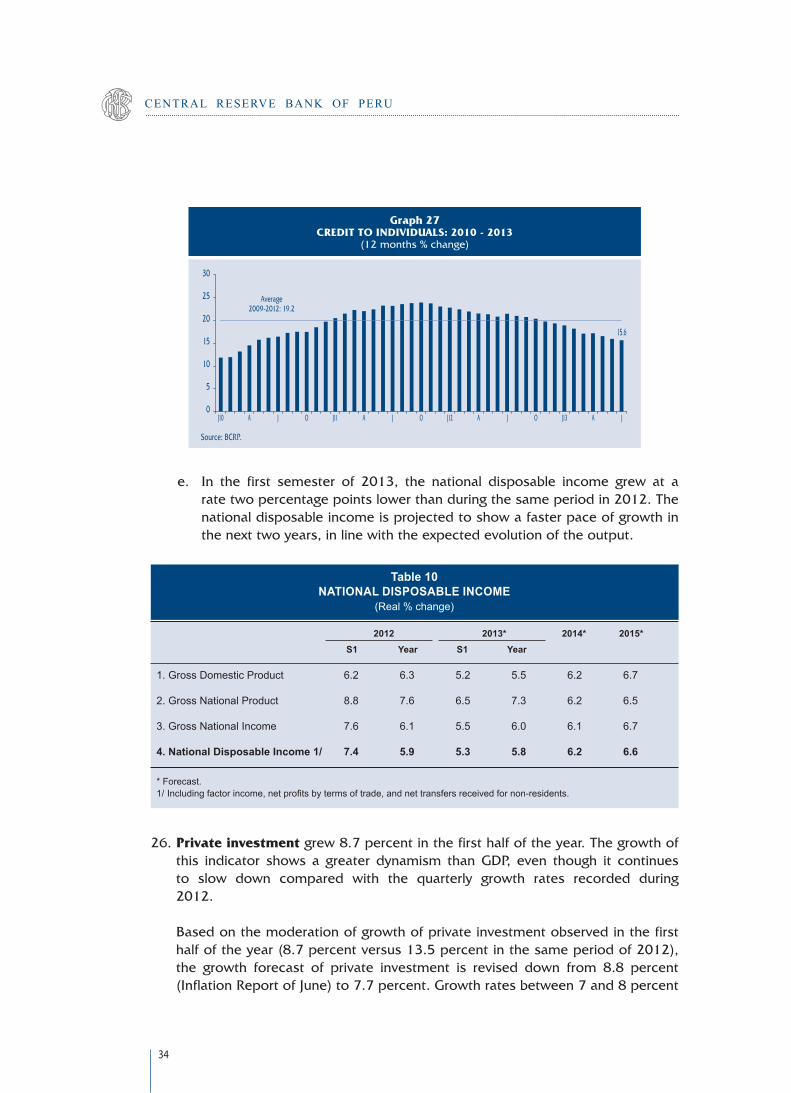
d. The growth of credit to individuals, which includes consumer loans andmortgages, has beenmoderating compared to the rates observedduring2012.Thisindicatorgrew15.6percentinJuly,lowerthantheaveragerateobservedinthesameperiodin2012(21.5percent).
34
CENTRAL RESERVE BANK OF PERU
e. In the first semester of 2013, the national disposable income grew at aratetwopercentagepointslowerthanduringthesameperiodin2012.Thenationaldisposableincomeisprojectedtoshowafasterpaceofgrowthinthenexttwoyears,inlinewiththeexpectedevolutionoftheoutput.
Graph 27CREDIT TO INDIVIDuALS: 2010 - 2013
(12months%change)
15.6
30
25
20
15
10
5
0
Average2009-2012:19.2
Source:BCRP.
J10 J11 J12 J13A A A AJ J J JO O O
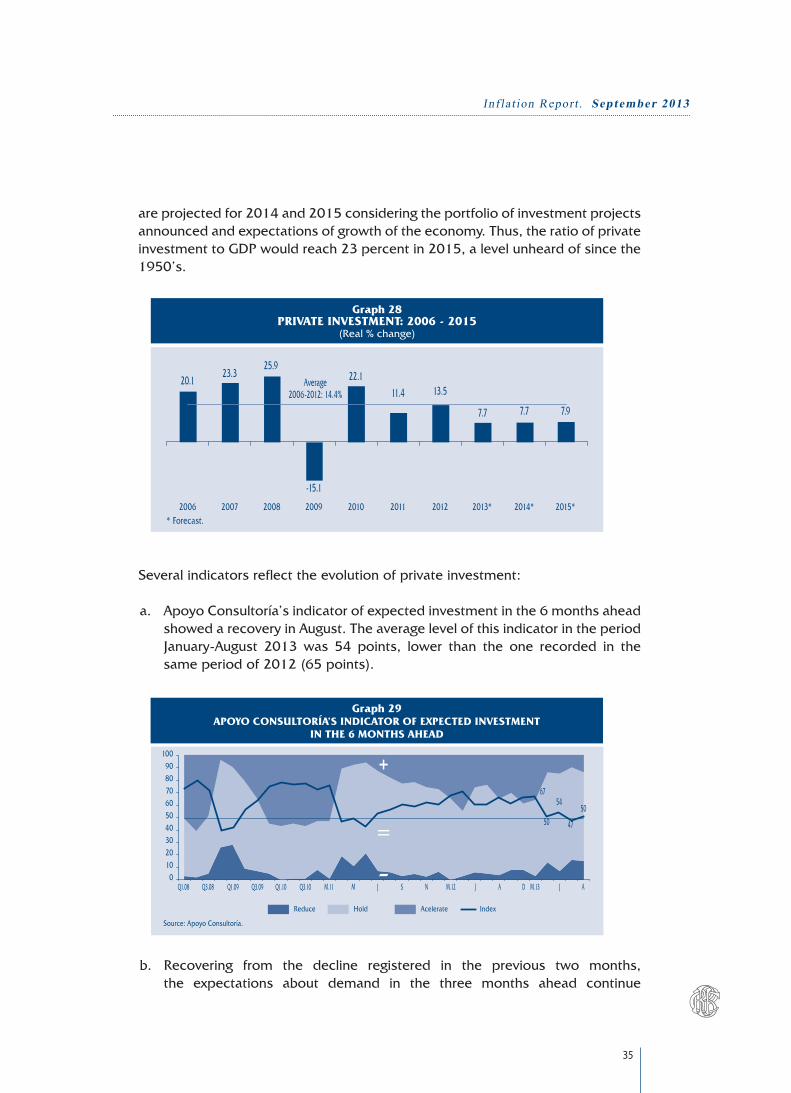
26.Private investmentgrew8.7percentinthefirsthalfoftheyear.Thegrowthofthis indicator shows a greater dynamism thanGDP, even though it continuesto slow down compared with the quarterly growth rates recorded during2012.
Basedonthemoderationofgrowthofprivateinvestmentobservedinthefirsthalfoftheyear(8.7percentversus13.5percentinthesameperiodof2012),the growth forecast of private investment is revised down from 8.8 percent(InflationReportofJune)to7.7percent.Growthratesbetween7and8percent
Table 10NATIONAL DISPOSABLE INCOME
(Real % change) 2012 2013* 2014* 2015* S1 Year S1 Year
1. Gross Domestic Product 6.2 6.3 5.2 5.5 6.2 6.7
2. Gross National Product 8.8 7.6 6.5 7.3 6.2 6.5 3. Gross National Income 7.6 6.1 5.5 6.0 6.1 6.7 4. National Disposable Income 1/ 7.4 5.9 5.3 5.8 6.2 6.6
* Forecast.1/Includingfactorincome,netprofitsbytermsoftrade,andnettransfersreceivedfornon-residents.
35
Inf la t ion Report . September 2013
areprojectedfor2014and2015consideringtheportfolioofinvestmentprojectsannouncedandexpectationsofgrowthoftheeconomy.Thus,theratioofprivateinvestmenttoGDPwouldreach23percentin2015,alevelunheardofsincethe1950’s.
Graph 28PRIVATE INVESTMENT: 2006 - 2015
(Real%change)
*Forecast.2006 2007 2008 2009 2010 2011 2012 2013* 2014* 2015*
20.123.3
25.9
-15.1
22.1Average2006-2012:14.4% 11.4 13.5
7.7 7.7 7.9
Severalindicatorsreflecttheevolutionofprivateinvestment:
a. ApoyoConsultoría’sindicatorofexpectedinvestmentinthe6monthsaheadshowedarecoveryinAugust.TheaveragelevelofthisindicatorintheperiodJanuary-August 2013was 54 points, lower than the one recorded in thesameperiodof2012(65points).
Graph 29APOyO CONSuLTORÍA’S INDICATOR OF EXPECTED INVESTMENT
IN ThE 6 MONThS AhEAD
Source:ApoyoConsultoría.
Reduce Hold Acelerate Index
Q1.08 Q1.09 Q1.10Q3.08 Q3.09 Q3.10 M.11 M.12M JJ AS DN M.13 J A
1009080706050403020100
67
50
54
47
50
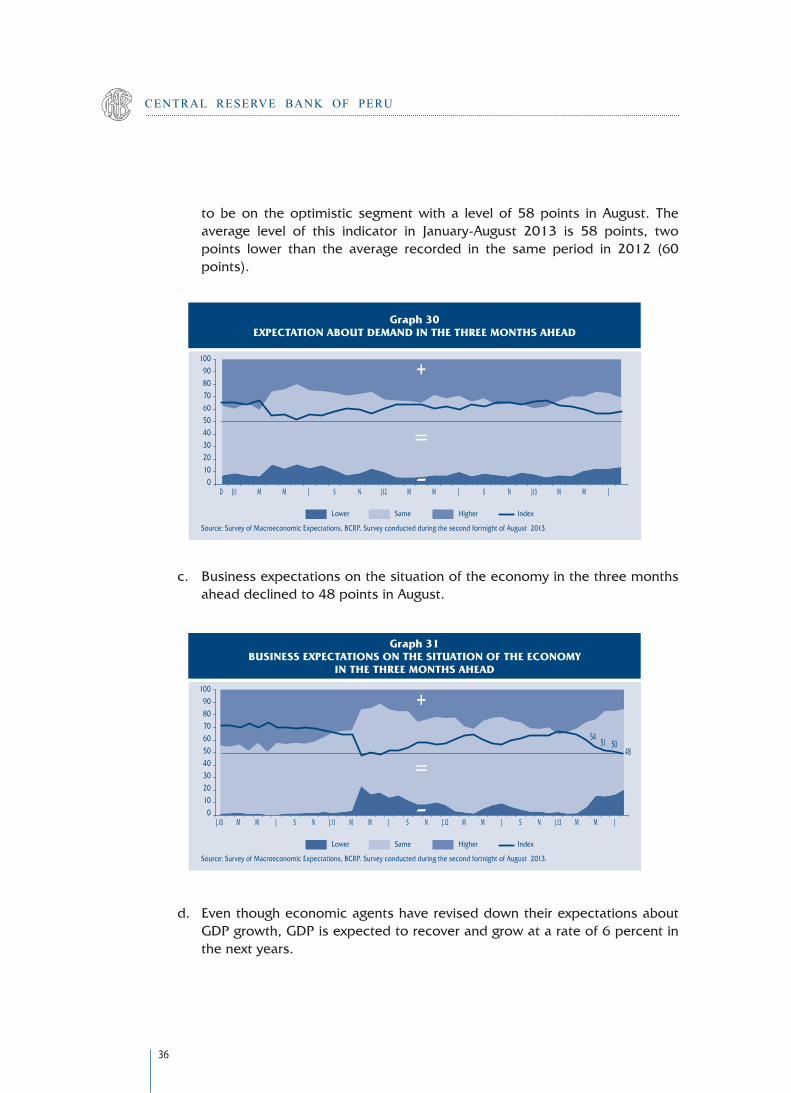
b. Recovering from the decline registered in the previous two months,the expectations about demand in the three months ahead continue
36
CENTRAL RESERVE BANK OF PERU
tobeon theoptimistic segmentwitha levelof58points inAugust. Theaverage level of this indicator in January-August 2013 is 58 points, twopoints lower than the average recorded in the same period in 2012 (60points).
Graph 30EXPECTATION ABOuT DEMAND IN ThE ThREE MONThS AhEAD
Source:SurveyofMacroeconomicExpectations,BCRP.SurveyconductedduringthesecondfortnightofAugust2013.
Lower Same Higher Index
D M M MS SJ11 J12 J13M M MJ J JN N
1009080706050403020100
c. Businessexpectationsonthesituationoftheeconomyinthethreemonthsaheaddeclinedto48pointsinAugust.
Graph 31BuSINESS EXPECTATIONS ON ThE SITuATION OF ThE ECONOMy
IN ThE ThREE MONThS AhEAD
Source:SurveyofMacroeconomicExpectations,BCRP.SurveyconductedduringthesecondfortnightofAugust2013.
Lower Same Higher Index
M M M MS S SJ.10 J.11 J.12 J.13M M M MJ J J JN N N
1009080706050403020100
5451 50
48
d. EventhougheconomicagentshavereviseddowntheirexpectationsaboutGDPgrowth,GDPisexpectedtorecoverandgrowatarateof6percentinthenextyears.

37
Inf la t ion Report . September 2013
e. Thevolumeof importsofcapitalgoods, indicatorof investmentdemand,showedarateof5.8percentintheperiodofJanuary-August,alowerratethantheoneregisteredinthesameperiodlastyear(6percent).
Graph 32VOLuME OF IMPORTS OF CAPITAL GOODS: 2009-2013
(12months%change)
-10
10
-30
30
-50
50
70
-13
145
-1
3 1
J10 J11 J12 J13M M M MM M M MJ J J JS S SN N N
Source:SUNAT.
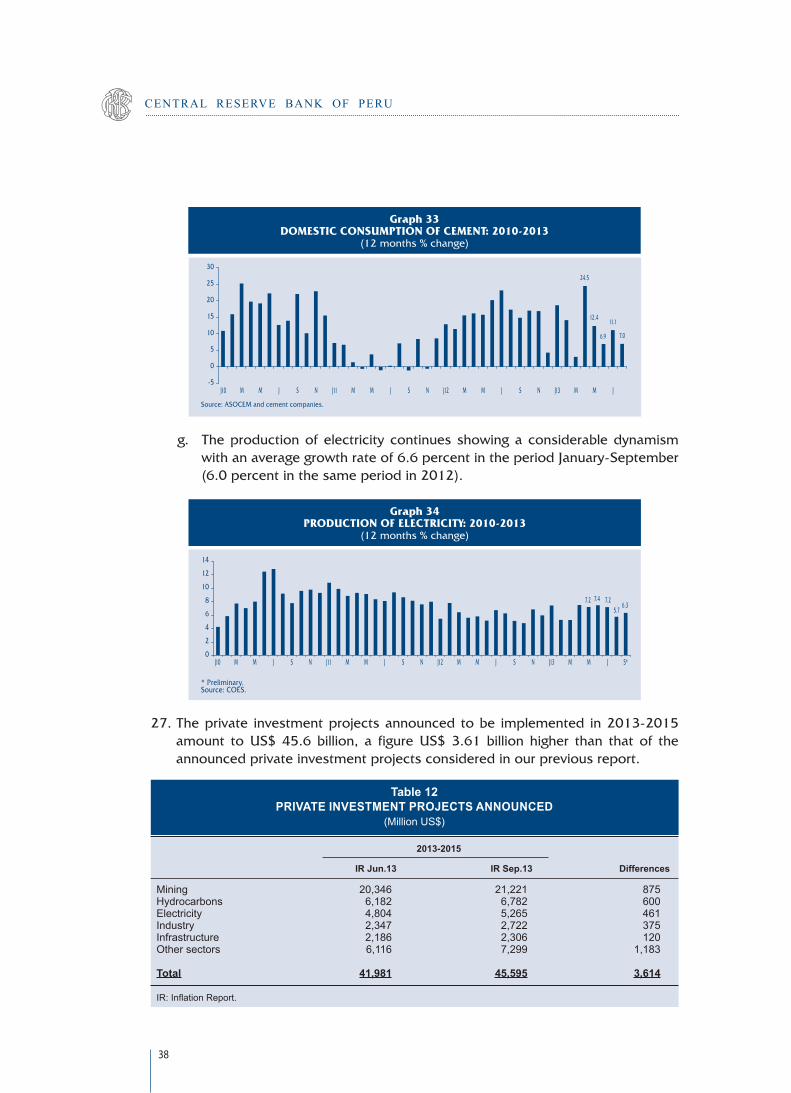
f. Thedomesticconsumptionofcementcontinuedgrowingattwo-digitratesintheJanuary-Augustperiod(12.2percent),althoughshowingalowerratethantheoneobservedinthesameperiodlastyear(16.6percent).
Table 11SURVEY ON MACROECONOMIC EXPECTATIONS : GDP GROWTH
(%) Expectations about:
IR Mar.13 IR Jun.13 IR Sep.13*
Financial entities 2013 6.3 6.0 5.5 2014 6.1 6.0 5.7 2015 -.- 6.0 5.9
Economic analysts 2013 6.3 6.0 5.5 2014 6.5 6.1 5.8 2015 -.- 6.0 6.0
Non-financial firms 2013 6.1 6.0 5.5 2014 6.0 6.0 5.6 2015 -.- 6.0 6.0
IR:InflationReport.* Survey conducted during the second fortnight of August 2013.
38
CENTRAL RESERVE BANK OF PERU
g. Theproductionofelectricity continues showingaconsiderabledynamismwithanaveragegrowthrateof6.6percentintheperiodJanuary-September(6.0percentinthesameperiodin2012).
Graph 33DOMESTIC CONSuMPTION OF CEMENT: 2010-2013
(12months%change)
24.5
12.4
6.9
11.1
7.0
30
25
20
15
10
5
0
-5
Source:ASOCEMandcementcompanies.
J10 J11 J12 J13M M M MM M M MJ J J JS S SN N N
Graph 34PRODuCTION OF ELECTRICITy: 2010-2013
(12months%change)
14
12
10
8
6
4
2
0
*Preliminary.Source:COES.
J10 J11 J12 J13M M M MM M M MJ J J J S*S S SN N N
7.25.7
6.37.47.2
27.Theprivate investmentprojectsannounced tobe implemented in2013-2015amount toUS$45.6billion, a figureUS$3.61billion higher than that of theannouncedprivateinvestmentprojectsconsideredinourpreviousreport.
Table 12
PRIVATE INVESTMENT PROJECTS ANNOUNCED(Million US$)
2013-2015
IR Jun.13 IR Sep.13 Differences
Mining 20,346 21,221 875Hydrocarbons 6,182 6,782 600Electricity 4,804 5,265 461Industry 2,347 2,722 375Infrastructure 2,186 2,306 120Other sectors 6,116 7,299 1,183 Total 41,981 45,595 3,614
IR:InflationReport.
39
Inf la t ion Report . September 2013
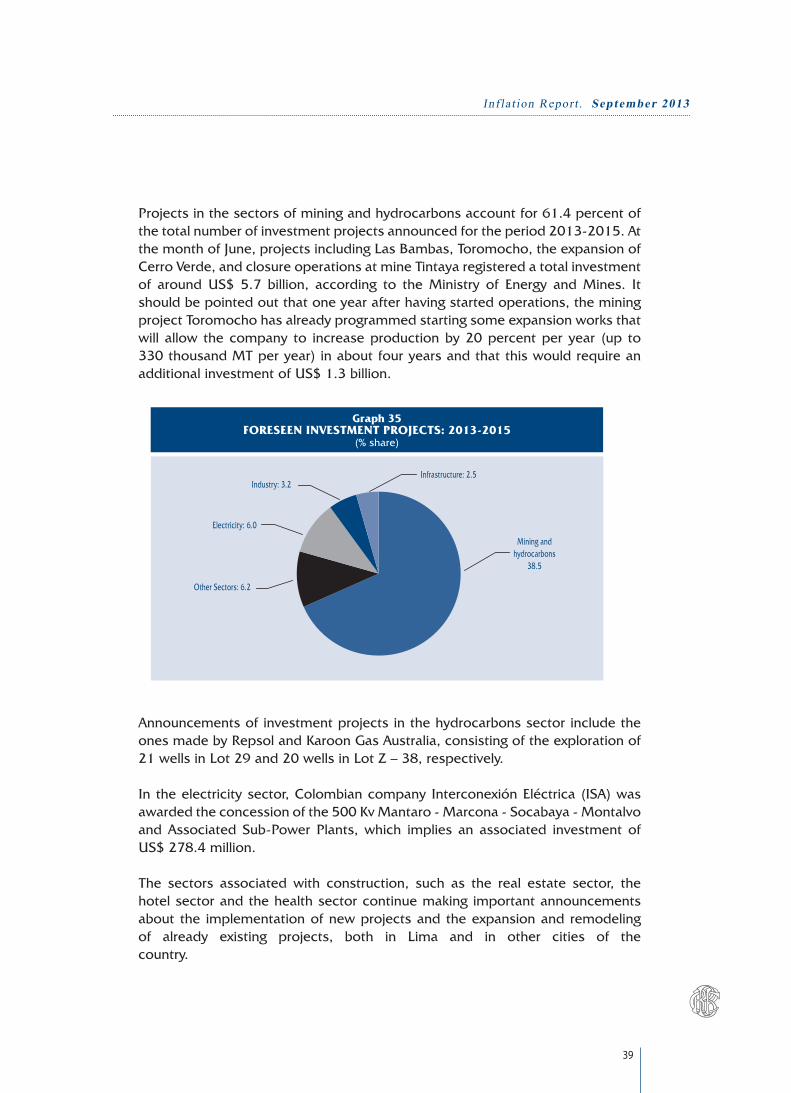
Projectsinthesectorsofminingandhydrocarbonsaccountfor61.4percentofthetotalnumberofinvestmentprojectsannouncedfortheperiod2013-2015.AtthemonthofJune,projectsincludingLasBambas,Toromocho,theexpansionofCerroVerde,andclosureoperationsatmineTintayaregisteredatotalinvestmentof aroundUS$ 5.7 billion, according to theMinistry of Energy andMines. Itshouldbepointedoutthatoneyearafterhavingstartedoperations,theminingprojectToromochohasalreadyprogrammedstartingsomeexpansionworksthatwill allow thecompany to increaseproductionby20percentperyear (up to330thousandMTperyear)inaboutfouryearsandthatthiswouldrequireanadditionalinvestmentofUS$1.3billion.
OtherSectors:6.2
Electricity:6.0
Industry:3.2
Miningandhydrocarbons
38.5
Infrastructure:2.5
Graph 35FORESEEN INVESTMENT PROjECTS: 2013-2015
(%share)
AnnouncementsofinvestmentprojectsinthehydrocarbonssectorincludetheonesmadebyRepsolandKaroonGasAustralia,consistingoftheexplorationof21wellsinLot29and20wellsinLotZ–38,respectively.
Intheelectricitysector,ColombiancompanyInterconexiónEléctrica(ISA)was
awardedtheconcessionofthe500KvMantaro-Marcona-Socabaya-MontalvoandAssociated Sub-PowerPlants,which implies an associated investmentofUS$278.4million.
The sectors associatedwith construction, such as the real estate sector, thehotelsectorandthehealthsectorcontinuemakingimportantannouncementsabout the implementationofnewprojectsandtheexpansionandremodelingof already existing projects, both in Lima and in other cities of thecountry.

40
CENTRAL RESERVE BANK OF PERU
ANNOUNCED MAIN INVESTMENT PROJECTS: 2013-2015SECTOR COMPANIES PROJECT NAMES
Xstrata Copper Las Bambas Freeport-Macmoran Copper Expansion of Cerro Verde Anglo American Plc. Quellaveco Antares Minerals Inc. Haquira China Minmetals Corporation y Jiangxi Copper Company Limited El Galeno Aluminium Corp of China Ltd. (Chinalco) ToromochoMining Norsemont Mining Inc., HudBay Minerals Inc. Constancia Aluminium Corp of China Ltd. (Chinalco) Expansion of Toromocho Cumbres Andinas, Korea Resources Corp. Mina Justa Bear Creek Mining Corporation Corani Grupo Milpo Expansion of Cerro Lindo and El Porvenir PanPacificCopperCorporation Quechua Hochschild Mining International Minerals Corporation (“IMZ”) Inmaculada Grupo Buenaventura Expansion of Colquijirca Grupo México S.A.B. de C.V. Expansion of Cuajone Savia Perú S.A. Lot Z-2B: Perforation, exploration and other investments Conduit Capital Partners - Odebrecht Andino del Sur Gas pipeline Repsol YPF Exploration of Lot 39 (21 well) Hydrocarbons Perenco Exploration of Lot 67 and pipeline Transportadora de Gas del Perú S.A. Expansion of gas and capacity of transportation PacificRubialesEnergy Lots:Z1-135-137-116-138 Cálidda Gas Natural del Perú Expansion of the use of natural gas nationwide Karoon Gas Australia-Vietnam American Petroleum Exploitation: Lot Z - 38 (20 well)
Odebrecht S.A. Hydroelectric Power Plant of Cerro de Chaglla Inkia Energy-Quimpac S.A.” Hydroelectric Power Plant of Cerro del Águila Energía Azul S.R.L. Hydroelectric Power Plant of Santa María Norwind Wind energy park Cerro Chocan Inevarante Hydroelectric Power Plant of Acco Pucará SN Power Perú S.A. Hydroelectric Power Plant of Cheves Fénix Power Perú S.A. Plant (combined cycled natural gas) GDF Suez Hydroelectric Power Plant of Quitaracsa I Volcan Compañia Minera S.A.A. Hydroelectric Power Plant of Belo HorizonteElectricity Interconexión Eléctrica S.A. (ISA) Mantaro – Marcona – Socabaya – Montalvo Transmission Line (500 kV) and Associated Sub-stations Corsan Corviam, Engevix y Enex Hydroelectric Power Plant of Molloco Cobra Carhuaquero-Cajamarca Norte-Cáclic-Moyobamba Transmission Line GCZ Energía y Latin American Power Hydroelectric Power Plant of Runatullo II and Runatullo II GDF Suez Empresa Eléctrica de Piura S.A.” Cold Power Generation Reserve - Talara Enhol y Peruana de Energía Hydroelectric Power Plant of La virgen Interconexión Eléctrica ISA Perú S.A. Trujillo - Chiclayo Transmission Line Grupo Económico Endesa Expansion of Malacas thermal plant Repsol YPF Hochschild Mining (Perú) S.A., Mitsubishi Expansion of La Pampilla plant Cementos Pacasmayo” Phospates projects Siderperú Modernization of plant SAB Miller, Backus y Johnston S.A.A Investment 2012-2014 GrupodePilkingtonLimited ManufactureplantoffloatglassesIndustry Corporación JR Lindley Expansion and new plants: Trujillo,Pucusana, Cusco, and Iquitos Bío Bío-Votorantim-Ipsa-World Cement Group.” Cement plant Grupo Hochschild New cemen plant in Piura Grupo ETEX New plant (Marca Gyplac) and industrial plant Grupo Gloria 2 production lines, hydroelectric plant and other projects
OAS S.R.L. Parque Rimac express way APM Terminal , Callao Port Holding y Central Portuaria (Perú) Modernization of North Pier Covisol Trujillo-Sullana: Sol Highway Autopista del Norte SAC Pativilca – Port of Salaverry Road Network No. 4Infrastructure Odebrecht New highways in Lima Consorcio La Chira La Chira Residual Waters Treatment Consorcio Transportadora Callao Minerals Pier Graña y Montero Vía Expresa Sur highway
Grupo Falabella Mall Aventura: 6 new malls Graña yMontero Vivienda Real state Holding Banmédica-Grupo Roe-Accionariado difundido Health center: San Felipe Besalco S.A. Real state InmobiliariS.A Residential,commercialandofficecenterinSurco Grupo Fierro Real State Rimac Maestro Perú Investment and expansion 2012-2014 Ripley Expansion and new malls (Huancayo,Chimbote, Sta Anita, Lima, Huancayo, Cusco,Tacna, and Puno)Other sectors Inversiones Maje y Grupo Lander Project Panorama Plaza de negocios Grupo Brescia Expansion of Clínica Internacional and other health centers Corporación EW-holding del Grupo Wong Malls and ground transportation terminal Credicorp-PacíficoEPS Networkhealthriskmanagement PontificiaUniversidadCatólicadelPerú Expansion:UniversityinfrastructureandCCPlazaSanMiguel Grupo Hochschild - TECSUP UTEC university San Fernando Optimize supply chain Grupo Gloria Casagrande,Cartavio and San Jacinto - Olmos project GrupoTelefónica Expansionandfiberopticsinandeanmountain América Móvil S.A.B. de C.V. y Telmex Perú S.A. Expansion of infrastructure, capacity and technological innovation Americatel Perú y Movistar Broadband expansion
Source: Press media and business information.

41
Inf la t ion Report . September 2013
28.Public investmentinthefirsthalfof2013grew22.4percent,showingaccelerationin Q2 explained mainly by the higher investment of the national government(25.1percent)andState-ownedenterprises(46.5percent).ThemostimportantinvestmentsofthenationalgovernmentwereassociatedwithroadrehabilitationandroadimprovementandwiththeprojectoftheElectricTrainforLimaandCallao.Inlinewiththeinvestmentcarriedout,thegrowthforecastofpublicinvestmentin2013hasbeenrevisedupwards.Asaresultofthis,therateofpublicinvestmentwouldrisefrom5.2percentofGDPin2012to6.8percentofGDPin2015.
Graph 36
PuBLIC INVESTMENT: 2006-2015(Real%change)
*Forecast.2006 2007 2008 2009 2010 2011 2012 2013* 2015*2014*
20.7 18.9
33.7
21.6Average
2006-2012:17.8%
26.7
-18.0
16.3 14.617.020.8
29.Given the evolution of private investment and public investment, the grossinvestment-to-GDPratiowouldbeover28percentintheforecasthorizon.Theratiooffixedgross investment-to-GDPwas22.0percentonaveragebetween2003and2012,whichis3.4timesthegrowthoftheaverageGDPinthisperiod(6.5percent).Theaverage investment-to-GDP ratio in the forecasthorizon is28.9percent,whichisequivalentto4.7timestheaverageGDPgrowthforecast(6.1percent).
Graph 37GROSS FIXED INVESTMENT: 2006 - 2015
(%GDP)
*Forecast.
2006
19.5
2007
21.5
2008
25.9
2009
22.9
2010
25.1
2011
24.0
2012
26.6
2013* 2014* 2015*
28.0 29.029.8
Privateinvestment Privateinvestment
22.2 22.7 22.921.4
19.519.217.7
21.518.216.4
3.13.4
4.35.2
5.9 4.55.2 5.8 6.4 6.8
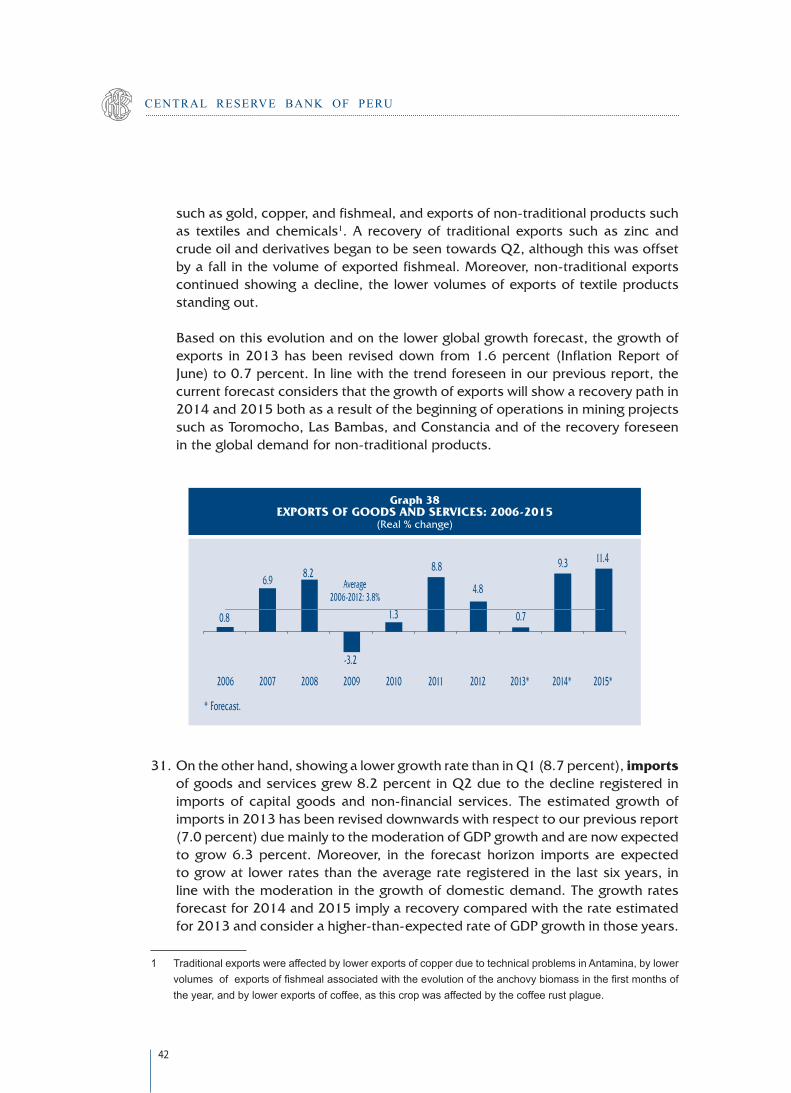
30.Inthefirstsemesterof2013,exportsofgoodsandservicesdropped3.1percent,duemainlytothenegativeperformanceofbothexportsoftraditionalproducts
42
CENTRAL RESERVE BANK OF PERU
suchasgold,copper,andfishmeal,andexportsofnon-traditionalproductssuchas textiles and chemicals1.A recoveryof traditional exports suchas zinc andcrudeoilandderivativesbegantobeseentowardsQ2,althoughthiswasoffsetbyafallinthevolumeofexportedfishmeal.Moreover,non-traditionalexportscontinuedshowingadecline,thelowervolumesofexportsoftextileproductsstandingout.
Basedonthisevolutionandonthelowerglobalgrowthforecast,thegrowthofexports in2013hasbeen reviseddown from1.6percent (InflationReportofJune)to0.7percent.Inlinewiththetrendforeseeninourpreviousreport,thecurrentforecastconsidersthatthegrowthofexportswillshowarecoverypathin2014and2015bothasaresultofthebeginningofoperationsinminingprojectssuchasToromocho,LasBambas,andConstanciaandoftherecoveryforeseenintheglobaldemandfornon-traditionalproducts.
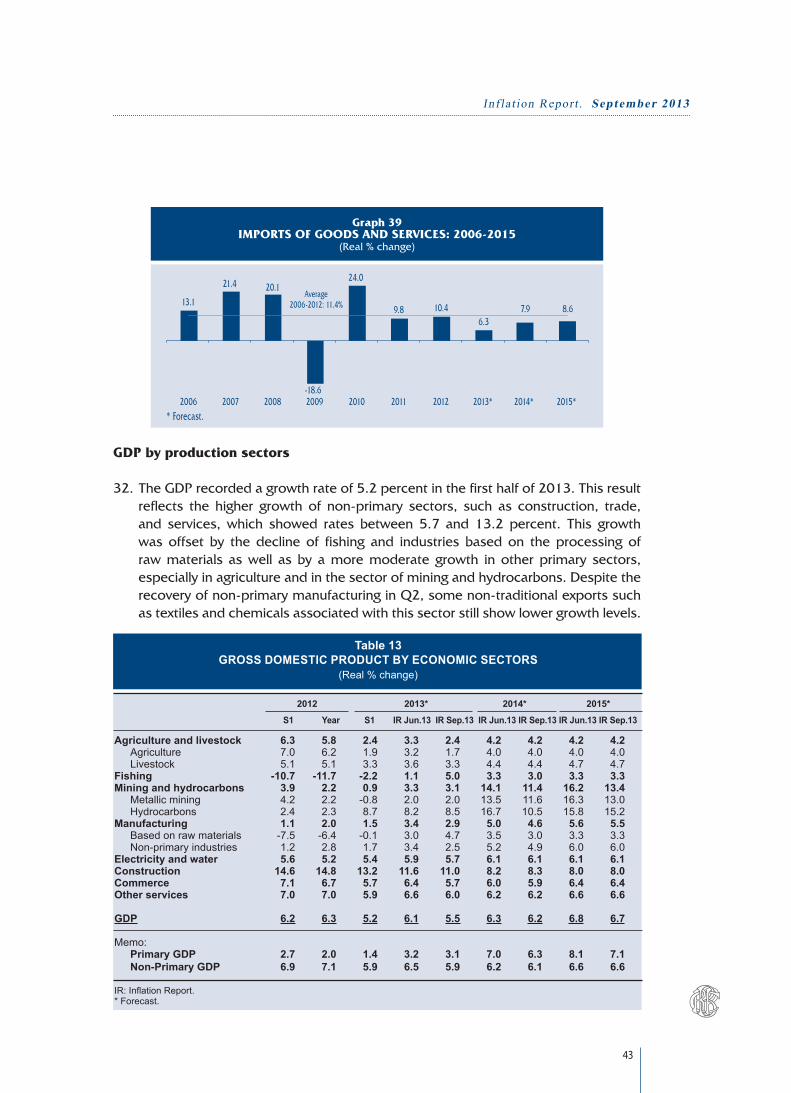
31.Ontheotherhand,showingalowergrowthratethaninQ1(8.7percent),importsofgoodsandservicesgrew8.2percentinQ2duetothedeclineregisteredinimportsof capital goodsandnon-financial services. Theestimatedgrowthofimportsin2013hasbeenreviseddownwardswithrespecttoourpreviousreport(7.0percent)duemainlytothemoderationofGDPgrowthandarenowexpectedtogrow6.3percent.Moreover, in the forecasthorizon imports areexpectedtogrowatlowerratesthantheaveragerateregisteredinthelastsixyears,inlinewiththemoderationinthegrowthofdomesticdemand.Thegrowthratesforecastfor2014and2015implyarecoverycomparedwiththerateestimatedfor2013andconsiderahigher-than-expectedrateofGDPgrowthinthoseyears.
1 Traditional exports were affected by lower exports of copper due to technical problems in Antamina, by lower volumesofexportsoffishmealassociatedwiththeevolutionoftheanchovybiomassinthefirstmonthsofthe year, and by lower exports of coffee, as this crop was affected by the coffee rust plague.
Graph 38EXPORTS OF GOODS AND SERVICES: 2006-2015
(Real%change)
*Forecast.
2006 2007 2008 2009 2010 2011 2012 2013* 2014* 2015*
0.8
6.9 8.2
-3.2
1.3
Average2006-2012:3.8%
8.8
4.8
0.7
9.3 11.4
43
Inf la t ion Report . September 2013
Graph 39IMPORTS OF GOODS AND SERVICES: 2006-2015
(Real%change)
*Forecast.2006 2007 2008 2009 2010 2011 2012 2013* 2014* 2015*
13.1
21.4 20.1
-18.6
24.0
Average2006-2012:11.4% 9.8 10.4
6.37.9 8.6
GDP by production sectors
32.TheGDPrecordedagrowthrateof5.2percentinthefirsthalfof2013.Thisresultreflects the higher growthof non-primary sectors, such as construction, trade,and services,which showed rates between5.7 and13.2percent. This growthwasoffset by thedeclineof fishing and industries basedon theprocessingofrawmaterialsaswell asbyamoremoderategrowth inotherprimary sectors,especiallyinagricultureandinthesectorofminingandhydrocarbons.Despitetherecoveryofnon-primarymanufacturinginQ2,somenon-traditionalexportssuchastextilesandchemicalsassociatedwiththissectorstillshowlowergrowthlevels.
Table 13GROSS DOMESTIC PRODUCT BY ECONOMIC SECTORS
(Real % change) 2012 2013* 2014* 2015* S1 Year S1 IR Jun.13 IR Sep.13 IR Jun.13 IR Sep.13 IR Jun.13 IR Sep.13
Agriculture and livestock 6.3 5.8 2.4 3.3 2.4 4.2 4.2 4.2 4.2 Agriculture 7.0 6.2 1.9 3.2 1.7 4.0 4.0 4.0 4.0 Livestock 5.1 5.1 3.3 3.6 3.3 4.4 4.4 4.7 4.7Fishing -10.7 -11.7 -2.2 1.1 5.0 3.3 3.0 3.3 3.3Mining and hydrocarbons 3.9 2.2 0.9 3.3 3.1 14.1 11.4 16.2 13.4 Metallic mining 4.2 2.2 -0.8 2.0 2.0 13.5 11.6 16.3 13.0 Hydrocarbons 2.4 2.3 8.7 8.2 8.5 16.7 10.5 15.8 15.2Manufacturing 1.1 2.0 1.5 3.4 2.9 5.0 4.6 5.6 5.5 Based on raw materials -7.5 -6.4 -0.1 3.0 4.7 3.5 3.0 3.3 3.3 Non-primary industries 1.2 2.8 1.7 3.4 2.5 5.2 4.9 6.0 6.0Electricity and water 5.6 5.2 5.4 5.9 5.7 6.1 6.1 6.1 6.1Construction 14.6 14.8 13.2 11.6 11.0 8.2 8.3 8.0 8.0Commerce 7.1 6.7 5.7 6.4 5.7 6.0 5.9 6.4 6.4Other services 7.0 7.0 5.9 6.6 6.0 6.2 6.2 6.6 6.6
GDP 6.2 6.3 5.2 6.1 5.5 6.3 6.2 6.8 6.7
Memo: Primary GDP 2.7 2.0 1.4 3.2 3.1 7.0 6.3 8.1 7.1 Non-Primary GDP 6.9 7.1 5.9 6.5 5.9 6.2 6.1 6.6 6.6
IR:InflationReport.* Forecast.
44
CENTRAL RESERVE BANK OF PERU
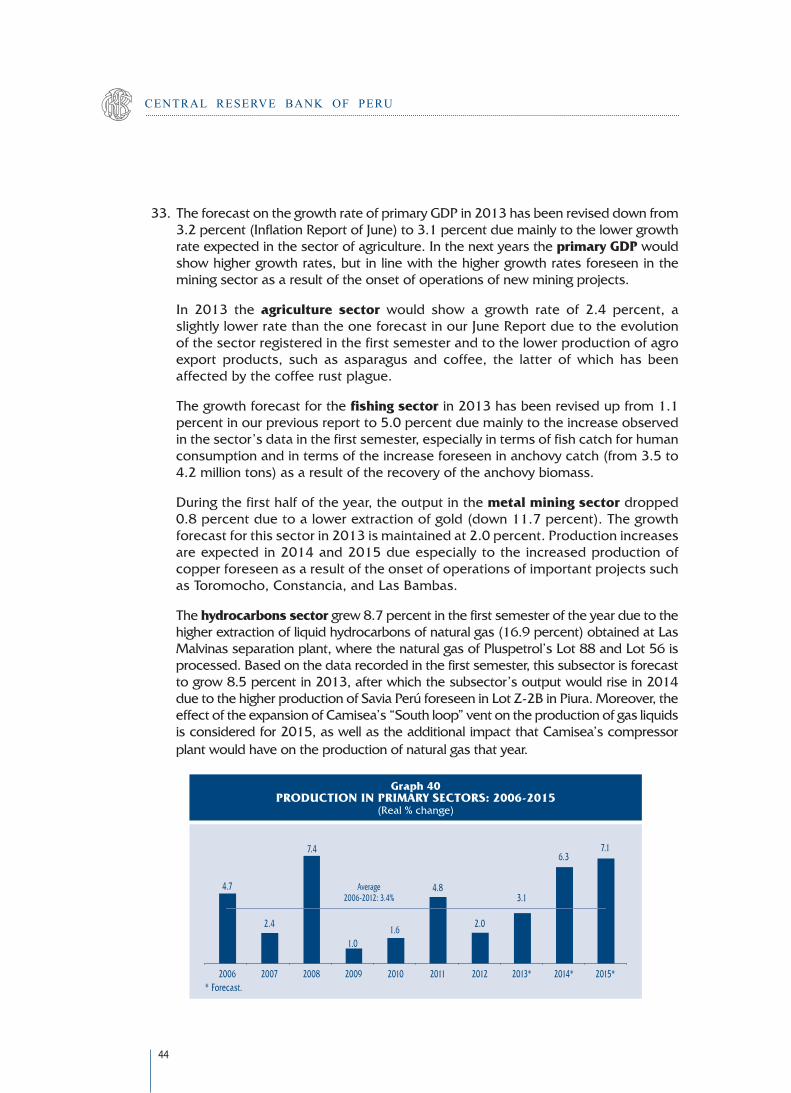
33.TheforecastonthegrowthrateofprimaryGDPin2013hasbeenreviseddownfrom3.2percent(InflationReportofJune)to3.1percentduemainlytothelowergrowthrateexpectedinthesectorofagriculture.Inthenextyearstheprimary GDPwouldshowhighergrowthrates,butinlinewiththehighergrowthratesforeseenintheminingsectorasaresultoftheonsetofoperationsofnewminingprojects.
In 2013 theagriculture sector would show a growth rate of 2.4 percent, aslightlylowerratethantheoneforecastinourJuneReportduetotheevolutionofthesectorregisteredinthefirstsemesterandtothelowerproductionofagroexport products, such as asparagus and coffee, the latter ofwhich has beenaffectedbythecoffeerustplague.
Thegrowthforecastforthefishing sectorin2013hasbeenrevisedupfrom1.1percentinourpreviousreportto5.0percentduemainlytotheincreaseobservedinthesector’sdatainthefirstsemester,especiallyintermsoffishcatchforhumanconsumptionandintermsoftheincreaseforeseeninanchovycatch(from3.5to4.2milliontons)asaresultoftherecoveryoftheanchovybiomass.
Duringthefirsthalfoftheyear,theoutputinthemetal mining sectordropped0.8percentduetoalowerextractionofgold(down11.7percent).Thegrowthforecastforthissectorin2013ismaintainedat2.0percent.Productionincreasesareexpectedin2014and2015dueespeciallytotheincreasedproductionofcopperforeseenasaresultoftheonsetofoperationsofimportantprojectssuchasToromocho,Constancia,andLasBambas.
Thehydrocarbons sectorgrew8.7percentinthefirstsemesteroftheyearduetothehigherextractionofliquidhydrocarbonsofnaturalgas(16.9percent)obtainedatLasMalvinasseparationplant,wherethenaturalgasofPluspetrol’sLot88andLot56isprocessed.Basedonthedatarecordedinthefirstsemester,thissubsectorisforecasttogrow8.5percentin2013,afterwhichthesubsector’soutputwouldrisein2014duetothehigherproductionofSaviaPerúforeseeninLotZ-2BinPiura.Moreover,theeffectoftheexpansionofCamisea’s“Southloop”ventontheproductionofgasliquidsisconsideredfor2015,aswellastheadditionalimpactthatCamisea’scompressorplantwouldhaveontheproductionofnaturalgasthatyear.
Graph 40PRODuCTION IN PRIMARy SECTORS: 2006-2015
(Real%change)
*Forecast.2006 2007 2008 2009 2010 2011 2012 2013* 2014* 2015*
4.7
2.4
7.4
1.01.6
Average2006-2012:3.4%
4.8
2.0
3.1
6.37.1
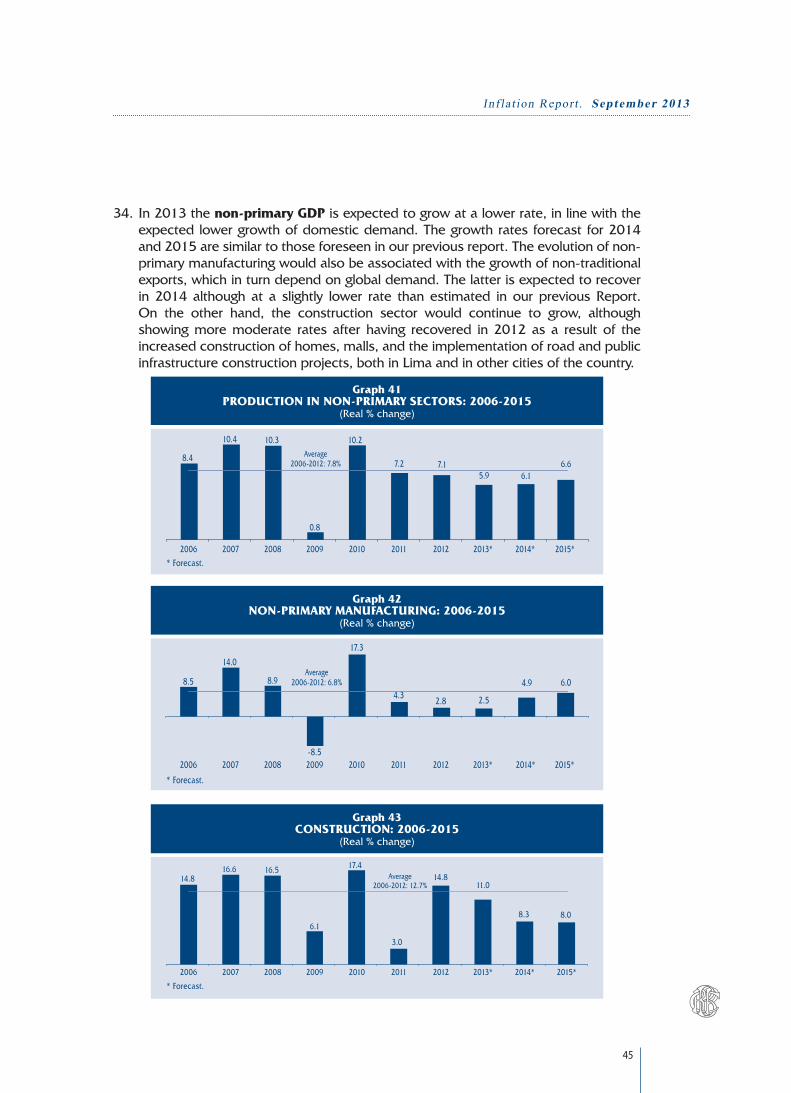
45
Inf la t ion Report . September 2013
34.In2013thenon-primary GDPisexpectedtogrowatalowerrate,inlinewiththeexpectedlowergrowthofdomesticdemand.Thegrowthratesforecastfor2014and2015aresimilartothoseforeseeninourpreviousreport.Theevolutionofnon-primarymanufacturingwouldalsobeassociatedwiththegrowthofnon-traditionalexports,whichinturndependonglobaldemand.Thelatterisexpectedtorecoverin2014althoughat a slightly lower rate thanestimated inourpreviousReport.On the other hand, the construction sector would continue to grow, althoughshowingmoremoderate ratesafterhaving recovered in2012asa resultof theincreasedconstructionofhomes,malls,andtheimplementationofroadandpublicinfrastructureconstructionprojects,bothinLimaandinothercitiesofthecountry.
Graph 41PRODuCTION IN NON-PRIMARy SECTORS: 2006-2015
(Real%change)
*Forecast.2006 2007 2008 2009 2010 2011 2012 2013* 2015*2014*
8.4
10.4 10.3 10.2
0.8
Average2006-2012:7.8% 7.2 7.1
5.96.6
6.1
Graph 42NON-PRIMARy MANuFACTuRING: 2006-2015
(Real%change)
*Forecast.
2006 2007 2008 2009 2010 2011 2012 2013* 2014* 2015*
8.5
14.0
8.9
-8.5
17.3
Average2006-2012:6.8%
4.3 2.5
4.9 6.0
2.8
Graph 43CONSTRuCTION: 2006-2015
(Real%change)
*Forecast.
2006 2007 2008 2009 2010 2011 2012 2013* 2014* 2015*
14.816.6 16.5
6.1
17.4Average
2006-2012:12.7%
3.0
14.811.0
8.3 8.0
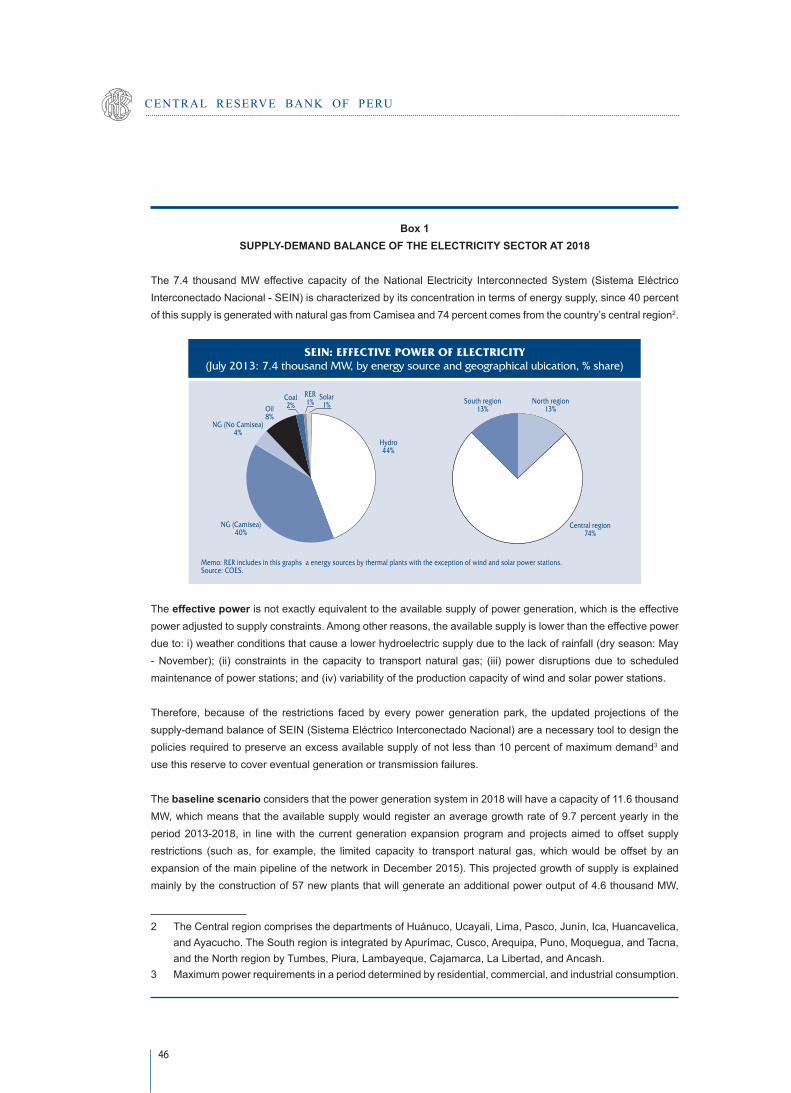
46
CENTRAL RESERVE BANK OF PERU
Box 1SUPPLY-DEMAND BALANCE OF THE ELECTRICITY SECTOR AT 2018
The 7.4 thousand MW effective capacity of the National Electricity Interconnected System (Sistema Eléctrico Interconectado Nacional - SEIN) is characterized by its concentration in terms of energy supply, since 40 percent of this supply is generated with natural gas from Camisea and 74 percent comes from the country’s central region2.
The effective power is not exactly equivalent to the available supply of power generation, which is the effective power adjusted to supply constraints. Among other reasons, the available supply is lower than the effective power due to: i) weather conditions that cause a lower hydroelectric supply due to the lack of rainfall (dry season: May - November); (ii) constraints in the capacity to transport natural gas; (iii) power disruptions due to scheduled maintenance of power stations; and (iv) variability of the production capacity of wind and solar power stations.
Therefore, because of the restrictions faced by every power generation park, the updated projections of the supply-demand balance of SEIN (Sistema Eléctrico Interconectado Nacional) are a necessary tool to design the policies required to preserve an excess available supply of not less than 10 percent of maximum demand3 and use this reserve to cover eventual generation or transmission failures.
The baseline scenario considers that the power generation system in 2018 will have a capacity of 11.6 thousand MW, which means that the available supply would register an average growth rate of 9.7 percent yearly in the period 2013-2018, in line with the current generation expansion program and projects aimed to offset supply restrictions (such as, for example, the limited capacity to transport natural gas, which would be offset by an expansion of the main pipeline of the network in December 2015). This projected growth of supply is explained mainly by the construction of 57 new plants that will generate an additional power output of 4.6 thousand MW,
2 The Central region comprises the departments of Huánuco, Ucayali, Lima, Pasco, Junín, Ica, Huancavelica, and Ayacucho. The South region is integrated by Apurímac, Cusco, Arequipa, Puno, Moquegua, and Tacna, and the North region by Tumbes, Piura, Lambayeque, Cajamarca, La Libertad, and Ancash.
3 Maximum power requirements in a period determined by residential, commercial, and industrial consumption.
SEIN: EFFECTIVE POwER OF ELECTRICITy (July2013:7.4thousandMW,byenergysourceandgeographicalubication,%share)
Memo:RERincludesinthisgraphsaenergysourcesbythermalplantswiththeexceptionofwindandsolarpowerstations.Source:COES.
NG(NoCamisea)4%
NG(Camisea)40%
Hydro44%
Southregion13%
Northregion13%Oil
8%
Coal2%
RER1%
Solar1%
Centralregion74%
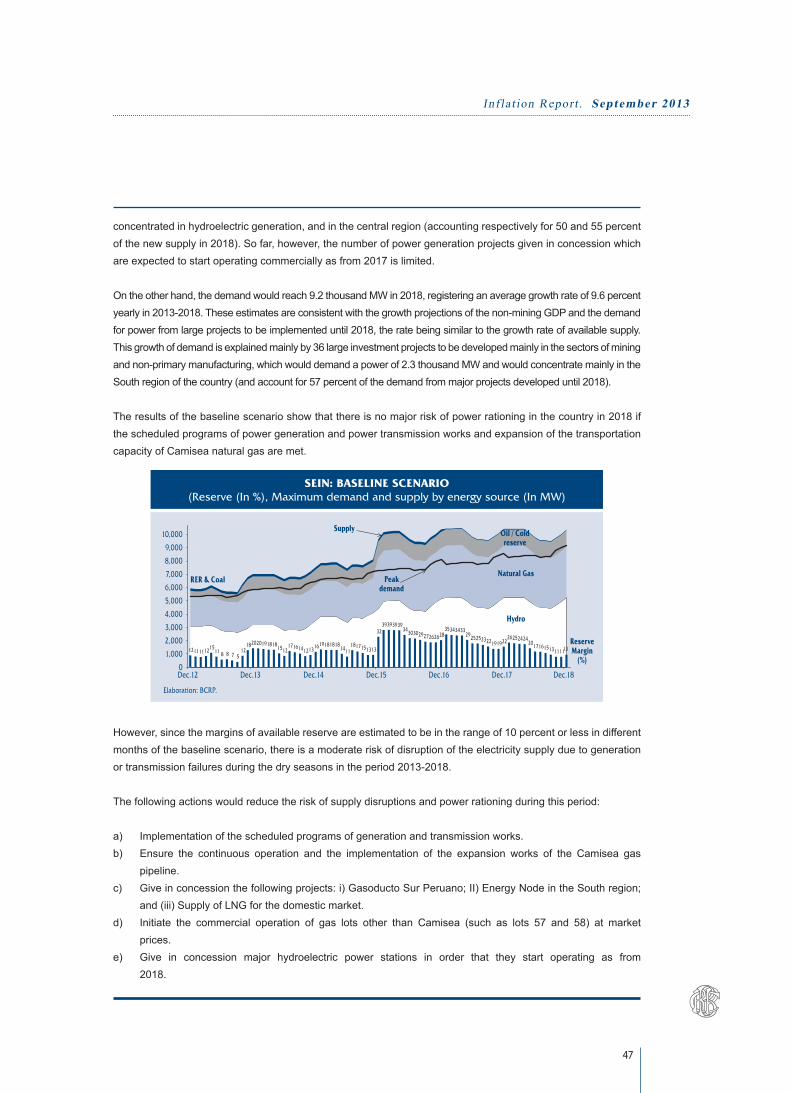
47
Inf la t ion Report . September 2013
concentrated in hydroelectric generation, and in the central region (accounting respectively for 50 and 55 percent of the new supply in 2018). So far, however, the number of power generation projects given in concession which are expected to start operating commercially as from 2017 is limited.
On the other hand, the demand would reach 9.2 thousand MW in 2018, registering an average growth rate of 9.6 percent yearly in 2013-2018. These estimates are consistent with the growth projections of the non-mining GDP and the demand for power from large projects to be implemented until 2018, the rate being similar to the growth rate of available supply. This growth of demand is explained mainly by 36 large investment projects to be developed mainly in the sectors of mining and non-primary manufacturing, which would demand a power of 2.3 thousand MW and would concentrate mainly in the South region of the country (and account for 57 percent of the demand from major projects developed until 2018).
The results of the baseline scenario show that there is no major risk of power rationing in the country in 2018 if the scheduled programs of power generation and power transmission works and expansion of the transportation capacity of Camisea natural gas are met.
SEIN: BASELINE SCENARIO(Reserve(In%),Maximumdemandandsupplybyenergysource(InMW)
Elaboration:BCRP.
10,000
9,000
8,000
7,000
6,000
5,000
4,000
3,000
2,000
1,000
0Dec.12 Dec.13
Supply
Peak demand
Oil / Cold reserve
Natural Gas
hydro
ReserveMargin
(%)
RER & Coal
Dec.14 Dec.15 Dec.16 Dec.17 Dec.18
However, since the margins of available reserve are estimated to be in the range of 10 percent or less in different months of the baseline scenario, there is a moderate risk of disruption of the electricity supply due to generation or transmission failures during the dry seasons in the period 2013-2018.
The following actions would reduce the risk of supply disruptions and power rationing during this period:
a) Implementation of the scheduled programs of generation and transmission works.b) Ensure the continuous operation and the implementation of the expansion works of the Camisea gas
pipeline. c) Give in concession the following projects: i) Gasoducto Sur Peruano; II) Energy Node in the South region;
and (iii) Supply of LNG for the domestic market. d) Initiate the commercial operation of gas lots other than Camisea (such as lots 57 and 58) at market
prices. e) Give in concession major hydroelectric power stations in order that they start operating as from
2018.
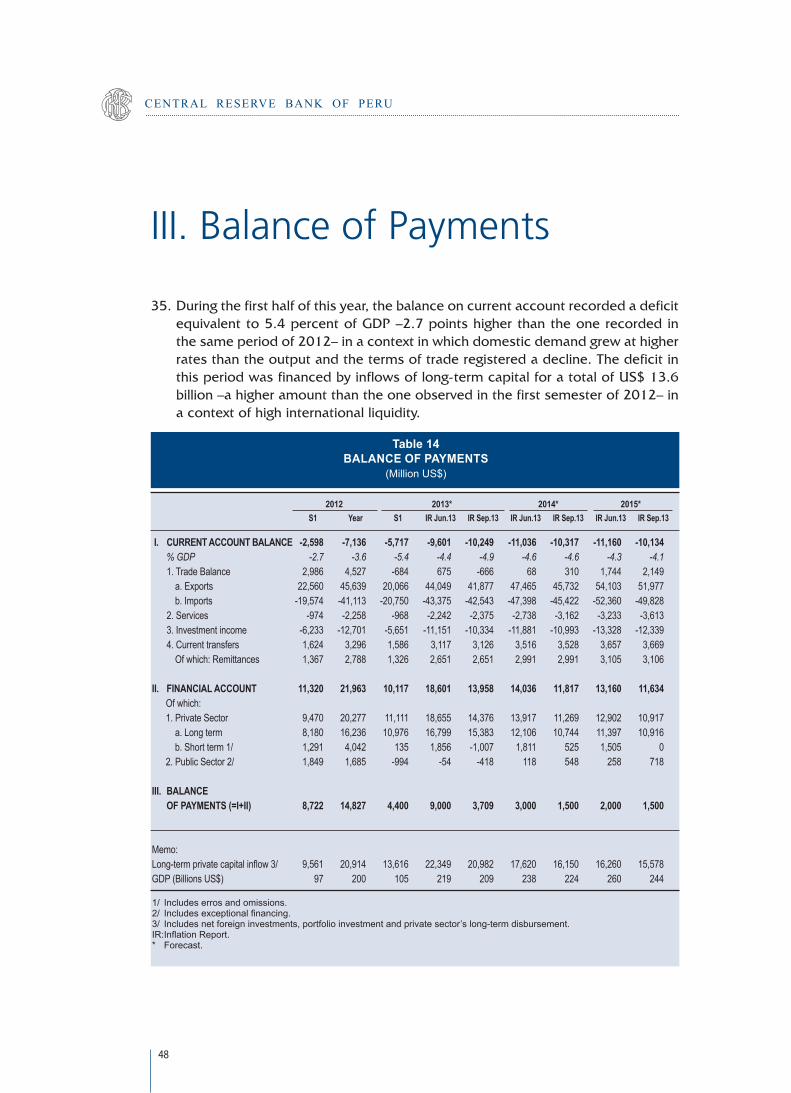
48
CENTRAL RESERVE BANK OF PERU
III. Balance of Payments
35.Duringthefirsthalfofthisyear,thebalanceoncurrentaccountrecordedadeficitequivalentto5.4percentofGDP–2.7pointshigherthantheonerecordedinthesameperiodof2012–inacontextinwhichdomesticdemandgrewathigherratesthantheoutputandthetermsoftraderegisteredadecline.Thedeficitinthisperiodwasfinancedbyinflowsoflong-termcapitalforatotalofUS$13.6billion–ahigheramountthantheoneobservedinthefirstsemesterof2012–inacontextofhighinternationalliquidity.
Table 14BALANCE OF PAYMENTS
(Million US$) 2012 2013* 2014* 2015* S1 Year S1 IR Jun.13 IR Sep.13 IR Jun.13 IR Sep.13 IR Jun.13 IR Sep.13 I. CURRENT ACCOUNT BALANCE -2,598 -7,136 -5,717 -9,601 -10,249 -11,036 -10,317 -11,160 -10,134 % GDP -2.7 -3.6 -5.4 -4.4 -4.9 -4.6 -4.6 -4.3 -4.1 1. Trade Balance 2,986 4,527 -684 675 -666 68 310 1,744 2,149 a. Exports 22,560 45,639 20,066 44,049 41,877 47,465 45,732 54,103 51,977 b. Imports -19,574 -41,113 -20,750 -43,375 -42,543 -47,398 -45,422 -52,360 -49,828 2. Services -974 -2,258 -968 -2,242 -2,375 -2,738 -3,162 -3,233 -3,613 3. Investment income -6,233 -12,701 -5,651 -11,151 -10,334 -11,881 -10,993 -13,328 -12,339 4. Current transfers 1,624 3,296 1,586 3,117 3,126 3,516 3,528 3,657 3,669 Of which: Remittances 1,367 2,788 1,326 2,651 2,651 2,991 2,991 3,105 3,106
II. FINANCIAL ACCOUNT 11,320 21,963 10,117 18,601 13,958 14,036 11,817 13,160 11,634 Of which: 1. Private Sector 9,470 20,277 11,111 18,655 14,376 13,917 11,269 12,902 10,917 a. Long term 8,180 16,236 10,976 16,799 15,383 12,106 10,744 11,397 10,916 b. Short term 1/ 1,291 4,042 135 1,856 -1,007 1,811 525 1,505 0 2. Public Sector 2/ 1,849 1,685 -994 -54 -418 118 548 258 718
III. BALANCE OF PAYMENTS (=I+II) 8,722 14,827 4,400 9,000 3,709 3,000 1,500 2,000 1,500
Memo: Long-termprivatecapitalinflow3/ 9,561 20,914 13,616 22,349 20,982 17,620 16,150 16,260 15,578GDP (Billions US$) 97 200 105 219 209 238 224 260 244 1/ Includes erros and omissions.2/ Includesexceptionalfinancing.3/ Includes net foreign investments, portfolio investment and private sector’s long-term disbursement.IR:InflationReport.* Forecast.
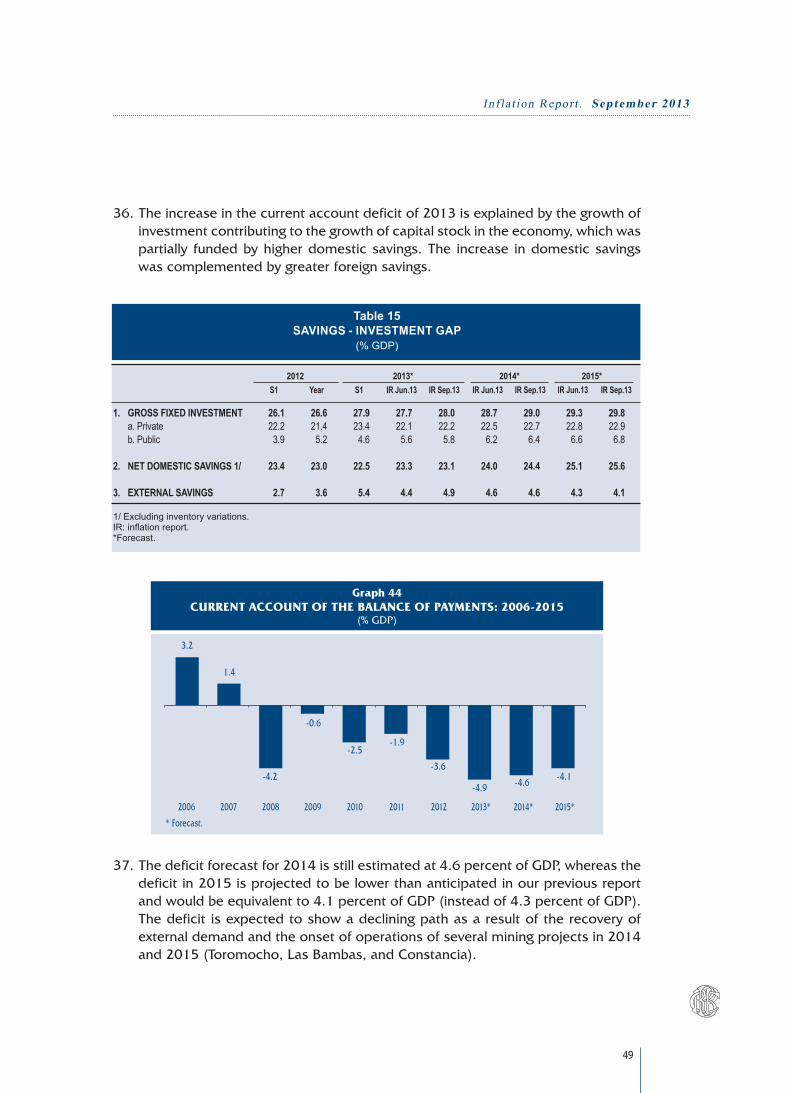
49
Inf la t ion Report . September 2013
37.Thedeficitforecastfor2014isstillestimatedat4.6percentofGDP,whereasthedeficitin2015isprojectedtobelowerthananticipatedinourpreviousreportandwouldbeequivalentto4.1percentofGDP(insteadof4.3percentofGDP).Thedeficit isexpectedtoshowadecliningpathasaresultoftherecoveryofexternaldemandandtheonsetofoperationsofseveralminingprojectsin2014and2015(Toromocho,LasBambas,andConstancia).
36.Theincreaseinthecurrentaccountdeficitof2013isexplainedbythegrowthofinvestmentcontributingtothegrowthofcapitalstockintheeconomy,whichwaspartially fundedbyhigherdomesticsavings.The increase indomesticsavingswascomplementedbygreaterforeignsavings.
Table 15SAVINGS - INVESTMENT GAP
(% GDP) 2012 2013* 2014* 2015* S1 Year S1 IR Jun.13 IR Sep.13 IR Jun.13 IR Sep.13 IR Jun.13 IR Sep.13 1. GROSS FIXED INVESTMENT 26.1 26.6 27.9 27.7 28.0 28.7 29.0 29.3 29.8 a. Private 22.2 21.4 23.4 22.1 22.2 22.5 22.7 22.8 22.9 b. Public 3.9 5.2 4.6 5.6 5.8 6.2 6.4 6.6 6.8
2. NET DOMESTIC SAVINGS 1/ 23.4 23.0 22.5 23.3 23.1 24.0 24.4 25.1 25.6
3. EXTERNAL SAVINGS 2.7 3.6 5.4 4.4 4.9 4.6 4.6 4.3 4.1 1/ Excluding inventory variations.IR:inflationreport.*Forecast.
Graph 44CuRRENT ACCOuNT OF ThE BALANCE OF PAyMENTS: 2006-2015
(%GDP)
*Forecast.
3.2
1.4
-4.2 -4.1
-0.6
-2.5-1.9
-3.6
-4.9 -4.6
2013* 2014*2006 2007 2008 2015*2009 2010 2011 2012
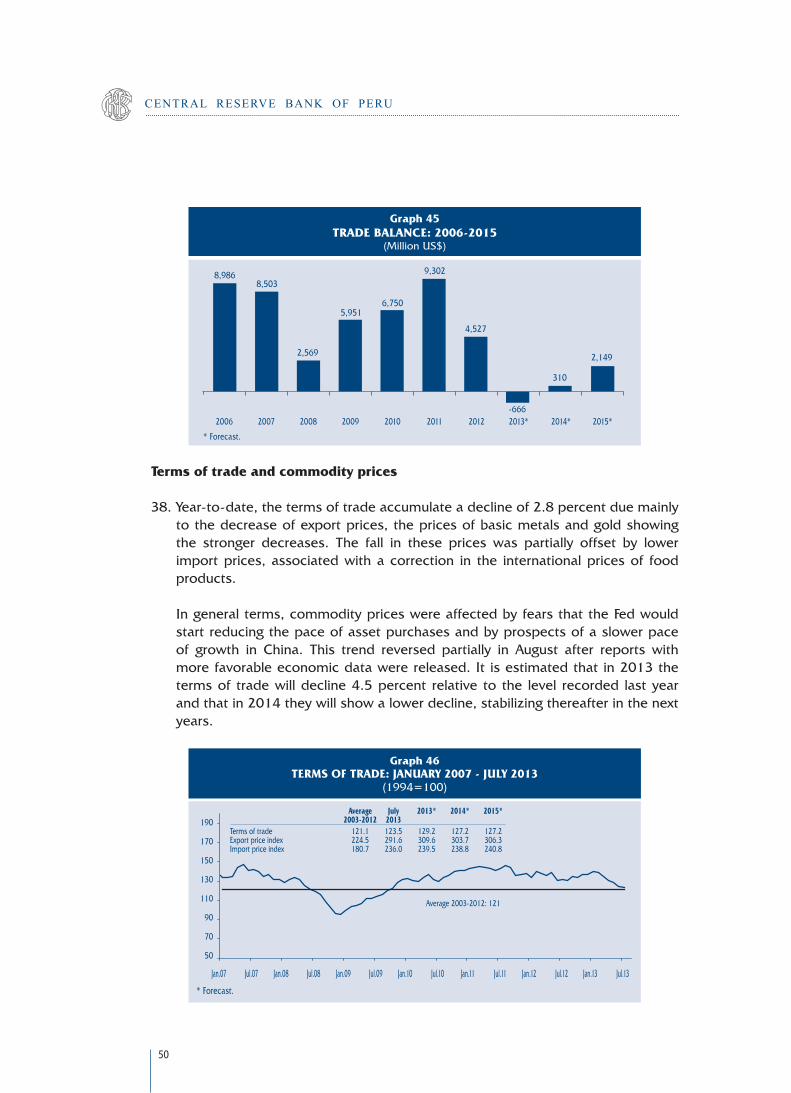
50
CENTRAL RESERVE BANK OF PERU
Terms of trade and commodity prices
38.Year-to-date,thetermsoftradeaccumulateadeclineof2.8percentduemainlytothedecreaseofexportprices,thepricesofbasicmetalsandgoldshowingthe stronger decreases. The fall in these prices was partially offset by lowerimportprices,associatedwithacorrection in the internationalpricesof foodproducts.
Ingeneralterms,commoditypriceswereaffectedbyfearsthattheFedwouldstartreducingthepaceofassetpurchasesandbyprospectsofaslowerpaceof growth in China. This trend reversed partially in August after reports withmorefavorableeconomicdatawerereleased.It isestimatedthatin2013thetermsof tradewilldecline4.5percent relative to the level recorded lastyearandthatin2014theywillshowalowerdecline,stabilizingthereafterinthenextyears.
Graph 45TRADE BALANCE: 2006-2015
(MillionUS$)
*Forecast.
8,9868,503
2,569 2,149
5,9516,750
9,302
4,527
-666
310
2013* 2014*2006 2007 2008 2015*2009 2010 2011 2012
Graph 46TERMS OF TRADE: jANuARy 2007 - juLy 2013
(1994=100)
190
170
150
130
110
90
70
50
Jan.07 Jan.08 Jan.09 Jan.10 Jan.11 Jan.12 Jan.13Jul.07 Jul.08 Jul.09 Jul.10 Jul.11 Jul.12 Jul.13
Average2003-2012:121
Average july 2013* 2014* 2015* 2003-2012 2013Termsoftrade 121.1 123.5 129.2 127.2 127.2Exportpriceindex 224.5 291.6 309.6 303.7 306.3Importpriceindex 180.7 236.0 239.5 238.8 240.8
*Forecast.
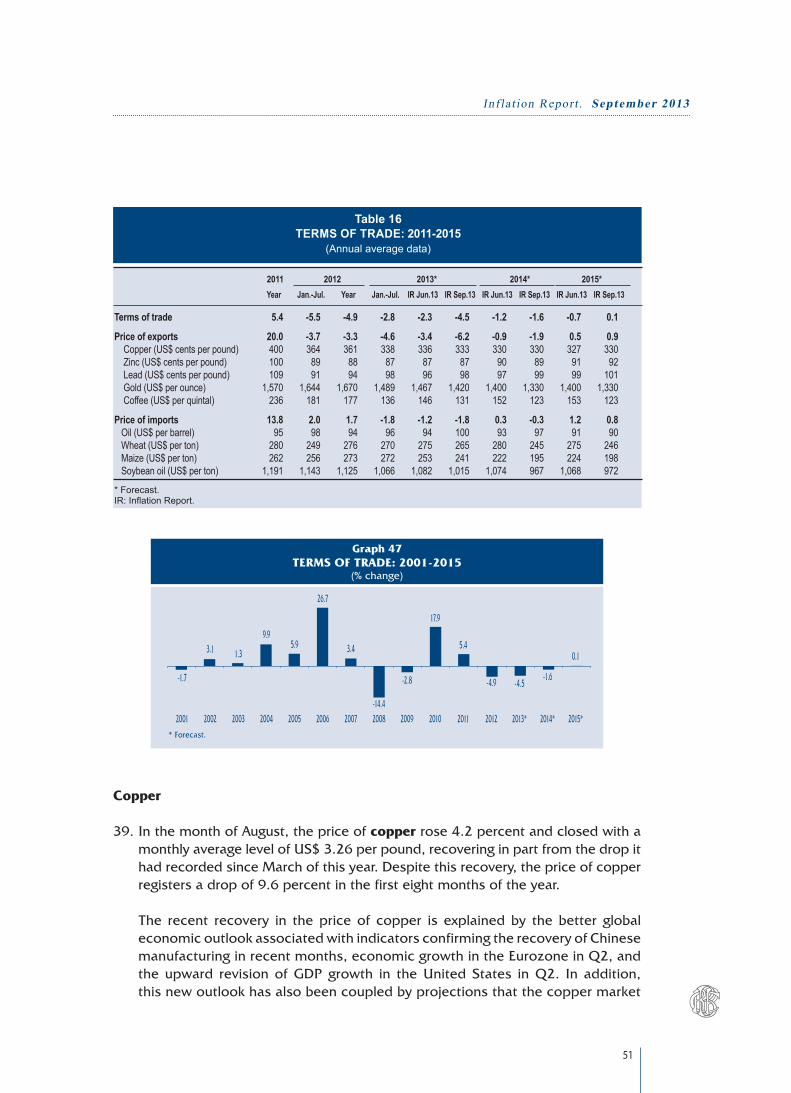
51
Inf la t ion Report . September 2013
Copper
39.InthemonthofAugust,thepriceofcopperrose4.2percentandclosedwithamonthlyaveragelevelofUS$3.26perpound,recoveringinpartfromthedropithadrecordedsinceMarchofthisyear.Despitethisrecovery,thepriceofcopperregistersadropof9.6percentinthefirsteightmonthsoftheyear.
The recent recovery in thepriceof copper is explainedby thebetter global
economicoutlookassociatedwithindicatorsconfirmingtherecoveryofChinesemanufacturinginrecentmonths,economicgrowthintheEurozoneinQ2,andtheupward revisionofGDPgrowth in theUnitedStates inQ2. In addition,thisnewoutlookhasalsobeencoupledbyprojectionsthatthecoppermarket
Table 16TERMS OF TRADE: 2011-2015
(Annual average data) 2011 2012 2013* 2014* 2015* Year Jan.-Jul. Year Jan.-Jul. IR Jun.13 IR Sep.13 IR Jun.13 IR Sep.13 IR Jun.13 IR Sep.13
Terms of trade 5.4 -5.5 -4.9 -2.8 -2.3 -4.5 -1.2 -1.6 -0.7 0.1
Price of exports 20.0 -3.7 -3.3 -4.6 -3.4 -6.2 -0.9 -1.9 0.5 0.9 Copper (US$ cents per pound) 400 364 361 338 336 333 330 330 327 330 Zinc (US$ cents per pound) 100 89 88 87 87 87 90 89 91 92 Lead (US$ cents per pound) 109 91 94 98 96 98 97 99 99 101 Gold (US$ per ounce) 1,570 1,644 1,670 1,489 1,467 1,420 1,400 1,330 1,400 1,330 Coffee (US$ per quintal) 236 181 177 136 146 131 152 123 153 123
Price of imports 13.8 2.0 1.7 -1.8 -1.2 -1.8 0.3 -0.3 1.2 0.8 Oil (US$ per barrel) 95 98 94 96 94 100 93 97 91 90 Wheat (US$ per ton) 280 249 276 270 275 265 280 245 275 246 Maize (US$ per ton) 262 256 273 272 253 241 222 195 224 198 Soybean oil (US$ per ton) 1,191 1,143 1,125 1,066 1,082 1,015 1,074 967 1,068 972
* Forecast.IR:InflationReport.
Graph 47TERMS OF TRADE: 2001-2015
(%change)
*Forecast.
2001
-1.7
2002
3.1
2003
1.3
2004
9.9
2005
5.9
2006
26.7
2007
3.4
2008-14.4
2009
-2.8
2010
17.9
2011
5.4
2012
-4.9
2013*
-4.5
2014*
-1.6
2015*
0.1

52
CENTRAL RESERVE BANK OF PERU
willbetighterthanexpectedearlier4duetoahigher-than-expecteddemand,especially in China. An indicator that reflects this increased demand is thereductionof inventoriesofcopperat theShanghaiwarehousesbyabout70percentsincethebeginningoftheyear5.Moreover,themanufacturingsectorinChinahasregisteredabetteroutputinJulyandAugust.
However, the recovery of the copper price is estimated to be offset by
expectations of a greater supply. According to the latest Bloomberg survey,severalanalystsestimateasupplysurplusin2014asaresultofastrongincreasein the production of copper concentrates associated with the operations ofnewmines and the expansionof existingmines to be implemented between2013and20156.Thegrowthrateinthesupplyofcopperconcentrateswouldbe significantly higher than the ones recorded during the previous 5 years(annual rates of 1.5 percent on average). In addition to this, investors’ non-commercial net positions in copper would have reached some equilibriumduring the month of August after the liquidations observed in the previousmonths.
4 The International Copper Study Group (ICSG) reported that the global market of copper recorded an unexpected deficit in May after seven months of surplus. Recent indicators show that this market hasremained tight between June and August due to China’s increased demand.
5 Glencore Xstrata estimates that inventories kept at customs warehouses would have dropped from over 1 million tons early in the year to about 300 thousand tons in August. The Wall Street Journal estimates that inventories at the Shanghai warehouses would have fallen from 1 million tons to 400 thousand tons. Moreover, Barclays estimates that China’s consumption of copper will expand 10 percent this year, a higher rate than the conservative rates estimated early this year.
6 After adjusting their estimates for possible operation disruptions, the ICSG estimates that mine production would grow at annual rates of 5.5 percent in 2013 and 2014.
Netpurchasecontracts(leftaxis) Spotprices(rightaxis)
25
15
5
-5
-15
-25
-35
3.9
3.7
3.5
3.3
3.1
2.9
2.7
2.5
N° o
f co
ntra
cts
(tho
usan
ds)
uS$/
poun
d
Source:Bloomberg.
Feb.12 Feb.13Apr.12 Apr.13Jun.12 Jun.13Aug.12 Aug.13Oct.12 Dec.12
Graph 48COPPER: NON-COMMERCIAL CONTRACTS
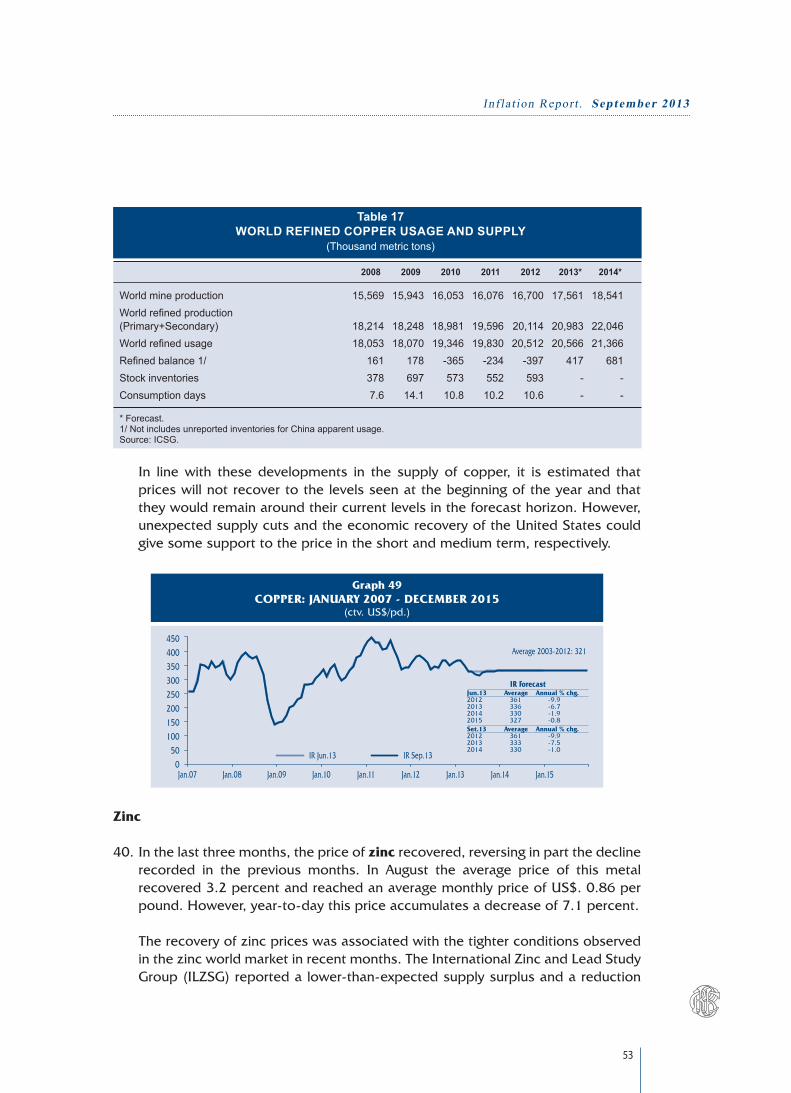
53
Inf la t ion Report . September 2013
In linewith thesedevelopments in the supply of copper, it is estimated thatpriceswillnotrecovertothelevelsseenatthebeginningoftheyearandthattheywouldremainaroundtheircurrentlevelsintheforecasthorizon.However,unexpectedsupplycutsandtheeconomicrecoveryoftheUnitedStatescouldgivesomesupporttothepriceintheshortandmediumterm,respectively.
Table 17WORLD REFINED COPPER USAGE AND SUPPLY
(Thousand metric tons) 2008 2009 2010 2011 2012 2013* 2014*
World mine production 15,569 15,943 16,053 16,076 16,700 17,561 18,541Worldrefinedproduction(Primary+Secondary) 18,214 18,248 18,981 19,596 20,114 20,983 22,046Worldrefinedusage 18,053 18,070 19,346 19,830 20,512 20,566 21,366Refinedbalance1/ 161 178 -365 -234 -397 417 681Stock inventories 378 697 573 552 593 - -Consumption days 7.6 14.1 10.8 10.2 10.6 - -
* Forecast.1/ Not includes unreported inventories for China apparent usage.Source: ICSG.
Graph 49COPPER: jANuARy 2007 - DECEMBER 2015
(ctv.US$/pd.)
IRJun.13 IRSep.13
IR Forecastjun.13 Average Annual % chg.2012 361 -9.92013 336 -6.72014 330 -1.92015 327 -0.8Set.13 Average Annual % chg.2012 361 -9.92013 333 -7.52014 330 -1.0
450400350300250200150100500Jan.07 Jan.08 Jan.09 Jan.10 Jan.11 Jan.12 Jan.13 Jan.14 Jan.15
Average2003-2012:321
zinc
40.Inthelastthreemonths,thepriceofzincrecovered,reversinginpartthedeclinerecorded in the previous months. In August the average price of this metalrecovered3.2percentandreachedanaveragemonthlypriceofUS$.0.86perpound.However,year-to-daythispriceaccumulatesadecreaseof7.1percent.
Therecoveryofzincpriceswasassociatedwiththetighterconditionsobservedinthezincworldmarketinrecentmonths.TheInternationalZincandLeadStudyGroup(ILZSG)reportedalower-than-expectedsupplysurplusandareduction
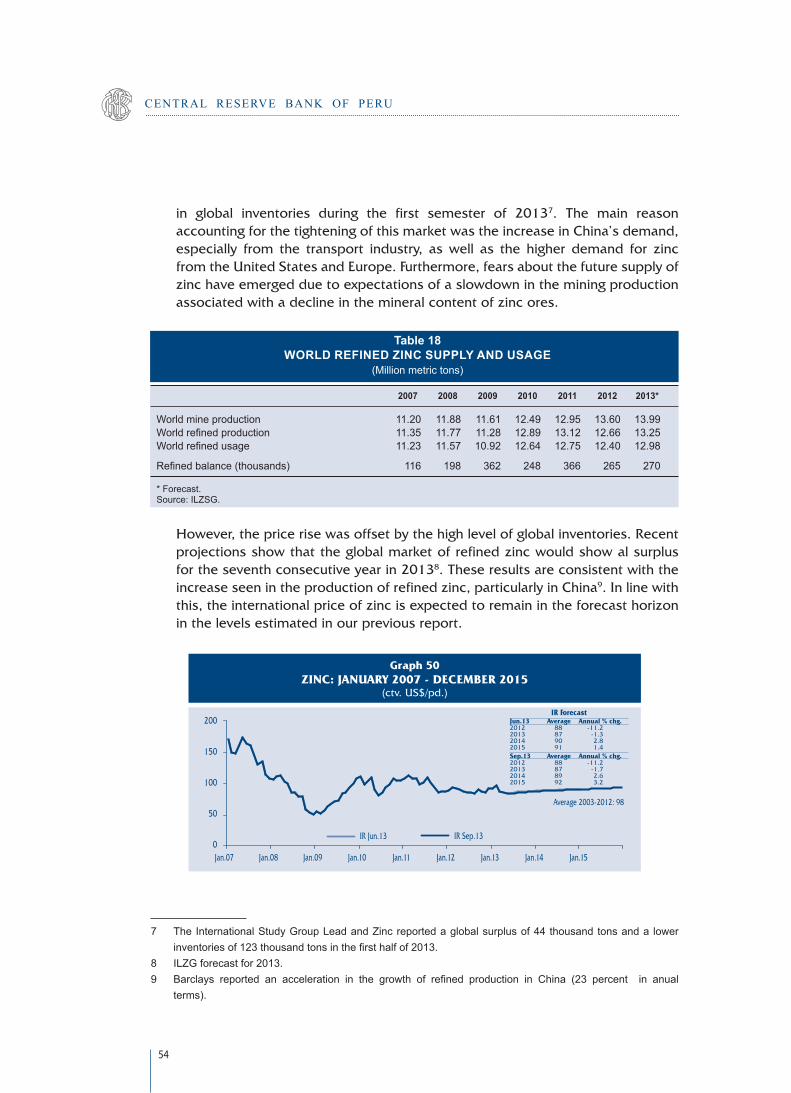
54
CENTRAL RESERVE BANK OF PERU
in global inventories during the first semester of 20137. The main reasonaccountingforthetighteningofthismarketwastheincreaseinChina’sdemand,especially from the transport industry, aswell as the higher demand for zincfromtheUnitedStatesandEurope.Furthermore,fearsaboutthefuturesupplyofzinchaveemergedduetoexpectationsofaslowdownintheminingproductionassociatedwithadeclineinthemineralcontentofzincores.
However,thepricerisewasoffsetbythehighlevelofglobalinventories.Recentprojectionsshowthattheglobalmarketofrefinedzincwouldshowalsurplusfortheseventhconsecutiveyearin20138.Theseresultsareconsistentwiththeincreaseseenintheproductionofrefinedzinc,particularlyinChina9.Inlinewiththis,theinternationalpriceofzincisexpectedtoremainintheforecasthorizoninthelevelsestimatedinourpreviousreport.
7 The International Study Group Lead and Zinc reported a global surplus of 44 thousand tons and a lower inventoriesof123thousandtonsinthefirsthalfof2013.
8 ILZG forecast for 2013.9 Barclays reported an acceleration in the growth of refined production in China (23 percent in anual
terms).
Table 18WORLD REFINED ZINC SUPPLY AND USAGE
(Million metric tons) 2007 2008 2009 2010 2011 2012 2013*
World mine production 11.20 11.88 11.61 12.49 12.95 13.60 13.99Worldrefinedproduction 11.35 11.77 11.28 12.89 13.12 12.66 13.25Worldrefinedusage 11.23 11.57 10.92 12.64 12.75 12.40 12.98
Refinedbalance(thousands) 116 198 362 248 366 265 270
* Forecast.Source: ILZSG.
Graph 50zINC: jANuARy 2007 - DECEMBER 2015
(ctv.US$/pd.)
IRJun.13 IRSep.13
200
150
100
50
0
IR Forecastjun.13 Average Annual % chg.2012 88 -11.22013 87 -1.32014 90 2.82015 91 1.4Sep.13 Average Annual % chg.2012 88 -11.22013 87 -1.72014 89 2.62015 92 3.2
Jan.07 Jan.08 Jan.09 Jan.10 Jan.11 Jan.12 Jan.13 Jan.14 Jan.15
Average2003-2012:98
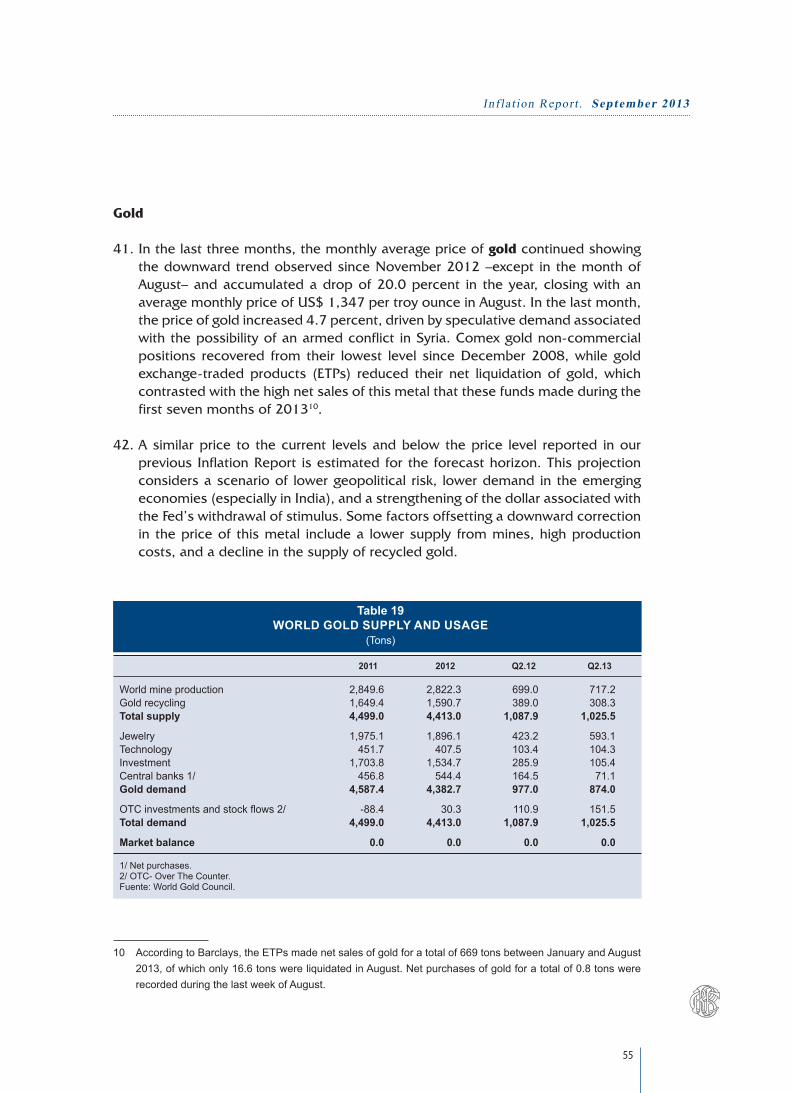
55
Inf la t ion Report . September 2013
Gold
41.Inthelastthreemonths,themonthlyaveragepriceofgoldcontinuedshowingthedownwardtrendobservedsinceNovember2012–except inthemonthofAugust–andaccumulatedadropof20.0percent in theyear,closingwithanaveragemonthlypriceofUS$1,347pertroyounceinAugust.Inthelastmonth,thepriceofgoldincreased4.7percent,drivenbyspeculativedemandassociatedwiththepossibilityofanarmedconflict inSyria.Comexgoldnon-commercialpositions recovered from their lowest level sinceDecember2008,while goldexchange-tradedproducts (ETPs) reduced their net liquidationof gold,whichcontrastedwiththehighnetsalesofthismetalthatthesefundsmadeduringthefirstsevenmonthsof201310.
42.Asimilarprice to thecurrent levelsandbelow theprice level reported inourpreviousInflationReport isestimatedfortheforecasthorizon.Thisprojectionconsidersascenarioof lowergeopolitical risk, lowerdemandintheemergingeconomies(especiallyinIndia),andastrengtheningofthedollarassociatedwiththeFed’swithdrawalofstimulus.Somefactorsoffsettingadownwardcorrectionin thepriceof thismetal includea lowersupply frommines,highproductioncosts,andadeclineinthesupplyofrecycledgold.
10 According to Barclays, the ETPs made net sales of gold for a total of 669 tons between January and August 2013, of which only 16.6 tons were liquidated in August. Net purchases of gold for a total of 0.8 tons were recorded during the last week of August.
Table 19WORLD GOLD SUPPLY AND USAGE
(Tons) 2011 2012 Q2.12 Q2.13
World mine production 2,849.6 2,822.3 699.0 717.2Gold recycling 1,649.4 1,590.7 389.0 308.3Total supply 4,499.0 4,413.0 1,087.9 1,025.5
Jewelry 1,975.1 1,896.1 423.2 593.1Technology 451.7 407.5 103.4 104.3Investment 1,703.8 1,534.7 285.9 105.4Central banks 1/ 456.8 544.4 164.5 71.1Gold demand 4,587.4 4,382.7 977.0 874.0
OTCinvestmentsandstockflows2/ -88.4 30.3 110.9 151.5Total demand 4,499.0 4,413.0 1,087.9 1,025.5
Market balance 0.0 0.0 0.0 0.0
1/ Net purchases. 2/ OTC- Over The Counter.Fuente: World Gold Council.
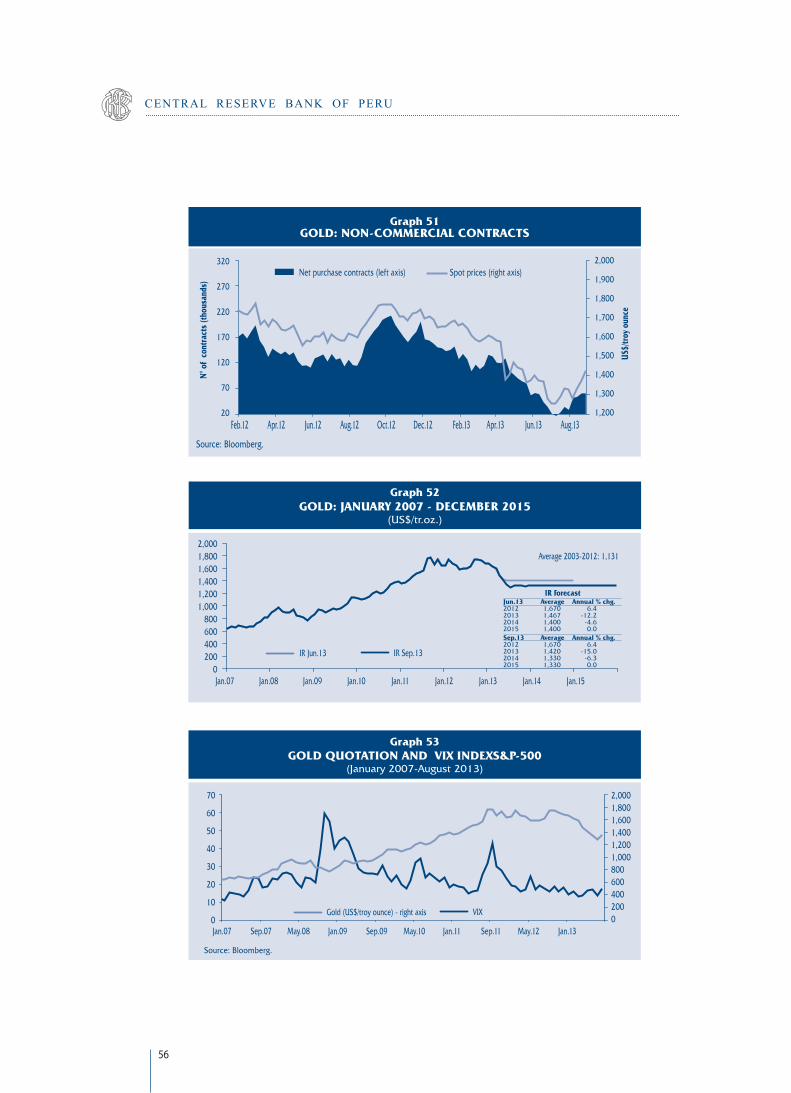
56
CENTRAL RESERVE BANK OF PERU
Graph 53GOLD QuOTATION AND VIX INDEXS&P-500
(January2007-August2013)
Gold(US$/troyounce)-rightaxis VIX
70
60
50
40
30
20
10
0
2,0001,8001,6001,4001,2001,0008006004002000
Jan.07 Jan.09 Jan.11 Jan.13Sep.07 Sep.09 Sep.11May.08 May.10 May.12
Source:Bloomberg.
Netpurchasecontracts(leftaxis) Spotprices(rightaxis)320
270
220
170
120
70
20
2,000
1,900
1,800
1,700
1,600
1,500
1,400
1,300
1,200
N° o
f co
ntra
cts
(tho
usan
ds)
uS$/
troy
oun
ce
Source:Bloomberg.
Feb.12 Feb.13Apr.12 Apr.13Jun.12 Jun.13Aug.12 Aug.13Oct.12 Dec.12
Graph 51GOLD: NON-COMMERCIAL CONTRACTS
IR Forecastjun.13 Average Annual % chg.2012 1,670 6.42013 1,467 -12.22014 1,400 -4.62015 1,400 0.0Sep.13 Average Annual % chg.2012 1,670 6.42013 1,420 -15.02014 1,330 -6.32015 1,330 0.0
Graph 52GOLD: jANuARy 2007 - DECEMBER 2015
(US$/tr.oz.)
IRJun.13 IRSep.13
2,0001,8001,6001,4001,2001,0008006004002000Jan.07 Jan.08 Jan.09 Jan.10 Jan.11 Jan.12 Jan.13 Jan.14 Jan.15
Average2003-2012:1,131
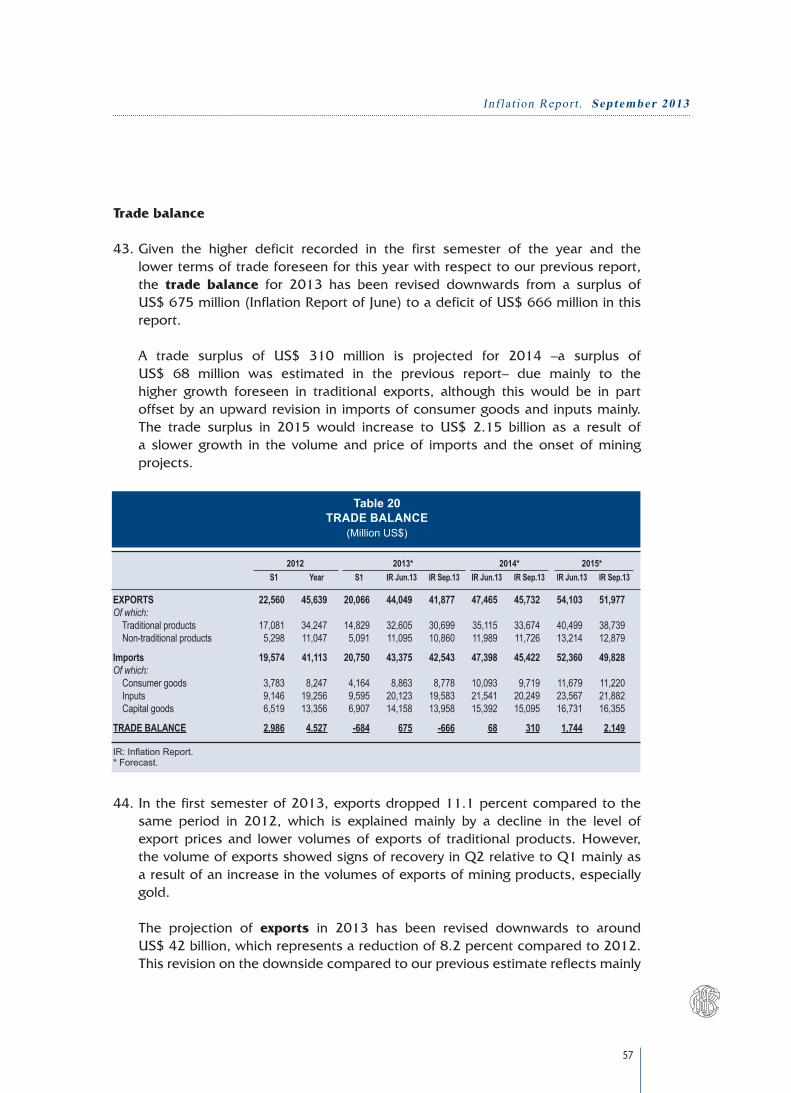
57
Inf la t ion Report . September 2013
Trade balance
43.Given the higher deficit recorded in the first semester of the year and thelowertermsoftradeforeseenforthisyearwithrespecttoourpreviousreport,the trade balance for 2013 has been revised downwards from a surplus ofUS$675million(InflationReportofJune)toadeficitofUS$666millioninthisreport.
A trade surplus of US$ 310 million is projected for 2014 –a surplus ofUS$ 68 million was estimated in the previous report– due mainly to thehigher growth foreseen in traditional exports, although this would be in partoffsetbyanupwardrevisioninimportsofconsumergoodsandinputsmainly.The trade surplus in 2015 would increase to US$ 2.15 billion as a result ofa slowergrowth in thevolumeandpriceof importsand theonsetofminingprojects.
Table 20TRADE BALANCE
(Million US$) 2012 2013* 2014* 2015* S1 Year S1 IR Jun.13 IR Sep.13 IR Jun.13 IR Sep.13 IR Jun.13 IR Sep.13 EXPORTS 22,560 45,639 20,066 44,049 41,877 47,465 45,732 54,103 51,977Of which: Traditional products 17,081 34,247 14,829 32,605 30,699 35,115 33,674 40,499 38,739 Non-traditional products 5,298 11,047 5,091 11,095 10,860 11,989 11,726 13,214 12,879
Imports 19,574 41,113 20,750 43,375 42,543 47,398 45,422 52,360 49,828Of which: Consumer goods 3,783 8,247 4,164 8,863 8,778 10,093 9,719 11,679 11,220 Inputs 9,146 19,256 9,595 20,123 19,583 21,541 20,249 23,567 21,882 Capital goods 6,519 13,356 6,907 14,158 13,958 15,392 15,095 16,731 16,355
TRADE BALANCE 2,986 4,527 -684 675 -666 68 310 1,744 2,149 IR:InflationReport.* Forecast.
44.Inthefirstsemesterof2013,exportsdropped11.1percentcomparedtothesame period in 2012, which is explainedmainly by a decline in the level ofexportpricesand lowervolumesofexportsof traditionalproducts.However,thevolumeofexportsshowedsignsofrecoveryinQ2relativetoQ1mainlyasaresultofanincreaseinthevolumesofexportsofminingproducts,especiallygold.
The projection of exports in 2013 has been revised downwards to around
US$42billion,whichrepresentsareductionof8.2percentcomparedto2012.Thisrevisiononthedownsidecomparedtoourpreviousestimatereflectsmainly

58
CENTRAL RESERVE BANK OF PERU
theslowergrowth foreseen in thevolumeofexportsdue to lowershipmentsoftraditionalproducts,mainlyfishmealandgold,andalsoduetolowerprices,especiallyinthecaseofexportsoftraditionalproducts.
2006 2007 2008 2009 2010 2011 2012 2013* 2014* 2015*
Graph 54EXPORTS OF GOODS: 2006-2015
(BillionUS$)
Memo:Totalexportsalsoincludesotherexports.*Forecast.
23.85.3
18.5
28.1 27.06.3 6.2
21.7 20.6
31.035.6
46.3 45.641.9
45.7
52.0
7.67.6
10.1 11.010.9
11.7
12.9
23.3 27.7 35.834.2 30.7
33.738.7
Traditional Non-traditional
Table 21TRADE BALANCE
(% change) 2012 2013* 2014* 2015* S1 Year S1 IR Jun.13 IR Sep.13 IR Jun.13 IR Sep.13 IR Jun.13 IR Sep.13 1. Value: Exports 3.2 -1.4 -11.1 -3.5 -8.2 7.8 9.2 14.0 13.7 Traditional products 0.0 -4.4 -13.2 -4.8 -10.4 7.7 9.7 15.3 15.0 Non-traditional products 14.6 9.1 -3.9 0.4 -1.7 8.1 8.0 10.2 9.8 Imports 10.2 11.2 6.0 5.5 3.5 9.3 6.8 10.5 9.7
2. Volume: Exports 6.1 2.2 -7.3 -0.1 -2.2 8.7 11.3 13.4 12.7 Traditional products 4.7 0.4 -8.9 -0.9 -2.4 10.1 14.3 15.8 15.5 Non-traditional products 11.3 9.0 -2.1 2.2 -1.2 5.6 5.7 7.1 6.6 Imports 7.3 9.5 8.0 6.7 5.4 8.9 7.1 9.2 8.8
3. Price: Exports -2.7 -3.3 -4.0 -3.4 -6.2 -0.9 -1.9 0.5 0.9 Traditional products -4.4 -4.6 -4.7 -4.0 -8.2 -2.2 -4.0 -0.4 -0.4 Non-traditional products 3.0 0.3 -2.0 -1.7 -0.5 2.3 2.1 2.9 3.1 Imports 2.6 1.7 -1.8 -1.2 -1.8 0.3 -0.3 1.2 0.8 IR:InflationReport.* Forecast.
Exportsin2014wouldamounttonearlyUS$46billion–lessthanestimatedinourJunereport–duetothe lowerpricesofexportsoftraditionalproducts. In2015exportswouldamounttoUS$52billion,whichwouldrepresentanominalgrowthof13.7percentrelativeto2014mainlyasaresultoftheeffectofthe
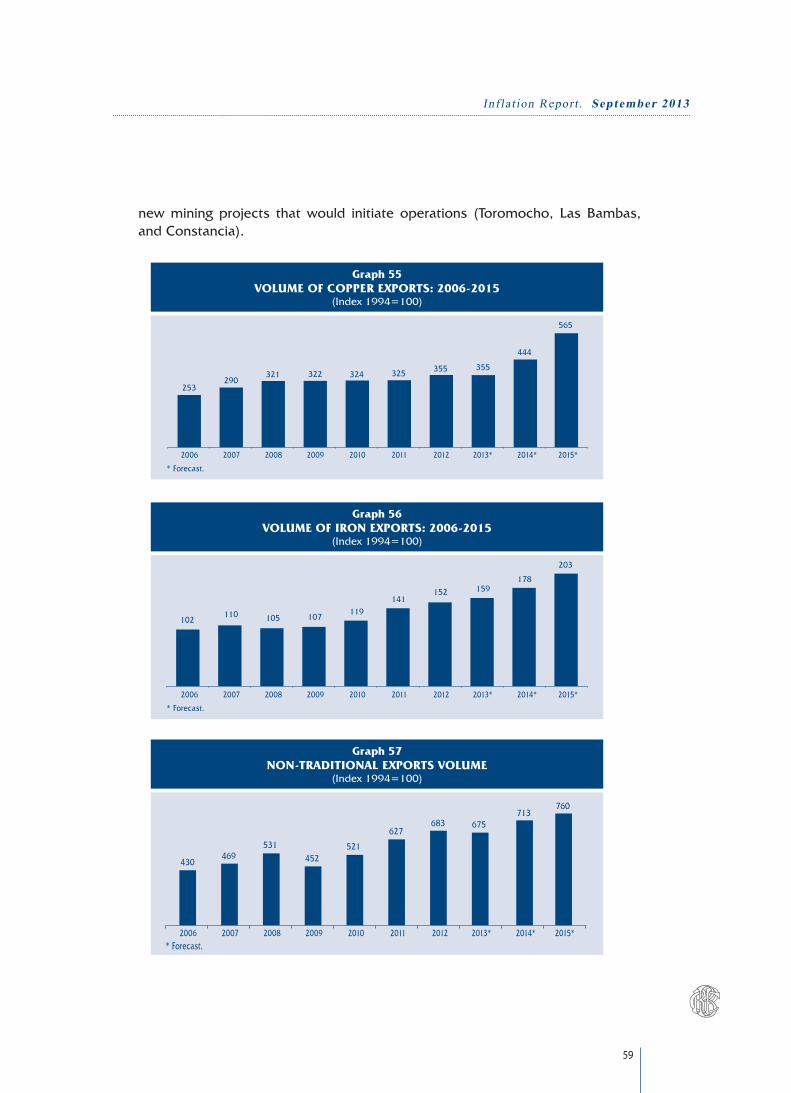
59
Inf la t ion Report . September 2013
Graph 55VOLuME OF COPPER EXPORTS: 2006-2015
(Index1994=100)
*Forecast.
253290
321 322 324 325 355 355
444
565
2013* 2014* 2015*2006 2007 2008 2009 2010 2011 2012
Graph 56VOLuME OF IRON EXPORTS: 2006-2015
(Index1994=100)
*Forecast.
102110 105 107
119141
152 159178
203
2013* 2014* 2015*2006 2007 2008 2009 2010 2011 2012
Graph 57NON-TRADITIONAL EXPORTS VOLuME
(Index1994=100)
*Forecast.
430469
531452
521
627683 675
713760
2013* 2014* 2015*2006 2007 2008 2009 2010 2011 2012
newmining projects thatwould initiate operations (Toromocho, LasBambas,andConstancia).
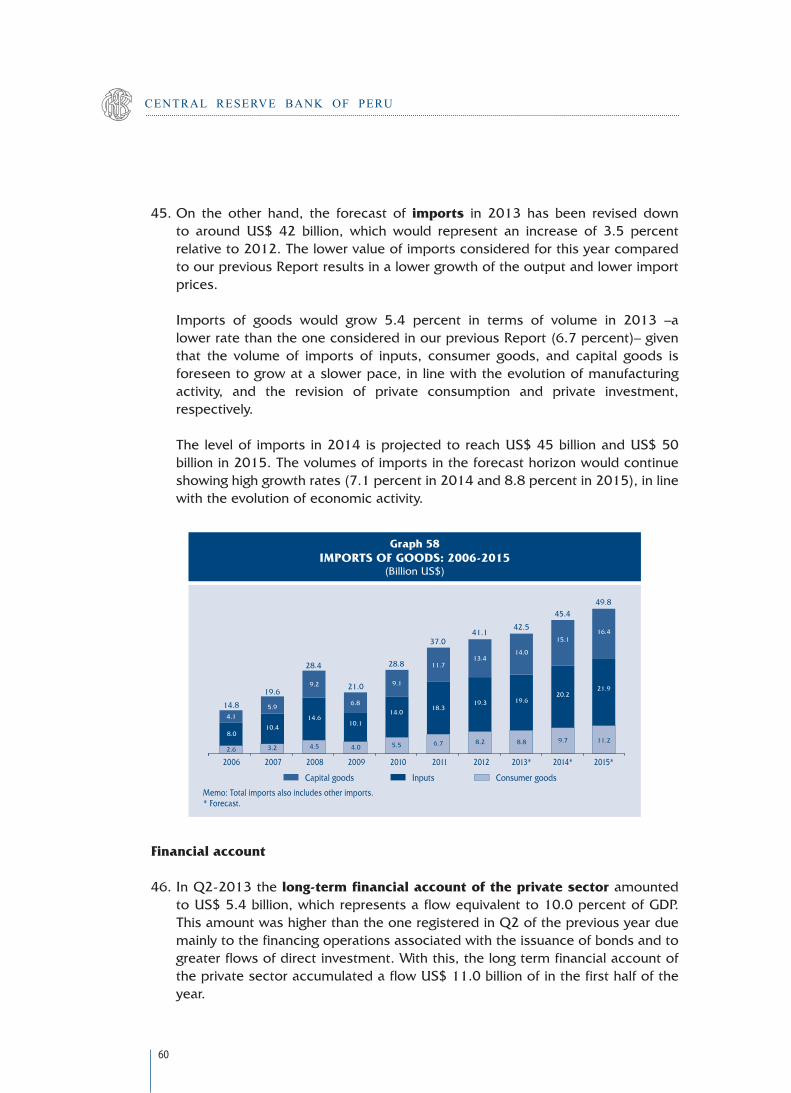
60
CENTRAL RESERVE BANK OF PERU
45.On the other hand, the forecast of imports in 2013 has been revised downto aroundUS$ 42 billion, whichwould represent an increase of 3.5 percentrelativeto2012.ThelowervalueofimportsconsideredforthisyearcomparedtoourpreviousReportresultsinalowergrowthoftheoutputandlowerimportprices.
Imports of goods would grow 5.4 percent in terms of volume in 2013 –alowerratethantheoneconsideredinourpreviousReport(6.7percent)–giventhat the volumeof imports of inputs, consumer goods, and capital goods isforeseentogrowataslowerpace,inlinewiththeevolutionofmanufacturingactivity, and the revision of private consumption and private investment,respectively.
The levelof imports in2014isprojectedtoreachUS$45billionandUS$50billionin2015.Thevolumesofimportsintheforecasthorizonwouldcontinueshowinghighgrowthrates(7.1percentin2014and8.8percentin2015),inlinewiththeevolutionofeconomicactivity.
2006 2007 2008 2009 2010 2011 2012 2013* 2014* 2015*
Memo:Totalimportsalsoincludesotherimports.*Forecast.
Graph 58IMPORTS OF GOODS: 2006-2015
(BillionUS$)
19.6
28.4
21.0
14.8
2.6
8.0
4.0
10.1
4.5
14.6
3.2
10.4
28.8
5.5
14.0
Capitalgoods ConsumergoodsInputs
37.041.1
42.5
45.449.8
6.7 8.2 8.8 9.7 11.2
18.319.3 19.6
20.221.9
4.15.9
9.2
6.8
9.1
11.713.4
14.0
15.116.4
Financial account
46.InQ2-2013thelong-term financial account of the private sectoramountedtoUS$5.4billion,whichrepresentsaflowequivalentto10.0percentofGDP.ThisamountwashigherthantheoneregisteredinQ2ofthepreviousyearduemainlytothefinancingoperationsassociatedwiththeissuanceofbondsandtogreaterflowsofdirectinvestment.Withthis,thelongtermfinancialaccountoftheprivatesectoraccumulatedaflowUS$11.0billionofinthefirsthalfoftheyear.
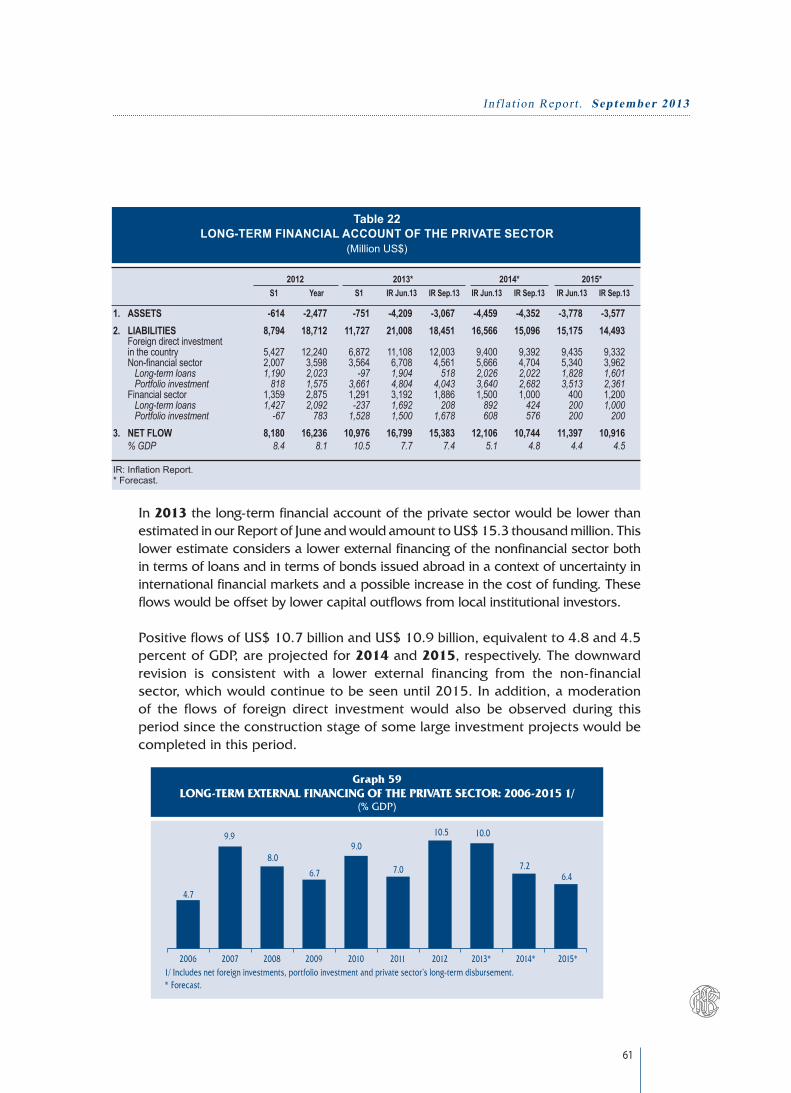
61
Inf la t ion Report . September 2013
In2013thelong-termfinancialaccountoftheprivatesectorwouldbelowerthanestimatedinourReportofJuneandwouldamounttoUS$15.3thousandmillion.Thislowerestimateconsidersalowerexternalfinancingofthenonfinancialsectorbothintermsofloansandintermsofbondsissuedabroadinacontextofuncertaintyininternationalfinancialmarketsandapossibleincreaseinthecostoffunding.Theseflowswouldbeoffsetbylowercapitaloutflowsfromlocalinstitutionalinvestors.
PositiveflowsofUS$10.7billionandUS$10.9billion,equivalentto4.8and4.5percentofGDP,areprojectedfor2014and2015,respectively.Thedownwardrevision is consistent with a lower external financing from the non-financialsector,whichwouldcontinuetobeseenuntil2015.Inaddition,amoderationof the flows of foreign direct investmentwould also be observed during thisperiodsincetheconstructionstageofsomelargeinvestmentprojectswouldbecompletedinthisperiod.
Table 22LONG-TERM FINANCIAL ACCOUNT OF THE PRIVATE SECTOR
(Million US$) 2012 2013* 2014* 2015* S1 Year S1 IR Jun.13 IR Sep.13 IR Jun.13 IR Sep.13 IR Jun.13 IR Sep.13 1. ASSETS -614 -2,477 -751 -4,209 -3,067 -4,459 -4,352 -3,778 -3,5772. LIABILITIES 8,794 18,712 11,727 21,008 18,451 16,566 15,096 15,175 14,493 Foreign direct investment in the country 5,427 12,240 6,872 11,108 12,003 9,400 9,392 9,435 9,332 Non-financialsector 2,007 3,598 3,564 6,708 4,561 5,666 4,704 5,340 3,962 Long-term loans 1,190 2,023 -97 1,904 518 2,026 2,022 1,828 1,601 Portfolio investment 818 1,575 3,661 4,804 4,043 3,640 2,682 3,513 2,361 Financial sector 1,359 2,875 1,291 3,192 1,886 1,500 1,000 400 1,200 Long-term loans 1,427 2,092 -237 1,692 208 892 424 200 1,000 Portfolio investment -67 783 1,528 1,500 1,678 608 576 200 2003. NET FLOW 8,180 16,236 10,976 16,799 15,383 12,106 10,744 11,397 10,916 % GDP 8.4 8.1 10.5 7.7 7.4 5.1 4.8 4.4 4.5 IR:InflationReport.* Forecast.
Graph 59LONG-TERM EXTERNAL FINANCING OF ThE PRIVATE SECTOR: 2006-2015 1/
(%GDP)
1/Includesnetforeigninvestments,portfolioinvestmentandprivatesector’slong-termdisbursement.*Forecast.
4.7
9.9
8.0
6.7
9.0
7.0
10.5 10.0
7.26.4
2013* 2014* 2015*2006 2007 2008 2009 2010 2011 2012
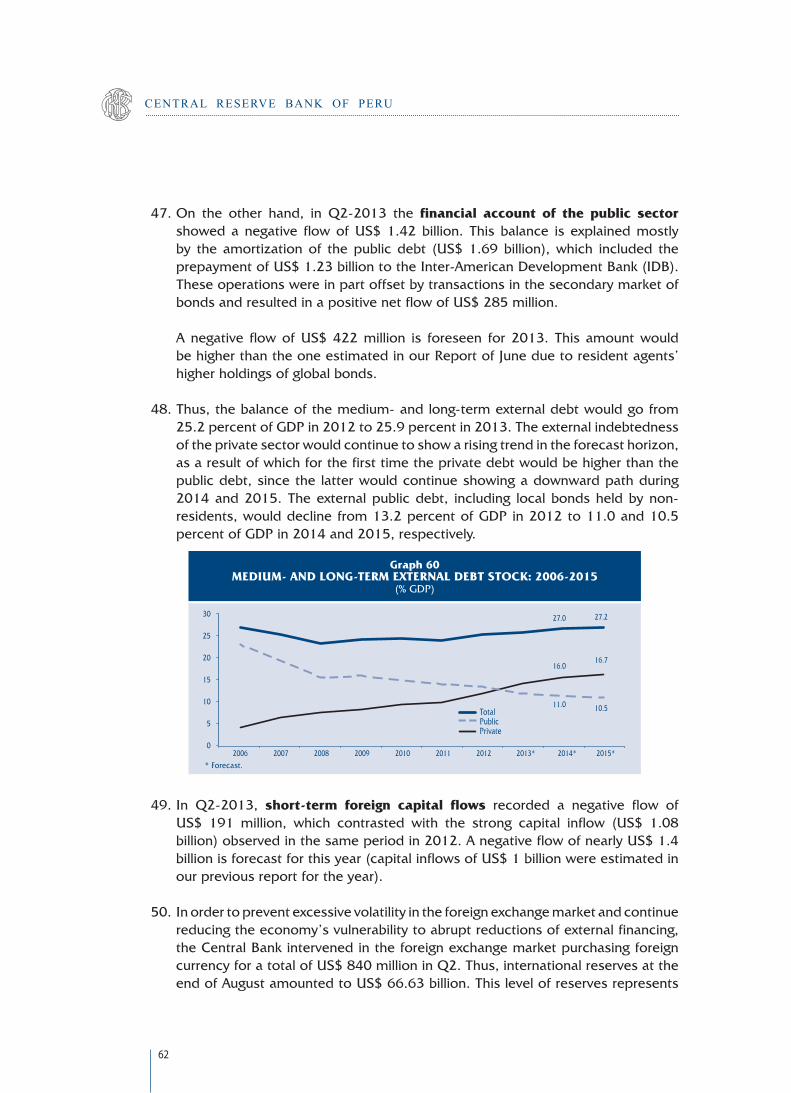
62
CENTRAL RESERVE BANK OF PERU
47.On the other hand, inQ2-2013 the financial account of the public sectorshowedanegative flowofUS$1.42billion. This balance is explainedmostlyby the amortizationof thepublicdebt (US$1.69billion),which included theprepaymentofUS$1.23billiontotheInter-AmericanDevelopmentBank(IDB).TheseoperationswereinpartoffsetbytransactionsinthesecondarymarketofbondsandresultedinapositivenetflowofUS$285million.
Anegative flowofUS$422million is foreseen for2013.This amountwouldbehigherthantheoneestimatedinourReportofJuneduetoresidentagents’higherholdingsofglobalbonds.
48.Thus,thebalanceofthemedium-andlong-termexternaldebtwouldgofrom25.2percentofGDPin2012to25.9percentin2013.Theexternalindebtednessoftheprivatesectorwouldcontinuetoshowarisingtrendintheforecasthorizon,asaresultofwhichforthefirsttimetheprivatedebtwouldbehigherthanthepublicdebt,sincethe latterwouldcontinueshowingadownwardpathduring2014and2015.Theexternalpublicdebt, including localbondsheldbynon-residents,woulddeclinefrom13.2percentofGDPin2012to11.0and10.5percentofGDPin2014and2015,respectively.
Graph 60MEDIuM- AND LONG-TERM EXTERNAL DEBT STOCK: 2006-2015
(%GDP)
2007 2009 2011 2013*2006 2010 2012 2014* 2015*
27.0
16.0
11.0
27.2
16.7
10.5
2008
30
25
20
15
10
5
0
TotalPublicPrivate
*Forecast.
49.In Q2-2013, short-term foreign capital flows recorded a negative flow ofUS$ 191 million, which contrasted with the strong capital inflow (US$ 1.08billion)observedinthesameperiodin2012.AnegativeflowofnearlyUS$1.4billionisforecastforthisyear(capitalinflowsofUS$1billionwereestimatedinourpreviousreportfortheyear).
50.Inordertopreventexcessivevolatilityintheforeignexchangemarketandcontinuereducingtheeconomy’svulnerabilitytoabruptreductionsofexternalfinancing,theCentralBankintervenedintheforeignexchangemarketpurchasingforeigncurrencyforatotalofUS$840millioninQ2.Thus,internationalreservesattheendofAugustamountedtoUS$66.63billion.Thislevelofreservesrepresents
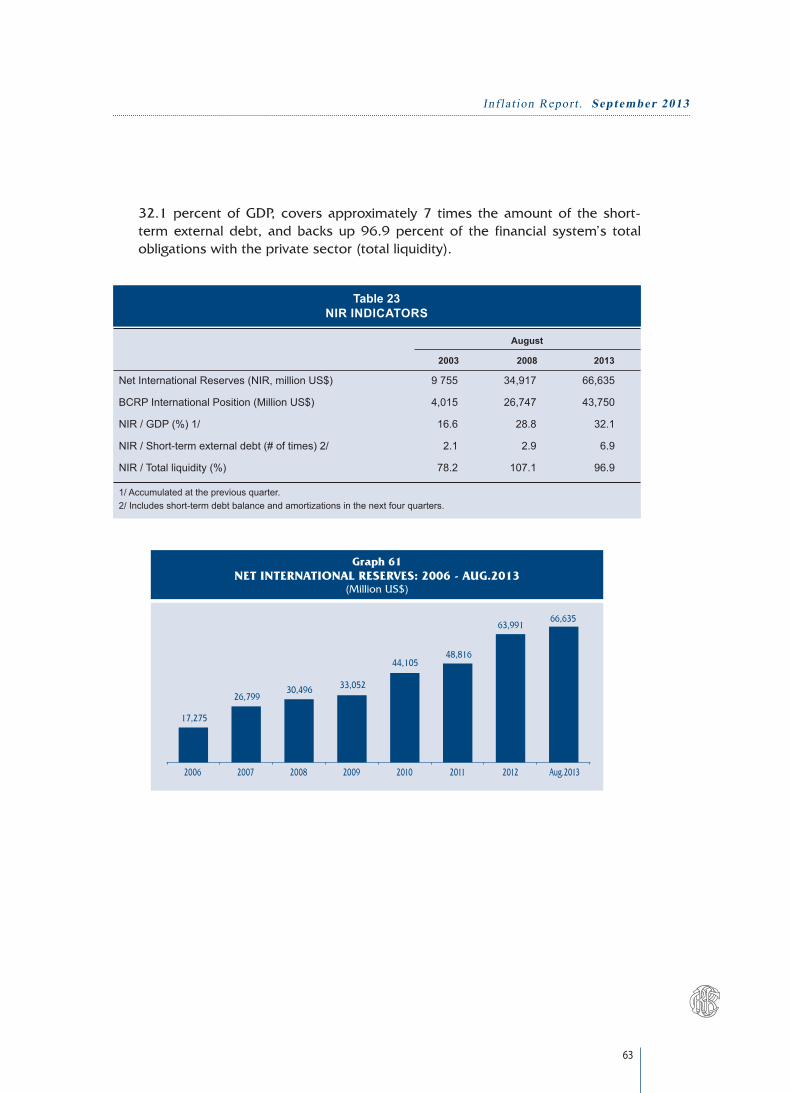
63
Inf la t ion Report . September 2013
32.1percentofGDP,coversapproximately7 times theamountof the short-termexternaldebt, andbacksup96.9percentof the financial system’s totalobligationswiththeprivatesector(totalliquidity).
Graph 61NET INTERNATIONAL RESERVES: 2006 - AuG.2013
(MillionUS$)
17,275
26,79930,496 33,052
44,10548,816
63,99166,635
2006 2007 2008 2009 2010 2011 2012 Aug.2013
Table 23NIR INDICATORS
August
2003 2008 2013
Net International Reserves (NIR, million US$) 9 755 34,917 66,635 BCRP International Position (Million US$) 4,015 26,747 43,750 NIR / GDP (%) 1/ 16.6 28.8 32.1 NIR / Short-term external debt (# of times) 2/ 2.1 2.9 6.9 NIR / Total liquidity (%) 78.2 107.1 96.9
1/ Accumulated at the previous quarter.2/ Includes short-term debt balance and amortizations in the next four quarters.

64
CENTRAL RESERVE BANK OF PERU
IV. Public Finances51.Theeconomicbalanceinthefirsthalfof2013showsalowersurplusthanthe
oneregisteredinthesameperiodin2012(4.9ofGDPvs.7.0percentofGDP),whichreflectsthelowercurrentrevenuesofthegeneralgovernment(down0.8percentage point) in a context of lower terms of trade and a slower growthofeconomicactivity andhighernon-financial expenditure (up1.9percentagepoints),especiallycurrentnon-financialexpenditure.Asaresult,thesurplusofthelastfourquartersasofJuneamountedto1.3percentofGDP,alowerbalancethantheonerecordedatend-2012(2.2percentofGDP).
Table 24NON FINANCIAL PUBLIC SECTOR
(% GDP) 2012 2013* 2014* 2015* S1 Year S1 IR Jun.13 IR Sep.13 IR Jun.13 IR Sep.13 IR Jun.13 IR Sep.13 1. General government current revenues 1/ 22.5 21.6 22.1 21.3 21.3 21.4 21.3 21.5 21.4 Real % change 6.2 7.2 1.8 3.5 2.4 6.8 6.6 7.5 7.5
2. General government non-financial expenditure 2/ 15.0 18.6 16.3 19.6 20.0 19.8 20.2 20.0 20.4 Real % change 2.2 8.1 12.8 10.4 11.5 7.5 7.6 8.2 8.1 Of which: Current 11.3 13.1 12.1 13.7 13.9 13.5 13.6 13.3 13.4 Real % change -0.7 5.4 10.5 9.9 10.1 4.5 4.3 5.2 5.1 Gross capital formation 3.5 5.2 4.0 5.4 5.7 5.7 6.0 6.2 6.4 Real % change 16.1 15.9 19.1 9.5 13.5 12.3 12.2 15.4 15.4
3. Others 0.5 0.3 0.3 0.0 0.1 -0.1 -0.1 -0.1 -0.14. Primary balance (1-2+3) 8.0 3.2 6.1 1.7 1.4 1.5 1.0 1.3 0.95. Interests 1.0 1.1 1.1 1.0 1.0 0.9 0.9 0.8 0.96. Overall Balance 7.0 2.2 4.9 0.7 0.4 0.6 0.1 0.5 0.0 Memo: (billion S/.):1. General government current revenues 58 114 61 120 119 131 131 144 1432.Generalgovernmentnon-financialexpenditure 39 98 45 111 112 122 124 134 1363. Nominal GDP 259 526 275 565 562 614 613 671 669 1/ The central government includes the ministries, national universities, public agencies and regional governments. The general
government has a wider coverage that includes the central government, social security, regulators and supervisors, government charity organizations and local governments.
2/ Includes accrued payments by Net payments of the Fuel Price Stabilization Fund. * Forecast.IR:InflationReport.
Thefiscalsurplushasbeenreviseddownintheforecasthorizonandisestimatedtoconvergetoanileconomicbalancein2015,inlinewiththescenarioforeseenintheRevisedMultiannualMacroeconomicFrameworkfor2013-2016.
Theeconomicbalanceof0.7percentofGDPestimated for2013 inour JuneReporthasbeenreviseddownto0.4percentofGDPgiventhatalowergrowth

65
Inf la t ion Report . September 2013
ofrealrevenueisexpectedduetothedownwardrevisionofGDPgrowthandthe lower export prices foreseen, aswell as due to the strong dynamism ofinvestmentinthegeneralgovernment.
Althoughtheforecastsonthegrowthofrevenueandexpenditureinthegeneralgovernment for2014and2015are in linewith the forecastsofourpreviousreport,asapercentageofGDPthesevariableshavebeenreviseddownfrom0.6to0.1percentofGDPandfrom0.5to0percentofGDP,respectively.
It is worth pointing out that the Financial Equilibrium Law passed this yearestablishesthattheeconomicbalanceshouldshownodeficit,whichreplacesthe macro fiscal rules of the Fiscal Transparency and Accountability Act thatestablished that the fiscal deficit should be lower than 1 percent of GDPand that the maximum increase in real expenditure in consumption was 4percent.
Graph 62ECONOMIC BALANCE OF ThE NON-FINANCIAL
PuBLIC SECTOR: 2006-2015(%GDP)
*Forecast.
2006
2.3
2007
2.9
2008
2.4
2009
-1.3
2010
-0.2
2011
2.0
2012
2.2
2013* 2014* 2015*
0.40.1 0.0
Evolution of tax revenues
52.In the first half of 2013 the current revenues of the general governmentamountedto22.1percentofGDP,afigure0.4percentagepointslowerthantherevenuesobtainedinthesameperiodin2012,whichrepresentsarealgrowthof1.8percent in theserevenues.Thisbalanceresults fromaslightgrowthoftaxrevenuesinrealterms(0.6percent)asaresultofwhichtaxrevenueswentfromrepresenting17percentofGDP in the firsthalfof2012torepresenting16.6percentofGDP in the firsthalfof2013. Incontrast,asapercentageofGDP,non-tax revenues increased from5.4percentofGDP in the first halfof2012to5.6percentofGDPin2013.Theincreaseregisteredinsocialsecuritycontributionswith a real growth of 12.3 percent stands out, offset by a realcontractionofrevenuesfromoilroyalties,miningroyalties,andtheSpecialMiningLevy.
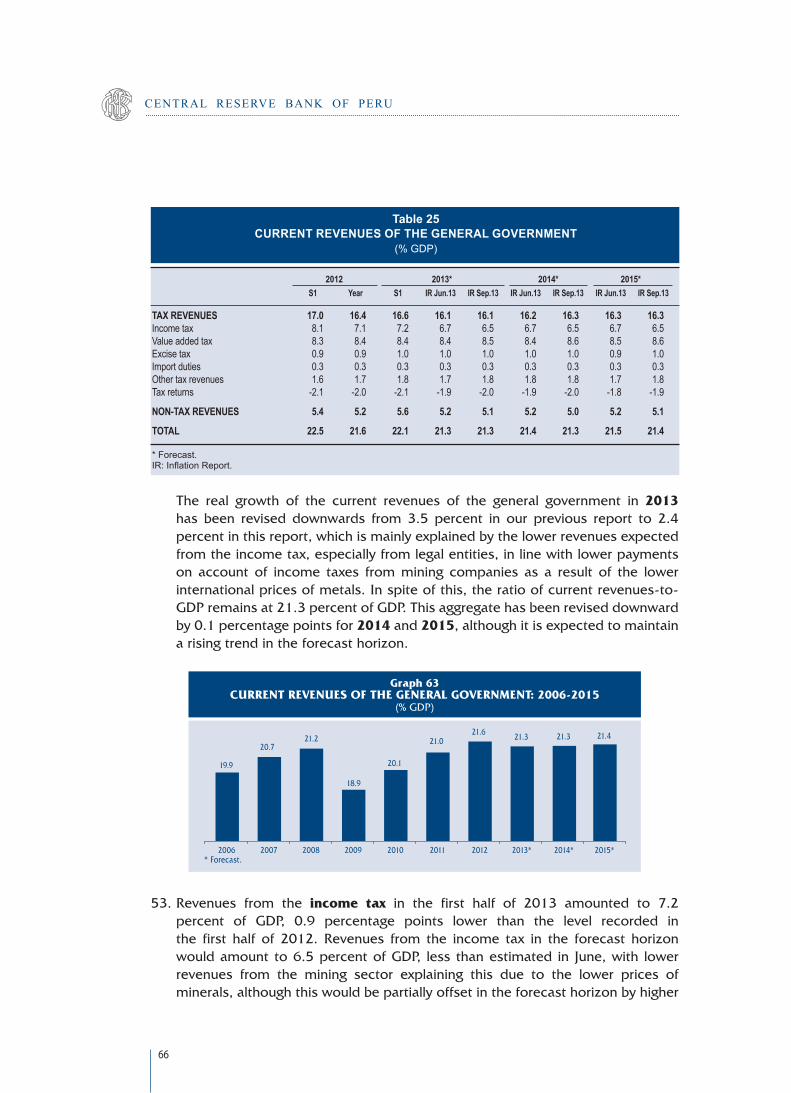
66
CENTRAL RESERVE BANK OF PERU
The real growth of the current revenues of the general government in 2013has been revised downwards from3.5 percent in our previous report to 2.4percentinthisreport,whichismainlyexplainedbythelowerrevenuesexpectedfromtheincometax,especiallyfromlegalentities,inlinewithlowerpaymentson account of income taxes frommining companies as a result of the lowerinternationalpricesofmetals.Inspiteofthis,theratioofcurrentrevenues-to-GDPremainsat21.3percentofGDP.Thisaggregatehasbeenreviseddownwardby0.1percentagepointsfor2014and2015,althoughitisexpectedtomaintainarisingtrendintheforecasthorizon.
Table 25CURRENT REVENUES OF THE GENERAL GOVERNMENT
(% GDP) 2012 2013* 2014* 2015* S1 Year S1 IR Jun.13 IR Sep.13 IR Jun.13 IR Sep.13 IR Jun.13 IR Sep.13 TAX REVENUES 17.0 16.4 16.6 16.1 16.1 16.2 16.3 16.3 16.3Income tax 8.1 7.1 7.2 6.7 6.5 6.7 6.5 6.7 6.5Value added tax 8.3 8.4 8.4 8.4 8.5 8.4 8.6 8.5 8.6Excise tax 0.9 0.9 1.0 1.0 1.0 1.0 1.0 0.9 1.0Import duties 0.3 0.3 0.3 0.3 0.3 0.3 0.3 0.3 0.3Other tax revenues 1.6 1.7 1.8 1.7 1.8 1.8 1.8 1.7 1.8Tax returns -2.1 -2.0 -2.1 -1.9 -2.0 -1.9 -2.0 -1.8 -1.9
NON-TAX REVENUES 5.4 5.2 5.6 5.2 5.1 5.2 5.0 5.2 5.1
TOTAL 22.5 21.6 22.1 21.3 21.3 21.4 21.3 21.5 21.4 * Forecast.IR:InflationReport.
Graph 63CuRRENT REVENuES OF ThE GENERAL GOVERNMENT: 2006-2015
(%GDP)
*Forecast.2006 2007 2008 2009 2010 2011 2012 2013* 2014* 2015*
19.9
20.721.2
18.9
20.1
21.021.6 21.3 21.3 21.4
53.Revenues from the income tax in the first half of 2013 amounted to 7.2percent of GDP, 0.9 percentage points lower than the level recorded inthe first half of 2012. Revenues from the income tax in the forecast horizonwouldamount to6.5percentofGDP, less thanestimated in June,with lowerrevenues from the mining sector explaining this due to the lower prices ofminerals,althoughthiswouldbepartiallyoffsetintheforecasthorizonbyhigher

67
Inf la t ion Report . September 2013
incometaxes inacontext inwhichagreatergrowthof formalemployment isexpected.
Graph 64INCOME TAX: 2006-2015
(%GDP)
*Forecast.2006 2007 2008 2009 2010 2011 2012 2013* 2014* 2015*
6.16.8
6.5
5.35.9
6.9 7.16.5 6.5 6.5
Graph 65VALuE ADDED TAX: 2006-2015
(%GDP)
*Forecast.2006 2007 2008 2009 2010 2011 2012 2013* 2014* 2015*
7.1 7.58.5
7.7 8.2, 8.3 8.4 8.5 8.6 8.6
54.Ontheotherhand,inthefirsthalfof2013,revenuesfromthevalue-added tax(VAT)increased4.7percentinrealtermsasaresultofa7.6percentincreaseinrevenuesfromthedomesticVATanda1.0percentincreaseinrevenuesfromtheexternalVAT.
In2013revenuesfromtheVATareexpectedtoincreaseto8.5pointsofGDP,whichrepresentsagrowthof5.2percentinrealterms.Intheperiod2014-2015theserevenuesareexpectedtoincreaseby0.1percentagepointsofGDP,whichconsiderstheeffectofmeasuresimplementedtobroadenthetaxbase.
55.In the first semesterof2013, revenues from theexcise tax (ISC) recordedapositive growth rate of 11.5 percent in real terms. This increase was drivenprimarilybythegrowthoftheexcisetaxonfuels(25.0percentinrealterms),whiletheexcisetaxonother itemsshowedanincreaseof1.8percent inrealterms.
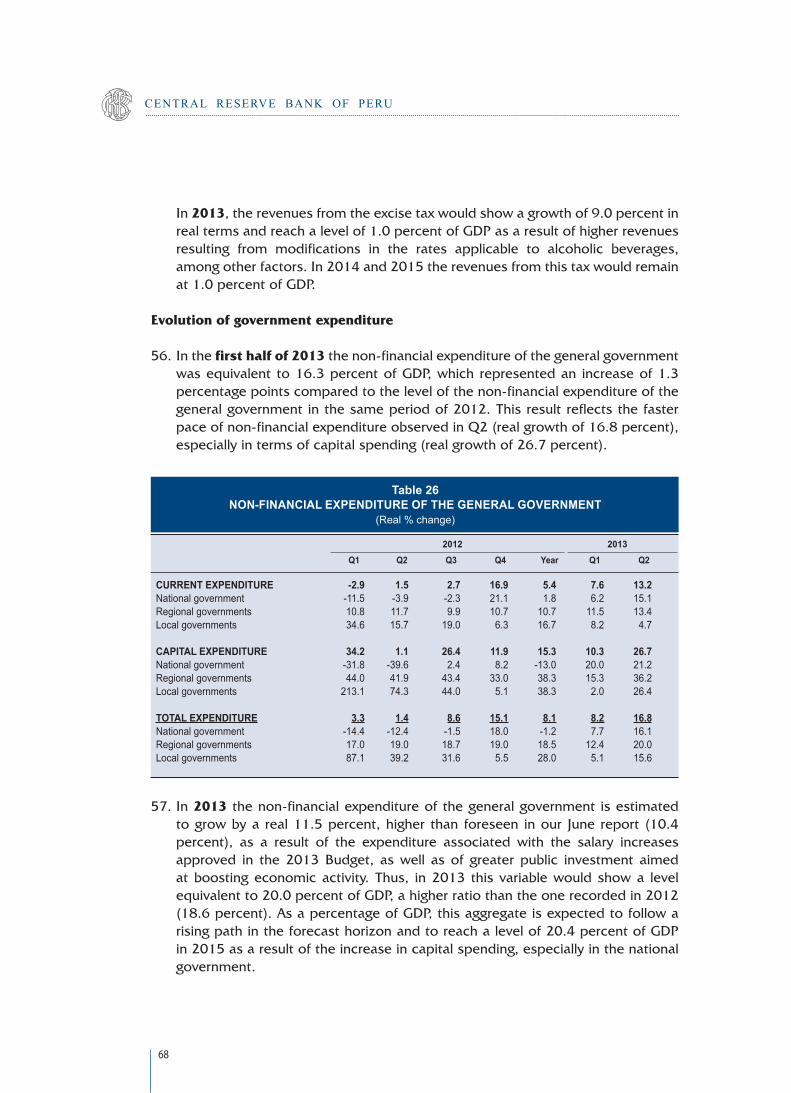
68
CENTRAL RESERVE BANK OF PERU
In2013,therevenuesfromtheexcisetaxwouldshowagrowthof9.0percentinrealtermsandreachalevelof1.0percentofGDPasaresultofhigherrevenuesresulting from modifications in the rates applicable to alcoholic beverages,amongotherfactors.In2014and2015therevenuesfromthistaxwouldremainat1.0percentofGDP.
Evolution of government expenditure
56.Inthefirst half of 2013thenon-financialexpenditureofthegeneralgovernmentwasequivalent to16.3percentofGDP,which representedan increaseof1.3percentagepointscomparedtothelevelofthenon-financialexpenditureofthegeneralgovernmentinthesameperiodof2012.Thisresultreflectsthefasterpaceofnon-financialexpenditureobservedinQ2(realgrowthof16.8percent),especiallyintermsofcapitalspending(realgrowthof26.7percent).
Table 26NON-FINANCIAL EXPENDITURE OF THE GENERAL GOVERNMENT
(Real % change)
2012 2013 Q1 Q2 Q3 Q4 Year Q1 Q2
CURRENT EXPENDITURE -2.9 1.5 2.7 16.9 5.4 7.6 13.2National government -11.5 -3.9 -2.3 21.1 1.8 6.2 15.1Regional governments 10.8 11.7 9.9 10.7 10.7 11.5 13.4Local governments 34.6 15.7 19.0 6.3 16.7 8.2 4.7 CAPITAL EXPENDITURE 34.2 1.1 26.4 11.9 15.3 10.3 26.7National government -31.8 -39.6 2.4 8.2 -13.0 20.0 21.2Regional governments 44.0 41.9 43.4 33.0 38.3 15.3 36.2Local governments 213.1 74.3 44.0 5.1 38.3 2.0 26.4 TOTAL EXPENDITURE 3.3 1.4 8.6 15.1 8.1 8.2 16.8National government -14.4 -12.4 -1.5 18.0 -1.2 7.7 16.1Regional governments 17.0 19.0 18.7 19.0 18.5 12.4 20.0Local governments 87.1 39.2 31.6 5.5 28.0 5.1 15.6
57.In2013 thenon-financialexpenditureofthegeneralgovernment isestimatedtogrowbya real11.5percent,higher than foreseen inour Junereport (10.4percent), as a result of the expenditure associated with the salary increasesapproved in the2013Budget, aswell as of greater public investment aimedatboostingeconomicactivity.Thus, in2013 this variablewould showa levelequivalentto20.0percentofGDP,ahigherratiothantheonerecordedin2012(18.6percent).AsapercentageofGDP,thisaggregateisexpectedtofollowarisingpathintheforecasthorizonandtoreachalevelof20.4percentofGDPin2015asaresultoftheincreaseincapitalspending,especiallyinthenationalgovernment.

69
Inf la t ion Report . September 2013
Table 27NON-FINANCIAL EXPENDITURE OF THE GENERAL GOVERNMENT
(% GDP) 2012 2013* 2014* 2015* S1 Year S1 IR Jun.13 IR Sep.13 IR Jun.13 IR Sep.13 IR Jun.13 IR Sep.13 CURRENT EXPENDITURE 11.3 13.1 12.1 13.7 13.9 13.5 13.6 13.3 13.4National government 7.4 8.7 7.9 9.1 9.3 8.9 9.1 8.8 8.9Regional governments 2.3 2.6 2.5 2.7 2.7 2.7 2.7 2.7 2.7Local governments 1.6 1.8 1.7 1.9 1.9 1.9 1.8 1.8 1.7 CAPITAL EXPENDITURE 3.6 5.5 4.2 5.9 6.1 6.3 6.6 6.8 7.0National government 1.2 1.9 1.4 1.9 2.2 2.2 2.5 2.3 2.6Regional governments 0.8 1.3 1.0 1.4 1.4 1.5 1.5 1.6 1.6Local governments 1.6 2.4 1.8 2.5 2.5 2.7 2.6 2.9 2.8 TOTAL EXPENDITURE 15.0 18.6 16.3 19.6 20.0 19.8 20.2 20.0 20.4National government 8.6 10.6 9.4 11.1 11.5 11.1 11.5 11.1 11.5Regional governments 3.1 3.9 3.5 4.1 4.2 4.2 4.2 4.3 4.3Local governments 3.2 4.2 3.5 4.4 4.4 4.5 4.4 4.7 4.5 * Forecast.IR:InflationReport.
Graph 66NON-FINANCIAL EXPENDITuRE OF ThE GENERAL GOVERNMENT: 2006-2015
(Real%change)
*Forecast.2006
7.7
2007
9.9
2008
11.1
2009
10.9
2010
11.6
2011
1.7
2012 2015*
8.1 8.1
2013* 2014*
11.5
7.6
Graph 67NON-FINANCIAL CuRRENT EXPENDITuRE
OF ThE GENERAL GOVERNMENT: 2006-2015(Real%change)
*Forecast.2006
4.3
2007
8.3
2008
5.7
2009
3.4
2010
8.3
2011
6.9
2012
5.4
2013* 2014* 2015*
10.1
4.35.1
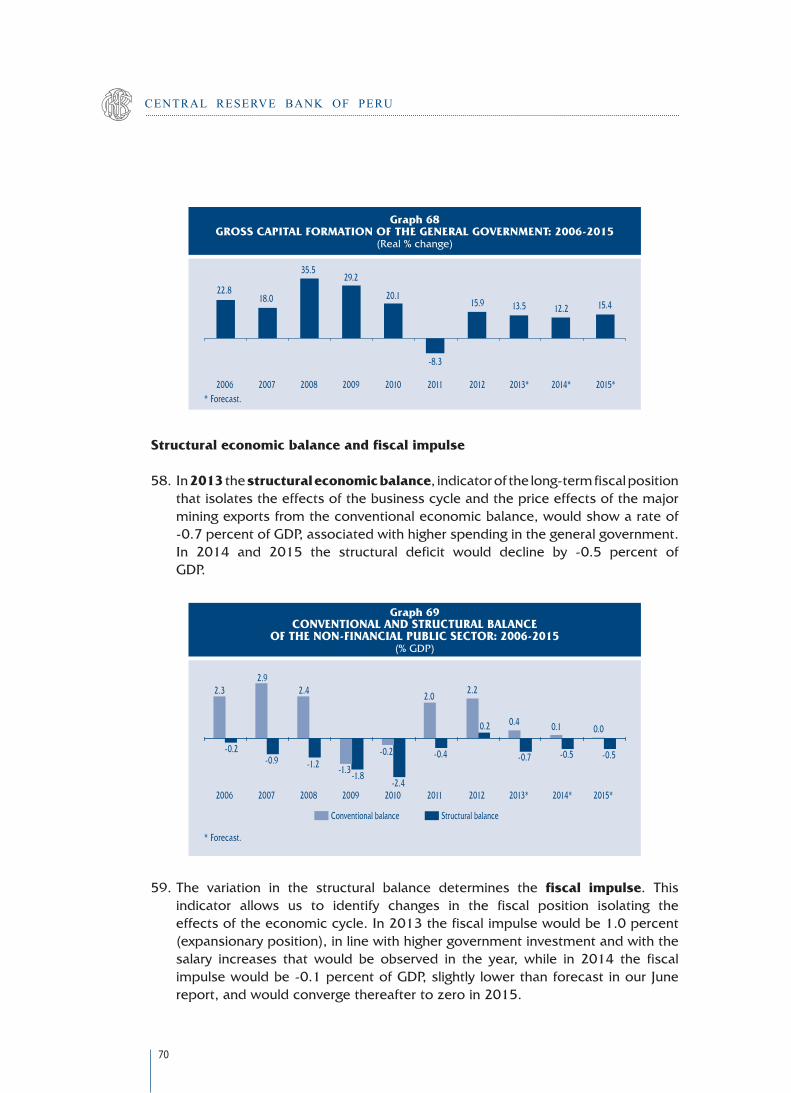
70
CENTRAL RESERVE BANK OF PERU
Graph 68GROSS CAPITAL FORMATION OF ThE GENERAL GOVERNMENT: 2006-2015
(Real%change)
*Forecast.2006
22.8
2007
18.0
2008
35.5
2009
29.2
2010
20.1
2011
-8.3
2012
15.9
2013* 2014* 2015*
13.5 12.2 15.4
Graph 69CONVENTIONAL AND STRuCTuRAL BALANCE
OF ThE NON-FINANCIAL PuBLIC SECTOR: 2006-2015(%GDP)
*Forecast.
2006 2007 2008 2009 2010 2011
Conventionalbalance Structuralbalance
2012 2013* 2014* 2015*
-0.2-0.9
-1.8
-0.4
-2.4
-1.2
0.2
-0.7 -0.5 -0.5
2.32.9
2.4
-1.3
-0.2
2.02.2
0.4 0.1 0.0
Structural economic balance and fiscal impulse
58.In2013thestructural economic balance,indicatorofthelong-termfiscalpositionthatisolatestheeffectsofthebusinesscycleandthepriceeffectsofthemajorminingexportsfromtheconventionaleconomicbalance,wouldshowarateof-0.7percentofGDP,associatedwithhigherspendinginthegeneralgovernment.In 2014 and 2015 the structural deficit would decline by -0.5 percent ofGDP.
59.The variation in the structural balance determines the fiscal impulse. Thisindicator allows us to identify changes in the fiscal position isolating theeffectsoftheeconomiccycle.In2013thefiscalimpulsewouldbe1.0percent(expansionaryposition),inlinewithhighergovernmentinvestmentandwiththesalary increases thatwould be observed in the year,while in 2014 the fiscalimpulsewouldbe-0.1percentofGDP,slightlylowerthanforecastinourJunereport,andwouldconvergethereaftertozeroin2015.

71
Inf la t ion Report . September 2013
Financial requirements and the non-financial debt of the public sector
60.Thelowersurplusestimatedintheforecasthorizonwouldreducetheavailablesources of resources for the government, which would result in a loweraccumulationofdepositsthantheoneconsideredintheInflationReportofJune.
Graph 70FISCAL IMPuLSE 1/: 2006-2015
(%GDP)
*Forecast.
1/Thefiscalimpulseisthechangeinthestructuralbalance,whichisanindicatorofhowthefiscalpositionaffectstheeconomiccycle.
-0.9
0.90.5
0.9 0.8
-2.0
-0.6
Expansive
Contractive
1.0
-0.1
0.0
0.0
0.7
-0.2
2006 2007 2008 2009 2010 2011
IRJun.13IRSep.13
2012 2013* 2014* 2015*
Table 28FINANCIAL REQUIREMENTS OF THE NON-FINANCIAL PUBLIC SECTOR AND ITS FINANCING 1/
(Million S/.) 2012 2013* 2014* 2015* S1 Year S1 IR Jun.13 IR Sep.13 IR Jun.13 IR Sep.13 IR Jun.13 IR Sep.13 I. USES -15,354 -6,968 -12,258 -780 1,180 -398 2,884 2,337 6,215 1. Amortization 2,673 4,342 1,286 3,038 3,221 3,327 3,782 5,697 6,289 a. External debt 1,917 3,105 809 1,825 1,707 2,643 2,724 2,352 2,433 b. Internal debt 756 1,237 477 1,213 1,513 683 1,058 3,346 3,856 Of which: Recognition bonds 234 509 16 190 206 168 376 168 386
2. Overall balance -18,027 -11,310 -13,544 -3,818 -2,041 -3,724 -898 -3,360 -74 (negative sign indicates surplus)
II. SOURCES -15,354 -6,968 -12,258 -780 1,180 -398 2,884 2,337 6,215 1. External 365 1,175 235 2,303 2,033 2,633 3,062 3,655 4,909 2. Bonds 2/ 3,409 4,378 592 1,081 2,048 1,762 2,925 1,674 2,477 3. Internal 3/ -19,128 -12,521 -13,084 -4,163 -2,901 -4,793 -3,103 -2,992 -1,171 Memo: NFPS gross debt Billion S/. 99.3 103.8 99.2 100.1 101.7 103.7 106.4 105.8 110.3 % GDP 19.5 19.7 18.3 17.7 18.1 16.9 17.4 15.8 16.5
NFPS net debt 4/ Billion S/. 20.4 25.4 11.4 13.4 13.3 11.8 14.2 8.7 14.4 % GDP 4.0 4.8 2.1 2.4 2.4 1.9 2.3 1.3 2.2 1/ The effect of exchanging treasury bonds for longer-maturity bonds, as well as the effect of placements made for the prepayment
of both internal and external operations has been isolated in the case of amortization and disbursements. 2/ Includes domestic and external bonds. 3/ A positive sign indicates a withdrawal or overdraft and a negative sign indicates higher deposits. 4/ DefinedasthedifferencebetweengrosspublicdebtandNFPSdeposits. * Forecast.IR:InflationReport.
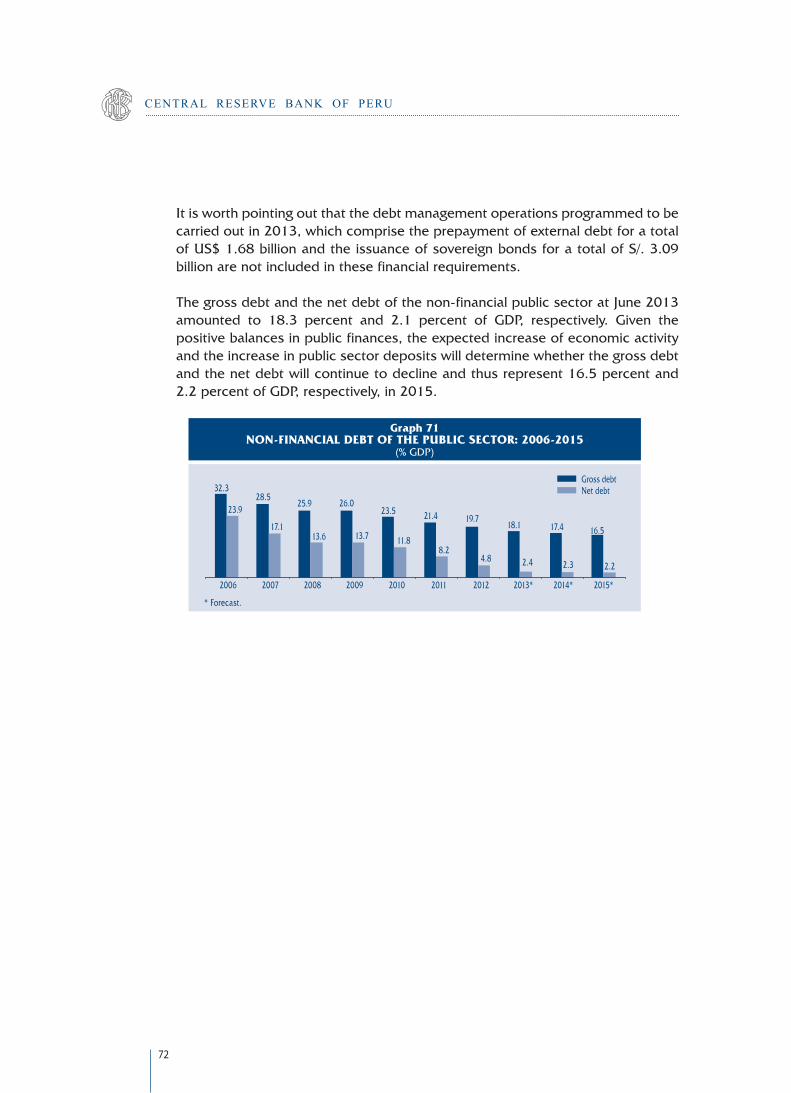
72
CENTRAL RESERVE BANK OF PERU
Itisworthpointingoutthatthedebtmanagementoperationsprogrammedtobecarriedoutin2013,whichcomprisetheprepaymentofexternaldebtforatotalofUS$1.68billionandtheissuanceofsovereignbondsforatotalofS/.3.09billionarenotincludedinthesefinancialrequirements.
Thegrossdebtandthenetdebtofthenon-financialpublicsectoratJune2013amounted to 18.3 percent and 2.1 percent of GDP, respectively. Given thepositivebalancesinpublicfinances,theexpectedincreaseofeconomicactivityandtheincreaseinpublicsectordepositswilldeterminewhetherthegrossdebtandthenetdebtwillcontinuetodeclineandthusrepresent16.5percentand2.2percentofGDP,respectively,in2015.
Graph 71NON-FINANCIAL DEBT OF ThE PuBLIC SECTOR: 2006-2015
(%GDP)
*Forecast.
23.9
32.3
17.1
28.5
13.6
25.9
13.7
26.0
11.8
23.5
8.2
21.4
4.8
19.7
2.4
18.1
2.3 2.2
17.4 16.5
2006 2007 2008 2009 2010 2011 2012 2013* 2014* 2015*
GrossdebtNetdebt
73
Inf la t ion Report . September 2013
V. Monetary Policy
61.The BCRP has maintained the monetary policy interest rate at 4.25 percentsinceMay2011.However,asfromMay2013theBCRPhasloosenedreserverequirementstoensureanorderlyevolutionofliquidityandcreditinthefinancialsystem and to preserve in this way financial conditions amid a context ofgreateruncertaintyaboutthemagnitudeandthebeginningofthewithdrawalofquantitativeeasing(QE)bytheU.S.FederalReservethroughthereductionofitsassetpurchaseprogram.
Like in other emerging economies, a lower inflow of capital and higherexpectationsofastrengtheningofthedollarwereobservedsincemid-Maydueto thepossibility of a gradual reductionofQEby the Federal Reserve. Theseeventsgeneratedincreasedriskperceptionintheprivatesectoraboutdebtsindollars,whichbroughtaboutanincreaseinthedemandforcreditinsolesandfavoredamorerapidprocessofde-dollarizationofcredit.
Atthesametime,however,agreaterpreferenceforsavingindollarshasbeenobserved,particularlyinthecaseoflegalentities,whichhasreflectedinarapidslowdownofthegrowthofdepositsinsolesandthusinaloweravailabilityofsourcesfortheexpansionofcreditinthiscurrency.
Inthiscontext,theCentralBankhasbeenadoptingmeasurestoloosenreserverequirementsinnationalcurrencytoprovidebankswithliquidityinsolesinordertofinancetheexpansionofcredit inthiscurrency.Loweringthemeanrateofreserverequirementsprovidesadditionalsourcesforthegrowthofcreditandallows accommodating this increased demand for credit without generatingupwardpressuresoninterestratesinsoles.
In recentmonths the policy communiqués of the Board of the Central Bankhavehighlighted thatexpectationsof inflationarewithin the target rangeandthat the12-month inflation ratewill return to the target range in the comingmonthsasfoodsupplyconditionsimprove,aswellasthatthedomesticcontextischaracterizedbyaneconomicgrowthclosetotheeconomy’spotentialandthatuncertaintypersistsintheinternationalfinancialscenario.
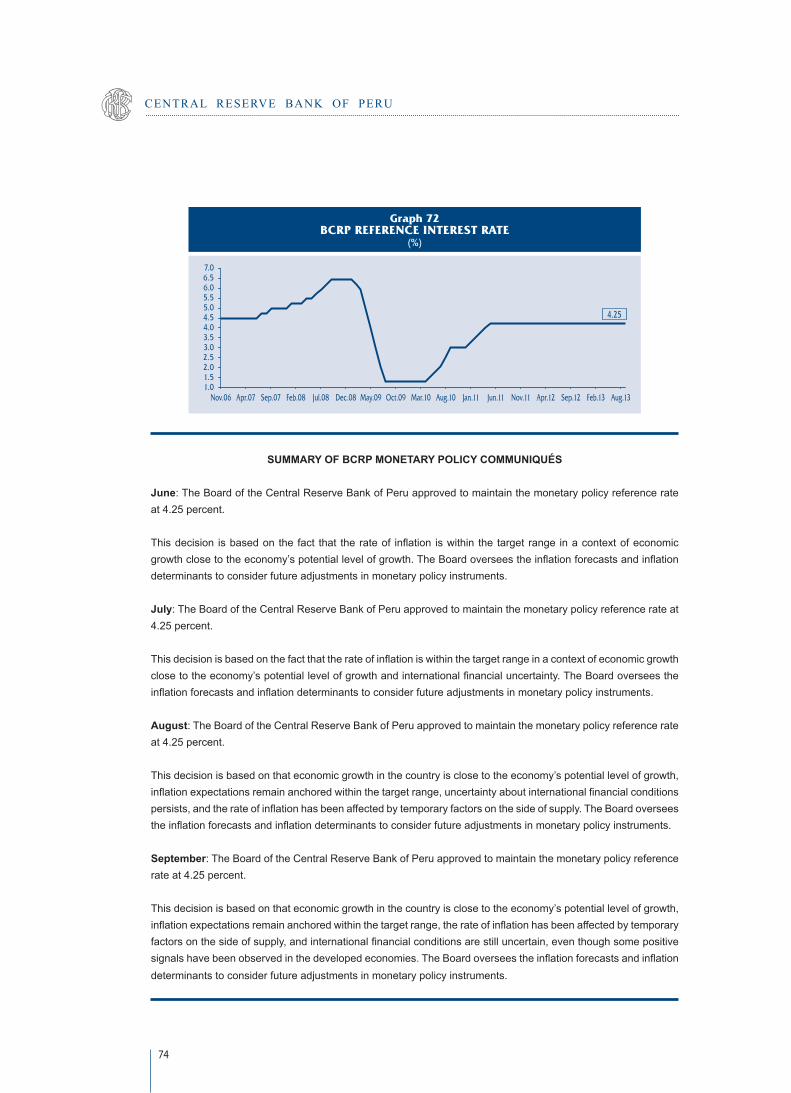
74
CENTRAL RESERVE BANK OF PERU
Graph 72BCRP REFERENCE INTEREST RATE
(%)
4.25
7.06.56.05.55.04.54.03.53.02.52.01.51.0Nov.06 Sep.07 Mar.10Dec.08Feb.08 Jul.08 May.09 Oct.09 Aug.10 Jan.11 Jun.11 Nov.11 Apr.12 Sep.12 Feb.13 Aug.13Apr.07
SUMMARY OF BCRP MONETARY POLICY COMMUNIQUÉS
June: The Board of the Central Reserve Bank of Peru approved to maintain the monetary policy reference rate at 4.25 percent.
Thisdecision isbasedon the fact that therateof inflation iswithin the target range inacontextofeconomicgrowthclosetotheeconomy’spotentiallevelofgrowth.TheBoardoverseestheinflationforecastsandinflationdeterminants to consider future adjustments in monetary policy instruments.
July: The Board of the Central Reserve Bank of Peru approved to maintain the monetary policy reference rate at 4.25 percent.
Thisdecisionisbasedonthefactthattherateofinflationiswithinthetargetrangeinacontextofeconomicgrowthclosetotheeconomy’spotentiallevelofgrowthandinternationalfinancialuncertainty.TheBoardoverseestheinflationforecastsandinflationdeterminantstoconsiderfutureadjustmentsinmonetarypolicyinstruments.
August: The Board of the Central Reserve Bank of Peru approved to maintain the monetary policy reference rate at 4.25 percent.
This decision is based on that economic growth in the country is close to the economy’s potential level of growth, inflationexpectationsremainanchoredwithinthetargetrange,uncertaintyaboutinternationalfinancialconditionspersists,andtherateofinflationhasbeenaffectedbytemporaryfactorsonthesideofsupply.TheBoardoverseestheinflationforecastsandinflationdeterminantstoconsiderfutureadjustmentsinmonetarypolicyinstruments.
September: The Board of the Central Reserve Bank of Peru approved to maintain the monetary policy reference rate at 4.25 percent.
This decision is based on that economic growth in the country is close to the economy’s potential level of growth, inflationexpectationsremainanchoredwithinthetargetrange,therateofinflationhasbeenaffectedbytemporaryfactorsonthesideofsupply,andinternationalfinancialconditionsarestilluncertain,eventhoughsomepositivesignalshavebeenobservedinthedevelopedeconomies.TheBoardoverseestheinflationforecastsandinflationdeterminants to consider future adjustments in monetary policy instruments.

75
Inf la t ion Report . September 2013
Interest rates in domestic currency
62.Theinterestratesonoperationsindomesticcurrencydeclinedslightlycomparedtoend-2012.Thus,the90-daycorporateprimerateinsolesregisteredarateof4.73percentinAugust.
Graph 7390-DAy CORPORATE PRIME RATE VERSuS INTERBANK OVERNIGhT RATE IN
DOMESTIC CuRRENCy: FEB.08 - AuG.13
8.50
6.50
4.50
2.50
0.50
%
Feb.08 Aug.08 Feb.09 Aug.09 Feb.10 Aug.10 Feb.11 Aug.11 Feb.12 Aug.12 Feb.13 Aug.13
4.73
4.52
Interbankrateindomesticcurrency90-dayActivePrimeindomesticcurrency
63.Thelendingratesindomesticcurrencyshowedlowerlevelsthanatend-2012:inAugusttheinterestrateforcorporateloanswas5.7percent,theinterestrateforloanstolargebusinesseswas7.0percent,therateforloanstomedium-sizedcompanieswas10.8percent,and the rate for loans tosmall companieswas21.4percent.Moreover,therateforconsumerloanswas41.8percentandtherateformortgageloanswas9.3percent.
Table 29INTEREST RATE BY TYPE OF LOANS 1/
(%)
Domestic currency
Corporate Large Medium-sized Small Consumer Mortgages Companies enterprises businesses
Dec.10 4.6 5.9 10.3 23.3 40.7 9.3Dec.11 6.0 7.4 11.2 23.2 38.5 9.4Mar.12 6.1 7.0 11.2 23.4 35.6 9.4Jun.12 6.0 7.3 11.2 23.1 34.9 9.3Sep.12 5.7 7.5 11.1 22.9 38.0 8.9Dec.12 5.8 7.4 11.0 22.5 41.2 8.8Mar.13 5.8 7.4 10.8 22.0 39.3 9.2Apr.13 5.4 7.2 10.7 21.9 40.7 9.1May.13 5.4 7.2 10.8 21.7 41.9 9.0Jun.13 5.3 7.2 10.6 21.2 41.3 9.1Jul.13 5.4 7.1 10.5 21.0 42.0 9.2Aug.13 5.7 7.0 10.8 21.4 41.8 9.3
Accumulated change (bps)Aug.13-Jun.13 39 -18 23 21 49 23Aug.13-Mar.13 -10 -40 1 -63 256 11Aug.13-Dec.12 -9 -33 -13 -104 67 58
1/ Annual active interest rates on the operations carried out in the last 30 working days.Source: SBS.
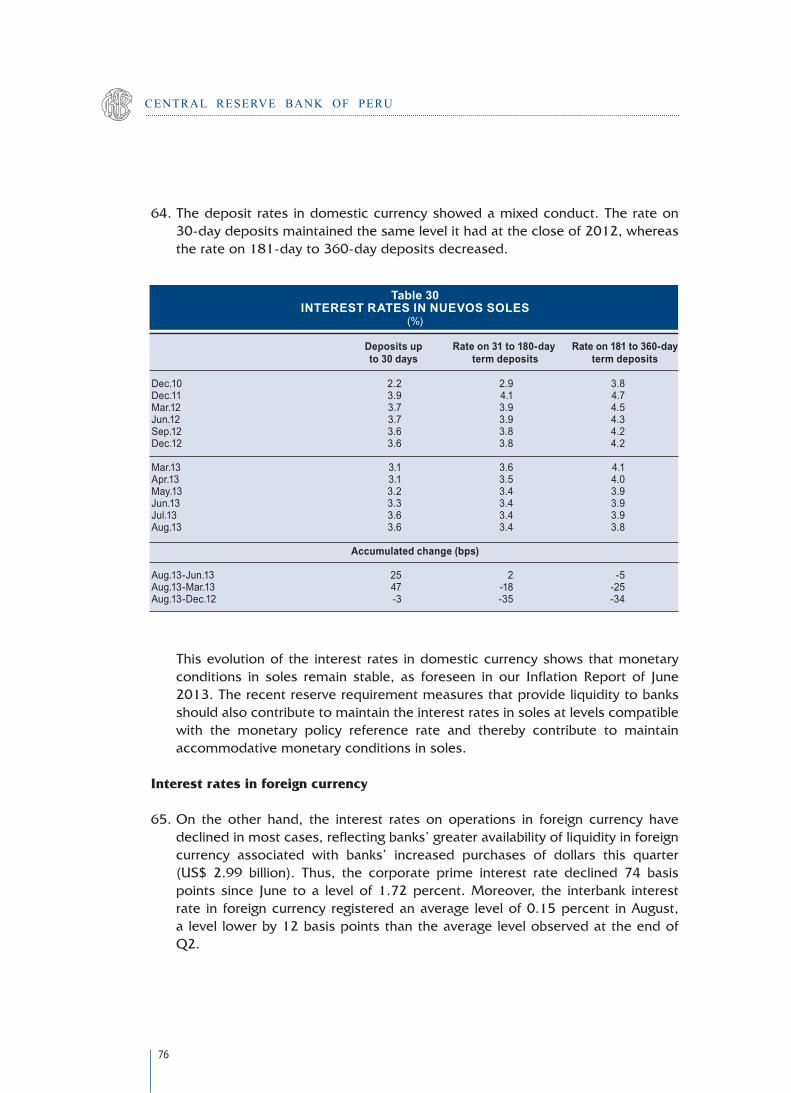
76
CENTRAL RESERVE BANK OF PERU
64.Thedepositratesindomesticcurrencyshowedamixedconduct.Therateon30-daydepositsmaintainedthesamelevelithadatthecloseof2012,whereastherateon181-dayto360-daydepositsdecreased.
Table 30INTEREST RATES IN NUEVOS SOLES
(%)
Deposits up Rate on 31 to 180-day Rate on 181 to 360-day to 30 days term deposits term deposits Dec.10 2.2 2.9 3.8Dec.11 3.9 4.1 4.7Mar.12 3.7 3.9 4.5Jun.12 3.7 3.9 4.3Sep.12 3.6 3.8 4.2Dec.12 3.6 3.8 4.2
Mar.13 3.1 3.6 4.1Apr.13 3.1 3.5 4.0May.13 3.2 3.4 3.9Jun.13 3.3 3.4 3.9Jul.13 3.6 3.4 3.9Aug.13 3.6 3.4 3.8
Accumulated change (bps)
Aug.13-Jun.13 25 2 -5Aug.13-Mar.13 47 -18 -25Aug.13-Dec.12 -3 -35 -34
Thisevolutionofthe interestrates indomesticcurrencyshowsthatmonetary
conditions in soles remain stable, as foreseen in our Inflation Report of June2013.Therecentreserverequirementmeasuresthatprovideliquiditytobanksshouldalsocontributetomaintaintheinterestratesinsolesatlevelscompatiblewith the monetary policy reference rate and thereby contribute to maintainaccommodativemonetaryconditionsinsoles.
Interest rates in foreign currency
65.On the other hand, the interest rates onoperations in foreign currency havedeclinedinmostcases,reflectingbanks’greateravailabilityofliquidityinforeigncurrency associated with banks’ increased purchases of dollars this quarter(US$ 2.99 billion). Thus, the corporate prime interest rate declined 74 basispoints since June toa levelof1.72percent.Moreover, the interbank interestrate inforeigncurrencyregisteredanaverage levelof0.15percent inAugust,alevellowerby12basispointsthantheaveragelevelobservedattheendofQ2.

77
Inf la t ion Report . September 2013
Thisgreateravailabilityofliquidityinforeigncurrencythatbankshavehasallowedthemtoreducetheirshort-termliabilitiesbyUS$535millionandtoaccumulateaverageovernightdepositsattheCentralBankforatotalofUS$2.00billioninAugust.
Graph 7490-DAy CORPORATE PRIME RATE VERSuS INTERBANK OVERNIGhT RATE IN
FOREIGN CuRRENCy: FEB.08 - AuG.13
12.00
10.00
8.00
6.00
4.00
2.00
0.00
%
1.72
0.15
Interbankrateinforeigncurrency 90-dayActivePrimeinforeigncurrency
Feb.08 Aug.08 Feb.09 Aug.09 Feb.10 Aug.10 Feb.11 Aug.11 Feb.12 Aug.12 Feb.13 Aug.13
Graph 75OVERNIGhT DEPOSITS IN MILLION uS$
(Periodaverage)
Jan.,13
41
Feb
106
Mar
136
Apr
419
May
359
Jun
191
Jul Aug
406
Ago
1,996
66.Comparedwithend-2012, the lending interest rates foroperations in foreigncurrencyshowmixedtrends.Theratesforconsumerloansandmortgageshaveregistered substantial increases,which reflect themacro prudentialmeasuresadoptedbytheSBSandtheBCRP,whereastheinterestratesforcorporateloanshaveshownadownwardtrend.
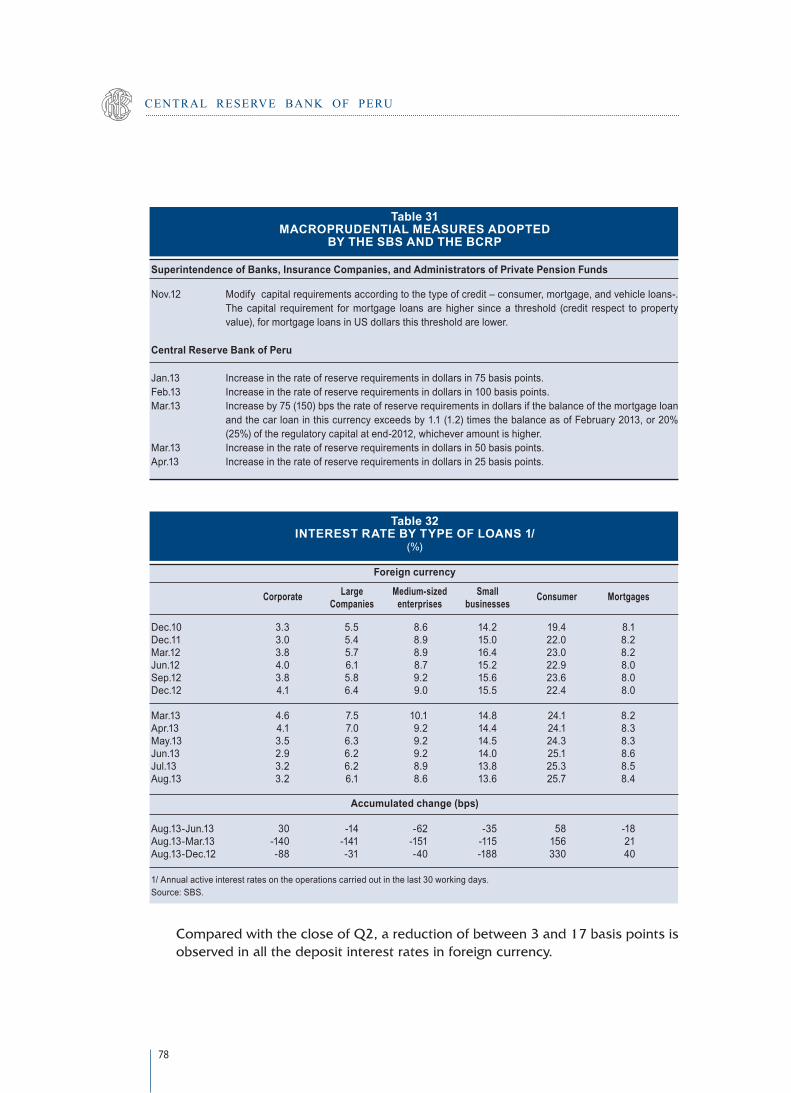
78
CENTRAL RESERVE BANK OF PERU
ComparedwiththecloseofQ2,areductionofbetween3and17basispointsisobservedinallthedepositinterestratesinforeigncurrency.
Table 32INTEREST RATE BY TYPE OF LOANS 1/
(%)
Foreign currency
Corporate Large Medium-sized Small Consumer Mortgages Companies enterprises businesses
Dec.10 3.3 5.5 8.6 14.2 19.4 8.1Dec.11 3.0 5.4 8.9 15.0 22.0 8.2Mar.12 3.8 5.7 8.9 16.4 23.0 8.2Jun.12 4.0 6.1 8.7 15.2 22.9 8.0Sep.12 3.8 5.8 9.2 15.6 23.6 8.0Dec.12 4.1 6.4 9.0 15.5 22.4 8.0
Mar.13 4.6 7.5 10.1 14.8 24.1 8.2Apr.13 4.1 7.0 9.2 14.4 24.1 8.3May.13 3.5 6.3 9.2 14.5 24.3 8.3Jun.13 2.9 6.2 9.2 14.0 25.1 8.6Jul.13 3.2 6.2 8.9 13.8 25.3 8.5Aug.13 3.2 6.1 8.6 13.6 25.7 8.4
Accumulated change (bps)
Aug.13-Jun.13 30 -14 -62 -35 58 -18Aug.13-Mar.13 -140 -141 -151 -115 156 21Aug.13-Dec.12 -88 -31 -40 -188 330 40
1/ Annual active interest rates on the operations carried out in the last 30 working days.Source: SBS.
Table 31MACROPRUDENTIAL MEASURES ADOPTED
BY THE SBS AND THE BCRP
Superintendence of Banks, Insurance Companies, and Administrators of Private Pension Funds
Nov.12 Modify capital requirements according to the type of credit – consumer, mortgage, and vehicle loans-. The capital requirement for mortgage loans are higher since a threshold (credit respect to property value), for mortgage loans in US dollars this threshold are lower.
Central Reserve Bank of Peru
Jan.13 Increase in the rate of reserve requirements in dollars in 75 basis points.Feb.13 Increase in the rate of reserve requirements in dollars in 100 basis points.Mar.13 Increase by 75 (150) bps the rate of reserve requirements in dollars if the balance of the mortgage loan
and the car loan in this currency exceeds by 1.1 (1.2) times the balance as of February 2013, or 20% (25%) of the regulatory capital at end-2012, whichever amount is higher.
Mar.13 Increase in the rate of reserve requirements in dollars in 50 basis points.Apr.13 Increase in the rate of reserve requirements in dollars in 25 basis points.
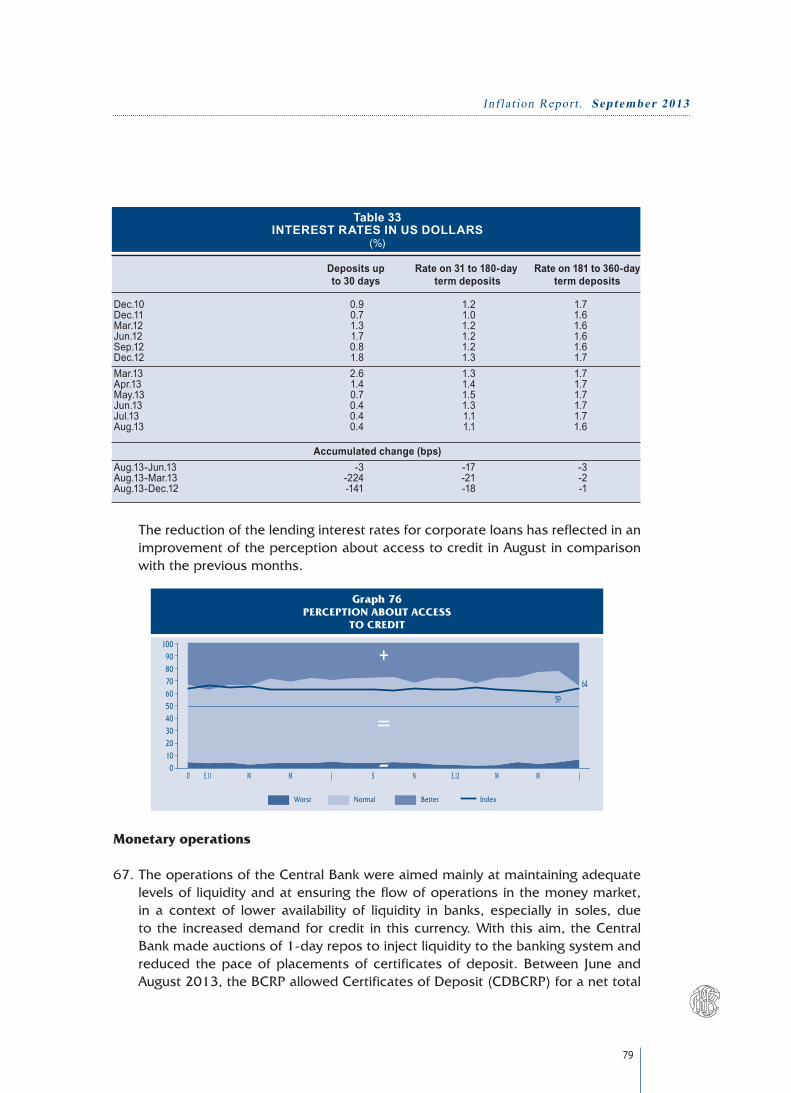
79
Inf la t ion Report . September 2013
ThereductionofthelendinginterestratesforcorporateloanshasreflectedinanimprovementoftheperceptionaboutaccesstocreditinAugustincomparisonwiththepreviousmonths.
Table 33INTEREST RATES IN US DOLLARS
(%)
Deposits up Rate on 31 to 180-day Rate on 181 to 360-day to 30 days term deposits term deposits Dec.10 0.9 1.2 1.7Dec.11 0.7 1.0 1.6Mar.12 1.3 1.2 1.6Jun.12 1.7 1.2 1.6Sep.12 0.8 1.2 1.6Dec.12 1.8 1.3 1.7Mar.13 2.6 1.3 1.7Apr.13 1.4 1.4 1.7May.13 0.7 1.5 1.7Jun.13 0.4 1.3 1.7Jul.13 0.4 1.1 1.7Aug.13 0.4 1.1 1.6
Accumulated change (bps)Aug.13-Jun.13 -3 -17 -3Aug.13-Mar.13 -224 -21 -2Aug.13-Dec.12 -141 -18 -1
Graph 76PERCEPTION ABOuT ACCESS
TO CREDIT
Worst Normal Better Index
1009080706050403020100
59
64
D M MSE.11 E.12M MJ JN
Monetary operations
67.TheoperationsoftheCentralBankwereaimedmainlyatmaintainingadequatelevelsofliquidityandatensuringtheflowofoperationsinthemoneymarket,in a context of lower availability of liquidity in banks, especially in soles, duetotheincreaseddemandforcredit inthiscurrency.Withthisaim,theCentralBankmadeauctionsof1-dayrepostoinjectliquiditytothebankingsystemandreduced thepaceofplacementsofcertificatesofdeposit.Between JuneandAugust2013,theBCRPallowedCertificatesofDeposit(CDBCRP)foranettotal

80
CENTRAL RESERVE BANK OF PERU
ofS/.4.24billiontomature.TheseoperationswerecarriedoutmainlyinAugust(S/.2.39billion).TheyieldcurveofCDBCRPcontinuedreflectinglowerinterestratesthanthepolicyinterestrateformaturitiesof6to18months.
Graph 77
yIELD CuRVE OF CENTRAL BANK SECuRITIES 1/
1/YieldofCDBCRPendofperiod.Onedayratecorrespondstoreferencerate.
1,día 2 4 6 8 10 12 14 16 18
4.25
4.20
4.15
4.10
4.05
4.00
3.95
3.90
3.85
3.80
3.75
3.70
yield
(%)
Maturity (months)
4.25
4.154.17
3.92
4.25
4.02
Jun.13
Aug.13
Dec.12
Asaresultoftheseoperations,theshareofBCRPinstrumentsrelativetoitstotalliabilities decreased. The share of BCRP monetary instruments declined fromrepresenting 20.0 percent of the international reserves in June to representing13.7percentinAugust2013,whiletheshareofrequiredreservesincreasedfrom28.1to29.4percent,duemainlytobanks’higherdepositsindomesticcurrency,whichincreasedfrom16.4to20.0percentofinternationalreserves.Publicsectordeposits continued to be themain source of sterilization of foreign exchangeinterventions,withashareof36.2percentofthetotalliabilitiesoftheBCRP.
Table 34SIMPLIFIED BALANCE SHEET OF THE BCRP
(As % of Net International Reserves) Net assets Dec.12 Jun.13 Aug.13I. Net International Reserves 100% 100% 100% (US$ 63,991 mills.) (US$ 66,683 mills.) (US$ 66,635 mills.)Net liabilities II. Total public sector deposits 36.4% 36.7% 36.2% In domestic currency 23.6% 22.4% 21.0% In foreign currency 12.8% 14.3% 15.2% III. Total reserve requirements 27.8% 28.1% 29.4% In domestic currency 12.1% 11.7% 9.4% In foreign currency 1/ 15.7% 16.4% 20.0% IV. BCRP Instruments 17.7% 20.0% 13.7% CD BCRP 12.3% 15.1% 12.3% CDR BCRP 0.0% 1.3% 1.4% Term deposits 5.5% 3.6% 0.0% V. Currency 19.0% 17.5% 17.5% VI. Others -0.9% -2.2% 3.2%
1/ Includes banks’ overnight deposits at the Central Bank.

81
Inf la t ion Report . September 2013
Currency in circulation
68.BetweenJuneandAugust2013,themeancurrencygrewatanannualrateof16.2 percent, in line with the evolution of economic activity in the country.Currency in circulation in Q3 and Q4 is expected to grow at similar ratesas in the previous quarters, reflecting the evolution foreseen in economicactivity.
Graph 78AVERAGE CuRRENCy IN CIRCuLATION
(%changerespecttothesimilarperiodofpreviousyear)
Aug.11 Aug.12 Aug.13*Dec.10 Dec.11 Dec.12Apr.11 Apr.12 Apr.13
*Preliminary.
Reserve requirements
69.Sincemid-May,theUnitedStatesFederalReservehasbeenshowingsignsthatitcouldstartreducingmonetarystimulusbytaperingitsassetpurchaseprogram.Thegreaterfinancialvolatilitythishasgeneratedhasmainlyaffectedtheemergingeconomies,which showawidespreadweakeningof their currencies, a lowerdemandforassetsindomesticcurrency,andafallinthepricesoftheirmainrawmaterials.
In the Peruvian economy, these higher expectations of depreciation have ledeconomicagents–especially localagents– to restructure theirportfolioofnetassetsinordertominimizeexchangeraterisks.Asaresult,thepreferencefordepositsindollarshasincreased–totalobligationssubjecttorequiredreservesgrew5.3percentinAugustand4.1percentinJuly–andtherehasbeenagreaterdemandforcreditindomesticcurrency(thelattergrew1.9percentinJulywhilecredit in foreign currency grew0.5percent in the samemonth). In responseto this situation, theCentral Bank has been lowering reserve requirements indomesticcurrencytopreservethedynamismofthecreditmarketandalsotocontributetotheprocessoffinancialde-dollarization.

82
CENTRAL RESERVE BANK OF PERU
Thus, effective as fromMay 2013, the BCRP increased the limit of externalliabilities and bonds with maturities of over 3 years not subject to reserverequirementsfrom2.2to2.3timestheregulatorycapitalinordertopromoteanadequateleveloffundingandleadbankstousegreaterlong-termfinancinginsolesandsupportinthiswaylongtermcreditinsoles.
Withtheaimofpreservingfinancingconditionsinsoles,theBCRPestablishedsince June a mean maximum rate of reserve requirements of 20 percent innationalcurrencyasaresultofwhichliquidityfornearlyS/.500millionsoleswasprovidedtothefinancialsystem.Inaddition,effectiveasfromAugust,theBCRPreducedthemeanmaximumrateofreserverequirementsinnationalcurrencyto19percentandmarginalreserverequirementsfrom30to25percent,whichallowedtoreleaseliquidityforaroundS/.1billion.
As from September, the BCRP continued implementing measures aimed atreleasingreserverequirementsfundsindomesticcurrency:themeanmaximumrateofreserverequirementswasloweredfrom19to17percentandtherateofmarginalreservesinsoleswasloweredfrom25to20percent,whichallowedtheCentralBanktoinjectS/.2billionmoreintothefinancialsystem.
Asregardsreservesinforeigncurrency,asfromJunethemeanmaximumrateofreserveswassetat45percentandtherateofmarginalreserveswasloweredfrom55 to50percent,whichallowed releasing reserve funds fora totalofUS$150million.Additionally,therateofrequiredreservesforliabilitiesandshort-termbondswasloweredfrom60to50percent,therateofrequiredreservesforforeigntradeliabilitieswasloweredfrom25to20percent,andthelimitofforeigntradeobligationssubjecttoalowerratewasincreased,allofwhichwouldreleasefundsforatotalofUS$170million.Thelattermeasureswouldreducebanks’costofexternalfinancing.
With thesemeasures, themean rateof required reserves innationalcurrencydeclinedfrom20.0to17.0percentinSeptember.Moreover,themeanrateofrequiredreservesinforeigncurrency,whichinJunewas43.4percent,isexpectedtodeclineto43.2percentinSeptember.
Sep.07 Sep.08 Sep.09 Sep.10 Sep.11 Sep.12 Sep.13*
60.0
50.0
40.0
30.0
20.0
10.0
0.0
Foreigncurrency
Domesticcurrency
Graph 79DOMESTIC AND FOREIGN CuRRENCy RESERVE RATIOS(Aspercentageoftotalobligationssubjecttolegalrequeriments)
*Preliminary.
MeanrateofreservesinDCMarginalreservesDCMeanrateofreservesinFCMarginalreservesFC
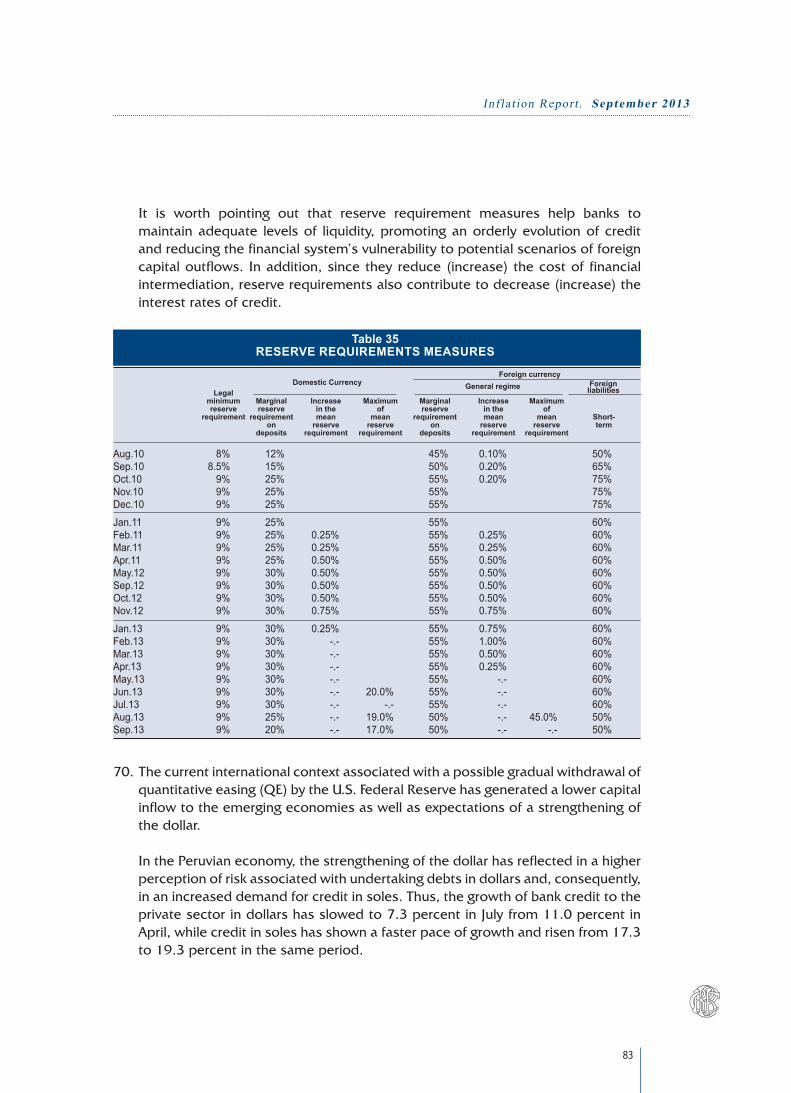
83
Inf la t ion Report . September 2013
It is worth pointing out that reserve requirement measures help banks tomaintainadequate levelsof liquidity,promotinganorderlyevolutionofcreditandreducingthefinancialsystem’svulnerabilitytopotentialscenariosofforeigncapitaloutflows.Inaddition,sincetheyreduce(increase)thecostoffinancialintermediation,reserverequirementsalsocontributetodecrease(increase)theinterestratesofcredit.
Table 35RESERVE REQUIREMENTS MEASURES
Foreign currency
Domestic Currency General regime
Foreign
liabilities Legal
minimum Marginal Increase Maximum Marginal Increase Maximum reserve reserve in the of reserve in the of requirement requirement mean mean requirement mean mean Short- on reserve reserve on reserve reserve term deposits requirement requirement deposits requirement requirement
Aug.10 8% 12% 45% 0.10% 50%Sep.10 8.5% 15% 50% 0.20% 65%Oct.10 9% 25% 55% 0.20% 75%Nov.10 9% 25% 55% 75%Dec.10 9% 25% 55% 75%Jan.11 9% 25% 55% 60%Feb.11 9% 25% 0.25% 55% 0.25% 60%Mar.11 9% 25% 0.25% 55% 0.25% 60%Apr.11 9% 25% 0.50% 55% 0.50% 60%May.12 9% 30% 0.50% 55% 0.50% 60%Sep.12 9% 30% 0.50% 55% 0.50% 60%Oct.12 9% 30% 0.50% 55% 0.50% 60%Nov.12 9% 30% 0.75% 55% 0.75% 60%Jan.13 9% 30% 0.25% 55% 0.75% 60%Feb.13 9% 30% -.- 55% 1.00% 60%Mar.13 9% 30% -.- 55% 0.50% 60%Apr.13 9% 30% -.- 55% 0.25% 60%May.13 9% 30% -.- 55% -.- 60%Jun.13 9% 30% -.- 20.0% 55% -.- 60%Jul.13 9% 30% -.- -.- 55% -.- 60%Aug.13 9% 25% -.- 19.0% 50% -.- 45.0% 50%Sep.13 9% 20% -.- 17.0% 50% -.- -.- 50%
70.Thecurrentinternationalcontextassociatedwithapossiblegradualwithdrawalofquantitativeeasing(QE)bytheU.S.FederalReservehasgeneratedalowercapitalinflowtotheemergingeconomiesaswellasexpectationsofastrengtheningofthedollar.
InthePeruvianeconomy,thestrengtheningofthedollarhasreflectedinahigherperceptionofriskassociatedwithundertakingdebtsindollarsand,consequently,inanincreaseddemandforcreditinsoles.Thus,thegrowthofbankcredittotheprivatesectorindollarshasslowedto7.3percentinJulyfrom11.0percentinApril,whilecreditinsoleshasshownafasterpaceofgrowthandrisenfrom17.3to19.3percentinthesameperiod.

84
CENTRAL RESERVE BANK OF PERU
Furthermore, economic agents, particularly legal entities, have shown a greaterpreference forsaving indollars.This is reflected in the fact that totalobligationssubjecttoreserverequirementsindollarshavebeenacceleratingsinceMarch2013,whiledepositsinsoleshavebeenslowingdownatthesametime.Theannualgrowthrateoftotalobligationssubjecttoreserverequirementsinsoleshasdeclinedfrom28.1percentinFebruary2013to19.6percentinJuly2013,whiletotalobligationssubjecttoreserverequirementsindollarshaveincreasedsinceFebruary2013.
Graph 80BANKS: CREDIT TO ThE PRIVATE SECTOR
(12months%change)
Jul.12
17.217.818.2
17.218.218.6
16.417.9
15.7
18.2
15.316.5
14.914.5 15.214.916.3
13.3
17.3
11.0
17.3
9.2
18.2
8.3
19.3
7.3
Sep. Nov. Jan.13 Mar. May.Aug. Oct. Dec. Feb. Apr. Jun. Jul.Domesticcurrency Foreigncurrency
Graph 81TOTAL OBLIGATIONS SuBjECT TO RESERVE REQuIREMENTS
(12months%change)
21.4
5.9 4.8
22.224.7
27.925.6 26.7
28.1
24.422.5
19.8 21.019.7 19.6
13.811.310.110.7
8.7
4.9
0.72.5
6.1
0.62.7
Sep. Nov. Jan.13 Mar. May.Aug.12 Oct. Dec. Feb. Apr. Jun. Jul.* Aug.*Domesticcurrency
*Preliminary.Foreigncurrency
Inthisscenario,betweenMayandJuly2013creditinsolesincreasedbynearlyS/.4billion,whereasbanks’domesticdepositsincreasedonlybyS/.800million.CreditindollarsbetweenMayandJuly2013increasedbynearlyUS$500million,whereasdomesticdepositsinforeigncurrencyincreasedbyUS$2.6billion.
Withtheaimofpromotingstabledomesticfinancialconditions,theBCRPhasactedproactivelyproviding liquidity to financial institutions. SinceMay2013,theBCRPhasimplementedreserverequirementmeasuresasaresultofwhichliquidityforoverS/.3billionhasbeeninjectedtothemarket,mitigatinginthiswaytheeffectsoftheloweravailabilityoffundinginsolesoncredit.
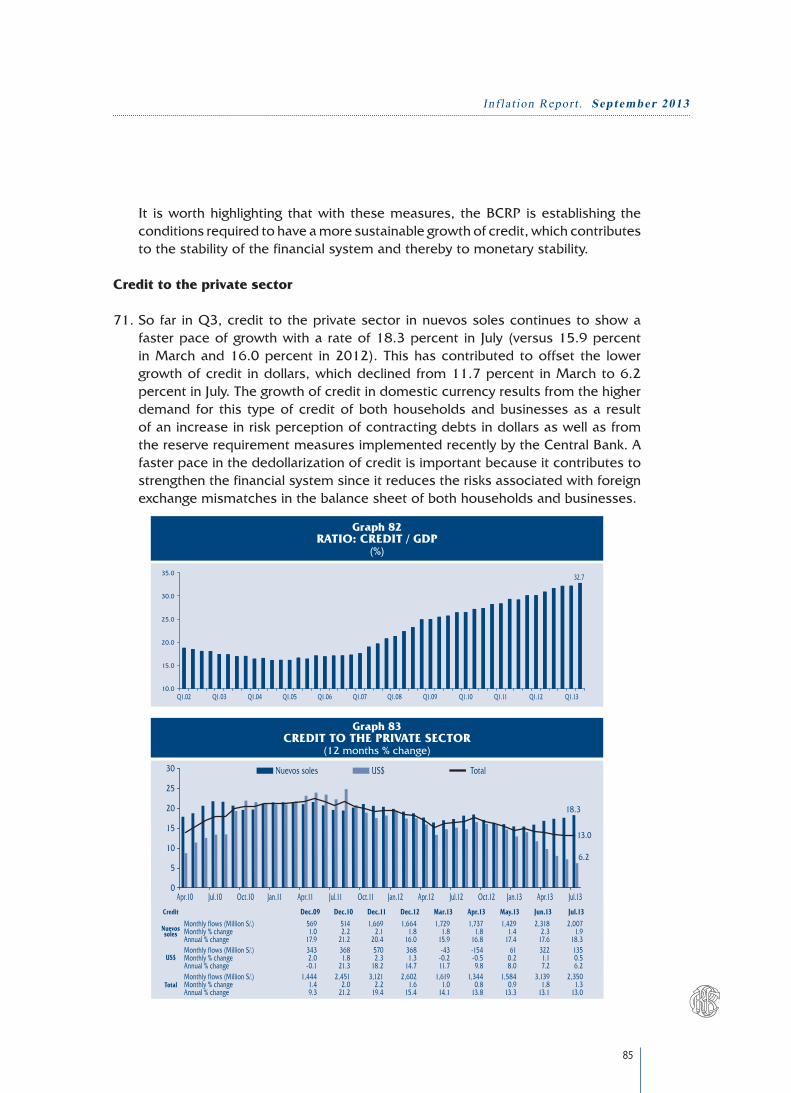
85
Inf la t ion Report . September 2013
It isworthhighlightingthatwiththesemeasures, theBCRP isestablishingtheconditionsrequiredtohaveamoresustainablegrowthofcredit,whichcontributestothestabilityofthefinancialsystemandtherebytomonetarystability.
Credit to the private sector
71.Sofar inQ3,credittotheprivatesector innuevossolescontinuestoshowafasterpaceofgrowthwitharateof18.3percent inJuly(versus15.9percentinMarchand16.0percent in2012).Thishascontributed tooffset the lowergrowthofcredit indollars,whichdeclinedfrom11.7percent inMarchto6.2percentinJuly.Thegrowthofcreditindomesticcurrencyresultsfromthehigherdemandfor this typeofcreditofbothhouseholdsandbusinessesasa resultofanincreaseinriskperceptionofcontractingdebtsindollarsaswellasfromthereserverequirementmeasuresimplementedrecentlybytheCentralBank.Afasterpaceinthededollarizationofcreditisimportantbecauseitcontributestostrengthenthefinancialsystemsinceitreducestherisksassociatedwithforeignexchangemismatchesinthebalancesheetofbothhouseholdsandbusinesses.
Q1.02 Q1.03 Q1.05 Q1.06 Q1.07 Q1.08 Q1.09 Q1.10 Q1.11 Q1.12 Q1.13
32.7
Q1.04
35.0
30.0
25.0
20.0
15.0
10.0
Graph 82RATIO: CREDIT / GDP
(%)
Graph 83CREDIT TO ThE PRIVATE SECTOR
(12months%change)
30
25
20
15
10
5
0
18.3
13.0
6.2
Nuevossoles US$ Total
Dec.09 Dec.10 Dec.11 Dec.12 Mar.13 Apr.13 May.13 jun.13 jul.13Monthlyflows(MillionS/.) 569 514 1,669 1,664 1,729 1,737 1,429 2,318 2,007Monthly%change 1.0 2.2 2.1 1.8 1.8 1.8 1.4 2.3 1.9Annual%change 17.9 21.2 20.4 16.0 15.9 16.8 17.4 17.6 18.3Monthlyflows(MillionS/.) 343 368 570 368 -43 -154 61 322 135Monthly%change 2.0 1.8 2.3 1.3 -0.2 -0.5 0.2 1.1 0.5Annual%change -0.1 21.3 18.2 14.7 11.7 9.8 8.0 7.2 6.2Monthlyflows(MillionS/.) 1,444 2,451 3,121 2,602 1,619 1,344 1,584 3,139 2,350Monthly%change 1.4 2.0 2.2 1.6 1.0 0.8 0.9 1.8 1.3Annual%change 9.3 21.2 19.4 15.4 14.1 13.8 13.3 13.1 13.0
Nuevossoles
Credit
uS$
Total
Apr.10 Apr.11 Apr.12 Apr.13Jul.10 Jul.11 Jul.12 Jul.13Jan.11 Jan.12 Jan.13Oct.10 Oct.11 Oct.12

86
CENTRAL RESERVE BANK OF PERU
The increaseddemand forcredit insolesamidacontextofgreaterpreferencefordepositsindollarshasledbankstoreducetheleveloftheir liquidassetsindomestic currency, especially theirCDBCRP and termdeposits at theBCRP, inordertomeetthisincreaseddemandforcreditinsoles.ThereductionoftheratesofreserverequirementsindomesticcurrencyestablishedbytheBCRPsinceearlyMayarecontributingtoreinforcethisprocessofde-dollarizationofcredit.
Agreaterrateofgrowthofcreditinsolesisalsoobservedbytypeofloans.Forexample,mortgage loans insolesgrew37.0percent,whilemortgage loans indollarsgrew4.7percent.Theaggregategrowthofcreditremainsatlevelsabove20percent.
Graph 85DOLLARIzATION RATIO: 2002 - 2013
(%)
80.0
70.0
60.0
50.0
40.0
30.0
20.0Jan.02 Jan.04Jan.03 Jan.05 Jan.06 Jan.07 Jan.08 Jan.09 Jan.10 Jan.11 Jan.12 Jan.13
40.842.8
30.029.2
Credit Liquidity
Graph 84CREDIT By TyPE OF LOANS: jANuARy 2010 - juLy 2013
(12months%change)
30
25
20
15
10
5
0
Dec.09 Dec.10 Dec.11 Dec.12 Mar.13 Apr.13 May.13 jun.13 jul.13Monthlyflows(MillionS/.) 965 1,478 2,162 1,673 1,176 533 626 2,384 1,869Monthly%change 1.5 1.9 2.3 1.6 1.1 0.5 0.6 2.2 1.7Annual%change 8.0 22.0 17.5 13.3 12.4 11.9 11.5 11.5 11.6Monthlyflows(MillionS/.) 479 973 959 929 443 811 958 755 481Monthly%change 1.4 2.4 1.9 1.5 0.7 1.3 1.5 1.2 0.7Annual%change 11.8 19.7 23.1 19.4 17.1 17.2 16.6 16.0 15.6Monthlyflows(MillionS/.) 314 687 593 471 52 367 514 365 175Monthly%change 1.4 2.7 1.9 1.3 0.1 1.0 1.4 1.0 0.5Annual%change 9.3 17.0 20.5 15.2 12.8 12.8 12.1 11.5 11.6Monthlyflows(MillionS/.) 165 287 366 458 391 444 444 390 306Monthly%change 1.4 1.9 1.9 1.9 1.5 1.7 1.7 1.5 1.1Annual%change 16.8 24.5 27.5 26.0 24.0 24.0 23.5 22.8 21.8
Corporate
Individuals
Consumer
Mortgage
Mortgage Consumer Corporates Individuals
Credit
Apr.10 Apr.11 Apr.12 Apr.13Jul.10 Jul.11 Jul.12 Jul.13Jan.11 Jan.12 Jan.13Oct.10 Oct.11 Oct.12
21.8
15.611.611.6
72.This evolution of credit and its components has favored a faster process ofde-dollarization of credit, as a result of which the dollarization of credit hasdeclinedfrom42.3percentinMarchto40.8percentinJuly.Ontheotherhand,thedollarizationofliquidityhasincreasedslightlyandrisenfrom29.2to30.0percentinthesameperiod.

87
Inf la t ion Report . September 2013
By typeof loans,mortgage loans showahigher rateofde-dollarization –thedollarizationratioofmortgagesfellfrom43.4to40.6percentbetweenMarchandJuly–,whilethisindicatorinthecaseofcorporateloanshasdeclinedfrom53.1percentinMarchto51.3percentinJuly.
Table 36RATIO OF DOLLARIZATION OF CREDIT TO THE PRIVATE SECTOR 1/
Dec.12 Jan.13 Feb.13 Mar.13 Apr.13 May.13 Jun.13 Jul.13
Corporate credit 53.8 53.9 53.8 53.1 52.4 52.2 51.8 51.3Individual credit 23.9 23.8 23.7 23.6 23.4 23.1 22.8 22.5 Consumer loans 9.7 9.8 9.8 9.8 9.8 9.8 9.7 9.6 Car loans 76.5 76.8 77.0 76.9 76.8 76.6 76.9 76.5 Credit cards 6.4 6.5 6.6 6.6 6.7 6.8 6.7 6.7 Mortgage loans 44.8 44.3 43.9 43.4 42.7 41.9 41.3 40.6TOTAL 43.0 42.9 42.8 42.3 41.7 41.4 41.2 40.8
1/ Includes banks’ branches from abroad.
Theflowofcreditbytypeofloansprovidesadditionalinformationthatconfirmsthefasterpaceoftheprocessofde-dollarizationofcredittotheprivatesector.Theratioofdollarizationoftheannualflowofcorporateloansandcredittolargecompanieshasdeclinedfrom100.0percentto35.4percentbetweenDecember2012andJuly2013.Asimilarbehaviorisobservedinthedollarizationratiooftheannual flowofmortgages,where this ratio fell from33.4to10.2percentbetweenDecember2012andJuly2013.Theannualflowofcredittomedium-sizedenterprisesalsoshowsadollarizationratiosignificantlylower,sinceithasfallenfrom61to45.2percentbetweenDecember2012andJuly2013.
Thus,theratioofdollarizationintheannualflowofcorporateloanshasdeclinedfrom55.2percentinDecember2012to28.4percentinJuly2013andtheratioofdollarizationintheannualflowofpersonalloanshasdroppedfrom23percentinDecember2012to10.5percentinJuly2013.
Itshouldbepointedoutthatthedollarizationratiosoftheannualflowofcreditarestillmeasuresthathaveahighinertialcomponent.TheaccumulatedflowofcreditinlocalcurrencytosmallandmicroenterprisesbetweenDecember2012and July2013wasS/.719million,whilecredit indollars recordedanegativeflowofUS$164million.Thiswouldbe indicating thatbanksno longerplaceloans inforeigncurrency inthissegmentandthatnoeffortshavebeenmadetorenewexistingones.Asimilarbehaviorisobservedintheaccumulatedflowofmortgage loans,which registereda totalofS/.2.55billion inmortgages inlocal currency and a negative flow of US$ 8million in mortgages in foreigncurrency.

88
CENTRAL RESERVE BANK OF PERU
Table 37CREDIT ACCORDING TO CURRENCY
Balance in Million S/. Annual flows Accumulated flows Growth rate (%) Dec.12 Jun.13 Jul.13 Dec.12 Jun.13 Jul.13 Jul.13/Dec.12 Jun.13/Jun.12 Jul.13/Jul.12 Jul.13/Jun.13
Corporate and large companies 48,632 51,255 53,492 3,771 4,910 5,401 4,861 10.6 11.2 4.4 D.C. 13,443 15,853 17,325 -191 2,546 3,489 3,883 19.1 25.2 9.3 F.C. (Million US$) 13,800 13,883 14,183 1,554 927 750 384 7.2 5.6 2.2 Dolarization (%) 72.4 70.9 69.5 100.0 48.2 35.4 20.1
Medium-sized enterprises 27,991 29,467 29,099 4,475 4,060 3,978 1,108 16.0 15.8 -1.3 D.C. 9,637 10,787 10,727 1,744 2,418 2,179 1,090 28.9 25.5 -0.6 F.C. (Million US$) 7,197 7,325 7,205 1,071 644 706 7 9.6 10.9 -1.6 Dolarization (%) 65.6 65.4 65.2 61.0 40.4 45.2 1.7
Small businesses 31,159 31,458 31,458 4,436 2,573 2,454 300 8.9 8.5 0.0 D.C. 26,715 27,394 27,434 4,125 2,944 2,810 719 12.0 11.4 0.1 F.C. (Million US$) 1,743 1,594 1,578 122 -145 -140 -164 -8.4 -8.1 -1.0 Dolarization (%) 14.3 13.9 13.8 7.0 0.0 0.0 0.0
TOTAL CREDIT TO BUSINESSES 107,781 112,180 114,049 12,681 11,543 11,833 6,268 11.5 11.6 1.7 D.C. 49,795 54,034 55,486 5,678 7,907 8,478 5,691 17.1 18.0 2.7 F.C. (Million US$) 22,740 22,803 22,966 2,746 1,426 1,316 226 6.7 6.1 0.7 Dolarization (%) 53.8 51.8 51.3 55.2 31.5 28.4 9.2 Consumer 36,423 38,048 38,223 4,815 3,933 3,986 1,801 11.5 11.6 0.5 D.C. 32,893 34,364 34,538 4,237 3,444 3,552 1,645 11.1 11.5 0.5 F.C. (Million US$) 1,384 1,445 1,445 227 192 170 61 15.3 13.3 0.0 Dolarization (%) 9.7 9.7 9.6 12.0 12.4 10.9 8.6
Mortgages 24,747 26,974 27,280 5,111 5,012 4,875 2,533 22.8 21.8 1.1 D.C. 13,662 15,836 16,217 3,402 4,266 4,377 2,554 36.9 37.0 2.4 F.C. (Million US$) 4,347 4,368 4,339 670 292 195 -8 7.2 4.7 -0.7 Dolarization (%) 44.8 41.3 40.6 33.4 14.9 10.2 0.0
Car loans 1,797 1,965 1,952 351 363 336 155 22.7 20.8 -0.7 D.C. 422 454 460 -34 0 20 37 0.1 4.5 1.3 F.C. (Million US$) 539 593 585 151 142 124 46 31.6 26.9 -1.3 Dolarization (%) 76.5 76.9 76.5 100.0 99.9 94.1 76.0
TOTAL CREDIT TO INDIVIDUALS 61,169 65,022 65,503 9,926 8,945 8,861 4,334 16.0 15.6 0.7 D.C. 46,555 50,200 50,755 7,638 7,710 7,929 4,200 18.1 18.5 1.1 F.C. (Million US$) 5,731 5,813 5,784 897 484 366 53 9.1 6.7 -0.5 Dolarization (%) 23.9 22.8 22.5 23.0 13.8 10.5 3.1 TOTAL 168,950 177,203 179,553 22,607 20,488 20,694 10,602 13.1 13.0 1.3 D.C. 96,350 104,234 106,240 13,316 15,618 16,407 9,891 17.6 18.3 1.9 F.C. (Million US$) 28,471 28,615 28,750 3,644 1,910 1,681 279 7.2 6.2 0.5 Dolarization (%) 43.0 41.2 40.8 41.1 23.8 20.7 6.7 Memo: Foreign trade 9,260 9,919 10,133 876 1,460 711 874 17.3 7.5 2.2 D.C. 342 430 578 -16 95 182 236 28.4 46.0 34.5 F.C. (Million US$) 3,497 3,721 3,747 350 535 207 250 16.8 5.9 0.7 Dolarization (%) 96.3 95.7 94.3 100.0 93.5 74.4 73.0
Rest 98,521 102,261 103,916 11,806 10,083 11,122 5,395 10.9 12.0 1.6 D.C. 49,452 53,604 54,907 5,694 7,812 8,296 5,455 17.1 17.8 2.4 F.C. (Million US$) 19,243 19,081 19,219 2,397 890 1,108 -24 4.9 6.1 0.7 Dolarization (%) 49.8 47.6 47.2 51.8 22.5 25.4 0.0
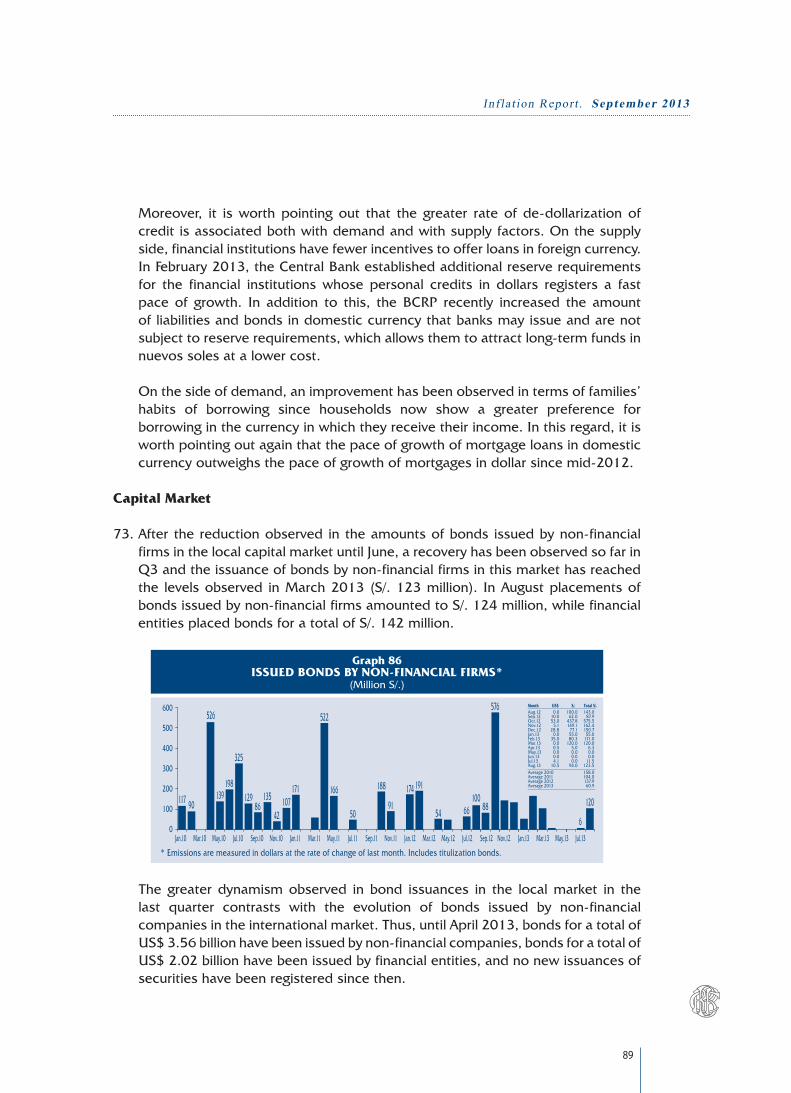
89
Inf la t ion Report . September 2013
Moreover, it isworthpointingout that the greater rateof de-dollarizationofcreditisassociatedbothwithdemandandwithsupplyfactors.Onthesupplyside,financialinstitutionshavefewerincentivestoofferloansinforeigncurrency.InFebruary2013,theCentralBankestablishedadditionalreserverequirementsfor the financial institutionswhose personal credits in dollars registers a fastpace of growth. In addition to this, theBCRP recently increased the amountofliabilitiesandbondsindomesticcurrencythatbanksmayissueandarenotsubjecttoreserverequirements,whichallowsthemtoattractlong-termfundsinnuevossolesatalowercost.
Onthesideofdemand,animprovementhasbeenobservedintermsoffamilies’habits of borrowing since households now show a greater preference forborrowinginthecurrencyinwhichtheyreceivetheirincome.Inthisregard,itisworthpointingoutagainthatthepaceofgrowthofmortgageloansindomesticcurrencyoutweighsthepaceofgrowthofmortgagesindollarsincemid-2012.
Capital Market
73.After thereductionobserved intheamountsofbonds issuedbynon-financialfirmsinthelocalcapitalmarketuntilJune,arecoveryhasbeenobservedsofarinQ3andtheissuanceofbondsbynon-financialfirmsinthismarkethasreachedthe levelsobserved inMarch2013 (S/.123million). InAugustplacementsofbondsissuedbynon-financialfirmsamountedtoS/.124million,whilefinancialentitiesplacedbondsforatotalofS/.142million.
Graph 86ISSuED BONDS By NON-FINANCIAL FIRMS*
(MillionS/.)
600
500
400
300
200
100
0Jan.10
117 90
526
139198
325
12986
135
42107
171
522
166
50
188
91
174 191
54 66 88
576
100 120
6
Jan.11 Jan.12 Jan.13Mar.10 Mar.11 Mar.12 Mar.13 Jul.13May.10 May.11 May.12 May.13Jul.10 Jul.11 Jul.12Sep.10 Sep.11 Sep.12 Nov.12Nov.10 Nov.11
*Emissionsaremeasuredindollarsattherateofchangeoflastmonth.Includestitulizationbonds.
Month uS$ S/. Total S/.Aug.12 0.0 100.0 143.0Sep.12 10.0 62.0 87.9Oct.12 53.0 437.8 575.5Nov.12 5.1 149.1 162.4Dec.12 28.8 77.1 150.7Jan.13 0.0 55.0 55.0Feb.13 35.0 80.3 171.0Mar.13 0.0 120.0 120.0Apr.13 0.5 5.0 6.3May.13 0.0 0.0 0.0Jun.13 0.0 0.0 0.0Jul.13 4.1 0.0 11.5Aug.13 10.5 94.0 123.5Average2010 158.0Average2011 104.0Average2012 137.9Average2013 60.9
The greaterdynamismobserved in bond issuances in the localmarket in thelast quarter contrasts with the evolution of bonds issued by non-financialcompaniesintheinternationalmarket.Thus,untilApril2013,bondsforatotalofUS$3.56billionhavebeenissuedbynon-financialcompanies,bondsforatotalofUS$2.02billionhavebeenissuedbyfinancialentities,andnonewissuancesofsecuritieshavebeenregisteredsincethen.
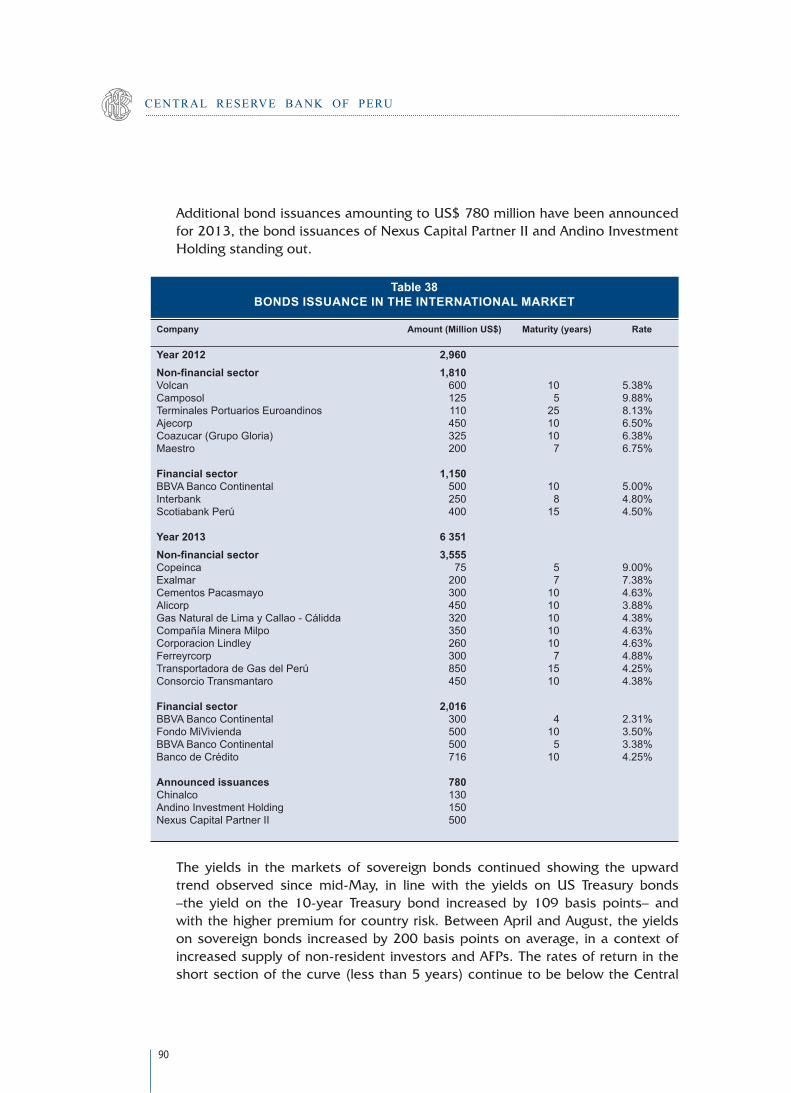
90
CENTRAL RESERVE BANK OF PERU
AdditionalbondissuancesamountingtoUS$780millionhavebeenannouncedfor2013,thebondissuancesofNexusCapitalPartnerIIandAndinoInvestmentHoldingstandingout.
Table 38BONDS ISSUANCE IN THE INTERNATIONAL MARKET
Company Amount (Million US$) Maturity (years) Rate
Year 2012 2,960 Non-financial sector 1,810 Volcan 600 10 5.38%Camposol 125 5 9.88%Terminales Portuarios Euroandinos 110 25 8.13%Ajecorp 450 10 6.50%Coazucar (Grupo Gloria) 325 10 6.38%Maestro 200 7 6.75%
Financial sector 1,150 BBVA Banco Continental 500 10 5.00%Interbank 250 8 4.80%Scotiabank Perú 400 15 4.50% Year 2013 6 351 Non-financial sector 3,555 Copeinca 75 5 9.00%Exalmar 200 7 7.38%Cementos Pacasmayo 300 10 4.63%Alicorp 450 10 3.88%Gas Natural de Lima y Callao - Cálidda 320 10 4.38%Compañía Minera Milpo 350 10 4.63%Corporacion Lindley 260 10 4.63%Ferreyrcorp 300 7 4.88%Transportadora de Gas del Perú 850 15 4.25%Consorcio Transmantaro 450 10 4.38%
Financial sector 2,016 BBVA Banco Continental 300 4 2.31%Fondo MiVivienda 500 10 3.50%BBVA Banco Continental 500 5 3.38%Banco de Crédito 716 10 4.25%
Announced issuances 780 Chinalco 130 Andino Investment Holding 150 Nexus Capital Partner II 500
The yields in themarkets of sovereign bonds continued showing the upwardtrend observed sincemid-May, in line with the yields on US Treasury bonds–the yield on the 10-year Treasury bond increased by 109 basis points– andwiththehigherpremiumforcountryrisk.BetweenAprilandAugust,theyieldsonsovereignbondsincreasedby200basispointsonaverage, inacontextofincreasedsupplyofnon-residentinvestorsandAFPs.Theratesofreturnintheshortsectionofthecurve(lessthan5years)continuetobebelowtheCentral

91
Inf la t ion Report . September 2013
Bank’sbenchmarkrate.TheyieldonPERU2037sovereignbondshasincreasedby212basispointsfromApriltoAugust2013,whiletheyieldonPERU2037globalbondhasincreasedby162basispointsinthesameperiod.
Graph 87SECONDARy MARKET OF SOVEREIGN BONDS 1/
1/Endofmonthyield.
0 5 10 15 20 25 30
8.07.57.06.56.05.55.04.54.03.53.02.52.01.51.00.50.0
yield
(%)
Maturity (years)
Aug.13
Dec.12
Jun.13
Table 39PERU GLOBAL AND SOVEREIGN BOND YIELDS
AND US TREASURY BONDS BY MATURITY (At the end of period, in percentage points)
Variation (In bps) Dec.12 Apr.13 Aug.13 Aug.13/Apr.13 Aug.13/Dec.12 (3) (2) (1) (1)-(2) (1)-(3)
Sovereign bonds (S/.)PERU 2013 2.70 1.40 3.21 181 51PERU 2015 2.71 1.70 4.00 230 129PERU 2017 3.05 2.80 4.85 205 180PERU 2020 3.80 3.87 5.70 183 190PERU 2023 4.09 4.13 5.96 183 187PERU 2026 4.24 4.28 6.05 177 181PERU 2031 4.79 4.83 7.00 217 221PERU 2037 4.90 4.92 7.04 212 214PERU 2042 5.10 5.04 7.15 211 205
Global bonds (US$) PERU 2015 0.82 0.19 0.71 52 -11PERU 2016 1.10 1.07 2.25 118 115PERU 2019 1.84 1.76 3.22 147 138PERU 2025 3.00 3.06 4.64 159 165PERU 2033 3.64 3.75 5.52 177 188PERU 2037 3.70 3.97 5.59 162 189
US Treasury 2 Years Bond 0.25 0.21 0.40 19 153 Years Bond 0.35 0.31 0.77 46 425 Years Bond 0.71 0.68 1.61 94 9010 Years Bond 1.70 1.67 2.76 109 10630 Years Bond 2.87 2.88 3.72 84 85
Source: Bloomberg.
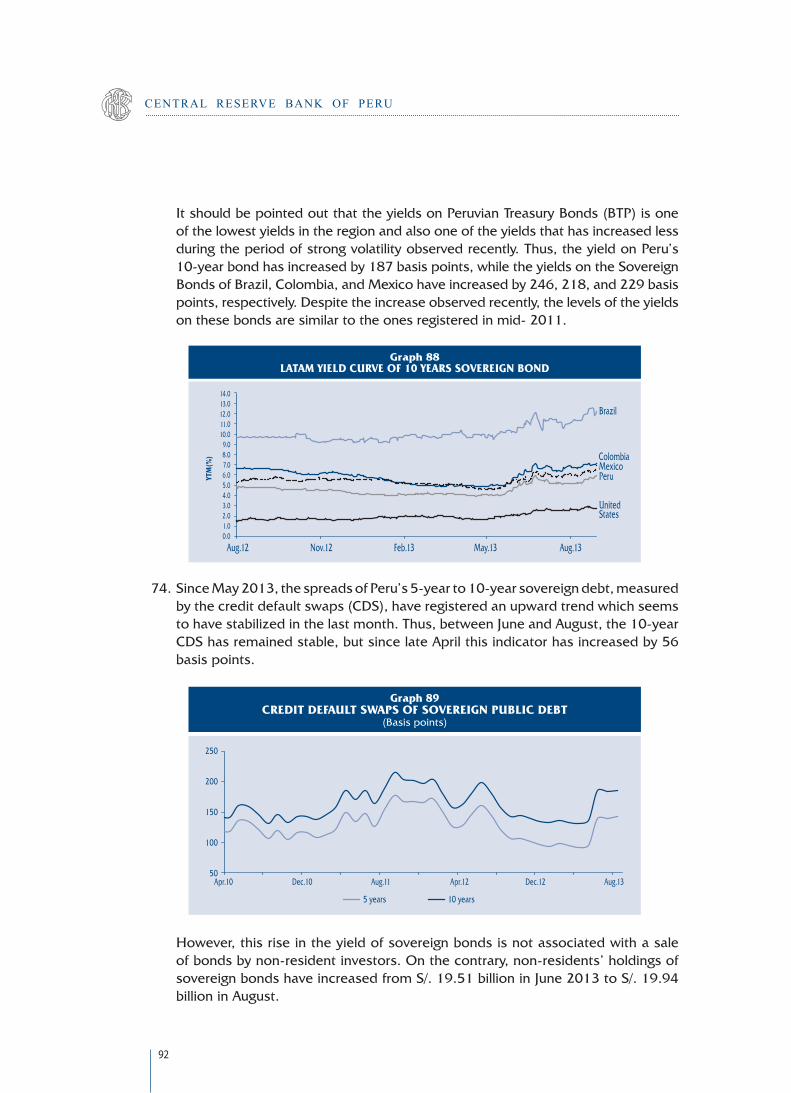
92
CENTRAL RESERVE BANK OF PERU
ItshouldbepointedoutthattheyieldsonPeruvianTreasuryBonds(BTP)isoneofthelowestyieldsintheregionandalsooneoftheyieldsthathasincreasedlessduringtheperiodofstrongvolatilityobservedrecently.Thus,theyieldonPeru’s10-yearbondhasincreasedby187basispoints,whiletheyieldsontheSovereignBondsofBrazil,Colombia,andMexicohaveincreasedby246,218,and229basispoints,respectively.Despitetheincreaseobservedrecently,thelevelsoftheyieldsonthesebondsaresimilartotheonesregisteredinmid-2011.
Graph 88
LATAM yIELD CuRVE OF 10 yEARS SOVEREIGN BOND
Aug.12 Nov.12 Feb.13 May.13 Aug.13
14.013.012.011.010.09.08.07.06.05.04.03.02.01.00.0
yTM
(%) Colombia
MexicoPeru
UnitedStates
Brazil
Graph 89CREDIT DEFAuLT SwAPS OF SOVEREIGN PuBLIC DEBT
(Basispoints)
250
200
150
100
50Apr.10 Dec.10 Aug.11 Apr.12 Dec.12 Aug.13
5years 10years
74.SinceMay2013,thespreadsofPeru’s5-yearto10-yearsovereigndebt,measuredbythecreditdefaultswaps(CDS),haveregisteredanupwardtrendwhichseemstohavestabilizedinthelastmonth.Thus,betweenJuneandAugust,the10-yearCDShasremainedstable,butsincelateAprilthisindicatorhasincreasedby56basispoints.
However,thisriseintheyieldofsovereignbondsisnotassociatedwithasaleofbondsbynon-residentinvestors.Onthecontrary,non-residents’holdingsofsovereignbondshaveincreasedfromS/.19.51billioninJune2013toS/.19.94billioninAugust.
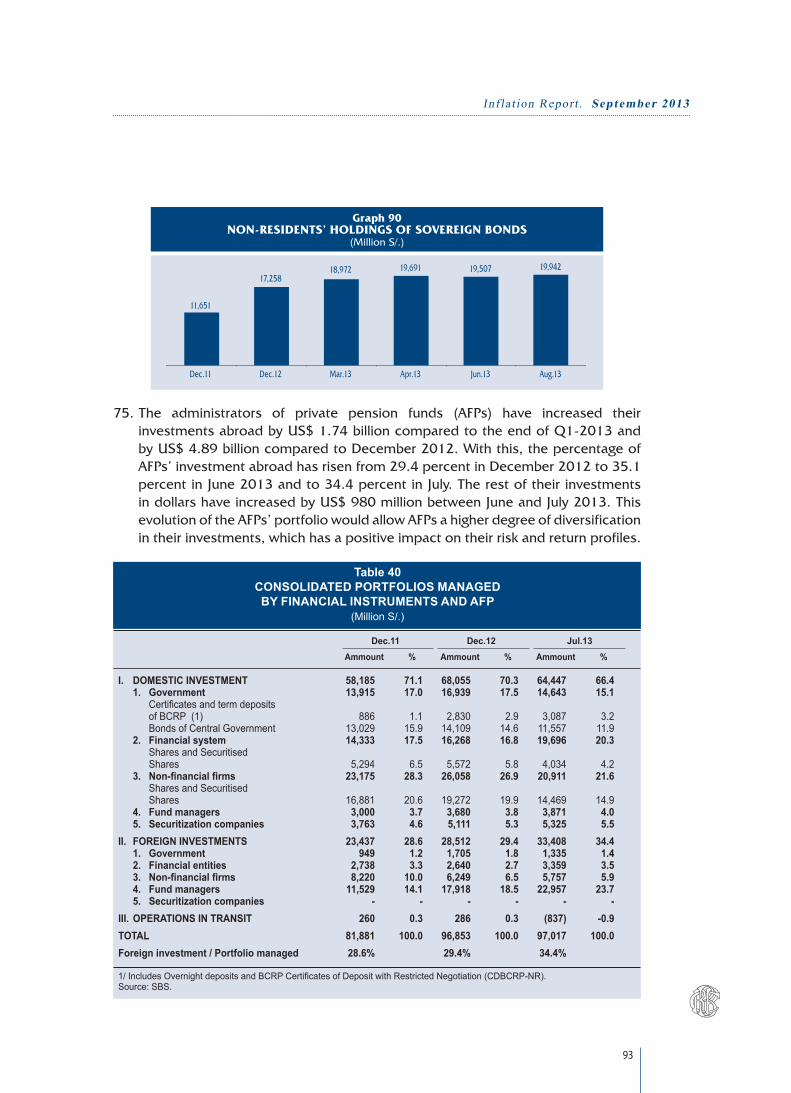
93
Inf la t ion Report . September 2013
75.The administrators of private pension funds (AFPs) have increased theirinvestmentsabroadbyUS$1.74billioncomparedtotheendofQ1-2013andbyUS$4.89billioncomparedtoDecember2012.Withthis,thepercentageofAFPs’investmentabroadhasrisenfrom29.4percentinDecember2012to35.1percentinJune2013andto34.4percentinJuly.TherestoftheirinvestmentsindollarshaveincreasedbyUS$980millionbetweenJuneandJuly2013.ThisevolutionoftheAFPs’portfoliowouldallowAFPsahigherdegreeofdiversificationintheirinvestments,whichhasapositiveimpactontheirriskandreturnprofiles.
Graph 90NON-RESIDENTS’ hOLDINGS OF SOVEREIGN BONDS
(MillionS/.)
Dec.11
11,651
Dec.12
17,258
Mar.13
18,972
Apr.13
19,691
Jun.13
19,507
Aug.13
19,942
Table 40CONSOLIDATED PORTFOLIOS MANAGED BY FINANCIAL INSTRUMENTS AND AFP
(Million S/.)
Dec.11 Dec.12 Jul.13 Ammount % Ammount % Ammount %
I. DOMESTIC INVESTMENT 58,185 71.1 68,055 70.3 64,447 66.4 1. Government 13,915 17.0 16,939 17.5 14,643 15.1 Certificatesandtermdeposits of BCRP (1) 886 1.1 2,830 2.9 3,087 3.2 Bonds of Central Government 13,029 15.9 14,109 14.6 11,557 11.9 2. Financial system 14,333 17.5 16,268 16.8 19,696 20.3 Shares and Securitised Shares 5,294 6.5 5,572 5.8 4,034 4.2 3. Non-financial firms 23,175 28.3 26,058 26.9 20,911 21.6 Shares and Securitised Shares 16,881 20.6 19,272 19.9 14,469 14.9 4. Fund managers 3,000 3.7 3,680 3.8 3,871 4.0 5. Securitization companies 3,763 4.6 5,111 5.3 5,325 5.5II. FOREIGN INVESTMENTS 23,437 28.6 28,512 29.4 33,408 34.4 1. Government 949 1.2 1,705 1.8 1,335 1.4 2. Financial entities 2,738 3.3 2,640 2.7 3,359 3.5 3. Non-financial firms 8,220 10.0 6,249 6.5 5,757 5.9 4. Fund managers 11,529 14.1 17,918 18.5 22,957 23.7 5. Securitization companies - - - - - -III. OPERATIONS IN TRANSIT 260 0.3 286 0.3 (837) -0.9TOTAL 81,881 100.0 96,853 100.0 97,017 100.0Foreign investment / Portfolio managed 28.6% 29.4% 34.4%
1/IncludesOvernightdepositsandBCRPCertificatesofDepositwithRestrictedNegotiation(CDBCRP-NR).Source: SBS.
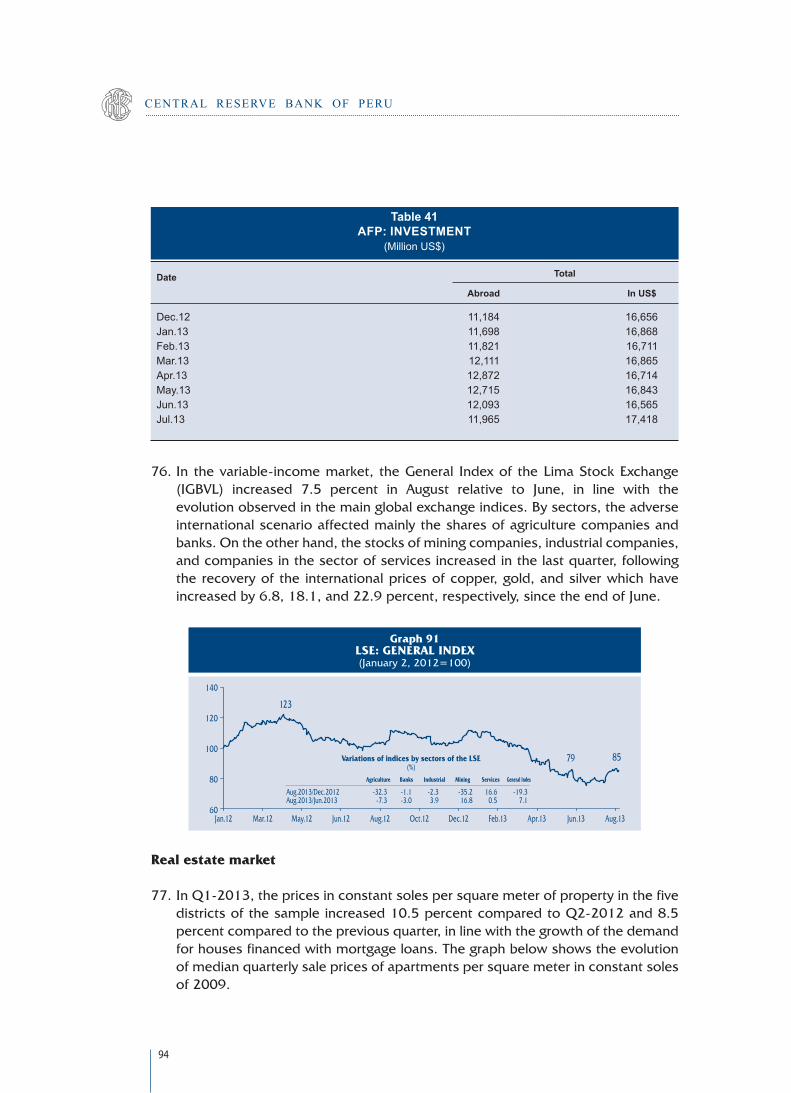
94
CENTRAL RESERVE BANK OF PERU
76.In thevariable-incomemarket, theGeneral Indexof theLimaStockExchange(IGBVL) increased 7.5 percent in August relative to June, in line with theevolutionobservedinthemainglobalexchangeindices.Bysectors,theadverseinternationalscenarioaffectedmainlythesharesofagriculturecompaniesandbanks.Ontheotherhand,thestocksofminingcompanies,industrialcompanies,andcompaniesinthesectorofservicesincreasedinthelastquarter,followingtherecoveryofthe internationalpricesofcopper,gold,andsilverwhichhaveincreasedby6.8,18.1,and22.9percent,respectively,sincetheendofJune.
Table 41AFP: INVESTMENT
(Million US$) Date Total
Abroad In US$
Dec.12 11,184 16,656Jan.13 11,698 16,868Feb.13 11,821 16,711Mar.13 12,111 16,865Apr.13 12,872 16,714May.13 12,715 16,843Jun.13 12,093 16,565Jul.13 11,965 17,418
Graph 91LSE: GENERAL INDEX(January2,2012=100)
140
120
100
80
60Jan.12 Mar.12 May.12 Jun.12 Aug.12 Oct.12 Dec.12 Feb.13 Apr.13 Jun.13 Aug.13
123
79 85Variations of indices by sectors of the LSE(%)
Agriculture Banks Industrial Mining Services General Index
Aug.2013/Dec.2012 -32.3 -1.1 -2.3 -35.2 16.6 -19.3Aug.2013/Jun.2013 -7.3 -3.0 3.9 16.8 0.5 7.1
Real estate market
77.InQ1-2013,thepricesinconstantsolespersquaremeterofpropertyinthefivedistrictsofthesampleincreased10.5percentcomparedtoQ2-2012and8.5percentcomparedtothepreviousquarter,inlinewiththegrowthofthedemandforhousesfinancedwithmortgageloans.Thegraphbelowshowstheevolutionofmedianquarterlysalepricesofapartmentspersquaremeterinconstantsolesof2009.

95
Inf la t ion Report . September 2013
Sale price-to-income for annual rent ratio (price to earnings ratio - PER).
The price-to-earnings ratio (PER), which shows the number of years of rentrequiredtorecoverthepurchasingvalueofaproperty,hasshownstablevaluesof15and16overthelastyearsandhasremainedwithintherangesconsideredas normal, according to the criteria taken into account by Global PropertyGuide.
Q1.98 Q1.99 Q1.00 Q1.01 Q1.02 Q1.03 Q1.04 Q1.05 Q1.06 Q1.07 Q1.08 Q1.09 Q1.10 Q1.11 Q1.12 Q1.13
S/.2,549
S/.4,553
Average of period1998 I - 2013 II
S/. 2,574
5,000
4,500
4,000
3,500
3,000
2,500
2,000
1,500
Graph 92MEDIANS OF QuARTERLy SALE PRICES PER SQuARE METER OF APARTMENTS
(LaMolina,Miraflores,SanBorja,SanIsidroandSurco)(Base2009=100)
Table 42PER: PRICE TO EARNING RATIO
2011-Q1 2011-Q2 2011-Q3 2011-Q4 2012-Q1 2012-Q2 2012-Q3 2012-Q4 2013-Q1 2013-Q2
Jesús María 12.6 13.1 12.9 13.0 13.0 15.7 15.5 14.9 15.0 15.6La Molina 16.5 17.2 15.2 15.8 12.7 10.7 12.4 11.6 13.7 14.7Lince 14.3 15.6 16.5 14.1 13.9 14.2 14.2 16.4 14.1 14.6Magdalena 11.6 13.7 12.7 12.5 14.5 14.1 13.1 16.0 14.0 14.5Miraflores 12.9 14.0 15.6 15.7 19.0 17.0 15.3 15.0 14.8 16.5Pueblo Libre 15.6 15.6 15.0 15.3 15.4 16.5 15.2 16.0 14.1 14.3San Borja 15.3 17.2 16.6 17.2 15.3 19.5 16.8 18.2 18.6 17.5San Isidro 15.6 15.9 14.9 16.7 19.7 17.7 17.2 18.4 18.0 17.2San Miguel 17.7 15.9 13.7 12.8 14.8 15.3 16.1 15.6 14.4 14.8Surco 15.9 15.8 13.3 16.3 16.6 16.7 17.1 15.0 16.8 16.3
Aggregated Average 14.8 15.4 14.6 14.9 15.5 15.7 15.3 15.7 15.3 15.6
1/ Rates have been calculated using the sale price median and rent of each district. AccordingtothePERindex,GlobalPropertyGuideclassifiestherealestatemarket inpropertieswithUndervaluedPrices(5.0- 12.5), Normal Prices (12.5-25.0), and Overvalued Prices (25.0-50.0).Source: BCRP.
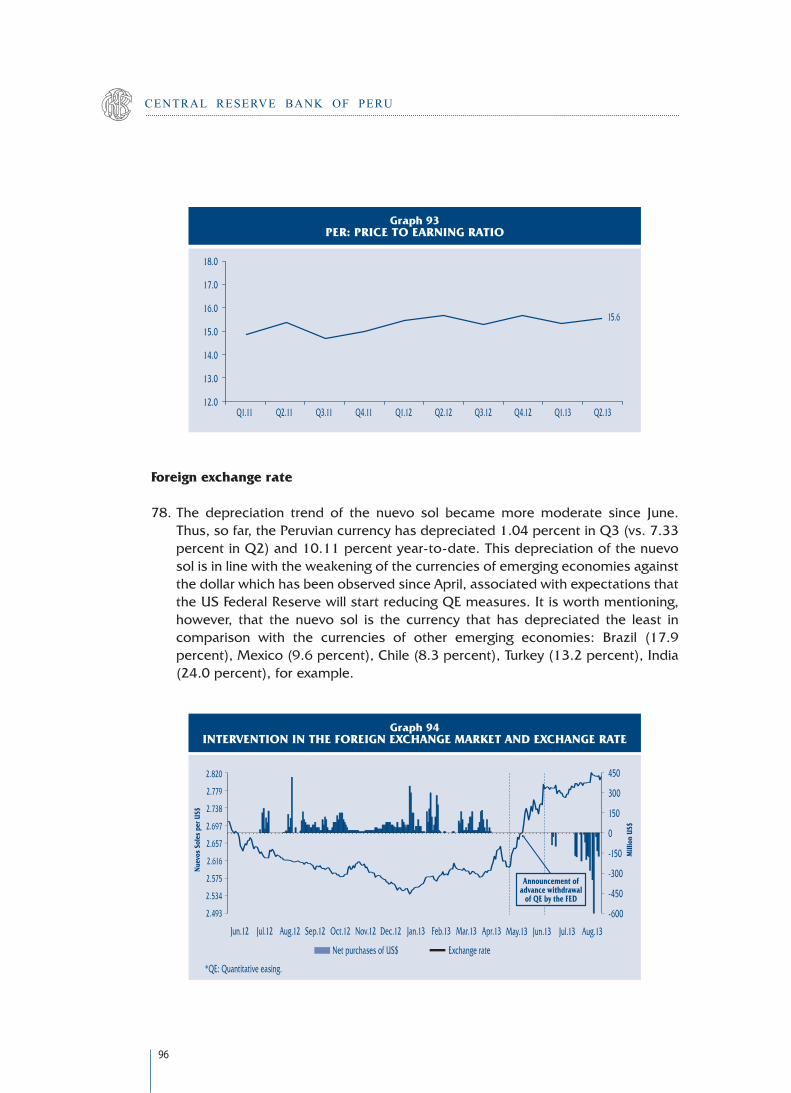
96
CENTRAL RESERVE BANK OF PERU
Foreign exchange rate
78.The depreciation trend of the nuevo sol becamemoremoderate since June.Thus,sofar,thePeruviancurrencyhasdepreciated1.04percentinQ3(vs.7.33percentinQ2)and10.11percentyear-to-date.ThisdepreciationofthenuevosolisinlinewiththeweakeningofthecurrenciesofemergingeconomiesagainstthedollarwhichhasbeenobservedsinceApril,associatedwithexpectationsthattheUSFederalReservewillstartreducingQEmeasures.Itisworthmentioning,however, that thenuevo sol is the currency that hasdepreciated the least incomparison with the currencies of other emerging economies: Brazil (17.9percent),Mexico(9.6percent),Chile(8.3percent),Turkey(13.2percent),India(24.0percent),forexample.
Graph 93PER: PRICE TO EARNING RATIO
18.0
17.0
16.0
15.0
14.0
13.0
12.0Q1.11 Q2.11 Q3.11 Q4.11
15.6
Q1.12 Q2.12 Q3.12 Q4.12 Q1.13 Q2.13
Graph 94INTERVENTION IN ThE FOREIGN EXChANGE MARKET AND EXChANGE RATE
Jun.12 Jul.12 Aug.12 Sep.12 Oct.12 Nov.12 Dec.12 Jan.13 Feb.13 Mar.13 Apr.13 May.13 Jun.13 Jul.13 Aug.13
2.820
2.779
2.738
2.697
2.657
2.616
2.575
2.534
2.493
450
300
150
0
-150
-300
-450
-600
Nue
vos
Sole
s pe
r uS$
Mill
ion
uS$
NetpurchasesofUS$
*QE:Quantitativeeasing.
Exchangerate
Announcement of advance withdrawal
of QE by the FED
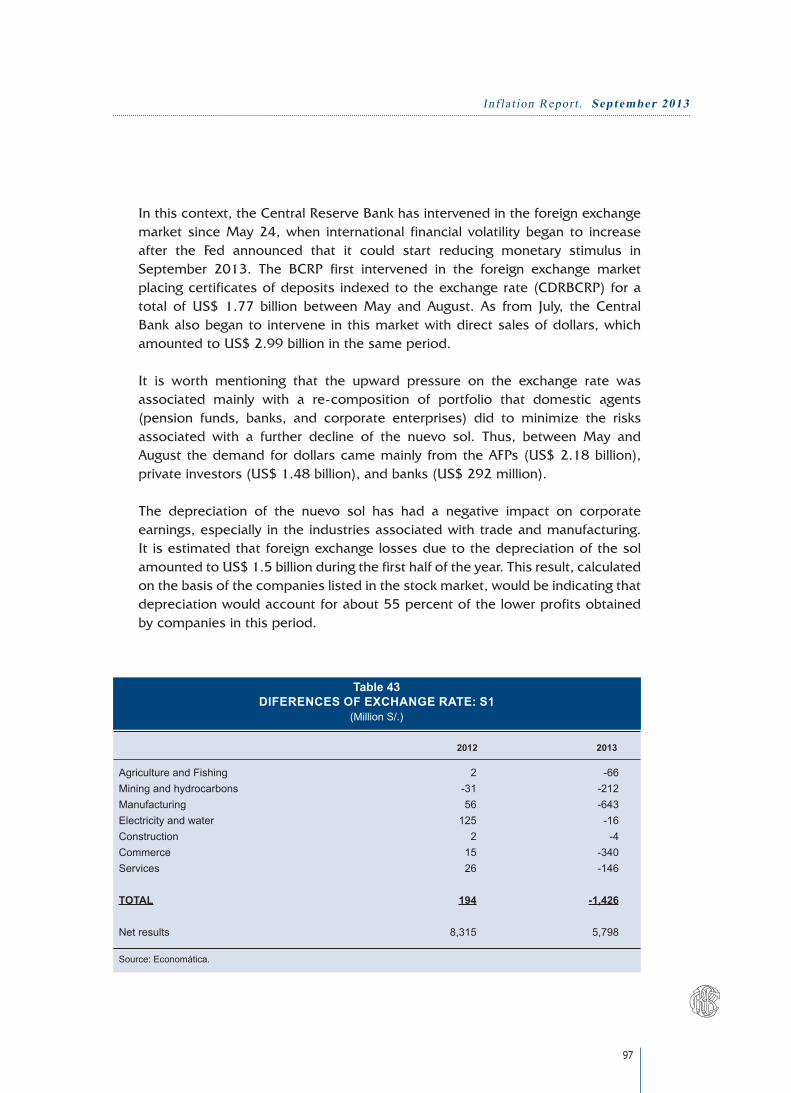
97
Inf la t ion Report . September 2013
Inthiscontext,theCentralReserveBankhasintervenedintheforeignexchangemarket sinceMay24,when international financial volatilitybegan to increaseafter the Fed announced that it could start reducing monetary stimulus inSeptember 2013. The BCRP first intervened in the foreign exchange marketplacingcertificatesofdeposits indexedtotheexchangerate(CDRBCRP)foratotal of US$ 1.77 billion betweenMay and August. As from July, the CentralBankalsobeganto interveneinthismarketwithdirectsalesofdollars,whichamountedtoUS$2.99billioninthesameperiod.
It is worth mentioning that the upward pressure on the exchange rate wasassociated mainly with a re-composition of portfolio that domestic agents(pension funds, banks, and corporate enterprises) did to minimize the risksassociated with a further decline of the nuevo sol. Thus, betweenMay andAugust thedemandfordollarscamemainly fromtheAFPs(US$2.18billion),privateinvestors(US$1.48billion),andbanks(US$292million).
The depreciation of the nuevo sol has had a negative impact on corporateearnings,especially intheindustriesassociatedwithtradeandmanufacturing.ItisestimatedthatforeignexchangelossesduetothedepreciationofthesolamountedtoUS$1.5billionduringthefirsthalfoftheyear.Thisresult,calculatedonthebasisofthecompanieslistedinthestockmarket,wouldbeindicatingthatdepreciationwouldaccountforabout55percentofthelowerprofitsobtainedbycompaniesinthisperiod.
Table 43DIFERENCES OF EXCHANGE RATE: S1
(Million S/.) 2012 2013
Agriculture and Fishing 2 -66Mining and hydrocarbons -31 -212Manufacturing 56 -643Electricity and water 125 -16Construction 2 -4Commerce 15 -340Services 26 -146
TOTAL 194 -1,426
Net results 8,315 5,798
Source: Economática.

98
CENTRAL RESERVE BANK OF PERU
AnincreaseofS/.251millioninnon-residents’holdingsofPeru’sTreasurybonds,aswellasanaccumulationofbanks’averageovernightdepositsindollarsofuptoUS$2.0billionandinterestratesindollarsthatreachedtheirminimumlevelswasobserved in thisperiod. Allof these indicators reflectexcess liquidity indollars inbanks,which isnotasituationconsistentwithascenarioofcapitaloutflows.
Graph 95FOREX MARKET FLOwS: juNE-AuGuST
(MillionUS$)
DEMAND
SUPPLY
3,000
2,000
1,000
0
-1,000
-2,000
-3,000
-4,000
Spotandnetforward
AFP Non-residents Privates BanksBancióndelaNaciónandfinancialcompanies
BCRP
Spot Forward Spotandnetforward Spotandnetforward Exchangerate Intervention
2,177
136
-538
1,498
156 291
-3,720
3,000
2,000
1,000
0
-1,000
-2,000
-3,000Aug.09 Apr.10 Aug.11 Apr.12 Aug.13Dec.12Dec.10
Graph 96BALANCE OF FORwARD NET PuRChASES
(MillionUS$)
Intheforwardmarket,netpurchasesofdollarsregisteredasignificantdecline(thebalanceoftransactionsattheendofAugustwaslowerbyUS$793millionthantheonerecordedattheendofQ2),whichreflectsincreasedexpectationsofadepreciation.
79.TheBCRPsurveyonmacroeconomicexpectationsshowsthatalltheeconomicagents have reversed their expectations due to uncertainty about the globaleconomicoutlookandduetothepossibilitythatmonetarystimuluswillstarttobewithdrawnintheUnitedStates.
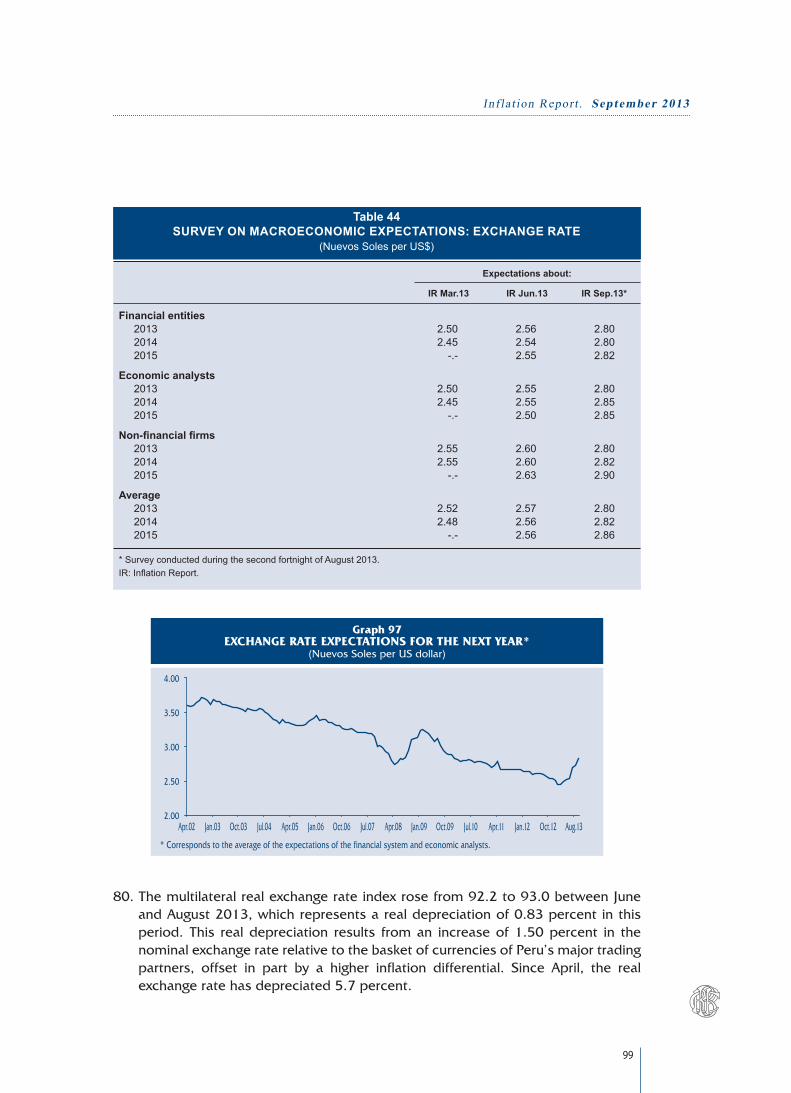
99
Inf la t ion Report . September 2013
80.Themultilateralrealexchangerateindexrosefrom92.2to93.0betweenJuneandAugust2013,whichrepresentsarealdepreciationof0.83percentinthisperiod.This realdepreciation results froman increaseof1.50percent in thenominalexchangeraterelativetothebasketofcurrenciesofPeru’smajortradingpartners, offset in part by a higher inflation differential. Since April, the realexchangeratehasdepreciated5.7percent.
Graph 97EXChANGE RATE EXPECTATIONS FOR ThE NEXT yEAR*
(NuevosSolesperUSdollar)
4.00
3.50
3.00
2.50
2.00Apr.02 Jan.03 Oct.03 Jul.04 Apr.05 Jan.06 Oct.06 Jul.07 Apr.08 Jan.09 Oct.09 Jul.10 Apr.11 Jan.12 Oct.12 Aug.13
*Correspondstotheaverageoftheexpectationsofthefinancialsystemandeconomicanalysts.
Table 44SURVEY ON MACROECONOMIC EXPECTATIONS: EXCHANGE RATE
(Nuevos Soles per US$) Expectations about:
IR Mar.13 IR Jun.13 IR Sep.13*
Financial entities 2013 2.50 2.56 2.80 2014 2.45 2.54 2.80 2015 -.- 2.55 2.82
Economic analysts 2013 2.50 2.55 2.80 2014 2.45 2.55 2.85 2015 -.- 2.50 2.85
Non-financial firms 2013 2.55 2.60 2.80 2014 2.55 2.60 2.82 2015 -.- 2.63 2.90
Average 2013 2.52 2.57 2.80 2014 2.48 2.56 2.82 2015 -.- 2.56 2.86
* Survey conducted during the second fortnight of August 2013.IR:InflationReport.
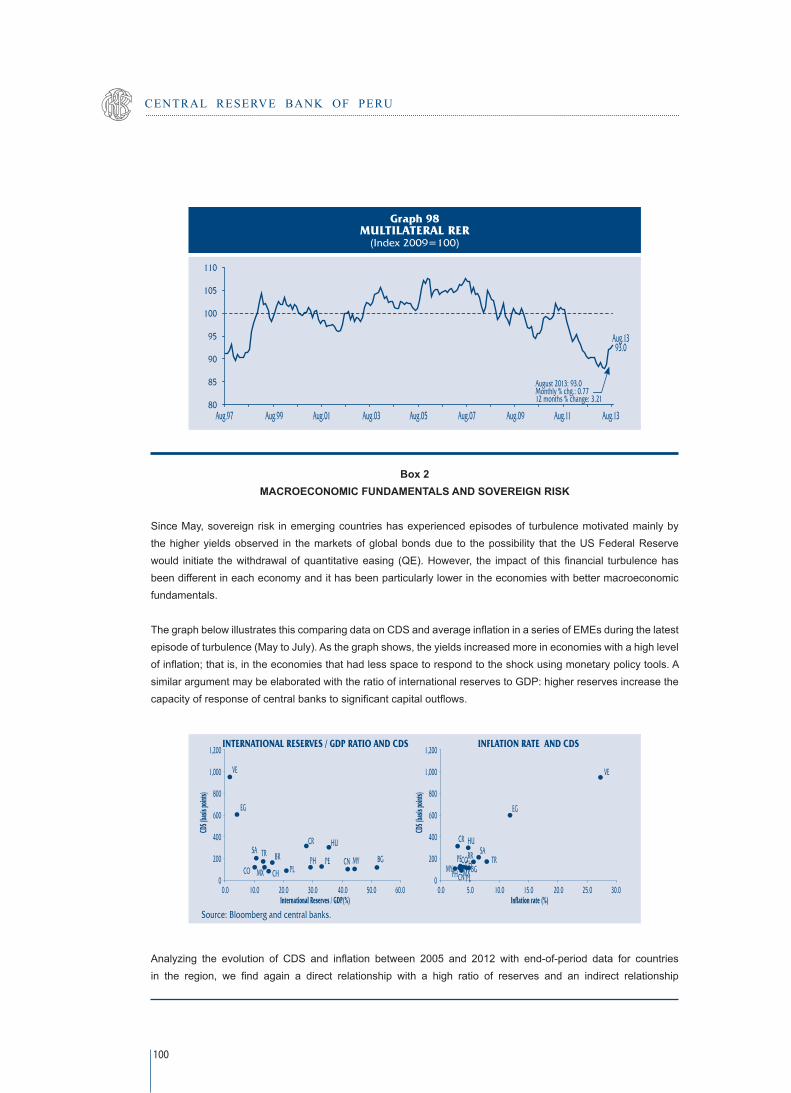
100
CENTRAL RESERVE BANK OF PERU
Graph 98MuLTILATERAL RER(Index2009=100)
110
105
100
95
90
85
80Aug.97 Aug.99 Aug.01 Aug.03 Aug.05 Aug.07 Aug.09 Aug.11 Aug.13
Aug.1393.0
August2013:93.0Monthly%chg.:0.7712months%change:3.21
Box 2MACROECONOMIC FUNDAMENTALS AND SOVEREIGN RISK
Since May, sovereign risk in emerging countries has experienced episodes of turbulence motivated mainly by the higher yields observed in the markets of global bonds due to the possibility that the US Federal Reserve would initiate thewithdrawalofquantitativeeasing (QE).However, the impactof thisfinancial turbulencehasbeen different in each economy and it has been particularly lower in the economies with better macroeconomic fundamentals.
ThegraphbelowillustratesthiscomparingdataonCDSandaverageinflationinaseriesofEMEsduringthelatestepisode of turbulence (May to July). As the graph shows, the yields increased more in economies with a high level ofinflation;thatis,intheeconomiesthathadlessspacetorespondtotheshockusingmonetarypolicytools.Asimilar argument may be elaborated with the ratio of international reserves to GDP: higher reserves increase the capacityofresponseofcentralbankstosignificantcapitaloutflows.
Analyzing the evolution of CDS and inflation between 2005 and 2012 with end-of-period data for countriesin the region, we find again a direct relationship with a high ratio of reserves and an indirect relationship
1,200
1,000
800
600
400
200
0
1,200
1,000
800
600
400
200
00.0 0.0
VE
EG
SA TR BR
CO MX CH PLPH PE
HUCR
CN MY BG
EG
VE
CR HUSA
TRRRCOCHBGPLMXCN
MYPH
PE
10.0 5.020.0 10.030.0 15.040.0 20.050.0 25.060.0 30.0
CDS (
basis p
oints)
CDS (
basis p
oints)
Inflation rate (%)International Reserves / GDP(%)
INTERNATIONAL RESERVES / GDP RATIO AND CDS INFLATION RATE AND CDS
Source:Bloombergandcentralbanks.

101
Inf la t ion Report . September 2013
with inflation rates, the former being more clear in the periods prior to the subprime financial crisis (2008-2009).
These outcomes are consistent with the results reported by Aizenmann, Jinjarak, and Park (2013), who conclude that external factors were predominant in determining sovereign risk before the crisis, but that internal factors associatedwiththecapacitytorespondtoadverseshocks,suchastheratioofexternaldebt-to-GDPandinflation,gainedimportanceduringandaftertherecentglobalfinancialcrisis.
The channels through which an increase in sovereign risk may affect the economy are diverse and depend largely on the characteristics of each economy, such as the importance of the public debt markets, the soundness of fiscalaccounts,and the levelof international reserves. InPeru,becausedollarizationprevails in thefinancialsystem, the channels with the greater potential impact on the economy are associated with a potential capital outfloworasuddenchangeindomesticinvestors’portfolio,whichcouldleadtoasharpdepreciationofthelocalcurrencyandcausepotentialnegativeeffectsonthefinancialpositionofcompaniesandfamilieswithcurrency mismatches.
EVOLuTION OF MACRO FuNDAMENTS AND CDS
181614121086420
2005 2006 2007 2008 2009 2010 2011 2012
330
280
230
180
130
80
%
B.P.S
.
181614121086420
2005 2006 2007 2008 2009 2010 2011 2012
250
200
150
100
50
0
%
B.P.S
.
12
10
8
6
4
2
02005 2006 2007 2008 2009 2010 2011 2012
340
290
240
190
140
90
%
B.P.S
.
1614121086420
2005 2006 2007 2008 2009 2010 2011 2012
350
300
250
200
150
100
50
0
%
B.P.S
.
35
30
25
20
15
10
5
02005 2006 2007 2008 2009 2010 2011 2012
350
300
250
200
150
100
50
0
%
B.P.S
.
35
30
25
20
15
10
5
02005 2006 2007 2008 2009 2010 2011 2012
3,500
3,000
2,500
2,000
1,500
1,000
500
0
%
B.P.S
.
Inf. NIR/GDP CDS
Source:Bloombergandcentralbanks.
Peru
Colombia
Brazil
Venezuela
Mexico
Chile
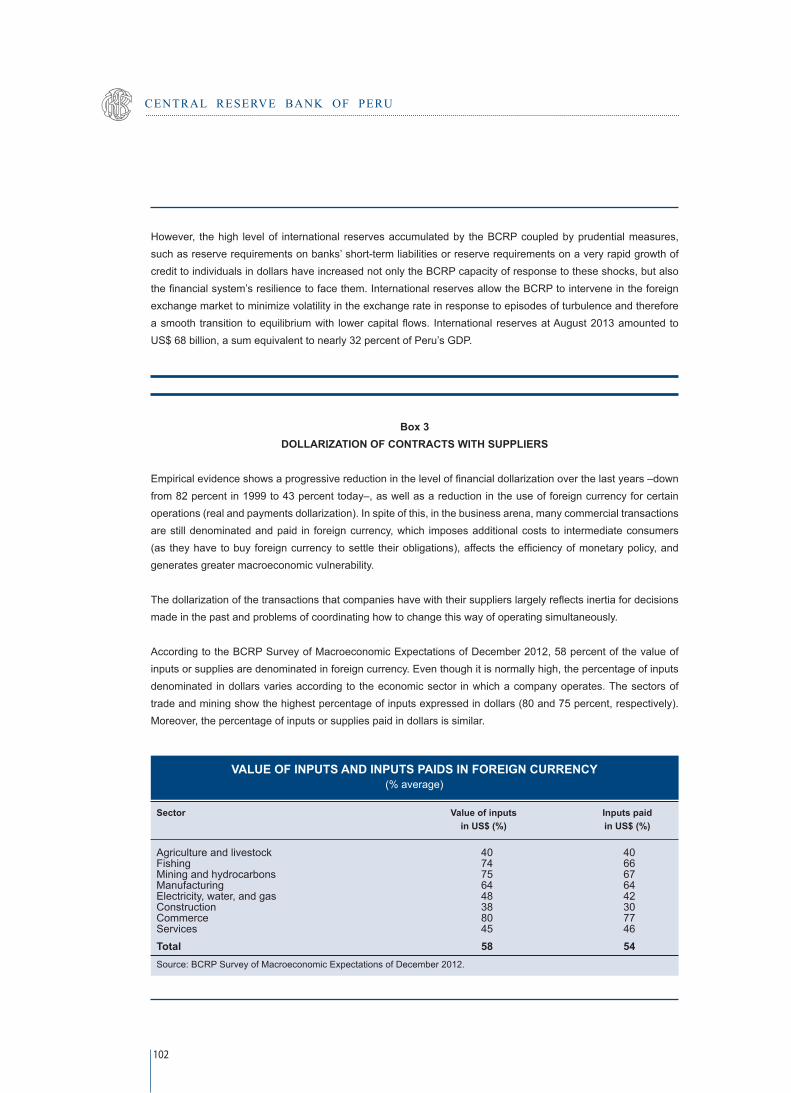
102
CENTRAL RESERVE BANK OF PERU
However, the high level of international reserves accumulated by the BCRP coupled by prudential measures, such as reserve requirements on banks’ short-term liabilities or reserve requirements on a very rapid growth of credit to individuals in dollars have increased not only the BCRP capacity of response to these shocks, but also thefinancialsystem’sresiliencetofacethem.InternationalreservesallowtheBCRPtointerveneintheforeignexchange market to minimize volatility in the exchange rate in response to episodes of turbulence and therefore asmooth transition toequilibriumwith lowercapitalflows. International reservesatAugust2013amounted to US$ 68 billion, a sum equivalent to nearly 32 percent of Peru’s GDP.
Box 3DOLLARIZATION OF CONTRACTS WITH SUPPLIERS
Empiricalevidenceshowsaprogressivereductionintheleveloffinancialdollarizationoverthelastyears–downfrom 82 percent in 1999 to 43 percent today–, as well as a reduction in the use of foreign currency for certain operations (real and payments dollarization). In spite of this, in the business arena, many commercial transactions are still denominated and paid in foreign currency, which imposes additional costs to intermediate consumers (astheyhavetobuyforeigncurrencytosettle theirobligations),affectstheefficiencyofmonetarypolicy,andgenerates greater macroeconomic vulnerability.
Thedollarizationofthetransactionsthatcompanieshavewiththeirsupplierslargelyreflectsinertiafordecisionsmade in the past and problems of coordinating how to change this way of operating simultaneously.
According to the BCRP Survey of Macroeconomic Expectations of December 2012, 58 percent of the value of inputs or supplies are denominated in foreign currency. Even though it is normally high, the percentage of inputs denominated in dollars varies according to the economic sector in which a company operates. The sectors of trade and mining show the highest percentage of inputs expressed in dollars (80 and 75 percent, respectively). Moreover, the percentage of inputs or supplies paid in dollars is similar.
VALUE OF INPUTS AND INPUTS PAIDS IN FOREIGN CURRENCY(% average)
Sector Value of inputs Inputs paid in US$ (%) in US$ (%)
Agriculture and livestock 40 40Fishing 74 66Mining and hydrocarbons 75 67Manufacturing 64 64Electricity, water, and gas 48 42Construction 38 30Commerce 80 77Services 45 46Total 58 54Source: BCRP Survey of Macroeconomic Expectations of December 2012.
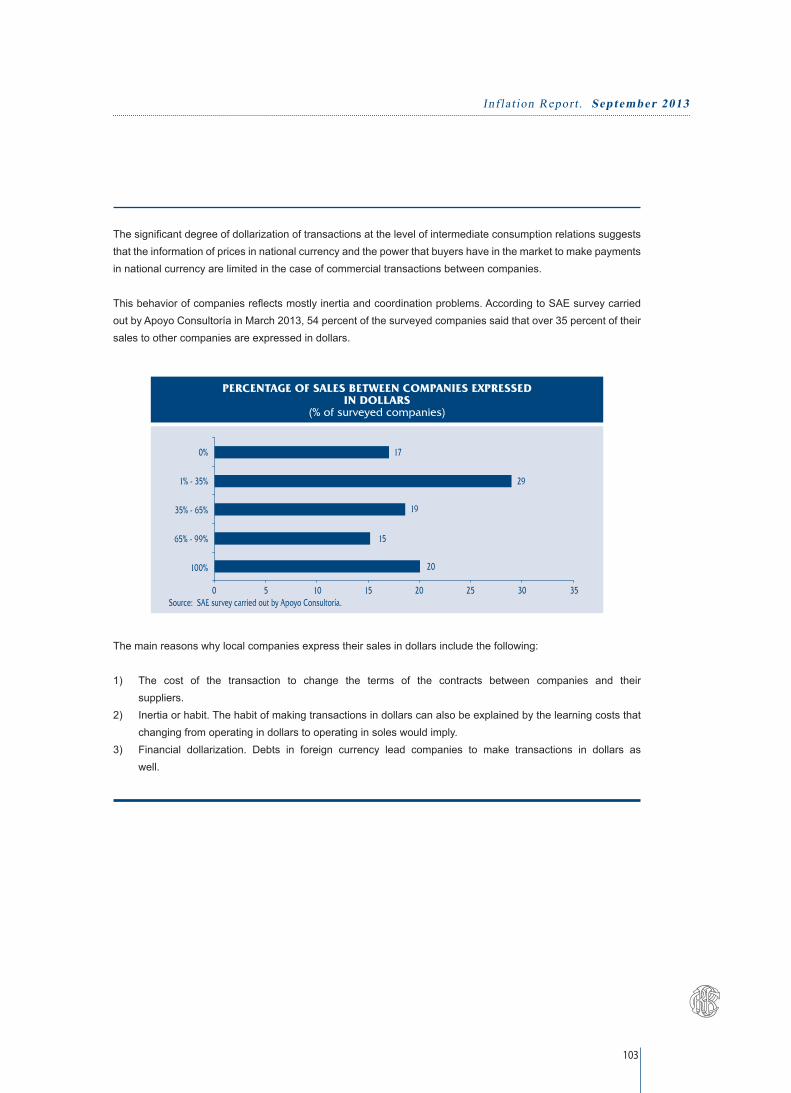
103
Inf la t ion Report . September 2013
Thesignificantdegreeofdollarizationoftransactionsatthelevelofintermediateconsumptionrelationssuggeststhat the information of prices in national currency and the power that buyers have in the market to make payments in national currency are limited in the case of commercial transactions between companies.
Thisbehaviorofcompaniesreflectsmostlyinertiaandcoordinationproblems.AccordingtoSAEsurveycarriedout by Apoyo Consultoría in March 2013, 54 percent of the surveyed companies said that over 35 percent of their sales to other companies are expressed in dollars.
PERCENTAGE OF SALES BETwEEN COMPANIES EXPRESSED
IN DOLLARS(%ofsurveyedcompanies)
The main reasons why local companies express their sales in dollars include the following:
1) The cost of the transaction to change the terms of the contracts between companies and their suppliers.
2) Inertia or habit. The habit of making transactions in dollars can also be explained by the learning costs that changing from operating in dollars to operating in soles would imply.
3) Financial dollarization. Debts in foreign currency lead companies to make transactions in dollars as well.
0%
1%-35%
35%-65%
65%-99%
100%
Source:SAEsurveycarriedoutbyApoyoConsultoría.0
17
29
19
15
20
5 10 15 20 25 30 35
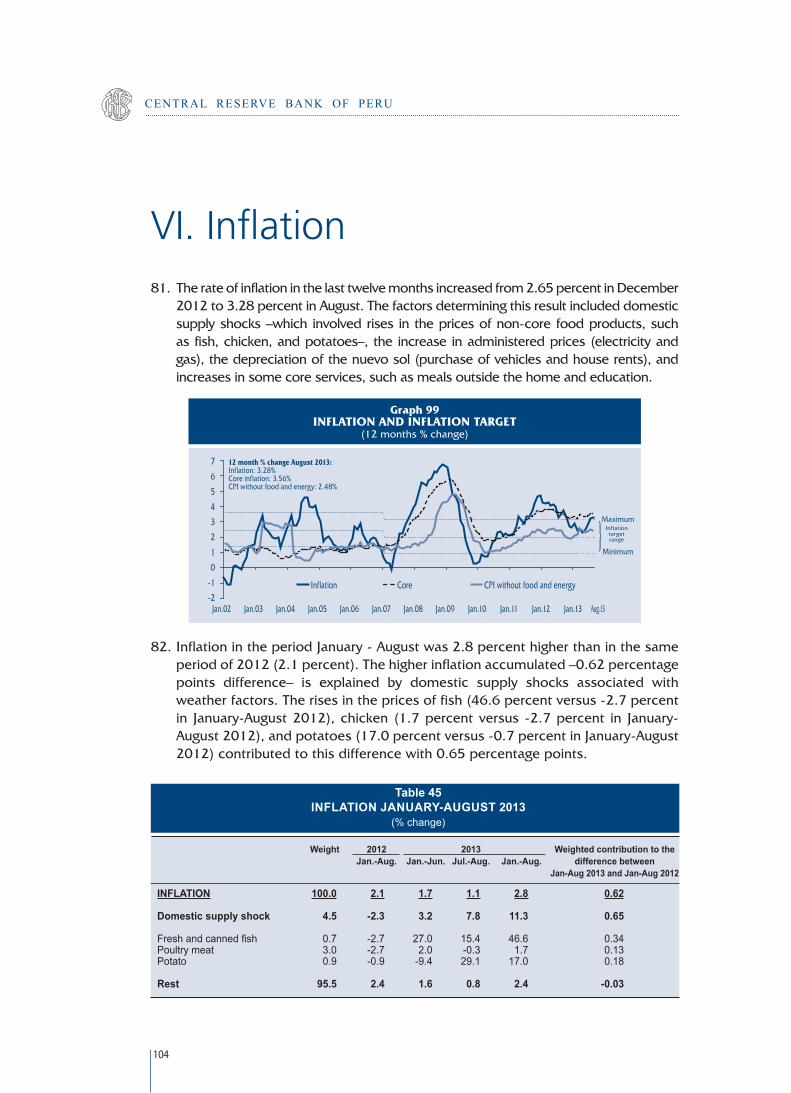
104
CENTRAL RESERVE BANK OF PERU
VI. Inflation81.Therateofinflationinthelasttwelvemonthsincreasedfrom2.65percentinDecember
2012to3.28percentinAugust.Thefactorsdeterminingthisresultincludeddomesticsupplyshocks–whichinvolvedrisesinthepricesofnon-corefoodproducts,suchasfish,chicken,andpotatoes–,theincreaseinadministeredprices(electricityandgas),thedepreciationofthenuevosol(purchaseofvehiclesandhouserents),andincreasesinsomecoreservices,suchasmealsoutsidethehomeandeducation.
Graph 99INFLATION AND INFLATION TARGET
(12months%change)
7
6
5
4
3
2
1
0
-1
-2Jan.02 Jan.10 Jan.11 Jan.12 Jan.13 Aug.13Jan.06Jan.05Jan.04Jan.03 Jan.07 Jan.08 Jan.09
Maximum
Minimum
Inflationtargetrange
12 month % change August 2013:Inflation:3.28%Coreinflation:3.56%CPIwithoutfoodandenergy:2.48%
Inflation CPIwithoutfoodandenergyCore
82.InflationintheperiodJanuary-Augustwas2.8percenthigherthaninthesameperiodof2012(2.1percent).Thehigherinflationaccumulated–0.62percentagepoints difference– is explained by domestic supply shocks associated withweatherfactors.Therisesinthepricesoffish(46.6percentversus-2.7percentin January-August2012),chicken (1.7percentversus -2.7percent in January-August2012),andpotatoes(17.0percentversus-0.7percentinJanuary-August2012)contributedtothisdifferencewith0.65percentagepoints.
Table 45INFLATION JANUARY-AUGUST 2013
(% change) Weight 2012 2013 Weighted contribution to the Jan.-Aug. Jan.-Jun. Jul.-Aug. Jan.-Aug. difference between Jan-Aug 2013 and Jan-Aug 2012
INFLATION 100.0 2.1 1.7 1.1 2.8 0.62 Domestic supply shock 4.5 -2.3 3.2 7.8 11.3 0.65 Freshandcannedfish 0.7 -2.7 27.0 15.4 46.6 0.34Poultry meat 3.0 -2.7 2.0 -0.3 1.7 0.13Potato 0.9 -0.9 -9.4 29.1 17.0 0.18 Rest 95.5 2.4 1.6 0.8 2.4 -0.03
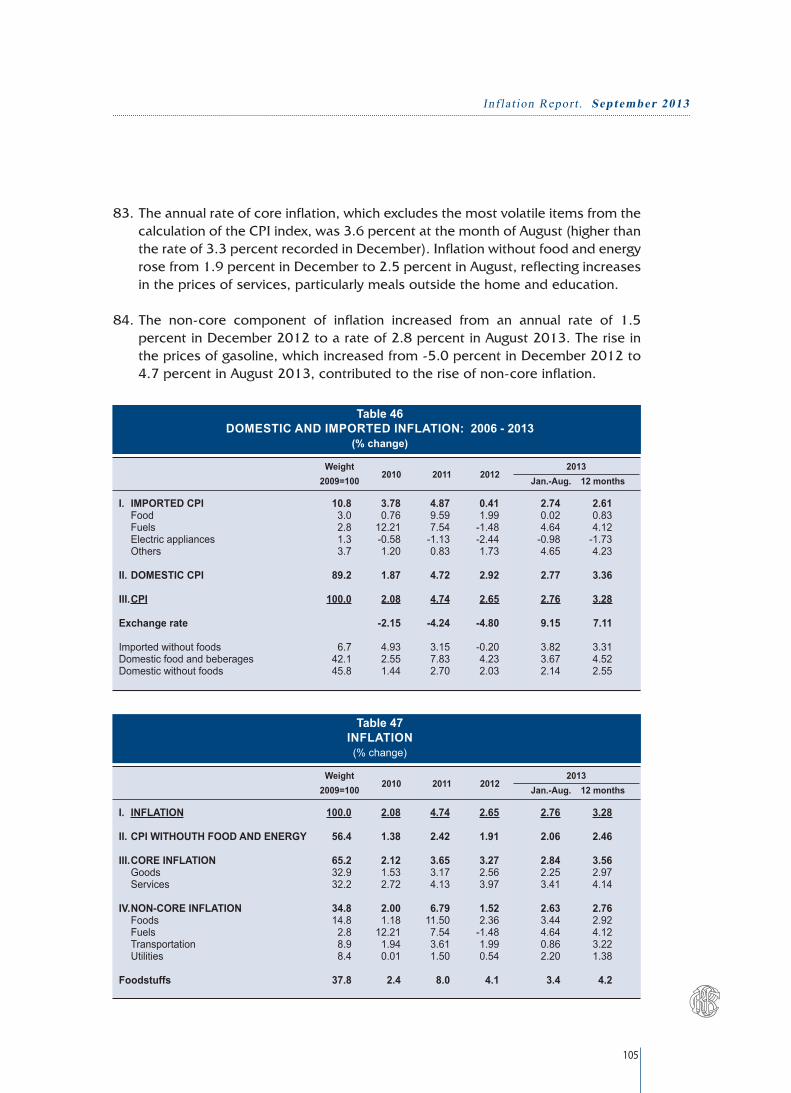
105
Inf la t ion Report . September 2013
83.Theannualrateofcoreinflation,whichexcludesthemostvolatileitemsfromthecalculationoftheCPIindex,was3.6percentatthemonthofAugust(higherthantherateof3.3percentrecordedinDecember).Inflationwithoutfoodandenergyrosefrom1.9percentinDecemberto2.5percentinAugust,reflectingincreasesinthepricesofservices,particularlymealsoutsidethehomeandeducation.
84.The non-core component of inflation increased from an annual rate of 1.5percentinDecember2012toarateof2.8percentinAugust2013.Theriseinthepricesofgasoline,whichincreasedfrom-5.0percentinDecember2012to4.7percentinAugust2013,contributedtotheriseofnon-coreinflation.
Table 47INFLATION
(% change) Weight 2013 2009=100 2010 2011 2012 Jan.-Aug. 12 months
I. INFLATION 100.0 2.08 4.74 2.65 2.76 3.28 II. CPI WITHOUTH FOOD AND ENERGY 56.4 1.38 2.42 1.91 2.06 2.46 III. CORE INFLATION 65.2 2.12 3.65 3.27 2.84 3.56 Goods 32.9 1.53 3.17 2.56 2.25 2.97 Services 32.2 2.72 4.13 3.97 3.41 4.14 IV. NON-CORE INFLATION 34.8 2.00 6.79 1.52 2.63 2.76 Foods 14.8 1.18 11.50 2.36 3.44 2.92 Fuels 2.8 12.21 7.54 -1.48 4.64 4.12 Transportation 8.9 1.94 3.61 1.99 0.86 3.22 Utilities 8.4 0.01 1.50 0.54 2.20 1.38
Foodstuffs 37.8 2.4 8.0 4.1 3.4 4.2
Table 46DOMESTIC AND IMPORTED INFLATION: 2006 - 2013
(% change) Weight 2013 2009=100 2010 2011 2012 Jan.-Aug. 12 months
I. IMPORTED CPI 10.8 3.78 4.87 0.41 2.74 2.61 Food 3.0 0.76 9.59 1.99 0.02 0.83 Fuels 2.8 12.21 7.54 -1.48 4.64 4.12 Electric appliances 1.3 -0.58 -1.13 -2.44 -0.98 -1.73 Others 3.7 1.20 0.83 1.73 4.65 4.23 II. DOMESTIC CPI 89.2 1.87 4.72 2.92 2.77 3.36 III. CPI 100.0 2.08 4.74 2.65 2.76 3.28 Exchange rate -2.15 -4.24 -4.80 9.15 7.11 Imported without foods 6.7 4.93 3.15 -0.20 3.82 3.31Domestic food and beberages 42.1 2.55 7.83 4.23 3.67 4.52Domestic without foods 45.8 1.44 2.70 2.03 2.14 2.55

106
CENTRAL RESERVE BANK OF PERU
Table 48INFLATION
(Weighted contribution) Weight 2013 2009=100 2010 2011 2012 Jan.-Aug. 12 months
I. CPI 100.0 2.08 4.74 2.65 2.76 3.28 II. CPI WITHOUTH FOOD AND ENERGY 56.4 0.78 1.36 1.05 1.12 1.34 III. CORE INFLATION 65.2 1.38 2.38 2.11 1.85 2.31 Goods 32.9 0.50 1.04 0.82 0.73 0.96 Services 32.2 0.88 1.34 1.29 1.12 1.35 IV. NON-CORE INFLATION 34.8 0.69 2.36 0.54 0.92 0.97 Foods 14.8 0.17 1.68 0.37 0.53 0.46 Fuels 2.8 0.34 0.23 -0.05 0.14 0.13 Transportation 8.9 0.17 0.32 0.18 0.08 0.28 Utilities 8.4 0.00 0.12 0.04 0.17 0.11
Foods 37.8 0.91 3.03 1.59 1.34 1.68
Graph 100DOMESTIC AND IMPORTED INFLATION
(Last12month%change)
11
6
1
-4
-9Jan.02 Jan.10 Jan.11 Jan.12Jan.06Jan.05Jan.04Jan.03 Jan.07 Jan.08 Jan.09
ImportedCPIDomesticCPI
Aug.13Jan.13
85.AtAugust,importedinflationrecordedagrowthrateof2.6percentinthelasttwelvemonths,ahigherratethanthatobservedinDecember2012(0.4percent).Price risesstandingout included the rise in thepricesof fuels,whoseannualvariationwent from-1.5percent inDecember2012to4.1percent inAugust2013,andtheriseinthepricesofvehicles,sincetheannualvariationofvehiclepurchases rose from0.7percent inDecember to6.4percent inAugust. Thiswasassociatedwithchangesintheexchangerate,whichatAugustrecordedanannualvariationof7.1percent.
86.Theanalysisof thecorrelationsbetweenthedepreciationof thenuevosolandinflationbetweenSeptember2011andAugust2013showsthatthesaleofvehiclesandhouserentsaretheitemsthatshowthehighestcorrelation,withlevelsofover60 percent. Between June andAugust, period duringwhich the exchange rateincreased5.9percent,thepricesofvehiclesrose5.3percentandrentsrose1.7percent.Together,thesetwoitemscontributedwith0.11percentagepointstotherateofinflationof1.36percentregisteredinthelastthreemonths.
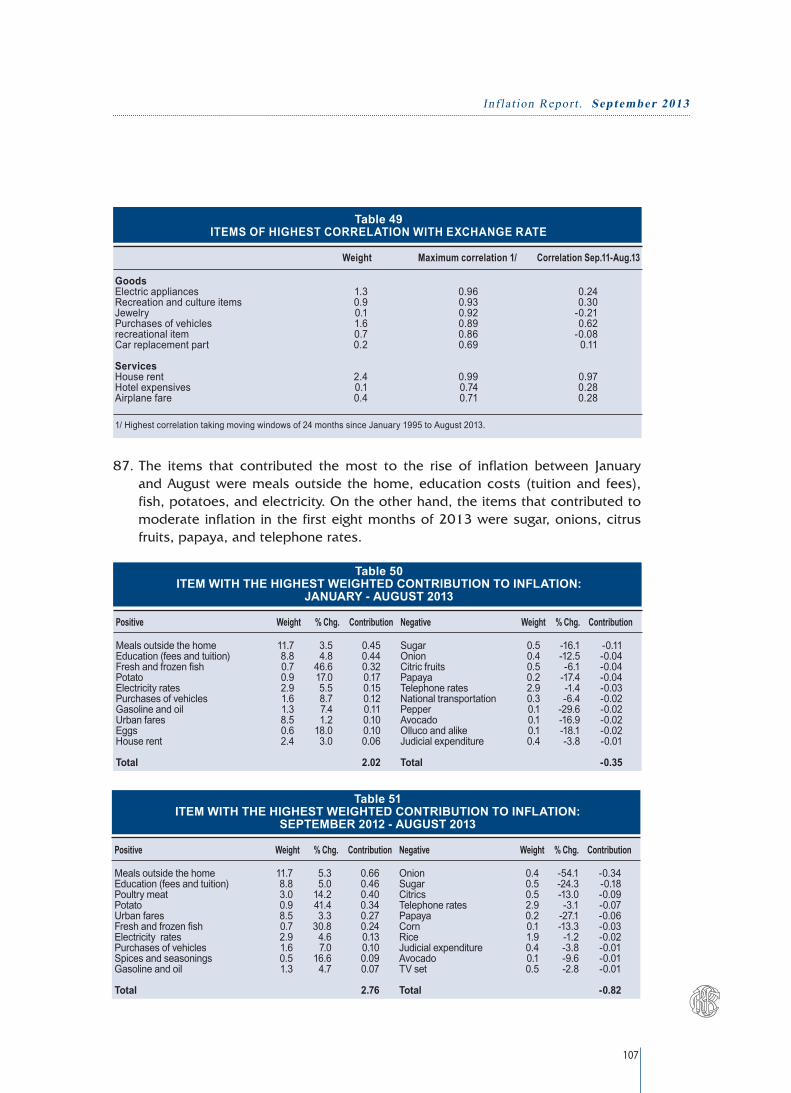
107
Inf la t ion Report . September 2013
Table 49ITEMS OF HIGHEST CORRELATION WITH EXCHANGE RATE
Weight Maximum correlation 1/ Correlation Sep.11-Aug.13 Goods Electric appliances 1.3 0.96 0.24 Recreation and culture items 0.9 0.93 0.30 Jewelry 0.1 0.92 -0.21 Purchases of vehicles 1.6 0.89 0.62 recreational item 0.7 0.86 -0.08 Car replacement part 0.2 0.69 0.11
Services House rent 2.4 0.99 0.97Hotel expensives 0.1 0.74 0.28Airplane fare 0.4 0.71 0.28
1/ Highest correlation taking moving windows of 24 months since January 1995 to August 2013.
Table 50ITEM WITH THE HIGHEST WEIGHTED CONTRIBUTION TO INFLATION:
JANUARY - AUGUST 2013 Positive Weight % Chg. Contribution Negative Weight % Chg. Contribution Meals outside the home 11.7 3.5 0.45 Sugar 0.5 -16.1 -0.11Education (fees and tuition) 8.8 4.8 0.44 Onion 0.4 -12.5 -0.04Freshandfrozenfish 0.7 46.6 0.32 Citricfruits 0.5 -6.1 -0.04Potato 0.9 17.0 0.17 Papaya 0.2 -17.4 -0.04Electricity rates 2.9 5.5 0.15 Telephone rates 2.9 -1.4 -0.03Purchases of vehicles 1.6 8.7 0.12 National transportation 0.3 -6.4 -0.02Gasoline and oil 1.3 7.4 0.11 Pepper 0.1 -29.6 -0.02Urban fares 8.5 1.2 0.10 Avocado 0.1 -16.9 -0.02Eggs 0.6 18.0 0.10 Olluco and alike 0.1 -18.1 -0.02House rent 2.4 3.0 0.06 Judicial expenditure 0.4 -3.8 -0.01 Total 2.02 Total -0.35
Table 51ITEM WITH THE HIGHEST WEIGHTED CONTRIBUTION TO INFLATION:
SEPTEMBER 2012 - AUGUST 2013 Positive Weight % Chg. Contribution Negative Weight % Chg. Contribution Meals outside the home 11.7 5.3 0.66 Onion 0.4 -54.1 -0.34Education (fees and tuition) 8.8 5.0 0.46 Sugar 0.5 -24.3 -0.18Poultry meat 3.0 14.2 0.40 Citrics 0.5 -13.0 -0.09Potato 0.9 41.4 0.34 Telephone rates 2.9 -3.1 -0.07Urban fares 8.5 3.3 0.27 Papaya 0.2 -27.1 -0.06Freshandfrozenfish 0.7 30.8 0.24 Corn 0.1 -13.3 -0.03Electricity rates 2.9 4.6 0.13 Rice 1.9 -1.2 -0.02Purchases of vehicles 1.6 7.0 0.10 Judicial expenditure 0.4 -3.8 -0.01Spices and seasonings 0.5 16.6 0.09 Avocado 0.1 -9.6 -0.01Gasoline and oil 1.3 4.7 0.07 TV set 0.5 -2.8 -0.01 Total 2.76 Total -0.82
87.The items that contributed themost to the rise of inflation between JanuaryandAugustweremealsoutside thehome,educationcosts (tuitionandfees),fish,potatoes,andelectricity.Ontheotherhand,theitemsthatcontributedtomoderateinflationinthefirsteightmonthsof2013weresugar,onions,citrusfruits,papaya,andtelephonerates.

108
CENTRAL RESERVE BANK OF PERU
Inflation components at August 2013
88.IntheperiodJanuary-August,meals outside the homeaccumulatedavariationof3.5percent,whichwasassociatedwiththeriseinthepriceoffood(3.3percentinthecaseoffoodandbeveragesconsumedathome).Thevariationinthelasttwelvemonthswas5.3percent,higher than the totalvariationof foodandbeveragesconsumedinthehousehold(3.8percent)andhigherthanthegeneralpriceindex(3.3percent),whichwouldbereflectingthedynamismofdomesticdemand.
Education costs (tuition and fees) recorded a growth rate of 4.8 percent in
the period of January-August. The greatest variation was observed in March(4percent) due to thebeginningof the school year. Increases in the cost ofeducationinprivateschoolsanduniversitieswereobservedintheothermonths.
Theprice of fresh and frozen fish increased46.6percentduetothepresenceofanomalouswavesandbelow-normalseatemperatures,whichconfirmedtheoccurrenceofanepisodeofLaNiñaatthebeginningofAugustandresultedina lower availability of fish species. Price risesworth highlighting included therise in the price of bonito (87.9 percent) and perico (86.9 percent). On theotherhand,thepriceofmackerelrose25.7percentbecauseclimatealterationshindered fishing and prevented the industrial fleet from reaching the fishingquotaestablishedforthisspecies.
Thepriceofpotatoesincreased17.0percentinJanuary-August,reflectingrisesinthemonthsofJulyandAugust(18.7and8.8percent,respectively)asaresultof the culmination of the large crop season in the central highlands and thelowerproductionobtainedinsomeregions(Huancavelica,Pasco,andAyacucho)whichwereaffectedbyheavyrainsatthebeginningoftheyear.Theproductionofwhitepotatoeswasalsoaffectedbythedelayofcultivationinthecoastregionduemainly to climate anomalies. The greatest price rise (19.0 percent) wasobserved inAugust in thevarietyof yellowpotatoes thatcomesmostly fromHuánucoduetoloweryieldsassociatedwithadverseweatherconditions,aswellasduetothehighercostoflaborandthestrongdemandforthiscrop.
Electricity rates rose5.5percent.ThehighestincreaseswereobservedinthemonthsofFebruary(2.3percent),June(2.1percent),andAugust(2.6percent),asaresultofpriceadjustmentsdecreedbyOsinergmintoupdatethecostsofthemaincomponentsofthisrate(generation,transmission,anddistribution).Theimplementationofnewtransmissionlinesalsoinfluencedtheserateincreases.
The item purchases of vehicles increased 8.7 percent. This increase wasassociatedwiththedepreciationoftheexchangerate(9.2percent inthefirsteightmonthsoftheyear).
Thepricesoffuels and lubricants increased7.4percent,reflectingthehigherinternationalpriceofWTIoilwhichrosefromUS$88.2inDecember2012toUS$106.6inAugust(20.8percent).

109
Inf la t ion Report . September 2013
Thepriceofsugar dropped16.1percentasaresultofahigherlevelofsupplyandthelowerinternationalpricesofsugar–thepriceofcontract5sugardeclinedfromUS$574 inAugust2012toUS$516perton inDecember2012andtoUS$490pertoninAugust2013).IntheperiodofJanuary-May,theproductionofsugarcanewasfavoredbyappropriateclimateconditionsandincreased12.1percentfromJanuarytoJulycomparedwiththesameperiodof2012.
Thepriceofonions decreased12.5percent.PriceriseswereobservedinthemonthsofApril andMay (4.7and7.9percent, respectively)due toseasonalfactorsandtoclimatealterationsthataffectedproductioninArequipa,Lima’smainsupplierofonions.Thepricefell inJune(-8.6percent)duetothelowerqualityofthecropsandtheninJuly(-2.4percent)andAugust(-5.1percent),afterwhichthesupplycomingfromArequipastartedrecoveringduetobetteryieldsobtainedasaresultofseasonalfactorsandtheabsenceofpests.
Fuel and food prices
a. Fuels
89.Duringthepastthreemonths,themonthlyaveragepriceofWTIoilcontinuedtogrowandaccumulatedanincreaseof20.7percent,reachinganaveragepriceofUS$106.5perbarrelinAugust.
TheincreaseinthepriceofoilwasassociatedwiththedeepeningofgeopoliticalrisksintheMiddleEastandNorthAfrica,inacontextoflimitedavailablecapacitytofaceproductioncutsbytheOPECcountries.TheimpactofproductioncutsinIraq,Libya,andNigeria,aswellasfearsthattheSyrianconflictmightspreadandinvolveothercountriesintheregion,andconcernsthatthesituationinEgyptcould leadtoclosingtheSuezCanalhasgeneratedan increase inspeculativedemand.Netnon-commercialpositionsofoilreportedbytheCommodityFutureTradingCommissionincreased77percentinthefirsteightmonthsoftheyearand34percentinthelastthreemonths.
Graph 101OIL: NON-COMMERCIAL CONTRACTS
Feb.12 May.12 Aug.12 Nov.12 Feb.13 May.13 Aug.13
400
350
300
250
200
150
100
50
0
115110105100959085807570
N° o
f co
ntra
cts
(tho
usan
ds)
uS$/
barr
el
NetpurchaseContracts Spotprices
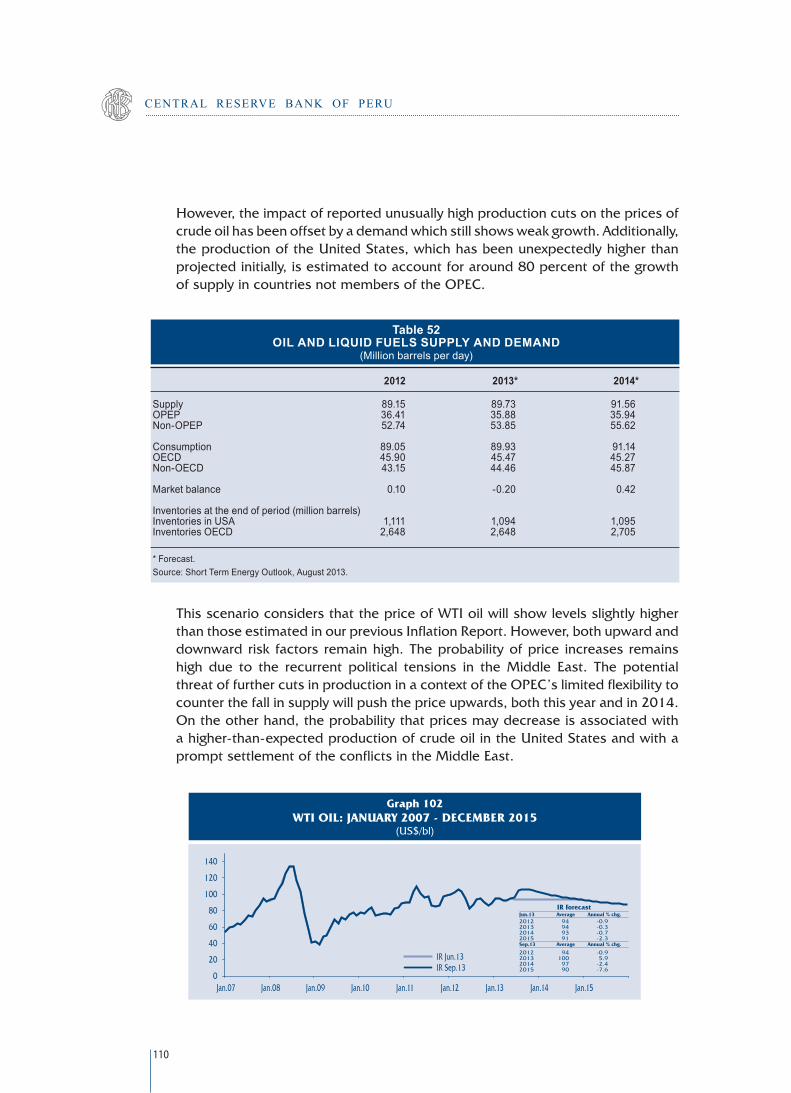
110
CENTRAL RESERVE BANK OF PERU
However,theimpactofreportedunusuallyhighproductioncutsonthepricesofcrudeoilhasbeenoffsetbyademandwhichstillshowsweakgrowth.Additionally,theproductionoftheUnitedStates,whichhasbeenunexpectedlyhigherthanprojectedinitially,isestimatedtoaccountforaround80percentofthegrowthofsupplyincountriesnotmembersoftheOPEC.
IR Forecastjun.13 Average Annual % chg.2012 94 -0.92013 94 -0.32014 93 -0.72015 91 -2.3Sep.13 Average Annual % chg.
2012 94 -0.92013 100 5.92014 97 -2.42015 90 -7.6
Graph 102wTI OIL: jANuARy 2007 - DECEMBER 2015
(US$/bl)
IRSep.13IRJun.13
140
120
100
80
60
40
20
0Jan.07 Jan.08 Jan.09 Jan.10 Jan.11 Jan.12 Jan.13 Jan.14 Jan.15
Table 52OIL AND LIQUID FUELS SUPPLY AND DEMAND
(Million barrels per day)
2012 2013* 2014* Supply 89.15 89.73 91.56OPEP 36.41 35.88 35.94Non-OPEP 52.74 53.85 55.62 Consumption 89.05 89.93 91.14OECD 45.90 45.47 45.27Non-OECD 43.15 44.46 45.87 Market balance 0.10 -0.20 0.42 Inventories at the end of period (million barrels)Inventories in USA 1,111 1,094 1,095Inventories OECD 2,648 2,648 2,705
* Forecast.Source: Short Term Energy Outlook, August 2013.
ThisscenarioconsidersthatthepriceofWTIoilwillshowlevelsslightlyhigherthanthoseestimatedinourpreviousInflationReport.However,bothupwardanddownwardrisk factors remainhigh.Theprobabilityofprice increases remainshigh due to the recurrent political tensions in theMiddle East. The potentialthreatoffurthercutsinproductioninacontextoftheOPEC’slimitedflexibilitytocounterthefallinsupplywillpushthepriceupwards,boththisyearandin2014.Ontheotherhand,theprobabilitythatpricesmaydecreaseisassociatedwithahigher-than-expectedproductionofcrudeoilintheUnitedStatesandwithapromptsettlementoftheconflictsintheMiddleEast.
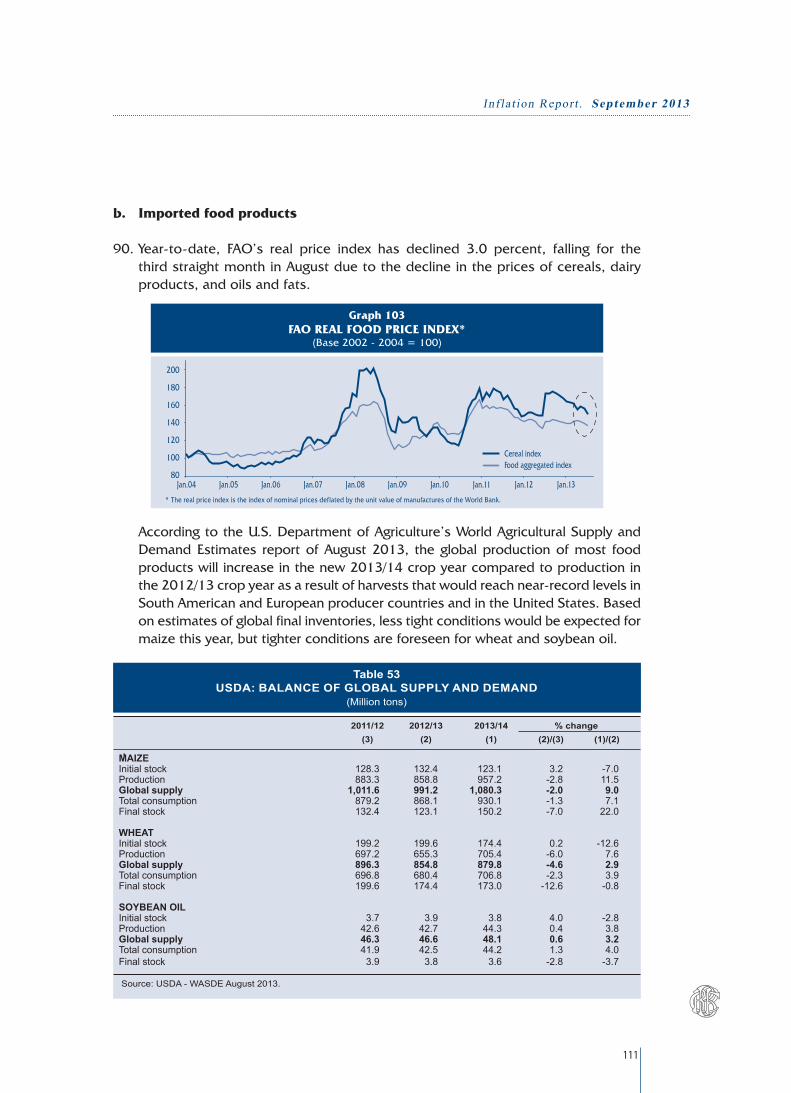
111
Inf la t ion Report . September 2013
b. Imported food products
90.Year-to-date, FAO’s real price index has declined 3.0 percent, falling for thethirdstraightmonthinAugustduetothedeclineinthepricesofcereals,dairyproducts,andoilsandfats.
Graph 103FAO REAL FOOD PRICE INDEX*
(Base2002-2004=100)
200
180
160
140
120
100
80Jan.04 Jan.05 Jan.06 Jan.07 Jan.08 Jan.09 Jan.10 Jan.11 Jan.12 Jan.13
*TherealpriceindexistheindexofnominalpricesdeflatedbytheunitvalueofmanufacturesoftheWorldBank.
CerealindexFoodaggregatedindex
AccordingtotheU.S.DepartmentofAgriculture’sWorldAgriculturalSupplyandDemandEstimates reportofAugust2013, theglobalproductionofmost foodproductswillincreaseinthenew2013/14cropyearcomparedtoproductioninthe2012/13cropyearasaresultofharveststhatwouldreachnear-recordlevelsinSouthAmericanandEuropeanproducercountriesandintheUnitedStates.Basedonestimatesofglobalfinalinventories,lesstightconditionswouldbeexpectedformaizethisyear,buttighterconditionsareforeseenforwheatandsoybeanoil.
Table 53
USDA: BALANCE OF GLOBAL SUPPLY AND DEMAND(Million tons)
2011/12 2012/13 2013/14 % change (3) (2) (1) (2)/(3) (1)/(2),MAIZE
Initial stock 128.3 132.4 123.1 3.2 -7.0Production 883.3 858.8 957.2 -2.8 11.5Global supply 1,011.6 991.2 1,080.3 -2.0 9.0Total consumption 879.2 868.1 930.1 -1.3 7.1Final stock 132.4 123.1 150.2 -7.0 22.0
WHEAT Initial stock 199.2 199.6 174.4 0.2 -12.6Production 697.2 655.3 705.4 -6.0 7.6Global supply 896.3 854.8 879.8 -4.6 2.9Total consumption 696.8 680.4 706.8 -2.3 3.9Final stock 199.6 174.4 173.0 -12.6 -0.8
SOYBEAN OIL Initial stock 3.7 3.9 3.8 4.0 -2.8Production 42.6 42.7 44.3 0.4 3.8Global supply 46.3 46.6 48.1 0.6 3.2Total consumption 41.9 42.5 44.2 1.3 4.0Final stock 3.9 3.8 3.6 -2.8 -3.7
Source: USDA - WASDE August 2013.
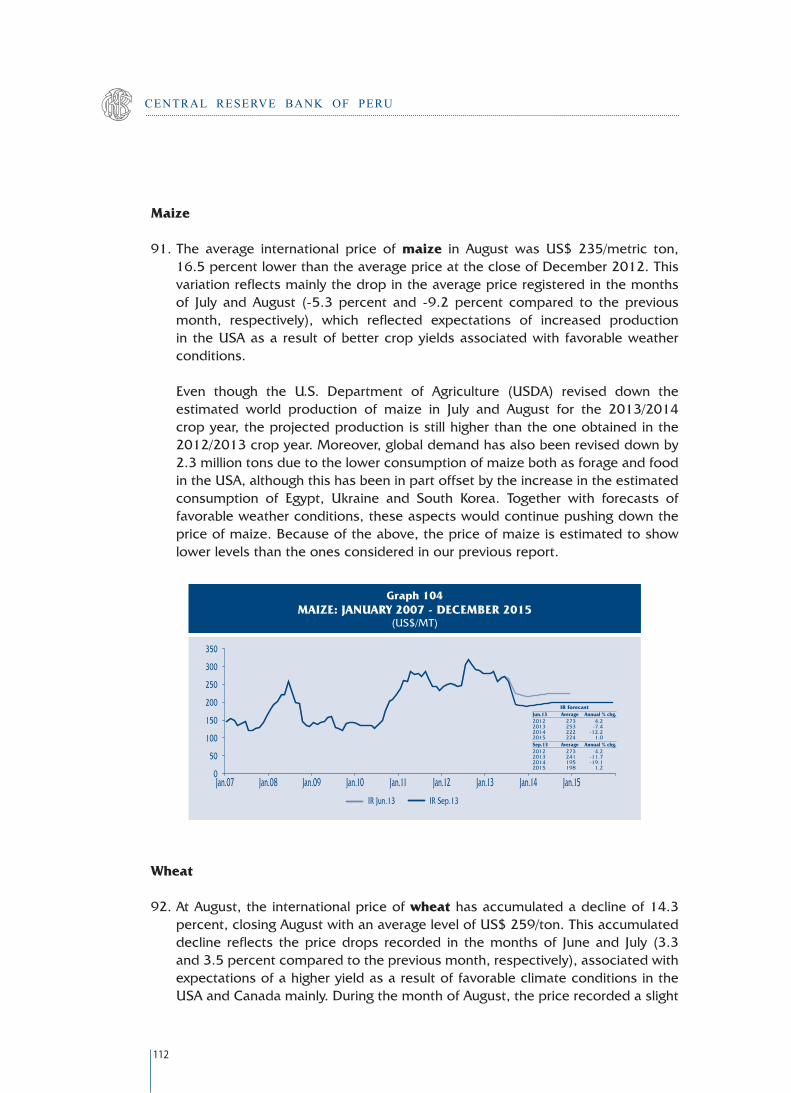
112
CENTRAL RESERVE BANK OF PERU
Maize
91.The average international price ofmaize in AugustwasUS$ 235/metric ton,16.5percentlowerthantheaveragepriceatthecloseofDecember2012.Thisvariationreflectsmainlythedropintheaveragepriceregisteredinthemonthsof July andAugust (-5.3percent and -9.2percent compared to thepreviousmonth, respectively), which reflected expectations of increased productionintheUSAasaresultofbettercropyieldsassociatedwith favorableweatherconditions.
Even though the U.S. Department of Agriculture (USDA) revised down theestimated world production of maize in July and August for the 2013/2014cropyear,theprojectedproductionisstillhigherthantheoneobtainedinthe2012/2013cropyear.Moreover,globaldemandhasalsobeenreviseddownby2.3milliontonsduetothelowerconsumptionofmaizebothasforageandfoodintheUSA,althoughthishasbeeninpartoffsetbytheincreaseintheestimatedconsumption of Egypt, Ukraine and South Korea. Together with forecasts offavorableweatherconditions,theseaspectswouldcontinuepushingdownthepriceofmaize.Becauseoftheabove,thepriceofmaizeisestimatedtoshowlowerlevelsthantheonesconsideredinourpreviousreport.
IR Forecastjun.13 Average Annual % chg.2012 273 4.22013 253 -7.42014 222 -12.22015 224 1.0Sep.13 Average Annual % chg.2012 273 4.22013 241 -11.72014 195 -19.12015 198 1.2
350
300
250
200
150
100
50
0
IRJun.13 IRSep.13
Jan.07 Jan.08 Jan.09 Jan.10 Jan.11 Jan.12 Jan.13 Jan.14 Jan.15
Graph 104MAIzE: jANuARy 2007 - DECEMBER 2015
(US$/MT)
wheat
92.AtAugust,theinternationalpriceofwheathasaccumulatedadeclineof14.3percent,closingAugustwithanaveragelevelofUS$259/ton.Thisaccumulateddecline reflects thepricedrops recorded in themonthsof Juneand July (3.3and3.5percentcomparedtothepreviousmonth,respectively),associatedwithexpectationsofahigheryieldasaresultoffavorableclimateconditionsintheUSAandCanadamainly.DuringthemonthofAugust,thepricerecordedaslight

113
Inf la t ion Report . September 2013
average increase relative to the previousmonth, associatedwith the hot dryweatherregisteredinthesecondhalfofthemonth,whichgeneratedconcernsthatthiscouldaffectthecerealyield.
TheUSDArevisedupwardstheestimatedworldproductionofwheatinJulyandAugust.TheincreaseinwheatproductionwouldbedrivenbygreaterharvestsintheEuropeanUnion(Spain,France,andGermany),Kazakhstan–whereabundantraininsummerandspringhavefavoredgreateryieldofthiscereal–,andUkraine,giventhehighproductionobtainedinthelastharvest.
TheUSDAhasalsorevisedupwardstheestimatedworldproductionofwheat
intheprevioustwomonths.Thisincreaseisduetothehigheruseofwheatasfoodandasfodder,especiallyintheEurozoneandChina.Consideringtherecordharvest levelsobtainedinCanadaandtheUSAandconsideringthatfavorableclimateconditionswillcontinue,thepriceofwheatisexpectedtoregisterlowerlevelsthantheonesforeseeninourpreviousreport.
IR Forecastjun.13 Average Annual % chg.2012 276 -1.52013 275 -0.42014 275 -0.12015 275 0.0Sep.13 Average Annual % chg.2012 276 -1.52013 265 -4.22014 245 -7.62015 246 0.6
450400350300250200150100500
IRJun.13 IRSep.13
Jan.07 Jan.08 Jan.09 Jan.10 Jan.11 Jan.12 Jan.13 Jan.14 Jan.15
Graph 105whEAT: jANuARy 2007 - DECEMBER 2015
(US$/MT)
Soybean oil
93.The average price of soybean oil was US$ 933/ton in August, 10.1 percentlowerthantheaveragepriceatend-2012.Thispricedeclinedinthepastthreemonths at a rising pace: 3.0 percent, 5.5 percent, and 6.3 percent in June,July,andAugust,respectively.ThissteadydeclineinthepriceofsoybeanoilisduetothefavorableclimateconditionsforthesecropsintheUSA,aswellasto reportsof theUSDA indicatingbetterexpectedyields than in thepreviousyear.

114
CENTRAL RESERVE BANK OF PERU
c. Perishable food products
94.Perishable farming food productswouldaccumulatethisyearan increaseof1percent(versus5percentin2012).Thisismainlyexplainedbythereversalofshocksinproductssuchasonions,whichcontributedtoaslowerpaceofgrowthinthepricesoftheseproductsinthefirst8monthsoftheyearcomparedtolastyear(3.2percentversus9.6percent,respectively).Intherestoftheyear,thepriceofpotatoesisexpectedtodeclineduetotheincreasedsupplyforeseenfromareassuchasHuánuco,Ica,andtheprovincesofLima,whosecropshaveshownsomedelay.
Fish is another food products whose price is expected to fall as the supplynormalizesonceseatemperaturesreturntotheirnormalranges.AnimprovementinbonitofishingisalreadybeingobservedintheNorthCoastareas.Inaddition,the industrial fishing of mackerel would be authorized in these days aswell.
Expectations of inflation
95.Economicagents’expectedlevelsofinflationforthisyearcontinuetobewithinthetargetrange,aslightriseintheforecastsbeingobserved.
IR Forecastjun.13 Average Annual % chg.2012 1,125 -5.62013 1,082 -3.82014 1,068 -1.32015 1,068 0.0Sep.13 Average Annual % chg.2012 1,125 -5.62013 1,015 -9.72014 967 -4.72015 972 0.4
1,600
1,400
1,200
1,000
800
600
400
200
0
IRJun.13 IRSep.13
Jan.07 Jan.08 Jan.09 Jan.10 Jan.11 Jan.12 Jan.13 Jan.14 Jan.15
Graph 106SOyBEAN: jANuARy 2007 - DECEMBER 2015
(US$/MT)
A higher production than in 2012 is also expected in Canada, Brazil, andArgentinaandcultivatedareaswithsoybeanintheUSAhavealsobeenestimatedtobehigher.Consideringthesefactors,itisestimatedthatthepriceofsoybeanoil will register lower levels than those considered in the previous InflationReport.

115
Inf la t ion Report . September 2013
According to the BCRP survey on macroeconomic expectations, inflationexpectationsfornextyearhavealsobeenstableinrecentmonthsandremainwithinthetargetrange.
Table 54SURVEY ON MACROECONOMIC EXPECTATION: INFLATION END OF PERIOD
(%) Expectations about:
IR Mar.13 IR Jun.13 IR Sep.13*
Financial entities 2013 2.7 2.5 2.8 2014 2.5 2.5 2.5 2015 -.- 2.5 2.5 Economic analysts 2013 2.5 2.5 2.7 2014 2.4 2.4 2.5 2015 -.- 2.3 2.4 Non-financial firms 2013 3.0 2.7 3.0 2014 3.0 2.8 3.0 2015 -.- 2.8 3.0 Source: Survey conducted during the second fortnight of August 2013.IR:InflationReport.
Graph 107INFLATION EXPECTATIONS FOR ThE NEXT yEAR: 2012-2013*
(%)
5.04.54.03.53.02.52.01.51.00.50.0Mar.02 Oct.03 Jun.05 Feb.07 Sep.08 May.10 Jan.13 Jul.13
*Correspondstotheaverageoftheexpectationsofthefinancialsystemandeconomicanalysts.
Maximum
Minimum
Inflationtargetrange
Forecast
96.InAugust,inflationinthelast12monthsrecordedarateof3.28percent,slightlyabovetheupperbandofthetargetrange.Thecentralforecastscenarioconsidersthat inflationhasbeen recently affectedby transitory factors and is thereforeexpected to return to the target range in the last quarter of the year and toconvergetowardsthemiddlepointof2.0percentin2014.Nomajorinflationarypressuresassociatedwithincreasesinthepricesoffoodcommoditiesorwith

116
CENTRAL RESERVE BANK OF PERU
Table 55INFLATION 2009-2013(Last 12 month % change)
2013* Weight 2009 2010 2011 2012 August IR Jun.13 IR Sep.13
CPI 100.0 0.2 2.1 4.7 2.6 3.3 2.3 2.9 Food and energy 43.6 -0.9 3.0 7.7 3.6 4.3 2.6 3.3 a. Food 37.8 0.6 2.4 8.0 4.1 4.2 2.4 2.8 b. Energy 5.7 -10.4 6.8 6.0 0.2 4.4 4.3 6.8
CPI withouth food and energy 56.4 1.7 1.4 2.4 1.9 2.5 2.1 2.6
IR:InflationReport.* Forecast.
Non-core inflationisestimatedtobelowerthan2percentin2013asaresultofbetterclimateconditionsandafavorableevolutionintheinternationalpricesoffoodproducts.Thisratewouldreverttothemiddlepointofthetargetrangeasfrom2014.
The main factors affecting the path of core inflation are the output gap,importedinflation,andexpectationsofinflation.Thecentralscenarioconsidersthattheoutputwouldgrowatsimilarlevelstothoseofthepotentialoutputinthe2013-2015forecasthorizon,whichwouldbeconfirminganeutraleconomiccycle.Therefore,nomajordemand inflationarypressuresareexpected in thisperiod.Moreover,thecomponentofimportedinflationisexpectedtonormalizein the central forecast horizon and have a positive effect on core inflation.Finally, inflation expectations are expected to remain anchored within thetarget range and gradually converge to themiddle point of the target range,ashasbeenreflectedinthesurveyonmacroeconomicexpectationssofarthisyear.
The central forecast scenario for 2013 considers that the Peruvian economywouldgrow5.5percent,registeringalowergrowthratethantheoneforecastinourReportofJune(6.1percent).Thisdownwardrevisionisexplainedbytheslowdownofprivateeconomicactivityobservedduringthefirstsemesteroftheyear,togetherwithadeteriorationoftermsoftradeandbusinessconfidence,partiallyoffsetbyamoredynamicgovernmentspending.Thecentral forecastscenarioconsidersthatthesefactorsaretransitoryandthereforeGDPin2014is
domesticdemandareforeseeninthisscenario,andmonetarypolicyactionsareexpected tomaintain inflationexpectations anchoredwithin the target range.Therateofinflationintheperiodof2013to2015isforecasttobewithintherangeof1.5–2.5percent.
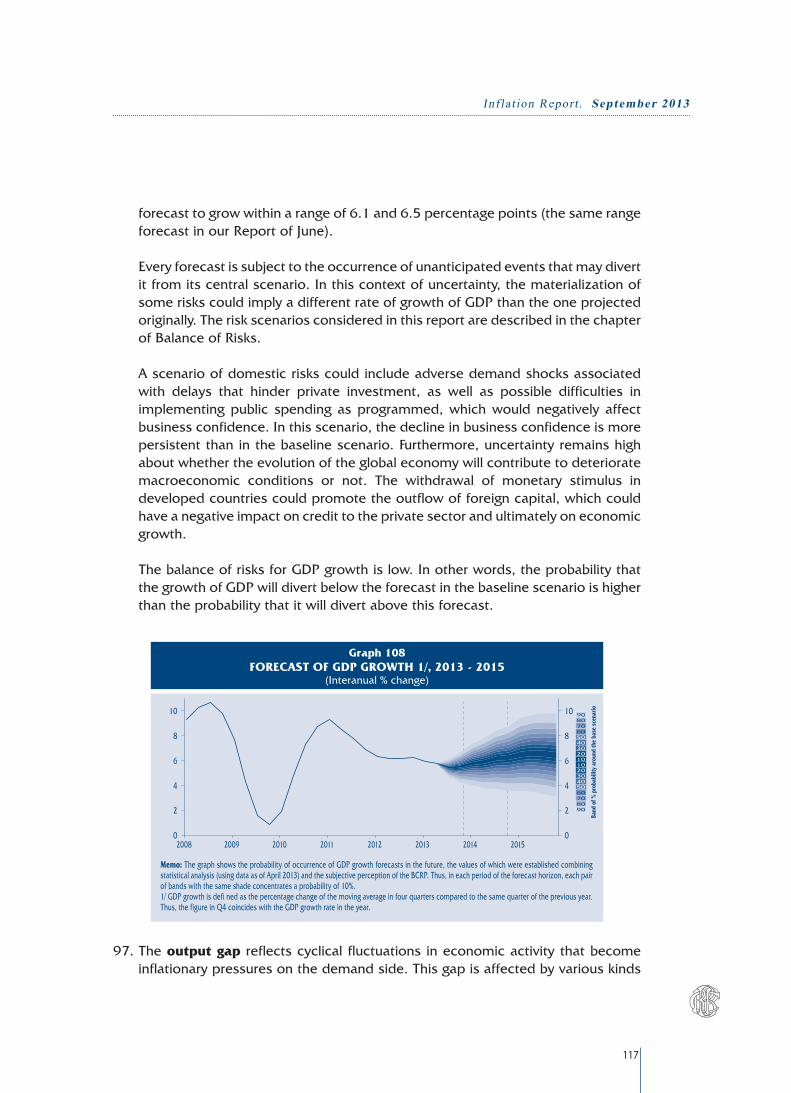
117
Inf la t ion Report . September 2013
forecasttogrowwithinarangeof6.1and6.5percentagepoints(thesamerangeforecastinourReportofJune).
Everyforecastissubjecttotheoccurrenceofunanticipatedeventsthatmaydivertitfromitscentralscenario.Inthiscontextofuncertainty,thematerializationofsomeriskscouldimplyadifferentrateofgrowthofGDPthantheoneprojectedoriginally.TheriskscenariosconsideredinthisreportaredescribedinthechapterofBalanceofRisks.
Ascenarioofdomesticriskscouldincludeadversedemandshocksassociatedwith delays that hinder private investment, as well as possible difficulties inimplementingpublic spendingasprogrammed,whichwouldnegatively affectbusinessconfidence.Inthisscenario,thedeclineinbusinessconfidenceismorepersistentthaninthebaselinescenario.Furthermore,uncertaintyremainshighaboutwhethertheevolutionoftheglobaleconomywillcontributetodeterioratemacroeconomic conditions or not. The withdrawal of monetary stimulus indevelopedcountriescouldpromotetheoutflowofforeigncapital,whichcouldhaveanegativeimpactoncredittotheprivatesectorandultimatelyoneconomicgrowth.
ThebalanceofrisksforGDPgrowthislow.Inotherwords,theprobabilitythatthegrowthofGDPwilldivertbelowtheforecastinthebaselinescenarioishigherthantheprobabilitythatitwilldivertabovethisforecast.
Graph 108FORECAST OF GDP GROwTh 1/, 2013 - 2015
(Interanual%change)
10
8
6
4
2
0
10
8
6
4
2
02010 2011 2012 2013 2014 20152008 2009
Band
of %
pro
babi
lity a
roun
d th
e ba
se s
cena
rio
90
90
80
80
70
70
60
60
50
50
40
40
30
30
20
20
1010
Memo: ThegraphshowstheprobabilityofoccurrenceofGDPgrowthforecastsinthefuture,thevaluesofwhichwereestablishedcombiningstatisticalanalysis(usingdataasofApril2013)andthesubjectiveperceptionoftheBCRP.Thus,ineachperiodoftheforecasthorizon,eachpairofbandswiththesameshadeconcentratesaprobabilityof10%.1/GDPgrowthisdefinedasthepercentagechangeofthemovingaverageinfourquarterscomparedtothesamequarterofthepreviousyear.Thus,thefigureinQ4coincideswiththeGDPgrowthrateintheyear.
97.Theoutput gap reflectscyclicalfluctuations ineconomicactivitythatbecomeinflationarypressuresonthedemandside.Thisgapisaffectedbyvariouskinds
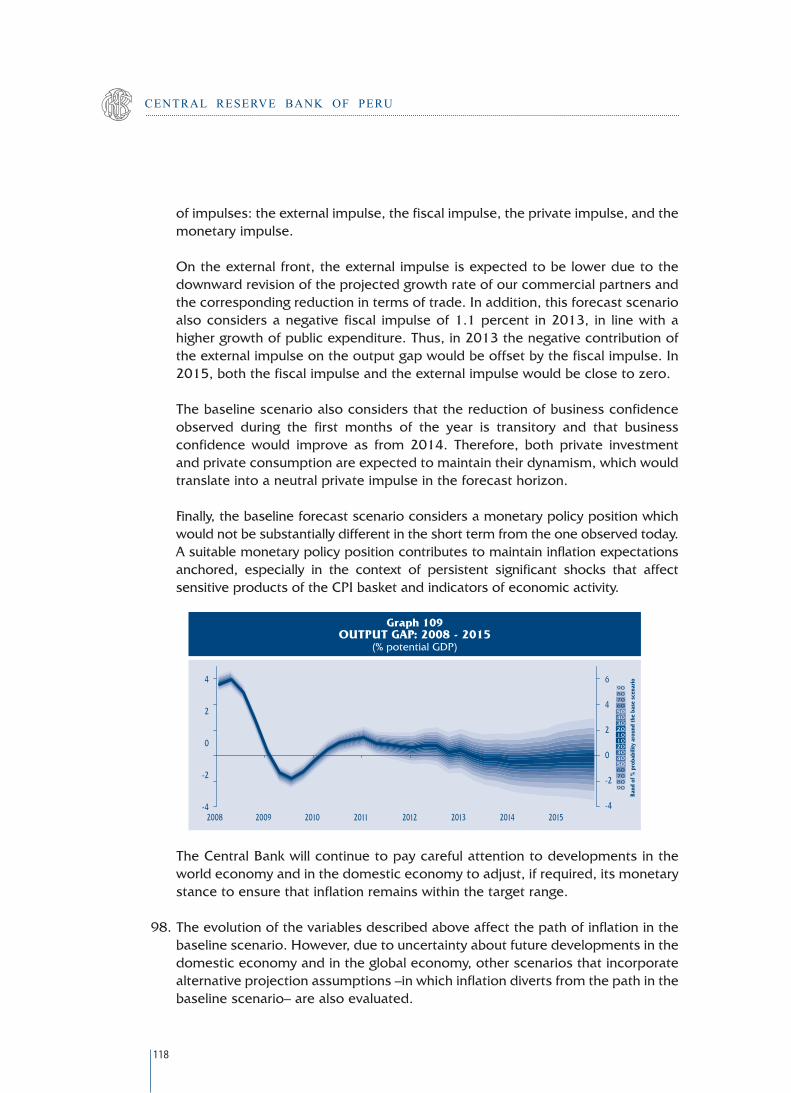
118
CENTRAL RESERVE BANK OF PERU
ofimpulses:theexternalimpulse,thefiscalimpulse,theprivateimpulse,andthemonetaryimpulse.
Ontheexternalfront,theexternalimpulseisexpectedtobelowerduetothedownwardrevisionoftheprojectedgrowthrateofourcommercialpartnersandthecorrespondingreductionintermsoftrade.Inaddition,thisforecastscenarioalsoconsidersanegative fiscal impulseof1.1percent in2013, in linewithahighergrowthofpublicexpenditure.Thus,in2013thenegativecontributionoftheexternalimpulseontheoutputgapwouldbeoffsetbythefiscalimpulse.In2015,boththefiscalimpulseandtheexternalimpulsewouldbeclosetozero.
Thebaselinescenarioalsoconsidersthatthereductionofbusinessconfidenceobserved during the first months of the year is transitory and that businessconfidencewould improve as from2014. Therefore, both private investmentandprivateconsumptionareexpectedtomaintaintheirdynamism,whichwouldtranslateintoaneutralprivateimpulseintheforecasthorizon.
Finally,thebaselineforecastscenarioconsidersamonetarypolicypositionwhichwouldnotbesubstantiallydifferentintheshorttermfromtheoneobservedtoday.Asuitablemonetarypolicypositioncontributestomaintaininflationexpectationsanchored, especially in the context of persistent significant shocks that affectsensitiveproductsoftheCPIbasketandindicatorsofeconomicactivity.
Graph 109OuTPuT GAP: 2008 - 2015
(%potentialGDP)
4
2
0
-2
-4
6
4
2
0
-2
-42010 2011 2012 2013 2014 20152008 2009
Band
of %
pro
babi
lity
arou
nd th
e ba
se s
cena
rio
90
90
80
80
70
70
60
60
50
50
40
40
30
30
20
20
1010
TheCentralBankwillcontinuetopaycarefulattentiontodevelopmentsintheworldeconomyandinthedomesticeconomytoadjust,ifrequired,itsmonetarystancetoensurethatinflationremainswithinthetargetrange.
98.Theevolutionofthevariablesdescribedaboveaffectthepathofinflationinthebaselinescenario.However,duetouncertaintyaboutfuturedevelopmentsinthedomesticeconomyandintheglobaleconomy,otherscenariosthatincorporatealternativeprojectionassumptions–inwhichinflationdivertsfromthepathinthebaselinescenario–arealsoevaluated.

119
Inf la t ion Report . September 2013
This isshown in thegraph illustrating the inflation forecast.Thedarkerbandscontainthepathofinflationinthebaselinescenario,whichshowsaprobabilityofoccurrenceofabout70percent.Thealternativeforecastscenarios,whicharedescribedinthesectionofBalanceofRisks,haveatotalprobabilityofoccurrenceof30percent.
Based on data available at August 2013, the probability that inflationwill bewithinthetargetrangein2013and2014isapproximately60percent,whiletheprobabilitythatitwillbebelow3percentis70percent.
Graph 110INFLATION FORECAST: 2013-2015
(Last12months%change)
7
6
5
4
3
2
1
0
-1
7
6
5
4
3
2
1
0
-12010 2011 2012 2013 2014 20152008 2009
Memo: The graph shows the probability of occurrence of inflation values in the future: These valueswere establishedcombiningstatisticalanalysisandthebalanceofriskofBCRP.Thus, ineachperiodoftheforecasthorizon,eachpairofbandswiththesameshadeconcentratesaprobabilityof10%.Thiscanbeinterpretedasthat10ofevery100possiblefuturevaluesofinflationareexpectedtofallwithinthedarkestbands(locatedinthecenter),thatcontainthebaselinescenariotrajectory.
Band
of %
pro
babi
lity
arou
nd th
e ba
se s
cena
rio
90
90
80
80
70
70
60
60
50
50
40
40
30
30
20
20
1010
Box 4EXCHANGE RATE-TO-INFLATION PASS-THROUGH
Inanopeneconomy,changesinthenominalexchangeratetendtoaffectthebehaviorofinflation.This phenomenon is known as the “pass-through effect” and having an idea of its magnitude and duration is crucial for a central bank, as the channel of monetary policy transmission depends on this phenomenon. When the pass-through effect is high, a change in the exchange rate only affects inflationandisnotreflectedintherealexchangerate.Ontheotherhand,whenthepass-througheffectislow,movementsinthenominalexchangeratearereflectedintherealexchangerateandtherefore this variable facilitates the economy’s adjustment to external shocks.
At the microeconomic level, the pass-through effect depends on importers and producers’ capability to transfer higher costs to the consumer. In turn, this capability is determined by the degree of substitution between goods and by market competition. Thus, for example, greater trade openness can reduce the pass-through effect over time. In addition to this, at the macroeconomic level, the magnitude of the pass-through effect depends on importers and producers’ perception of the nature

120
CENTRAL RESERVE BANK OF PERU
of the exchange rate shock –whether it is perceived as a transitory or a permanent shock–, as well ason thecredibilityof theCentralBank’smonetarypolicy tomaintain inflationat lowandstablelevels. When the shock is temporary, agents expect a rapid reversal of the exchange rate and prefer to temporarily reduce theirprofitsgiven thatapriceadjustment iscomparativelymoreexpensive.Conversely, when the shock is permanent, the price adjustment is almost immediate. Likewise, when a central bank has credibility, the pass-through effect is low.
In the case of Peru, recent empirical evidence indicates that the magnitude of the pass-through effect is low and that it is around 10 percent (Winkelried, 2012). This implies that an increase in the exchangerateinPerugeneratesaone-timeincreaseininflationassociatedwithachangeinrelativepricesandthat,therefore,itdoesnotgeneratepersistentincreasesininflation.However,thepass-through effect can also be non-linear. Winkelried (2003) found that the pass-through effect depends on a series of variables, including the magnitude itself of the depreciation of the nominal exchange rate,theeconomiccycle,themisalignmentoftherealexchangerate,theinflationarycontext,andthedollarization of the economy. For example, in periods of economic boom, if there is a strong nominal depreciation,acontextwithhighinflationandahighdegreeofdollarization,thepass-througheffectis stronger, whereas on the other hand, in periods of recession, if there is a moderate or mild nominal depreciation,stableinflation,andalowdegreeofdollarization,thepass-througheffectisweaker.
References
Vega,M. andDiegoWinkelried (2006), “Cambia la Inflación Cuando los PaísesAdoptanMetasExplícitasdeInflación”,BancoCentraldeReservadelPerú,WorkingPaper,2006-01.
Winkelried, D (2003), “Es asimétrico el pass-through en el Perú, Un análisis agregado”, Banco Central de Reserva del Perú, Revista Estudios Económicos, 10.
Winkelried,D(2012),“TraspasodeltipodecambioymetasdeinflaciónenelPerú”,BancoCentralde Reserva del Perú, Revista Estudios Económicos, 23.
121
Inf la t ion Report . September 2013
VII. Balance of Risks
99.Thebaselinescenariofortheinflationforecasttakesintoaccountrelevantdataonmacroeconomicandfinancialvariablesaswellasinformationonthedomesticandinternationalenvironmentthatiscomplementedwithqualitativeinformationnotnecessarilyincludedinstatisticaldata.
Given that the forecast process is not free from uncertainty about futuredevelopments in the domestic and in the global economies, other scenariosincludingalternativeforecastassumptionsthat,inthelongrun,divertinflationfromthebaselinescenarioarealsoevaluatedinthebalanceofrisks.
Thebalanceofrisksresultsfromassessingtherelativesignificancethateachoftheriskfactorshasontheinflationforecast.Theexpectedimpactofariskfactoroninflationdependsontwocomponents:first,themagnitudeofdeviationoftheinflationforecastintheriskscenariocomparedtothebaselinescenario,andsecond,theprobabilityofoccurrenceassignedtoeachriskscenario.Together,thesetwofactorsdeterminethebiasoftheinflationforecastinthebalanceofrisks.
AsinourReportofJune,themainrisksthatcoulddiverttherateofinflationfromthe baseline scenario in the forecast horizon are associatedwith uncertaintyabouttheevolutionoftheglobaleconomyandtheinternationalflowofcapitals,theimpactofcommoditypricesininternationalmarkets,andahigherimportedinflationinsoles.Thebalanceoftheseriskstodayisneutral.
Thedownward risksintheinflationforecastareexternalfactorsassociatedwiththepossibledeteriorationoftheworldeconomy,includingastrongerslowdowninthegrowthoftheemergingeconomies,andinternalfactorsassociatedwiththedynamicsofexpectationsofbusinessconfidence.
a. Slowdown of domestic demand
Businessconfidenceisanimportantdeterminantofprivateinvestment,soifitdeteriorateditwouldcontributetoalowerdynamismindomesticdemand,whichwouldresultinaloweroutputgapandconsequentlyinlowerinflation.Therecentevolutionof public expenditure and the implementationof public investmentprojectssuggestthatthefiscalimpulsewouldinpartoffsetthenegativeeffectsofthedeteriorationofbusinessconfidenceintheforecasthorizon.
Shouldtheserisksmaterialize,theCentralBankwouldrespondeasingmonetaryconditionstomaintaininflationwithinthetargetrange.

122
CENTRAL RESERVE BANK OF PERU
b. Deterioration of the international environment TheprobabilitiesthattheUnitedStateswillgothrougharecessionperiodorthat
therecessioninEuropewilldeepenhavedeclinedcomparedtotheprobabilitiesconsideredinourlastreport.However,therearehigherprobabilitiesthattheemergingeconomiesmayexperienceagreaterslowdown.Adeepeningoftheseriskconditionswouldentaillowerglobaldynamismandaweakeningofexternaldemand,whichwouldaffectthedomesticeconomythroughfinancialandtradechannels.
TheFEDisexpectedtostartgraduallywithdrawingmonetarystimulusasfromtheendof2013.Anearlierandlessgradualwithdrawalofquantitativeeasingcouldbringaboutarapidanddisorderlyadjustmentintheexchangerateandin the interest ratesofPublicTreasurybonds inoureconomygiventhehighparticipationofnon-residentinvestorsinthesedomesticsecurities.
Should these risks materialize, the Central Bank would use the significantamountofinternationalreservesthecountryhasandseveralliquidityinjectionmechanisms, both in national currency and in foreign currency, to offset theimpactoftheseshocksondomesticfinancialconditions.TheCentralBankwouldrespondtosuchmacroeconomicconditionsbyeasingmonetaryconditions.
On the other hand, the upward risks for inflation are associated with thedynamicsofcommoditypricesandotherpricessensitivetosupplyfactors
c. Domestic and external shocks
Thebaselinescenarioconsidersthatcommoditypriceswillremainrelativelystablenextyear. In theexternal front, therisksconsidered includetheriskofhigherinternationalpricesofcrudeoilandoilderivativesgiven thepolitical tensionsassociatedwithapossiblemilitaryinterventioninSyria.Inthedomesticfront,ontheotherhand,thebaselinescenarioconsiderstheriskthatfisheriescouldhavehigherpricesduetoadverseweatherconditions.
Inthisscenario,theCentralBankwouldadjustitsmonetarypositiononlyiftheseinflationaryshocksweretoaffectandincreaseeconomicagents’expectationsofinflation.
Becausetheeffectsofriskfactorspushinginflationdownwardsareoffsetbytheeffectsofriskfactorspushingitupwards, the balance of these risks is neutralfortherateofinflationforecastformid-2015.

123
Inf la t ion Report . September 2013
Conclusion
100.Becausethefasterpaceofinflationobservedrecentlyisassociatedwithtransitoryfactors,inflationisexpectedtoconvergetothetargetrangewhenthesefactorsdisappear. The path of inflation during the 1013-2015 horizonwould remainwithinthetargetrange.Thebalanceofrisksisneutral.
EventhoughtheestimatedrateofGDPgrowthhasbeenreviseddown,GDPwillcontinuetogrowatratesnottoodistantfromtheeconomy’spotentiallevelofgrowth,withadynamicevolutionindomesticdemandandwitharecoveryofnetexportsinthenextyears.
TheCentralBankwillcontinuetopaycarefulattentiontodevelopmentsintheworld economy and in the domestic economy, as well as in expectations ofinflation and stands ready to adjust itsmonetary stance if it is necessary toensurethatinflationremainswithinthetargetrange.
Graph 111BALANCE OF RISKS AGAINST ThE BASE SCENARIO
Expe
cted i
mpac
t = pr
obab
ility x
impa
ct (p
oints
of inf
lation
)
Risksontheupside
Risksonthedownside
Memo:Theriskassessmentdescribeshowexogenousfactorswouldaffecttherateofinflationforecastfor2yearsaheadifsuchrisksmaterialized.Eachbarinthegraphillustratesthemagnitudeanddirectionoftheeffectofthesefactors,i.e.,theexpectedimpactinalternativeforecastscenarios.Thisimpactiscalculatedasthedifferencebetweentheinflationforecastinthebaselinescenarioandinflationprojectionsinseveralscenariosconsideringdifferentassumptions,multiplyingthisdifferencebytheprobabilityofoccurrenceassignedtosuchalternativeassumptions.Thesumofthebars–theriskbalance–indicateshowtheseriskfactorsasawholewoulddivertinflationfromthebaselinescenariointhemediumterm.
0.08
0.06
0.04
0.02
0.00
-0.02
-0.04
-0.06
-0.08
0.08
0.06
0.04
0.02
0.00
-0.02
-0.04
-0.06
-0.08
Deterioration of theinternational environment
Demandshocks
IRJun.13 IRSep.13
-0.06
-0.04
-0.02-0.02
0.06
0.04
Domestic and external supply shocks
