inflation pressure effects in the nondimensional tire · pdf fileinflation pressure effects in...
TRANSCRIPT

2006-01-3607
Inflation Pressure Effects in the Nondimensional Tire Model
Edward M. KasprzakUniversity at Buffalo
Kemper E. LewisUniversity at Buffalo
Douglas L. MillikenMilliken Research Associates, Inc.
Copyright © 2006 Society of Automotive Engineers, Inc.
ABSTRACT
Inflation pressure affects every aspect of tireperformance. Most tire models, including theRadt/Milliken Nondimensional Tire Model, are restrictedto modeling a single inflation pressure at a time. This isa reasonable limitation, in that the Nondimensionalmodel forms an input/output relationship between tireoperating conditions and force & moment outputs.Traditional operating conditions are normal load, slipangle, inclination angle, slip ratio and road surfacefriction coefficient.
Tire pressure is more like a tire parameter than a tireoperating condition. Since the Nondimensional TireModel is semi-empirical it does not specifically deal withtire parameters like sidewall height or tread compound.Still, tire pressure is the easiest tire parameter tochange, and as the air temperature within the tire variesduring use so does the inflation pressure. Thus, it isdesirable to incorporate inflation pressure into theNondimensional Tire Model as an input.
This paper discusses the effects of tire pressure on tireforce and moment output. Effects on lateral force andaligning torque are investigated in detail. Additionally,the effects on cornering stiffness, friction coefficients,peak aligning torque coefficient and peak shape arereviewed. New techniques to implement pressureeffects in the Nondimensional Model are presented.Applications of these techniques are shown on aFormula SAE tire and a full-size radial racing tire.
Additionally, the effects of inflation pressure on tirespring rate and loaded radius are investigated. Whilethese are not modeled using Nondimensionaltechniques, they are important variables accompanyingany tire model.
INTRODUCTION
A variety of tire models are in use around the world withvarious levels of complexity, scope and purpose. Theycan be based on detailed tire structural models, oftenemploying finite element calculations, or they can besemi-empirical in nature. Applications range from tireride modeling, envelopment of road surfaceirregularities, tread shape analysis, rolling resistancecalculations, tire dynamics, tire force & momentprediction and beyond. All tire models have their ownstrengths and weaknesses, and applications to whichthey are well-suited.
The Radt/Milliken Nondimensional Tire Model is a semi-empirical tire model used to predict net tire forces andmoments. By semi-empirical, we mean that the modelcombines known operating conditions with assumptionsabout tire behavior to predict tire force and momentoutputs [1]. This paper follows SAE naming and axissystem conventions as defined in [2]. Figure 1,repeated from [2], defines the tire axis system and manyof the terms used throughout this paper.
Traditional inputs to the Nondimensional Model are:
α Slip Angle (deg, rad)
γ Inclination Angle (deg, rad)
σ Slip Ratio (unitless)
zF Normal Load (lb, N)
µS Surface Friction Coefficient (unitless)

Figure 1. The tire coordinate system, definition of terms
Force and moment outputs are:
yF Lateral Force (lb, N)
xF Longitudinal Force (lb, N)
zM Aligning Torque (lb-ft, N-m)
xM Overturning Moment (lb-ft, N-m)
The Nondimensional Tire Model takes a uniqueapproach to modeling tire data. It appliestransformations to raw tire data, resulting indimensionless variables. When a nondimensionaloutput variable is plotted against a nondimensional inputvariable a single load- and friction-independent curveresults. Radt and Milliken first proposed theNondimensional model in 1960 [3]. They used Fiala’sstructural tire model [4] as the basis for development ofthe nondimensional transformations. In the simplestcase, lateral force as a function of slip angle, thetransformations are:
αα =
µ z
CtanF
(1)
=µ
y
z
FF
F (2)
where C is the cornering stiffness and µ is the ratio ofpeak lateral force to normal load at a given normal load.The nondimensional variables α and F are unitless. Inthese transformations, C and µ are not constants, butrather are themselves functions of the tire operating
conditions and, thus, functions of the inputs to theNondimensional model.
Cornering stiffness is defined as:
α=
∂=
∂αy
0
FC (3)
And is modeled as:
( )= zC f F (4)
Friction Coefficient is defined as:
µ =y
y
z peak F
F
F (5)
And is modeled as:
( )µ = zf F (6)
While the peak of the lateral force curve happens atvarying values of slip angle, slip angle is not required tobe an argument to the function modeling frictioncoefficient. In this simplest case we are assuming aconstant inclination angle, so the inclination angle doesnot appear in any of the above equations.
Variations of cornering stiffness and friction coefficientwith load are assumed to be smooth and continuous.Raw data validates this assumption. Implementation ofEquations 4 and 6 is typically accomplished using low-degree polynomials. A quadratic or cubic fit is usuallysufficient.
In general, Figures 2 and 3 from Milliken/Milliken [5]show typical lateral force vs. slip angle curves and theirsubsequent transformation into nondimensionalcoordinates.
Figure 2. Typical Lateral Force vs. Slip Angle curves
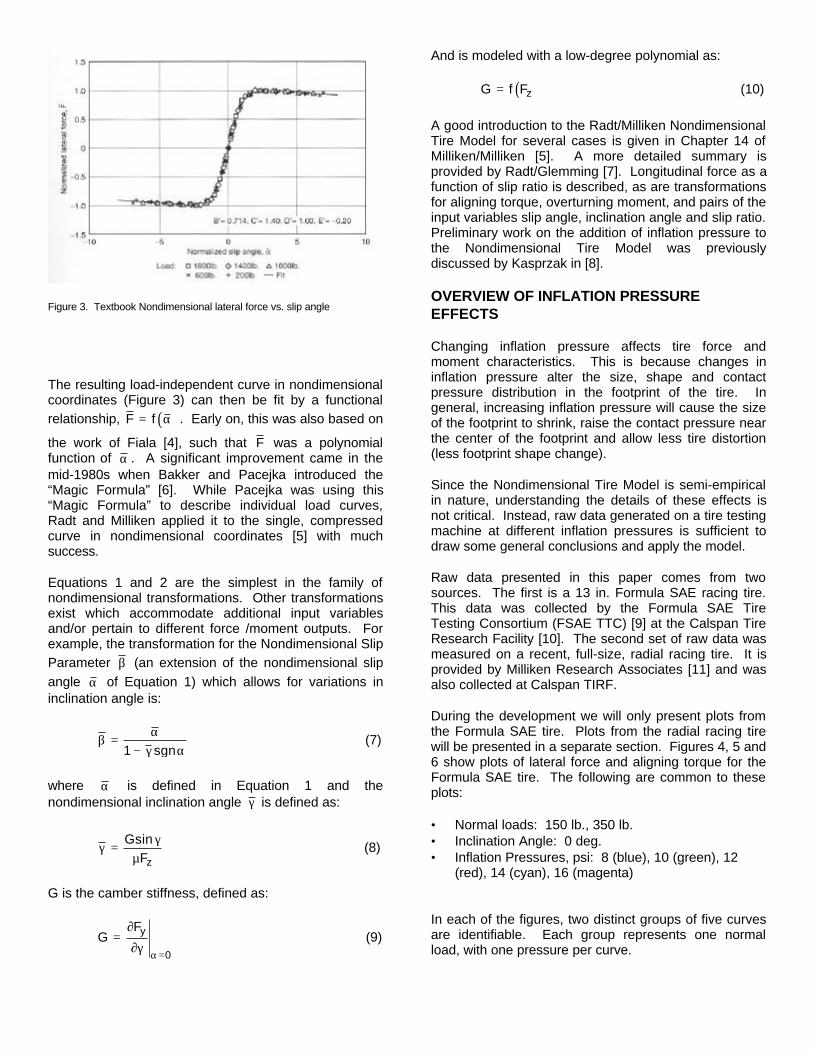
Figure 3. Textbook Nondimensional lateral force vs. slip angle
The resulting load-independent curve in nondimensionalcoordinates (Figure 3) can then be fit by a functionalrelationship, ( )= αF f . Early on, this was also based on
the work of Fiala [4], such that F was a polynomialfunction of α . A significant improvement came in themid-1980s when Bakker and Pacejka introduced the“Magic Formula” [6]. While Pacejka was using this“Magic Formula” to describe individual load curves,Radt and Milliken applied it to the single, compressedcurve in nondimensional coordinates [5] with muchsuccess.
Equations 1 and 2 are the simplest in the family ofnondimensional transformations. Other transformationsexist which accommodate additional input variablesand/or pertain to different force /moment outputs. Forexample, the transformation for the Nondimensional SlipParameter β (an extension of the nondimensional slipangle α of Equation 1) which allows for variations ininclination angle is:
αβ =
− γ α1 sgn (7)
where α is defined in Equation 1 and thenondimensional inclination angle γ is defined as:
γγ =
µ z
GsinF
(8)
G is the camber stiffness, defined as:
α=
∂=
∂γy
0
FG (9)
And is modeled with a low-degree polynomial as:
( )= zG f F (10)
A good introduction to the Radt/Milliken NondimensionalTire Model for several cases is given in Chapter 14 ofMilliken/Milliken [5]. A more detailed summary isprovided by Radt/Glemming [7]. Longitudinal force as afunction of slip ratio is described, as are transformationsfor aligning torque, overturning moment, and pairs of theinput variables slip angle, inclination angle and slip ratio.Preliminary work on the addition of inflation pressure tothe Nondimensional Tire Model was previouslydiscussed by Kasprzak in [8].
OVERVIEW OF INFLATION PRESSUREEFFECTS
Changing inflation pressure affects tire force andmoment characteristics. This is because changes ininflation pressure alter the size, shape and contactpressure distribution in the footprint of the tire. Ingeneral, increasing inflation pressure will cause the sizeof the footprint to shrink, raise the contact pressure nearthe center of the footprint and allow less tire distortion(less footprint shape change).
Since the Nondimensional Tire Model is semi-empiricalin nature, understanding the details of these effects isnot critical. Instead, raw data generated on a tire testingmachine at different inflation pressures is sufficient todraw some general conclusions and apply the model.
Raw data presented in this paper comes from twosources. The first is a 13 in. Formula SAE racing tire.This data was collected by the Formula SAE TireTesting Consortium (FSAE TTC) [9] at the Calspan TireResearch Facility [10]. The second set of raw data wasmeasured on a recent, full-size, radial racing tire. It isprovided by Milliken Research Associates [11] and wasalso collected at Calspan TIRF.
During the development we will only present plots fromthe Formula SAE tire. Plots from the radial racing tirewill be presented in a separate section. Figures 4, 5 and6 show plots of lateral force and aligning torque for theFormula SAE tire. The following are common to theseplots:
• Normal loads: 150 lb., 350 lb.• Inclination Angle: 0 deg.• Inflation Pressures, psi: 8 (blue), 10 (green), 12
(red), 14 (cyan), 16 (magenta)
In each of the figures, two distinct groups of five curvesare identifiable. Each group represents one normalload, with one pressure per curve.

Figure 4. Pressure Effect on Lateral Force
Figure 5. Closer look at pressure effect on lateral force
Figure 6. Pressure Effect on Aligning Torque
Figure 5 shows a close-up of the lateral force curvesseen in Figure 4. From this figure a few comments onthe recorded data can be made. Each constant-loadcurve exhibits some amount of noise and hysteresis.This is typical of measured tire data. The hysteresis is aresult of variables which cannot be controlled directly onthe test platform, such as tread temperature. Everymeasurement includes noise, and the high-frequencyoscillatory behavior could be due to tire nonuniformities,an out-of-round wheel or the sampling instrument’s built-in filtering algorithm. These artifacts can be safelyignored for the work presented in this paper.
It is clear in all the figures that changing inflationpressure alters the force and moment curves. In Figure5 at 150 lb. normal load, a decrease in inflation pressureincreases the lateral force capability of the tire. In theslip angle range shown, the difference between 16 psiand 8 psi is approximately 40 lb. of lateral force. This isa 10% difference. At the 350 lb. load the effect ofpressure is just the opposite. Here lateral forcecapability increases as inflation pressure increases. Inthe region shown, lateral force exhibits up to a 20%difference between 8 psi and 16 psi.
No drive/brake data was collected at various pressureson the Formula SAE tire, although the same techniquespresented here can also be applied to longitudinal force.In general, optimum longitudinal force performanceoccurs at lower inflation pressures. Lateral andlongitudinal forces are optimized at different pressures,and the trends often go in opposite directions(increasing inflation pressure typically increases lateralforce capability but reduces longitudinal forcecapability). This makes selecting tire pressures for arace car a very difficult compromise, as ideally we wouldlike both lateral and longitudinal force capability to beoptimized at the same pressure.
Figure 6 demonstrates the effect of inflation pressure onaligning torque. As load increases, the effect of inflationpressure also increases—the range of values in the 150lb. curve are much smaller than in the 350 lb. curve.Unlike lateral force, however, the trend is always in thesame direction. Increasing inflation pressure reducesaligning torque which, when fitted to a car, reduces thesteering effort and rigid body aligning torque.
From these sample plots it can be seen that inflationpressure has a noticeable effect on tire force andmoment curves. As such, adjustment of inflationpressure is an effective way to modify tire (and thusvehicle) performance. Furthermore, inflation pressureincreases as the contained air temperature increaseswith tire use. This pressure “build-up” necessarilychanges tire force and moment characteristics and mustbe accounted for when selecting initial or “cold” inflationpressures. For these reasons it is highly desirable tohave inflation pressure as an input to a tire model alongwith the traditional operating condition inputs.
INFLATION PRESSURE AS AN INPUT VARIABLE
A literature review shows that there has been littlepublished on incorporating pressure as an input to tiremodels. Prior to the work presented in this paper, theNondimensional model could only be applied to datacollected at a single pressure. If data was available atmultiple pressures, each pressure would be fit with itsown Nondimensional model.
Values at intermediate pressures could be predictedfrom a series of single-pressure models using severaltechniques. The simplest is to directly interpolatebetween the two nearest pressures. If linearinterpolation is used, slope discontinuities acrossinflation pressure will appear at each measuredpressure. Alternatively, force and moment values couldbe predicted at a given operating point for everypressure at which a model was developed. This couldthen be fit with a spline or a polynomial to determinevalues at intermediate pressures. While this techniqueoften gives reasonable results, it is not consistent withthe Nondimensional Tire Model approach.
The key feature of the Nondimensional model is its useof transformations based on physically-meaningfulengineering quantities to compress tire data into loadand friction independent curves. Post-expansion fittingof a polynomial or spline does not give anyunderstanding of pressure effects on a fundamentallevel and reduces the accuracy of the model.
The correct Nondimensional approach is to includepressure in the transformations such as those shown inEquations 1 and 2. Development of this approach isgiven in the next section where, for simplicity, we focusonly on lateral force at a constant inclination angle.
LATERAL FORCE
Several approaches were considered before it wasdetermined that the best way to incorporate pressure inEquations 1 and 2 was through the definitions ofcornering stiffness and friction coefficient given inEquations 4 and 6. These equations now become:
( )= zC f F ,P (11)
( )µ = zf F ,P (12)
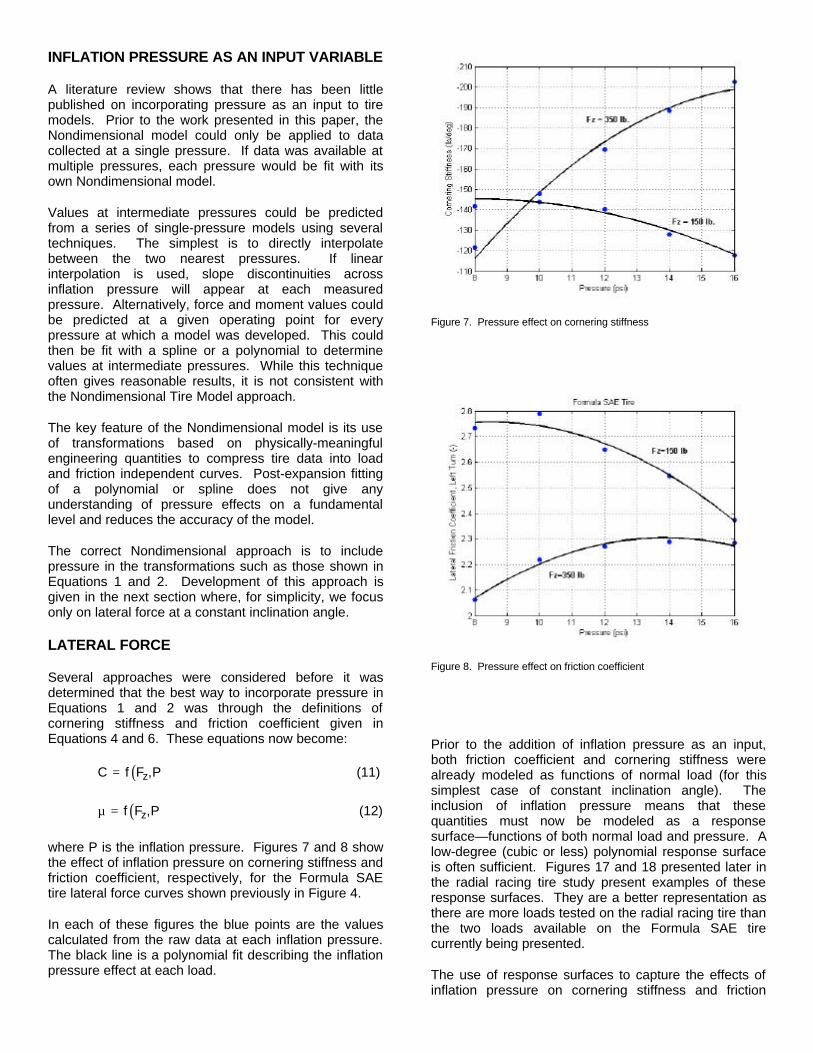
where P is the inflation pressure. Figures 7 and 8 showthe effect of inflation pressure on cornering stiffness andfriction coefficient, respectively, for the Formula SAEtire lateral force curves shown previously in Figure 4.
In each of these figures the blue points are the valuescalculated from the raw data at each inflation pressure.The black line is a polynomial fit describing the inflationpressure effect at each load.
Figure 7. Pressure effect on cornering stiffness
Figure 8. Pressure effect on friction coefficient
Prior to the addition of inflation pressure as an input,both friction coefficient and cornering stiffness werealready modeled as functions of normal load (for thissimplest case of constant inclination angle). Theinclusion of inflation pressure means that thesequantities must now be modeled as a responsesurface—functions of both normal load and pressure. Alow-degree (cubic or less) polynomial response surfaceis often sufficient. Figures 17 and 18 presented later inthe radial racing tire study present examples of theseresponse surfaces. They are a better representation asthere are more loads tested on the radial racing tire thanthe two loads available on the Formula SAE tirecurrently being presented.
The use of response surfaces to capture the effects ofinflation pressure on cornering stiffness and friction

coefficient is sufficient to make the transformations inEquations 1 and 2 quite useful. Application of thesetransformations on the Formula SAE tire results inFigure 9. Here, all pressures and loads shown in Figure4 are represented. As is the goal of the Nondimensionalmodel, they all fall on a single curve.
Figure 9. Nondimensional lateral force curve
This curve looks very similar to the textbook versionpresented in Figure 3. A single instance of the MagicFormula (black line) can be fit to this nondimensionalcurve.
This completes the Nondimensional model for the caseof lateral force as a function of slip angle and inflationpressure. The transformations and single MagicFormula can now be used to expand the model at anyoperating point. The expansion is plotted against theraw data in Figure 10. This figure shows that thevariations in lateral force with inflation pressure areadequately captured by the method described above.
Figure 10. Expanded Nondimensional model, lateral force
ALIGNING TORQUE
The approach to fitting aligning torque, Mz, as a functionof slip angle and inflation pressure is analogous to thatfor lateral force. The transformation for slip angle is thesame as Equation 1. The remainder of the relevantequations are:
=µ
z
z
M z
MF
F (13)
α=
∂=
∂αzz
M0
MC (14)
µ =z
z
zM
z peak M
MF
(15)
zMC and µzM are the aligning stiffness and peak
aligning torque coefficient, respectively. They aremodeled as response surfaces:
( )=zM zC f F ,P (16)
( )µ =zM zf F ,P (17)
Working with the data presented in Figure 6, these twoquantities vary as shown in Figures 11 and 12. Again,this variation is captured in a low-degree (cubic or less)polynomic response surface across normal load andinflation pressure, although it is not shown here.
Application of the transformations leads to thecompressed (nondimensional) curve shown in Figure13. All combinations of normal load and inflationpressure are compressed to a single curve and a singleinstance of the Magic Formula represents this curvewell. Expansion of the model leads to the curves shownin Figure 14.
Figure 11. Pressure effect on aligning stiffness

Figure 12. Pressure effect on peak aligning torque coefficient
Figure 13. Nondimensional aligning torque curve
Figure 14. Expanded Nondimensional model, aligning torque
On the whole the model fits the data well. Past-peakmodel behavior deviates from the raw data at the higherload. This will be addressed in the section on peakshape representation.
As can be seen in these figures, the Nondimensionaltechnique does a good job accounting for inflationpressure effects on aligning torque. In the next sectionwe demonstrate applications of the same techniquespresented for lateral force and aligning torque on a full-size radial racing tire.
APPLICATION TO A RADIAL RACING TIRE
As mentioned previously, Calspan data on a recentradial racing tire was provided by Milliken ResearchAssociates, Inc. The data collected is similar instructure to the Formula SAE tire data presented in theprevious sections. The main differences are theincreased number of loads and the wider range ofpressures for which data is available. Five loads weretested: 200, 600, 1000, 1400 and 1800 lb. Fourpressures were tested: 20, 26, 32 and 38 psi.
Figure 15 shows lateral force plotted as a function of slipangle. The five groups of lines correspond to the fivenormal loads tested. Within each group the fourpressures are each represented by a different color.The result of the Nondimensional model is also seen onthis graph—one line per combination of load andinflation pressure. On the whole it can be seen that thetechniques presented above to capture inflationpressure effects represent the data well.
Figure 16 shows a more detailed view of the high-load,left hand turn portion of Figure 15. From this it can beseen that while the Nondimensional model generallycaptures the pressure effects there are definitedeficiencies, especially at the highest load. Techniquesto address this will be presented in the next section.
Figure 15. Nondimensional model, lateral force, radial racing tire

Figure 16. Left-hand turn, high load focus, lateral force, radial racing tire
Figure 17. Cornering stiffness variation with load and inflation pressure
Figure 18. Friction coefficient variation with load and inflation pressure
Because a larger number of loads were tested, theradial racing tire is a better platform to show theresponse surface implementation described byEquations 4 and 6. These are shown in Figures 17 and18. Here, cornering stiffness and friction coefficient areseen to vary as a function of both normal load andinclination angle. This behavior is captured by responsesurfaces. Typically the response surface does not needto contain anything higher than a third degree term.
These results are typical of the Radt/MillikenNondimensional tire model, and, while not shown, thealigning torque fits on the radial racing tire are similar tothose generated for the Formula SAE tire.
PEAK SHAPE REPRESENTATION
Figures 14 and 16 show that, in some instances, theNondimensional model has difficulty modeling the rawdata near and past the peak of the data curve. Theequations presented previously focus largely on thelinear range of tire behavior and the magnitude of thepeak. Traditional Nondimensional theory assumes thenondimensionalized data curves, such as those shownin Figures 9 and 13, can be represented by a singlefunctional relationship. Indeed, this is the goal of thetransformations—to compress data to a single curve innondimensional coordinates.
Generally this is accomplished. However, there areinstances where the shape of the nondimensionalcurves at the peak vary sufficiently that a single fit to thecompressed curve does not adequately capture the tire’sbehavior. That is, changes in load, inflation pressureand other operating variables interact with the tire tochange the characteristic shapes of the data curves insuch a way that the transformations do not capture allthe effects. When all the effects are not represented inthe transformations the nondimensional space does notexhibit a compact, single curve.
An example of this behavior is shown in Figure 19. Thisis the same data presented in the radial racing tiresection, leading to Figures 15 and 16. In this figureeach color represents a unique combination of normalload and inflation pressure. While each combinationgenerally falls on a single compressed curve, it can beseen that some combinations peak sooner than othersand show more curvature at the peak than others. Forexample, compare the green and magenta curves.Figure 13 shows similar behavior for aligning torque.
As a result, fitting a single functional relationshipthrough this collection of points will fail to capture all ofthe tire’s characteristics, ultimately leading toinaccuracies in the expanded version of the model.Research is continuing on how to best-address this issueconsistent with the Radt/Milliken Nondimensional TireModel approach.

Figure 19. Nondimensional curve with incomplete compression
Figure 20. Magic Formula fit of each load and pressure combination
Figure 21. Magic Formula “E” coefficient variation with load and pressure
In the meantime, a relatively simple and effectivesolution is proposed. Instead of fitting the curve inFigure 19 with a single instance of the Magic Formula,each combination of normal load and inflation pressureis fit with its own instance of the Magic Formula. In thiscase with five loads and four inflation pressures a totalof 20 instances of the Magic Formula are determined.The resulting curves appear as shown in Figure 20,which highlight just how different the curve shapes in theNondimensional space can be.
With coefficients for each individual Magic Formulacurve determined, patterns in the way the coefficientsvary as a function of the input variables can beidentified. These have been found to vary smoothlyand, as with cornering stiffness, friction coefficient andother parameters presented earlier, are well-describedby low-degree (cubic or less) polynomic responsesurfaces. For example, Figure 21 illustrates thevariation of the Magic Formula’s “E” coefficient withnormal load and inflation pressure. Response surfacesfor the other coefficients are similar.
By allowing the Magic Formula coefficients to vary as afunction of normal load and inflation pressure, effectsnot currently captured by the transformations can berepresented. Figure 22 shows the improved fit forlateral force (compare with Figure 16). And Figure 23presents an improved fit for aligning torque (comparewith Figure 14). Note that the past-peak behavior isimproved compared with Figures 14 and 16.
While the resulting model fits correspond well with theraw data, the technique is not consistent with theNondimensional model approach. Since the effects arenot captured in transformations but rather in a post-transformation modification the results cannot be scaledas accurately to surfaces of different friction coefficient.In instances where the resulting Nondimensional curveis described by a single instance of the Magic Formulaexpansions at different surface friction coefficient valuesare properly handled.
Figure 22. Improved lateral force fit

Figure 23. Improved aligning torque fit
That said, this hybrid approach does a very good job ofrepresenting the tire curves and can be used to capturetire characteristics not represented in the typicalNondimensional transformations. Whether thisapproach will be replaced by more comprehensivetransformation equations remains to be seen. It is thesubject of continuing research.
OTHER CONDITIONS AND OUTPUTS
Techniques to incorporate inflation pressure effects intothe Radt/Milliken Nondimensional Tire Model have beenshown for lateral force and aligning torque at constantinclination angle. While the transformations themselveshave not been altered, the inflation pressure contributionto the transformations has been included throughresponse surface descriptions of cornering stiffness,aligning stiffness, lateral friction coefficient and peakaligning torque coefficient.
The same technique has been applied to longitudinalforce. In this instance, the tractive stiffness andlongitudinal friction coefficient are represented withresponse surfaces. While not shown here, results are ofthe same quality as those presented above.Descriptions of the traditional longitudinal forcetransformations are found in Milliken/Milliken [5] andRadt/Glemming [7].
Radt/Glemming [7] also describe combined slip angleand inclination angle operation. Equations 7 through 10summarize the transformations used to model lateralforce as a function of this pair of inputs. Addition ofinflation pressure effects is accomplished in a similarway to the previous development when inclination anglewas held constant. Low-degree polynomic responsesurfaces are generated as a function of three variables:
( )= γzC f F , ,P (18)
( )= γzG f F , ,P (19)
( )µ = γzf F , ,P (20)
In addition to affecting force and moment curves,inflation pressure changes also modify spring rate,loaded radius and effective radius characteristics.While these are not modeled with the same data-compressing techniques of the Nondimensional model,for completeness a review of these effects is presentedhere.
In general, tire vertical spring rate increases as inflationpressure is increased. Sample data from a FormulaSAE tire at a nominal load is shown in Figure 24. Themagnitude of this effect is significant. For this tire thesensitivity is approximately 30 lb/in increase in springrate per 1 psi increase in inflation pressure. Thisvariation is well-described by a cubic polynomial.
Figure 24. Inflation pressure effect on spring rate
Since the tire spring rate acts in series with thesuspension springs and dampers any changes in tirespring rate also affect load transfer, ride quality, rideheights, etc. This can be an important considerationwhen control of body attitude is important to maintain adesired aerodynamic platform.
Figure 25 presents loaded radius data for the radialracing tire at a constant inclination angle, zero slip angleand zero slip ratio (all of which also affect the loadedradius). As expected, the loaded radius is a strongfunction of normal load, but it is also a fairly strongfunction of inflation pressure. This is especially true athigh loads.

Figure 25. Inflation pressure effect on loaded radius
The lower right edge of the curve indicates that, at an1800 lb. load, the loaded radius changes 0.5 inches overthe range of pressures shown. This range of pressuresis representative of the pressure build-up seen as tiresheat during use. Thus, a cold tire at this load will be halfan inch shorter than the same tire after it has been usedfor a number of laps and the inflation pressure hasincreased due to core air temperature increases. Thishas significant implications on ride height and bodyattitude.
FUTURE WORK
This paper represents a significant step forward for theNondimensional Tire Theory. Prior to this, inflationpressure effects had not been considered within thescope of the model. Furthermore, there was no way toaccount for peak shape variations in nondimensionaldata curves.
There are a few avenues of continuing research. First,while the pressure variations have been successfullymodeled in cases of single inputs (slip angle) and pairsof inputs (e.g., slip angle and inclination angle), it hasnot been applied to the full case, namely combined non-zero slip angle, inclination angle and slip ratio. Thismost general operating condition has eludednondimensionalization and is the subject of continuingresearch.
The peak shape variations in the nondimensional curvesalso require further research. Perhaps there are morecomprehensive nondimensional transforms than thestandard equations used since the Nondimensional TireTheory was introduced. While Equations 1 and 2, forexample, have been very successful in compressingdata curves, the fact that they don’t fully compresscurves in some cases indicates that they do not capturesome mechanism of tire behavior. In this paper this
shortcoming has been removed by the new techniquefor post-nondimensionalization curve fitting. There may,however, be a more fundamental method for handlingthis behavior, one that modifies the transformationequations themselves to achieve complete compressionof the data to a single curve. This, too, is an active areaof continuing research.
CONCLUSION
Through the techniques presented in this paper, theRadt/Milliken Nondimensional Tire Model has beenextended to include inflation pressure as an operatingvariable. Inflation pressure has been shown to havesignificant effects on tire force and momentcharacteristics, as well as tire spring rate and loadedradius. The key to the technique is to capture inflationpressure effects in the same manner as normal loadeffects. Measured parameters used in thenondimensional transformations, such as corneringstiffness and friction coefficient, become functions ofinflation pressure as well as normal load. As a multi-variable function, the behavior is best-represented by aresponse surface. Since tires exhibit continuous,smooth variation of these parameters with load andpressure, low-degree (cubic or less) polynomic responsesurfaces are sufficient.
This technique, in combination with the previously-existing nondimensional transformations does a goodjob of compressing raw data curves at several inflationpressures to a single curve in nondimensionalcoordinates. At times, tire response to pressure is suchthat the characteristic shape of the force and momentcurves are altered, resulting in incomplete compressionof the nondimensional curve. In these instances,applying a functional relationship at each combination ofload and pressure, and then determining how thecoefficients of this relationship vary with load andpressure, captures the variations. Once again, low-degree polynomic functions suffice to describecoefficient variation.
While research is continuing towards refining theeffectiveness of the techniques used to capture inflationpressure effects, especially in the near-peak and past-peak regions, the approaches presented here show verygood correlation with data collected on a Formula SAEtire and a radial racing tire.
ACKNOWLEDGMENTS
This work was performed under support from MillikenResearch Associates, Inc. and The US Department ofTransportation Eisenhower Doctoral Scholarship (GrantDDEGRD-03-X-00407). Edward Kasprzak also wishesto acknowledge the support of the SAE DoctoralScholarship program.

REFERENCES
1. Milliken, W.F., “High Camber Tests of Treaded andSmooth Motorcycle Tires on Calspan Tire ResearchFacility”, January 1975.
2. SAE J670e, “Vehicle Dynamics Terminology".Society of Automotive Engineers, Inc., 400Commonwealth Drive, Warrendale, PA 15096, June1978.
3. Radt, H.S. and W.F. Milliken, “Motions of SkiddingAutomobiles”, SAE Paper Number 205A, SAESummer Meeting, Chicago, IL, June 5-10, 1960.
4. Fiala, E., “Seitenkrafte am Rollenden Luftreifen”(“Lateral Forces on Rolling Pneumatic Tires”),Zeitschrift, V.D.I., Vol. 96, No. 29, October 11, 1954,pp. 973-979.
5. Milliken, W.F. and D.L. Milliken, “Race Car VehicleDynamics”, SAE International, Warrendale, PA,1995.
6. Bakker, E., L. Nyborg and H.B. Pacejka, “TireModeling for Use in Vehicle Studies”, SAE PaperNo. 870421, SAE, Warrendale, PA, 1987.
7. Radt, H.S. and D.A. Glemming, “Normalization ofTire Force Moment Data”, Tire Science andTechnology, TSTCA, Vol. 21, No. 2, April-June,1993, pp. 91-119.
8. Kasprzak, E.M., K.E. Lewis and D.L. Milliken, “TireAsymmetries and Pressure Variations in theRadt/Milliken Nondimensional Tire Model”, SAEPaper No. 2006-01-1968, SAE, Warrendale, PA,2006.
9. Formula SAE Tire Testing Consortium,www.millikenresearch.com/fsaettc.html
10. Calspan Tire Research Facility,www.calspan.com/tire.htm
11. Milliken Research Associates, Inc.www.millikenresearch.com
CONTACTS
Edward M. KasprzakPh.D. candidate, University at Buffalo SUNYAssociate, Milliken Research Associates, Inc.(716) [email protected]