inflation in hong kong : patterns, causes and...
TRANSCRIPT

i
INFLATION IN HONG KONG :
PATTERNS, CAUSES AND POLICIES
Business and Professionals Federation of Hong Kong
October 1991
ii
Business and Professionals Federation of Hong Kong
Statement on Inflation and Policy Proposals
I. Introduction: Hong Kong's unacceptably high inflation is a deep concern to our whole
community. Therefore, the accompanying study has been commissioned by the
Business and Professionals Federation to investigate the true causes of inflation, to
assess the relevance of some suggested remedies, and to propose policy solutions. Our
recommendations seek to address the fundamental causes of inflation and to be
conducive to long term price stability.
II. The Social and Economic Costs of Inflation: The recent inflationary spiral started from
3% in 1986 and rose to nearly 13% in recent months. During this period Hong Kong
experienced an unusually low rate of measured unemployment and since 1988 also a
low rate of real economic growth. The current inflation has adverse economic and
social effects on Hong Kong.
A. High inflation erodes Hong Kong's competitiveness and its manufacturing base.
Inflation also deters foreign investment - particularly from multinationals - and
threatens Hong Kong's international status as a financial and service centre.
B. In addition, inflation also has socially undesirable effects on income distribution.
Particularly hard hit are senior citizens living on fixed income with few means
of sheltering their life savings from the ravages of inflation. Inflation also

iii
penalizes the average saver and discourages investment. Rapid appreciation of
residential property prices - not unrelated to the inflation phenomenon - places
an undue burden on renters and puts the dream of home-ownership beyond the
reach of many families.
III. Structural Transformation Key to Understanding Current Inflation: While various
explanations of inflation have been offered, our study indicates that the key to
understanding current inflation is the structural transformation of the Hong Kong
economy as it becomes increasingly integrated with South China's economy. High
inflation is one manifestation of this adjustment process.
A. One well-known aspect of the economic integration is the relocation of Hong
Kong manufacturing activities to China. But much more important, and less
well understood, is that the opening of the Chinese economy to foreign direct
investment, especially for export-oriented industries, and the access to lower cost
land and labour, have led to a significant increase in business opportunities, for
Hong Kong. The result is an economic boom - though a highly uneven one - for
Hong Kong.
B. The expansion of manufacturing activities in South China has prompted a
corresponding increase in the demand for service activities, the trading,
merchandising, shipping, banking, insurance, and financial services that support
and complement manufacturing activities. While the manufacturing activities
are primarily located in China, much of the expansion in service activities is by
iv
necessity located in Hong Kong. This is the key aspect of the transformation of
Hong Kong from a manufacturing economy to a service economy: the need for
rapid expansion of Hong Kong's service sector to complement the rapidly
growing South China manufacturing base.
c. The rapid expansion of the service sector at a time of stagnant labour force
growth has generated a sharp increase in labour costs - particularly in the service
sector - and fuelled inflation.
IV. Imported Inflation: Although structural transformation is the key to understanding
inflation, our study also addresses in detail other possible explanations of inflation, in
particular imported inflation, housing prices, and the growth of government spending. It
has been argued that Hong Kong suffers from imported inflation due to the Linked
Exchange Rate System. Our study demonstrates that this is not a primary factor and
explains why the likely impact of anything short of a dramatic adjustment to our
exchange parity would be minimal.
V. Housing Costs and Inflation: Based on historical data, our study found no apparent
statistical relationship between inflation, residential property prices, and housing rentals.
However, this finding must be interpreted with extreme care.
A. While higher property prices can translate into higher rentals, this relationship
can be highly variable and may be shrouded by lags of two to three years or
more. For this reason, the failure to establish a statistical relationship between
v
realty prices, rentals, and inflation does not preclude housing costs as an
important determinant of inflation. Second, the spectacular run-up in residential
property prices this year has only started to feed into higher rentals and inflation
and is therefore not captured in our study. Its full effects on the economy have
yet to the determined and remain a legitimate concern. Third, although the
current residential property price run-up is not "inflation" by definition, this is
small comfort for the families trying to save enough to buy their first home.
Similarly, despite the lack of a strong historical relationship between housing
prices and inflation, the renter and potential home purchaser should rightly feel
threatened by the recent residential property price boom. Finally, the current
residential property price boom also has obvious and significant effects on the
distribution of wealth.
B. For all these reason, we urge the policy makers to remain vigilant about the issue
of housing prices. At the same time, we are not recommending the policy
makers to adopt stop-gap measures to cool the residential property price boom to
appease public sentiments, but to consider lasting measures to alleviate the
property shortage, in particular, the availability of more land for housing
development is a viable long-term solution to stabilizing housing prices.
VI. Growth in Government Spending and Inflation: Our study also found that the growth in
government spending does not appear to be a primary cause of inflation. However, this
is not to suggest that fiscal restraint is not important in the fight against inflation.

vi
A. During the past three or four years, government expenditure has been growing
significantly faster than economic growth. Our study suggests that inflation, by
increasing government revenue, can lead to higher spending by the public sector.
However, higher government spending is not appropriate in the current situation
because it would only further fuel inflation.
B. Government expenditure has already approached its historical high of 20% of
GDP in recent years, and is forecast to grow even faster in the coming years, in
large part due to the PADS project. In this situation, it is imperative for the
policy makers to remain vigilant about fiscal discipline so as not to allow the
public sector to divert excessive resources from the rest of the economy and
further fuel inflation.
C. Besides exercising restraint on expenditures, an effective way of restraining
public sector growth is through privatization and other measures aimed at
improving efficiency.
VII. A Human Resource Strategy to Curb Inflation: While strict fiscal discipline and a sound
land policy would help ensure that the Government is not itself fanning the flames of
inflation, by themselves these measures would not be sufficient to cure inflation
because, as noted earlier, the current inflation is structural in nature and a long-term
solution must address the structural transformation of the Hong Kong economy.
Whilst Government has made impressive progress in expanding the educational and
vii
training facilities which is vital for our future development, however, it should be
recognized that growth in the tertiary student population of Hong Kong creates strains in
the labour market in the short to medium terms.
A. Because the root cause of the current inflation is the structural transformation of
the Hong Kong economy in the context of a stagnant labour force, the most
direct way to curb inflation is to retard the trend of outward processing and
restructuring, but this is neither feasible more desirable.
B. Short of restraining the economic integration of Hong Kong and South China,
the alternative is to pursue a human resource strategy aimed at the maintenance
of full employment and steady wage-growth while alleviating the current labour
shortage. A strategy to promote moderate growth of the labour force would help
maintain continued economic growth and prosperity.
C. Such a strategy would have the added advantage of encouraging balanced
economic growth. Measures aimed at expanding the work force would help
keep deindustrialization in check and ease the pain of job losses as entire
industries disappear from Hong Kong. Moreover, by keeping the economy
diversified, the human resource strategy would also help alleviate the economy's
vulnerability to sectoral shocks.
D. There are two main prongs to the human resource strategy: importing
employees and increasing the intake of immigrants from China.
viii
E. In the short term, a quick and effective way to increase the labour force is to
increase the intake of employees. In 1989, the government introduced a scheme
for importing employees which was subsequently expanded in 1990. The
scheme has met with limited success partly because of its complexity. Our
proposal is for a less discretionary and more efficient scheme that also expands
the number of intake. Based on the forecast of 1992 GDP growth of 5%, it is
estimated that 23,000 additional employees could be introduced into Hong Kong
during the year to maintain full employment while helping to alleviate the
current labour shortage. This number is over and above the intake provided
under the existing government scheme and would be on ongoing programme
with the annual intake adjusted to reflect the rate of growth in GDP.
F. We endorse the idea behind the existing practice of exempting specific
categories from quota restrictions, such as housemaids and highly skilled
technicians and professionals. However, we believe that salary remains the best
criterion. Therefore, in place of a skill criterion (except for the housemaids), we
propose a salary criterion that exempts employees earning a monthly salary of
$10,000 or above from quota restrictions.
G. It is proposed that employees imported under the quota system be subject to a
minimum salary requirement set at the current median income of $5,000 per
month. This amount would be inclusive of the cost borne by the employer in
providing accommodation and transportation from the sending country as in the

ix
existing government scheme.
H. Since quotas for importing foreign employees are a valuable resource best
allocated using a market mechanism, we propose to allocate the quotas through
tenders. Further, we propose that employers be assessed a levy of 10% of an
imported employee's minimum salary. The levy and the revenues from the
tenders are meant to help defray the cost of social services provided for the
newcomers. The government could also consider using such revenues for
programs to improve the welfare and benefits of local workers.
I. Another effective way to expand the labour force is to increase the intake of
legal immigrants from China. Legal immigration from China since 1984 has
been set at 75 immigrants a day. One notable feature of this scheme is that Hong
Kong has no control over whom to admit for residence. The selection process
has been strictly under China's discretion.
J. With the objective of maintaining full employment and economic growth, we
propose an additional daily quota for China of up to 75 immigrants per day. To
improve the skill levels of the intake, the Hong Kong government could consider
negotiating with China to gain some control over the composition of these
additional immigrants.
K. There are several variations on the scheme to expand the labour force via
importation of employees and immigration. In particular, we recommend two

x
for consideration. First, Hong Kong could borrow from the labour importation
experience of the Middle East, whereby migrant workers would stay only long
enough to finish specific projects. Such repatriation, usually part of the turnkey
arrangements monitored by the contractors, have freed the host countries from
the burden of permanent social costs imposed by foreign workers.
Consideration should also be given to having workers from China follow the
example of Mexican workers who commute daily across the border to their jobs
with U.S. companies.
VIII. Conclusions: High inflation threatens Hong Kong's economic success and has socially
divisive effects on income distribution.
While finding solutions to the inflation problem is an urgent task, there is no quick fix
for an ailment that is structural in nature. Indeed, piecemeal remedies that address the
symptom rather than the root cause of inflation are ineffective and could well be
damaging.
We have put forward three policy proposals that address the root cause of inflation and
are believed to be conducive to long-term price stability.
1. We urge the government to adopt long-term measures to ease the residential
property shortage and property inflation by making available more land for
housing development.

xi
2. With the PADS projects about to get into full swing in the current inflationary
environment, we urge the government to remain vigilant about fiscal discipline
and keep government growth in check. This can be achieved through increased
privatization and other measures aimed at improving efficiency and restraining
growth in expenditures.
3. We urge the government to adopt a human resource strategy to encourage
moderate growth of the labour force with the aim of maintaining full
employment and steady wage-growth while alleviating the current labour
shortage. Such a strategy would help ease inflation and promote balanced
economic growth by keeping the process of deindustrialization in check.
Moreover, by keeping the economy diversified, the human resource strategy
would also help alleviate the economy's vulnerability to sectoral shocks.
We are confident that the above measures, if adopted, would help bring down inflation
to a more acceptable level and provide the foundation for future economic growth.

Research Report
INFLATION IN HONG KONG: PATTERNS, CAUSES AND POLICIES
Richard Y.C. Wong, Liu Pak-Wai and Alan K.F. Siu
October 1991

Inflation in Hong Kong : Patterns, Causes and Policies
Richard Y.C. Wong, Liu Pak-Wai and Alan K.F. Siu
FOREWORD AND ACKNOWLEDGEMENT
High and accelerating inflation has become a major public concern in Hong Kong. A
proper understanding of the causes and consequences of the recent inflation spiral is essential to
devising sound policies for its cure. In this study we undertake such a research task. Our
findings show that the primary cause of inflation is structural and results from rapid economic
integration with South China. Since this process will continue the prospect of high inflation
will remain. We also consider other factors that contribute to inflation. We examine various
policy measures to help curb inflation based on our research findings.
Our research was conducted in the summer of 1991. In completing this report we
received valuable comments from and held numerous highly productive discussions with the
advisers, trustees and members of the Business and Professionals Federation of Hong Kong
(BPF). Their support is gratefully acknowledged. We also received many helpful comments
from various economists, especially Alan McLean, David Y.K. Wong and P.S. Tso.
Richard Y.C. Wong
Pak-Wai Liu
Alan K.F. Siu
October 1991

Inflation in Hong Kong : Patterns, Causes and Policies
Richard Y.C. Wong, Liu Pak-Wai and Alan K.F. Siu
INFLATION IN HONG KONG: PATTERNS, CAUSES AND POLICIES
Contents
Part 1: Introduction
Part 2: Patterns of Inflation
Part 3: Housing Market and Inflation
Part 4: Exchange Rate and Inflation
Part 5: Government Spending and Inflation
Part 6: Structural Transformation, Labour Market and Inflation
Part 7: Policy Proposals
Appendices
1: Inflation Decomposition
2: Inflation and the Housing Market
3: Imported Inflation
4: Inflation and Monetary Growth
5: Public Sector Wage Growth
6: Two-Sector Model on Economic Restructuring
7: Natural Rate of Unemployment
8: Inflation and Wage Growth
9: Unit Labour Cost
Authors

Inflation in Hong Kong : Patterns, Causes and Policies
Richard Y.C. Wong, Liu Pak-Wai and Alan K.F. Siu
PART I: INTRODUCTION
1.1 The current double digit-inflation in Hong Kong has been generally perceived as a major
public policy problem. The government has been widely criticized for failing to do anything
about it until very recently. When the government responded in haste at the end of May 1991 to
curb inflation, the policy measures that were adopted have been criticised as being ill-conceived
or inadequate.
1.2 Public discussions of the causes of the current inflation have generated a bewildering
array of explanations:
(1) a booming housing market,
(2) imported inflation due to the linked exchange rate system,
(3) fiscal stimulus due to rapid increases in government spending,
(4) labour shortage due to the slow growth of the labour force,
(5) structural transformation of the economy, and
(6) other ad hoc explanations.
1.3 Proposals to curb inflation include dampening housing market speculation, changing the
linked exchange rate system, controlling government spending, relaxing the constraints on
importing labour, promoting productivity growth, and various other ad hoc measures. Many of
these proposals are advanced with very little empirical analysis and are therefore inadequate as a
basis for policy decisions.
1.4 Starting in 1987 the economy of Hong Kong began to enter the longest period of
economic slowdown as measured by gross domestic product (GDP) growth. During this period,
inflation hit double-digit levels. What sets the current stagflation apart from previous ones in
Hong Kong is that the unemployment rate has been at a historically low level of 1-2% for most
of the period. On previous occasions in 1974-75 and in 1982 the unemployment rate was
2
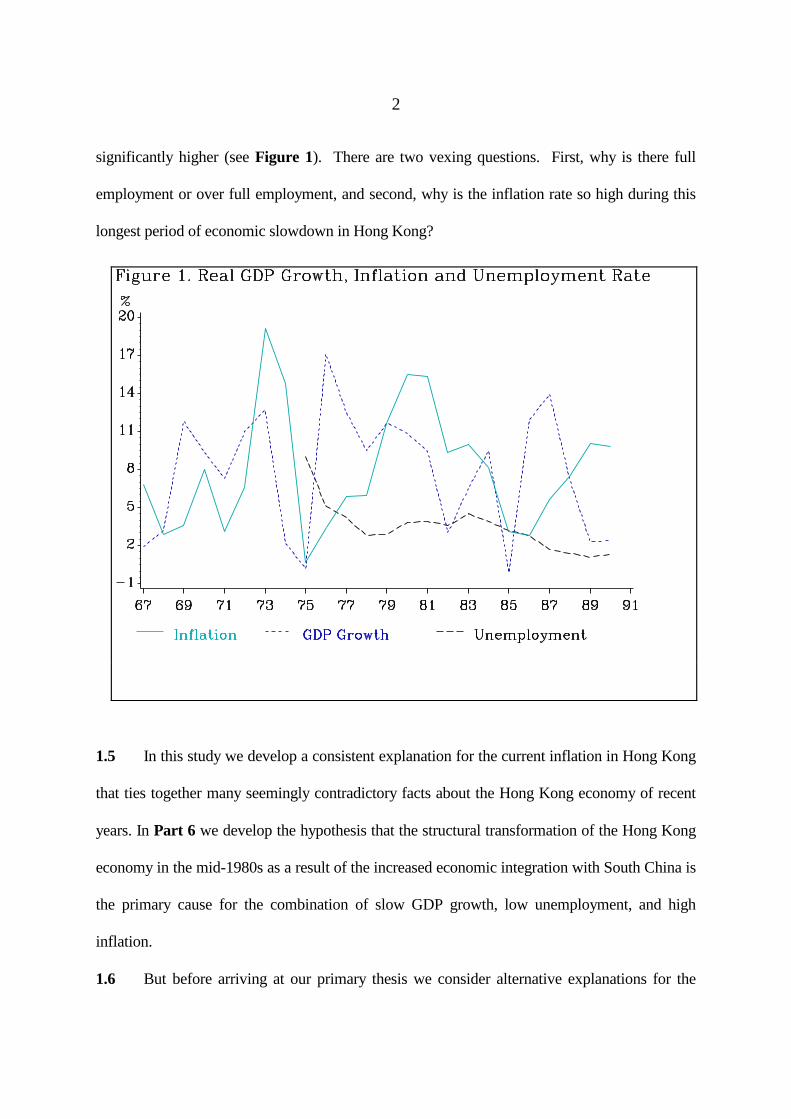
significantly higher (see Figure 1). There are two vexing questions. First, why is there full
employment or over full employment, and second, why is the inflation rate so high during this
longest period of economic slowdown in Hong Kong?
1.5 In this study we develop a consistent explanation for the current inflation in Hong Kong
that ties together many seemingly contradictory facts about the Hong Kong economy of recent
years. In Part 6 we develop the hypothesis that the structural transformation of the Hong Kong
economy in the mid-1980s as a result of the increased economic integration with South China is
the primary cause for the combination of slow GDP growth, low unemployment, and high
inflation.
1.6 But before arriving at our primary thesis we consider alternative explanations for the
3
causes of inflation. In Part 2 we study the pattern of inflation in Hong Kong with the aim of
identifying important sources of inflation. We discover that an external factor like imported
inflation cannot be the main source of accelerating inflation in Hong Kong. Among internal
factors, we found that tightness in the labour market can provide an explanation for accelerating
inflation.
1.7 In Part 3 we examine the connection between inflation and the housing market. The
rising housing market has been singled out as a major cause of inflation. The government has
been prodded to use various measures to clam down on property speculation as a means to curb
inflation. Our analysis suggests that rather than tackling the core of inflation, such measures
only deal with its symptoms. A cooling down of the property market will only bring immediate
relief to prospective homeowners, but will not significantly reduce inflation.
1.8 Conventional approaches to curbing inflation have emphasized monetary and fiscal
policies. The relevance of such tools for Hong Kong has to be examined. In Part 4 we
examine the effectiveness and implications of using the exchange rate as a specific policy
instrument to curb inflation. In Part 5 we examine the relationship between government
spending and inflation in Hong Kong. The fiscal role of the government in an inflationary and
full employment environment is explicitly considered.
1.9 Throughout the study we emphasize a comprehensive and careful examination of the
quantitative evidence. The specific circumstances of Hong Kong's recent history and future
evolution are explicitly considered in evaluating the effectiveness of various policies to curb
inflation. In particular, we also discuss the consequences for Hong Kong if inflation is left to
run its course. These policy issues are considered in Part 7.

4
PART 2: PATTERNS OF INFLATION
2.1 The recent inflation spiral in Hong Kong began in the latter half of the 1980s, rising
from about 3% in 1986 to the current 12% level. Figure 2 presents the inflation rate for the
period 1975-1991 as measured by the Consumer Price Index A (CPI(A)) and the Hang Seng
Consumer Price Index (HSCPI). While double-digit inflation is not new to Hong Kong, the
current episode is unusual because it occurs at a time when most of our important trading
partners in the industrialized countries are having much lower rates of inflation. This suggests
that the reason for our current inflation has more to do with internal factors than external ones.
2.2 A breakdown of the various components of the measured rates of inflation as measured
by the CPI(A) index for the period January to May 1991 is shown in Table 1. Details of the

5
calculations are given in Appendix 1. The inflation figures indicate that prices of meals bought
away from home, services, transport and housing rose faster than overall CPI(A) inflation. The
rise in the price of alcohol and tobacco is exaggerated due to the transitory effects induced by
higher duties imposed by the government at the beginning of the fiscal year.
Table 1: Decomposition of CPI(A), January-May 1991
___________________________________________________________
Component Weight Inflation Contribution
Rate % to Inflation %
Food 45.48 11.2 41.4
Purchased foods 24.54 7.6 14.9
Bought meals 20.94 14.3 26.5
Housing 15.31 13.4 15.2
Fuel & Light 3.41 11.6 2.3
Alcohol & Tobacco 2.57 49.1 11.0
Clothing & Footwear 5.24 7.8 3.3
Durable Goods 5.72 5.2 2.1
Services 9.64 14.1 12.1
Transport 6.79 15.2 8.7
Miscellaneous 5.84 7.9 3.6
Total 100.00 12.6 100.0
6
2.3 It is important to recognize at the outset that the decomposition of the measured rates of
inflation into their component parts should not be confused with an analysis of the underlying
cause of inflation. Although such a decomposition exercise can be useful in eliminating some
factors as causes of inflation, one should not be misled into believing that inflation can be
curbed by controlling individual prices or wages. In recent decades, country after country have
imposed price and wage controls. Such controls suppressed the symptoms of inflation for a year
or two, but then bottled up pressure broke through. Inflation rose to even higher levels, and
price and wage controls had to be abandoned.
2.4 A study of the pattern of price increase for the various components of inflation is simply
a first step towards understanding the underlying cause of inflation. One useful decomposition
is to see whether inflation is primarily generated internally or imported. One can separate those
components in the consumer price index which can be considered as tradeables and those which
are best treated as non-tradeables. Tradeables are goods and services which are exportable or
importable. Non-tradeables are those which have to be produced and consumed locally. Figure
3 shows that the price of non-tradeables has risen faster than tradeables since the mid-1980s
according to a decomposition using the HSCPI. A similar pattern is observed when the CPI(A)
is used.

7
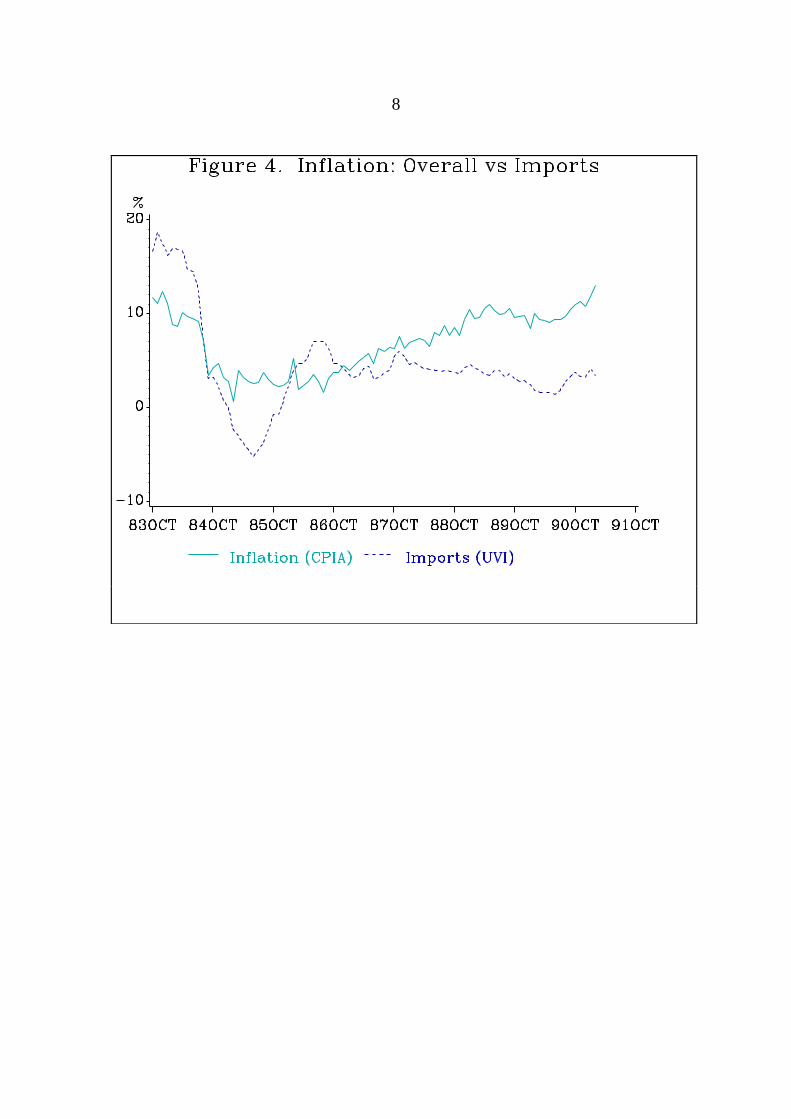
2.5 Since the mid-1980s, there is clear evidence that the rate of inflation of imported goods
has risen much more slowly than overall inflation. This can be observed from Figure 4.
Throughout this period the price of imported goods rose at an average rate of about 3.2% per
year. The impact on overall inflation would have to be even lower than this figure since imports
are only a part of total expenditure.
8

9
2.6 As an illustration of the relatively slow increase in the price of imported goods, let us
consider durable goods. The price of durable goods has been rising more slowly than the
overall inflation rate since the mid-1980s. Figure 5 shows that in 1989-91 the price of durable
goods has risen on average at 3.5% per year as compared to about 10.4% for the overall CPI(A).
It is well known that almost all durable goods consumed locally are imported. Imported
inflation can only explain a small fraction of the overall inflation rate. The recent surge in
inflation cannot be attributed primarily to external factors.

10
2.7 The greater importance of internal factors in determining the current inflation is
underscored by the inflation of food prices. A breakdown of the components of food prices
shows that the increase in the price of food is primarily due to surges in the price of meals taken
away from home, where a large component of the cost is attributable to rising costs of services,
rather than to imported foodstuffs. Figure 6 shows that in the last three years, beginning in
1988, prices for meals taken away from home have risen on average at 15.3% per year as
compared to 3.8% for imported foodstuffs.
2.8 The recent spectacular rise in property prices has often been singled out as a major cause
of inflation. But insofar as inflation is concerned the relevant measure is rent and not property

11
prices. The relationship between property prices and market rents are not straightforward either.
A further complication arises from the fact that a large proportion of the households in Hong
Kong live in public housing where rents are determined by the Housing Authority. Therefore,
the relationship between rents and overall inflation is not determined by market forces alone.
Rents in the public housing sector may be set with or without reference to market rents. An
analysis of the relationships among property prices, rents and inflation is presented in Part 3.
2.9 Another factor to be examined as a plausible explanation of the acceleration of the
overall inflation rate is a tight labour market. Figure 7 shows that the price of services has been
growing at a faster rate than overall inflation. The price of services are of course highly
dependent on the demand and supply conditions in the labour market. This piece of evidence
suggests that a tight labour market may be a relevant factor. The exact mechanism by which a
tight labour market can lead to accelerating inflation is much more complex and will be closely
examined in Part 6.

12
13
PART 3: HOUSING MARKET AND INFLATION
3.1 The increase in speculative activities in the private housing market following the
spectacular rise in property prices has focused public attention on the role of the housing market
in fuelling inflation. There is considerable misconception about this subject. One should first
of all recognize that property prices and rents are not the same thing and they do not necessarily
rise or fall together. Another useful distinction is between commercial and industrial premises
on the one hand and domestic premises on the other. A rise in the rents of domestic premises
affects the housing component in the consumer price indices whereas a rise in the rents of
commercial and industrial premises increases the cost of doing business and affects prices to the
extent that they are passed on as price increases. Growth rates in the rents of commercial and
industrial premises have declined since 1989 and even became negative for brief periods. They
cannot provide a substantive explanation for the acceleration of inflation in the last few years.
One can therefore focus exclusively on domestic premises.
3.2 Inflation of the housing component of the consumer price indices is measured in terms
of rents and not property prices. For renters of private domestic premises, the rent they pay is
often a reasonably good measure of the value of housing consumption that they obtain monthly.
It also represents their actual monthly outlays on housing. But for those who live in public
housing, the rent they pay may not reflect the value of the housing consumption they are
obtaining because it is subsidized by the government, although it still represents their actual
monthly outlays on housing as in the case of renters of private housing. When market rents rise
faster than public housing rents, tenants of public housing are getting an implicit gain, because
they are now able to rent the same housing unit at a relatively cheaper rate than their
counterparts in the private sector.
3.3 In contrast to renters, the most important part of the monthly expenditure on housing of

14
most homeowners is their mortgage payment. This is the relevant measure of their actual
monthly outlays on housing, but the value of the housing consumption they are obtaining is still
the implicit rental value of their unit. As property prices increase, mortgage payments will rise
for prospective homeowners because they will have to borrow more money in order to acquire a
property, but for those who are already homeowners there is no effect because their mortgage
payments remain the same, as long as the interest rate is unchanged. For existing homeowners,
rising market rents also result in an implicit gain because whereas their mortgage payments
remain the same, they are now able to obtain the same housing consumption without having to
pay the higher rent. What this discussion implies is that our existing consumer price indices,
which use actual rents for tenants and imputed rents for homeowners, are problematic measures
of the cost of living due to housing. They are more appropriate for renters than for
homeowners. The latter constitute about 43% of the households in Hong Kong at present.
3.4 To understand the implications of the above, it would be useful to work out who
benefits and who loses from rising rents and property prices. Since rents are used to measure
the value of housing consumption in the consumer price indices, they appear as a component of
our measures of inflation. Consider an increase in rents of private domestic premises without
any change in public housing rents. This will show up as a higher rate of measured CPI
inflation. The measured cost of living due to housing will appear to have risen for every
household, but in fact, it has only risen for tenants who live in private housing. Public housing
tenants and homeowners are not directly affected. From the point of view of the value of the
housing consumption that these other households are obtaining, they are actually reaping an
implicit benefit from rising rents. Given that public housing rents and mortgage payments have
not risen, these other households experience an increase of real income. By contrast, the effects
of an increase in property prices are quite different. Since property prices do not appear in the
15
construction of consumer price indices, therefore, the costs of living of all households are not
directly affected. However, all renters of private and public housing who aspire to become
prospective homeowners will find that it has now become more expensive if they want to
become one. One can think of them as being hurt in this sense.
3.5 Since there are now more homeowners than renters in the private housing market, using
market rents to measure the rise in the housing component of the cost of living significantly
overstates that rise. For homeowners rapid inflation and falling interest rates have in fact
significantly reduced the real cost of their mortgage payments whose values are denominated in
nominal terms. Therefore, their real income has been helped by rising inflation rather than
being hurt by it.
3.6 With the above comments in mind we now consider the inflation of housing prices as
measured in the CPI(A) index. Figure 8 shows that before 1991 the increase in housing rents
according to the CPI(A) has been less than the overall inflation rate. The proportion of
households covered by the CPI(A) who are living in public housing is likely to be large. This
evidence suggests that in the past few years the Housing Authority has increased public housing
rents at a lower rate than overall inflation, and might have only belatedly caught up with
inflation due perhaps to tight budgets. When one talks about high rents as a factor contributing
to accelerating inflation since 1987 one cannot be referring to public housing rent increases.
16

17
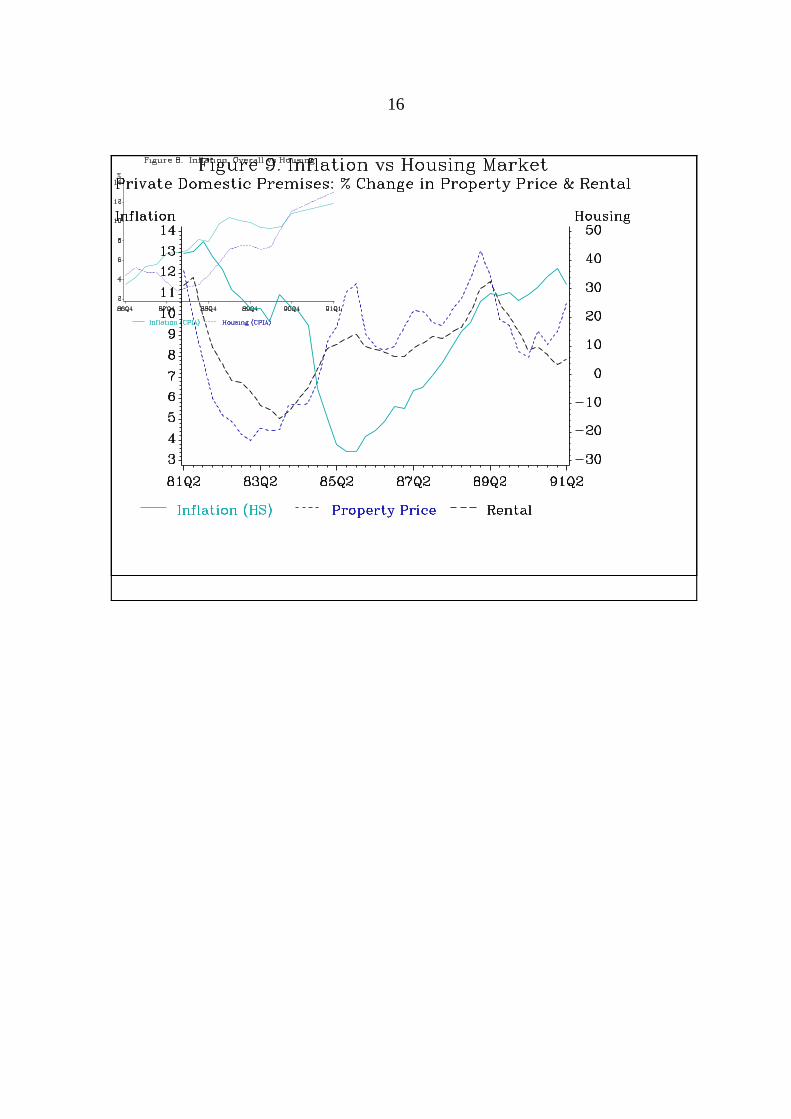
3.7 Next we consider the behaviour of rents for private domestic premises. In Figure 9 we
can see that over the period from 1981 to 1990, the profile of the inflation rate bears little
resemblance to either the rates of increase of transaction prices of property purchases or market
rents.1 The rates of increases of market rents and property prices declined significantly after
1989. However, the overall inflation rate continued to accelerate. More recently in the first two
quarters of 1991 property price inflation began to accelerate, but the rate of rent inflation
continued to fall and is considerably lower than the rate of CPI(A) or HSCPI inflation. Clearly
the acceleration of the overall inflation rate in the last two years cannot be attributed to rent
inflation in the market for private domestic premises.
3.8 Since the measured inflation rate is a weighted average of the rates of change of the
prices of the components contained in the index, a sum will always get larger when one of its
parts is bigger, while other parts remain unchanged. This is just a tautology. To say that
inflation is higher because rents are higher is trivially true. But does the causation really run
from rents to inflation?
3.9 From a theoretical point of view, rents are determined by the demand and supply of
rental units. On the demand side, the rent one is willing to pay for a commercial or industrial
premise depends on business conditions for the duration of the rental, and for a domestic
premise it depends on household income and family circumstances for the period of the rental.
One can hypothesize that an increase in rents may lead workers to demand higher wages to
1Note that in Figure 9 the rate of increase of transaction prices of property purchases
and market rents are often much higher than the rate of inflation of the housing
component of the consumer price indices (see Figure 8). This is because the prices in
Figure 9 represent new transactions, whereas those in Figure 8 are dominated by
households who are still paying rents set in an earlier period.
18
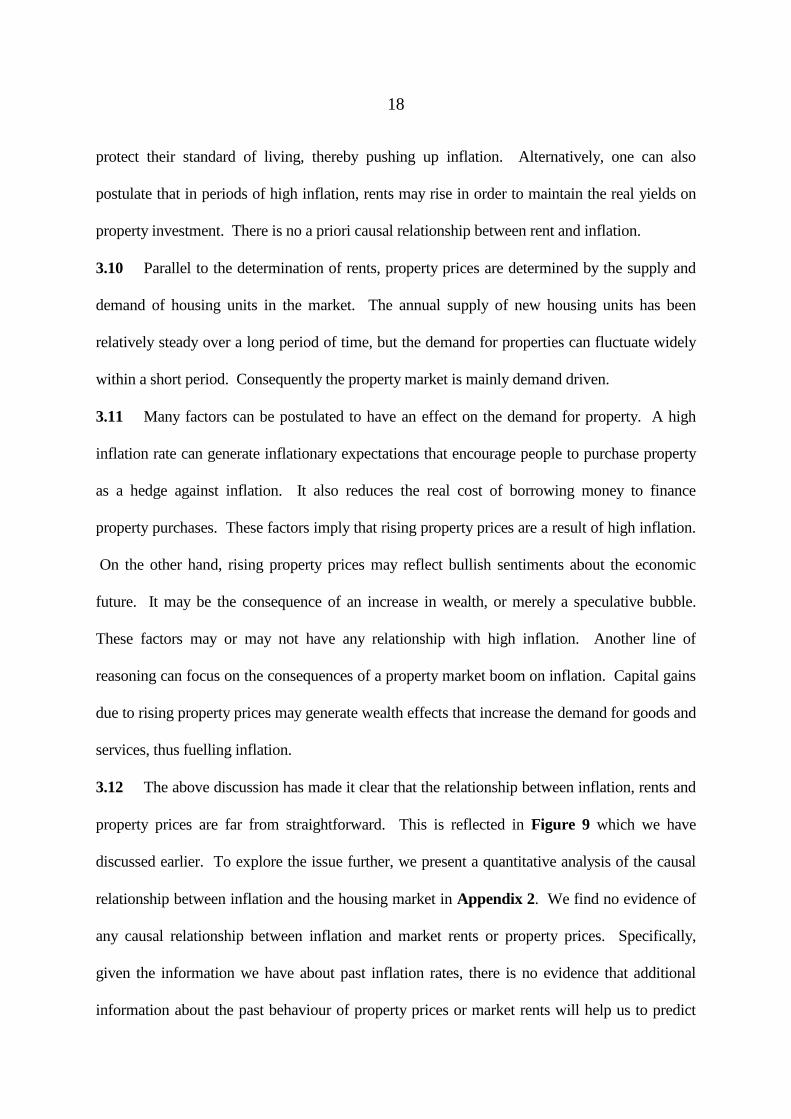
protect their standard of living, thereby pushing up inflation. Alternatively, one can also
postulate that in periods of high inflation, rents may rise in order to maintain the real yields on
property investment. There is no a priori causal relationship between rent and inflation.
3.10 Parallel to the determination of rents, property prices are determined by the supply and
demand of housing units in the market. The annual supply of new housing units has been
relatively steady over a long period of time, but the demand for properties can fluctuate widely
within a short period. Consequently the property market is mainly demand driven.
3.11 Many factors can be postulated to have an effect on the demand for property. A high
inflation rate can generate inflationary expectations that encourage people to purchase property
as a hedge against inflation. It also reduces the real cost of borrowing money to finance
property purchases. These factors imply that rising property prices are a result of high inflation.
On the other hand, rising property prices may reflect bullish sentiments about the economic
future. It may be the consequence of an increase in wealth, or merely a speculative bubble.
These factors may or may not have any relationship with high inflation. Another line of
reasoning can focus on the consequences of a property market boom on inflation. Capital gains
due to rising property prices may generate wealth effects that increase the demand for goods and
services, thus fuelling inflation.
3.12 The above discussion has made it clear that the relationship between inflation, rents and
property prices are far from straightforward. This is reflected in Figure 9 which we have
discussed earlier. To explore the issue further, we present a quantitative analysis of the causal
relationship between inflation and the housing market in Appendix 2. We find no evidence of
any causal relationship between inflation and market rents or property prices. Specifically,
given the information we have about past inflation rates, there is no evidence that additional
information about the past behaviour of property prices or market rents will help us to predict

19
future inflation rates. In other words, increases in property prices or market rents do not appear
to have an independent effect on inflation. In this sense, property price and market rent
increases do not cause inflation. Consequently attempts to dampen speculation in housing
markets or to cool down the housing market boom with an aim of slowing down inflation are
misguided.

20
PART 4: EXCHANGE RATE AND INFLATION
4.1 Since October 1983 the HK Dollar has been linked to the US Dollar. Some
commentators have asserted that this has contributed to the acceleration of the inflation rate.
Whether this is in fact the case depends on what alternative exchange rate arrangements we are
comparing the current situation with. Most commentators have not been very explicit about the
alternative.
4.2 One explicit recommendation is that the HK Dollar should be linked to a basket of
currencies rather than the US Dollar. Linking to a basket would not imply abandoning the main
feature of the linked rate system, which is to anchor the value of the HK Dollar to an external
standard, but would reduce the risk of having to endure the vicissitudes of externally induced
inflation through the link with the US Dollar. However, the anti-inflationary benefits of linking
to a basket of currencies would only exist if the value of the basket appreciated relative to the
US Dollar.
4.3 To examine whether linking the HK Dollar to a basket of currencies would result in less
inflation, we construct as an exercise two hypothetical baskets of currencies to study the effect
on inflation. The first basket contains 15 currencies of countries which are our major trading
partners. The second basket contains 4 major convertible currencies: US Dollar, Japanese Yen,
UK Sterling, and Deutsche Mark. Details of the construction of the currency baskets are given
in Appendix 3.
4.4 The first basket is composed of the 15 currencies which are used in the definition of the
effective exchange rate index of Hong Kong. The weight of each currency in the basket is its
average share of Hong Kong's imports in 1984-86. Figure 10 shows that the effect of linking to
such a basket would have led to an overall depreciation of the HK Dollar relative to the US
Dollar pegged rate over the entire period. This means that the rate of inflation of imports would

21
have increased rather than decreased under such a basket-based link. Clearly, a link to a 15
currency basket is an inferior alternative to the existing US Dollar link from the point of view of
curbing inflation.
4.5 The second basket is composed of 4 major convertible currencies. Such a basket is
probably a more practical one than the previous 15 currency basket which includes the non-
convertible Renminbi. The shares of the currencies in the basket are US Dollar 50%, Japanese
Yen 30%, UK Sterling 10%, and Deutsche Mark 10%. These weights reflect the approximate
shares of their total trade value with Hong Kong. Figure 11 shows that under a 4 currency
basket the HK Dollar would have appreciated approximately by 1.6% a year relative to the

22
current US Dollar linked rate.
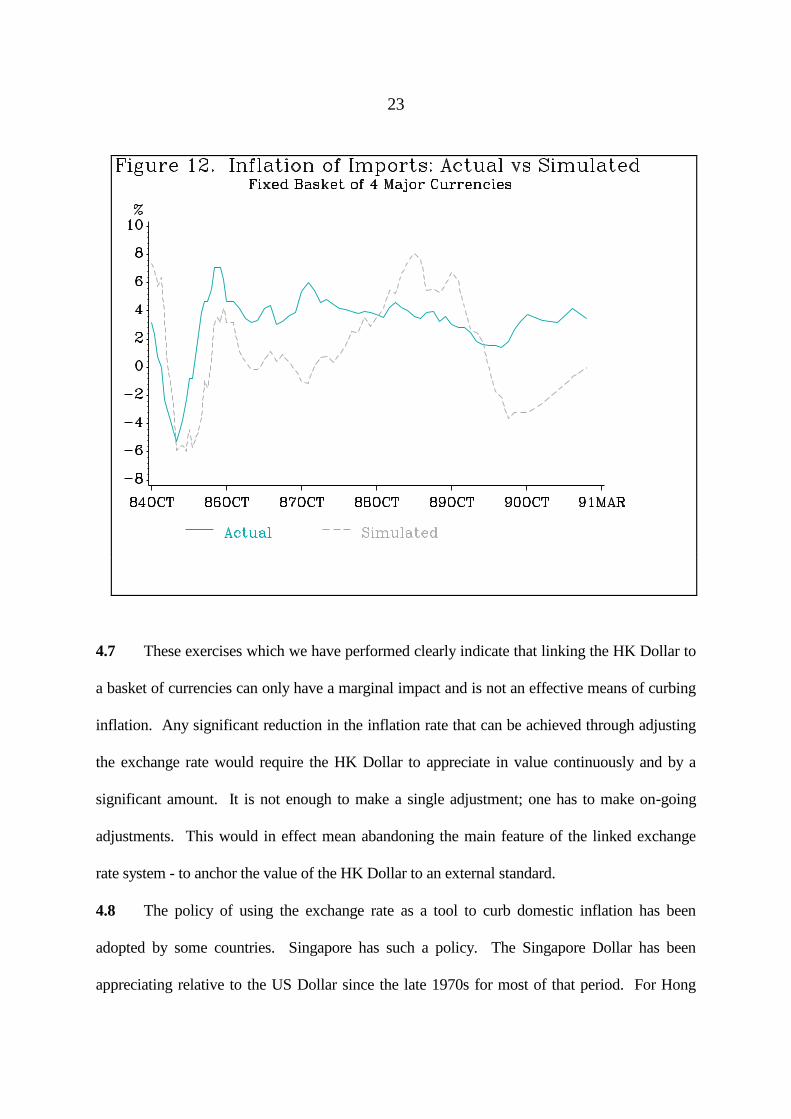
4.6 To see more clearly the effect of linking the HK Dollar to the second basket of
currencies on the rate of inflation of imports, we compare the actual rate with a simulated rate.
Details of the simulation are also given in Appendix 3. Figure 12 shows that the rate of
inflation of imports would have increased on average by 1.4% per year over the entire period of
the linked rate, which is only somewhat lower than the 3.2% figure under the US Dollar link.
23
4.7 These exercises which we have performed clearly indicate that linking the HK Dollar to
a basket of currencies can only have a marginal impact and is not an effective means of curbing
inflation. Any significant reduction in the inflation rate that can be achieved through adjusting
the exchange rate would require the HK Dollar to appreciate in value continuously and by a
significant amount. It is not enough to make a single adjustment; one has to make on-going
adjustments. This would in effect mean abandoning the main feature of the linked exchange
rate system - to anchor the value of the HK Dollar to an external standard.
4.8 The policy of using the exchange rate as a tool to curb domestic inflation has been
adopted by some countries. Singapore has such a policy. The Singapore Dollar has been
appreciating relative to the US Dollar since the late 1970s for most of that period. For Hong

24
Kong to adopt such a policy, there have to be fundamental and radical changes to the existing
monetary arrangement. The desirability of so doing involves considerations that go far beyond
the question of curbing inflation alone. These issues will be taken up in Part 7.
4.9 Before leaving the topic of the linked exchange rate we will examine another claim that
attributes the cause of inflation to monetary expansion. The well known dictum by Milton
Friedman that inflation is everywhere and always a monetary phenomenon implies that inflation
can only occur if money supply also increases. If money supply is effectively controlled, then
inflation cannot rise. This popular proposition has led some commentators to argue that
inflation in Hong Kong is due to excessive growth of money supply.
4.10 The above argument is invalid when applied to Hong Kong because it fails to realize
that Friedman's dictum is meant to apply to economies with a monetary system in which the
government has control over the money supply. In Hong Kong, by virtue of the linked
exchange rate system, money supply is determined by market forces and is not controlled by the
government. As a consequence, monetary growth and inflation do not have the kind of
relationship often found in the U.S. or Japan. In Appendix 4 we show that empirically there is
no evidence of any causal relationship between inflation and monetary growth. Specifically,
expansion in money supply does not seem to cause inflation in Hong Kong.
4.11 On both theoretical and empirical grounds, the logic and the evidence are consistent
with the hypothesis that inflationary pressure generated by domestic factors is simply being
accommodated by monetary growth through international capital inflows. In other words,
domestically generated inflation is merely being validated by running surpluses in the
international balance of payments. One should point out that for a small open economy under a
fixed exchange rate system, where capital is internationally mobile, as in the case of Hong
Kong, money supply is simply not determined by the government. Consequently, government

25
policies on the monetary side, such as, manipulating the domestic interest rate, cannot be an
effective tool to curb inflation.

26
PART 5: GOVERNMENT SPENDING AND INFLATION
5.1 Conventional economic wisdom has recognised that government spending contributes to
inflation when resources are already fully employed and utilized. Commentators have
justifiably criticised the rapid increases in government spending in Hong Kong, which has been
growing significantly faster than the rate of growth of GDP. The rapid growth of government
spending at the present moment will fuel inflation precisely because of the very tight conditions
in the labour market.
5.2 A close examination of the evidence shows that over the last 25 years increases in
government spending as a share of GDP have systematically lagged behind increases in the
inflation rate. Figure 13 bears out the relationship very clearly. A similar result is obtained in
Figure 14, where we examine the relationship between the inflation rate and government capital
spending as a share of GDP. The reason is quite simple. On the whole, increases in the
inflation rate tend to increase government revenue and this makes it easier for the government to
increase its spending in the subsequent year. It is not government spending that starts inflation,
but once inflation gathers momentum government fiscal discipline breaks down. Evidence of
this can be found in the last two inflation cycles in the early 1970s and the early 1980s. On both
occasions the government spending rose faster than GDP growth so that spending as a share of
GDP grew. In failing to restrain spending, the government is still responsible for adding fuel to
the inflation process.

27
Note: Figures for 1991 onwards are based on government projections.
5.3 In the present inflation cycle, this pattern is repeated. Since 1989 the rise in the share of
government spending has been rapid. It now represents some 19% of GDP. According to
government projections the figure is expected to be at the 20% level in the next few years (see
Figure 13). Such a level is unprecedented by historical standards. The previous high was
reached in the recession year 1982, when there was still some slack in the labour market. In that
year, public sector employment was 6.6% of the total labour force. Given that government jobs
are less subject to the vicissitudes of the economy, this should be considered a high benchmark
figure. Yet, in 1989 when the economy began to make another downturn, public sector
employment was 7.2% of the labour force. Civil service employment has risen faster than

28
labour force growth, thereby putting increasing pressure on the labour market. The current
labour market situation is unusually tight and as the world recession is nearing its end, the
pressure on the labour market is likely to increase further. So unless the government makes a
deliberate effort to exercise fiscal discipline, inflation will be further worsened. Given that the
government now appropriates some 19% of the resources in an unusually tight labour market
situation, restraining government spending under such circumstances will help to moderate
inflation.
5.4 The effect of the Port and Airport Development Strategy (PADS) project is likely to
further fuel inflation because it will add to the total demand for domestic resources, which are
already more than fully employed at this point. The PADS project will crowd out other
spending in both the government and the private sector. But such crowding out effects will be
less than dollar for dollar so that the total demand on domestic resources will rise.
5.5 An examination of government spending patterns reveal that for every dollar the
government spent on developing the Mass Transit Railway in the 1970s and 1980s, it only
displaced or crowded out approximately fifty cents of government spending on other uses. In
other words, total government spending increased as a result of the development of the Mass
Transit Railway thus raising the public demand for resources. There is no reason to believe that
the PADS project will be an exception since the demand for government spending in many
areas is likely to grow in the future. It is difficult to estimate the displacement or crowding out
effect in the private sector because of a paucity of available data. But one would expect that a
project of the scale of PADS will have considerable spillover effects and will in general
stimulate investments in many areas so that the total demand for domestic resources will be
increased.
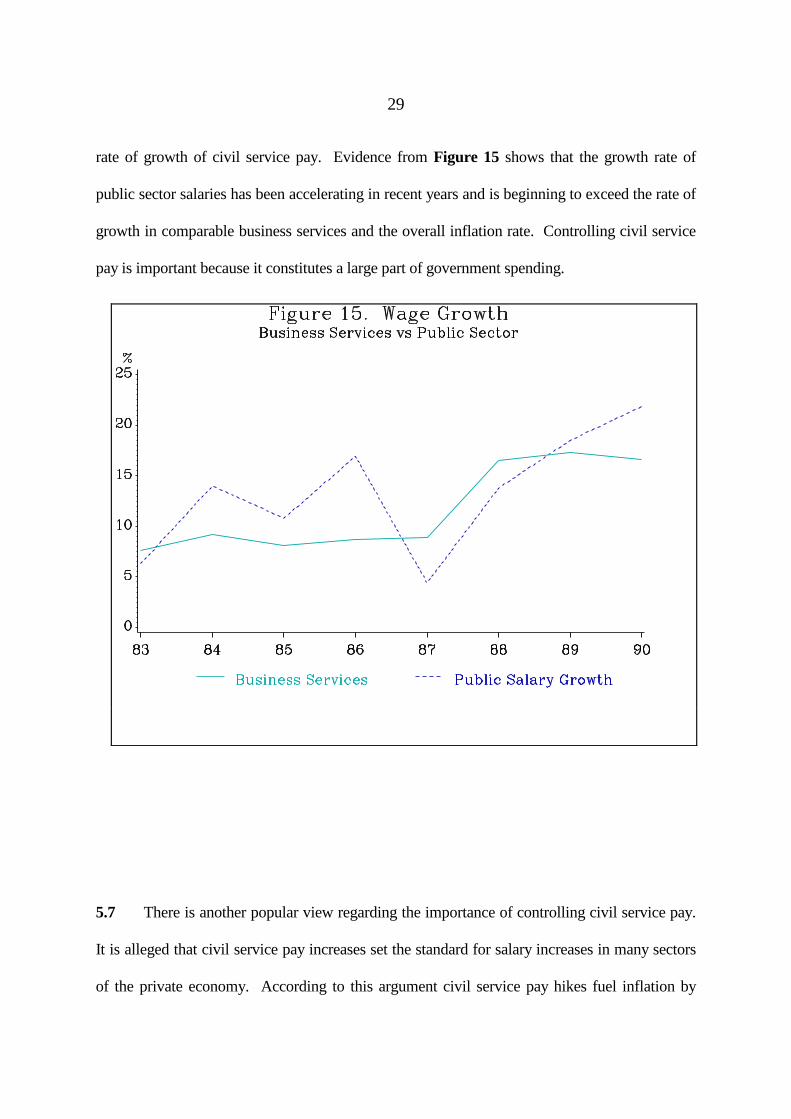
5.6 Part of the reason for the growth of government spending in recent years has been the
29
rate of growth of civil service pay. Evidence from Figure 15 shows that the growth rate of
public sector salaries has been accelerating in recent years and is beginning to exceed the rate of
growth in comparable business services and the overall inflation rate. Controlling civil service
pay is important because it constitutes a large part of government spending.
5.7 There is another popular view regarding the importance of controlling civil service pay.
It is alleged that civil service pay increases set the standard for salary increases in many sectors
of the private economy. According to this argument civil service pay hikes fuel inflation by
30
stimulating a round of wage increases in the private sector. Such a proposition does not square
with economic reasoning. Although in the short run there may be an attempt by the private
sector to match government pay increases in order to retain staff, there is no reason to believe
that profit-maximizing employers are willing to pay wages above productivity in the long run.
A test for causality shows that public sector wage growth does not lead to wage growth for all
employees, and vice versa. In other words there is no evidence for any causal relationship
between the two. Details of the calculations are given in Appendix 5. Civil service pay hikes
contribute to inflation because it results in more spending, but not because it stimulates pay
increases in the private sector.
5.8 To summarise, under the present tight labour market conditions, it is reasonable to
expect that increases in government spending will fuel inflation. The evidence that government
spending has been accelerating in recent years and may well continue into the future is a good
cause for alarm. Although the current inflation started before the growth of government
spending, the government cannot be acquitted of the charge of having failed to exercise fiscal
restraint in an over full employment economy thereby contributing to higher inflation.
31
PART 6: STRUCTURAL TRANSFORMATION, LABOUR MARKET
AND INFLATION
6.1 The acceleration of inflation since the mid-1980s is the result of rapid economic
transformation which took place within the context of a very tight labour market. A detailed
economic model on which our analysis is based is developed in Appendix 6.
6.2 The economic transformation that took place in Hong Kong resulted in a rapid shift of
workers from the manufacturing to the service sectors. Figure 16 shows that the proportion of
manufacturing workers fell continuously from 41.7% of the labour force in 1980 to 27.4% in
1990. To understand how the structural adjustment process worked to generate inflation, it is
useful to think of the economy as producing two types of products: traded and non-traded.

32
Manufactured products in Hong Kong are usually traded. Services include both traded and
nontraded products. Services as a whole are therefore less tradeable when compared to
manufactured products.
6.3 Even though structural change in Hong Kong has been going on since the mid-1970s,
the process was significantly accelerated by the rapid economic integration of Hong Kong and
South China. The opening of China precipitated a massive transfer of low-end manufacturing
processes and plants into South China. The manufacturing processes that remained in Hong
Kong concentrate on producing high value added products. The end result for Hong Kong is
that large productivity increases were obtained in manufacturing. According to a study
conducted by Yun-Wing Sung, the growth rate of Hong Kong's manufacturing labour
productivity has exceeded that of all the other new industrialized economies of South Korea,
Taiwan and Singapore since 1985.2
6.4 On the supply side, the cost of producing non-tradeables, or specifically services, has
increased due to the emigration of skilled personnel overseas in recent years. The emigration
outflow began to accelerate in the mid-1980s. By 1986 the number of emigrants have jumped
to 45,000 a year from a base of about 20,000 in 1980. Emigration hit the service sectors
hardest. Table 2 shows that a disproportionately large number of the employees who have
emigrated were from the service sectors. This contrasts sharply with the experience in the
manufacturing sector. Experienced and skilled personnel who emigrated had to be replaced by
junior staff with less experience. As a result, labour productivity growth in the service sectors
was slowed down more than in the manufacturing sector. Figure 17 shows that labour
2Sung, Yun-Wing (1991), "Competitiveness of Hong Kong Manufacturing versus its
Major Competitors", Department of Economics, The Chinese University of Hong Kong,
July 1991.
33
productivity has been growing faster in the manufacturing sector than in the service sector.
Table 2: Occupation of Emigrant Employees 1988
______________________________________________
Professional 33.6%
Administrator/Manager 16.2%
Clerical 13.4%
Sales 13.1%
Services 10.6%
Production 9.0%
Others 4.0%
_______________________________________________
Source: Census & Statistics Department, and Consulates/High
Commissions.

34
6.5 The opening of China also created enormous new opportunities for foreign direct
investments, especially in export-oriented industries. Manufacturing firms in Hong Kong began
to increase their investments rapidly in South China after 1985. It has been reported that Hong
Kong manufacturing firms currently employ an estimated 3 million workers in South China as
compared with 0.68 million in Hong Kong. The expansion of manufacturing activities
generated an enormous demand for services in Hong Kong that support and complement those
manufacturing activities, such as, trading, merchandising, design, advertising, transportation,
banking, insurance, financial services, and others.
6.6 The outward expansion of manufacturing activities into South China led to a growth in
income from foreign sources for Hong Kong that is not recorded in GDP figures. This increase

35
in wealth boosted the demand for consumption. While tradeables can be imported,
consumption of non-tradeables have to be met by increased production at home. This accounts
for the more rapid price increases of non-tradeables.
6.7 A slow growing labour force coupled with rapid growth in demand resulted in a tight
labour market. Figure 18 shows that since 1986 the growth rate of the labour force has been
declining. The tightness of the labour market is clearly demonstrated by the changing pattern of
vacancy rates and unemployment rates during this period as presented in Figure 19. Beginning
in 1986 the vacancy rate began to overtake the unemployment rate and the gap continued to
grow until mid-1989. Since then the gap has stabilized because of the slow down in the rate of
growth of the economy.
36
6.8 It is important to recognise that in a full employment economy there will still be some
amount of measured unemployment. The unemployed are people who are in between jobs or
who are new entrants into the labour force. They are not presently holding a job because they
are still in the process of searching for a suitable match. Job matching is a consequence of
imperfect information in the labour market. Therefore, full employment in economics does not
imply that there is no measured unemployment. It refers to that level of employment at which
the number of vacancies is equal to the number of unemployed so that theoretically there is a
vacancy for everyone looking for a job. In other words, at full employment the unemployment
rate is equal to the vacancy rate. The unemployment rate that prevails when the economy is at
full employment is known as the natural rate of unemployment. One can think of the vacancy
rate when the economy is fully employed as the natural vacancy rate. These concepts are
developed in Appendix 7, where we also show how one can estimate the natural vacancy rate
and the natural unemployment rate from the measured rates.

37
6.9 Since 1986, the measured vacancy rate has exceeded the measured unemployment rate
implying that there is over full employment. This gap reflects the tightness of the labour market
and causes wages to rise, which in turn leads to increases in the price level. Figure 20 shows
that wages and prices began to accelerate in 1986. Throughout much of the period wage growth
has exceeded price increases implying that there has been real wage growth. Sceptics can argue
that it may not be wage increases that cause prices to increase, but that the process works the
other way round. In other words they argue that wages are merely trying to catch up with
inflation. To determine in which direction the causation works we performed a causality test of
the relationship between wage growth and price inflation. The results are discussed in detail in
Appendix 8, which shows that inflation does not lead to wage growth, rather it is wage growth
that leads to inflation. The proposition that the tight labour market leads to wage growth which

38
in turn generates price inflation is supported by the data.
6.10 The tightness was much more severe in the service sectors than in the manufacturing
sector. The enormous growth in the demand for services that derived from the massive amounts
of Hong Kong investments in South China more than offset the labour released by the transfer
of manufacturing processes into China.
The relative tightness of the labour market is reflected in Figures 21 and 22, which show that
unemployment and underemployment rates were somewhat higher in the manufacturing sector
than in the other sectors, with the exception of the construction industry whose employment
conditions are necessarily more volatile. This results in a slower growth in nominal wages in
the manufacturing sector than in other sectors since 1986 as shown in Figure 23.
6.11 The net effect of slower labour productivity increase but faster nominal wage growth in

39
the service sectors than in the manufacturing sector is that production costs were pushed up
faster in the former than in the latter. Figure 24 shows that the index of unit labour cost in the
manufacturing sector has been the lowest among all sectors since 1986. The unit labour cost
measures the current labour cost in producing one unit of output. A discussion of the
relationship between the unit labour cost, nominal wage and labour productivity and their
measurement is given in Appendix 9.
6.12 Given Hong Kong's linked exchange rate system, the prices of traded products are
determined in world markets; their rates of inflation have to follow international levels. The
prices of non-traded products are determined domestically; their rates of inflation depend on the
excess of demand over supply. This explains why the domestic rate of inflation has been higher
than international levels since 1986. The rapid transformation of the economy that took place
within the context of a slow growing labour force and the linked exchange rate combined to
40
generate an accelerating inflation.
6.13 The inflationary pressure in the product market is also reflected in the input markets.
Capital which is internationally mobile is less subjected to inflationary pressure from economic
restructuring. Residential land is a relatively non-traded resource. Hence its value rises
significantly. Land used for commercial and industrial purposes is indirectly traded because
firms and industries can be relocated over time. The value of such land is therefore less
subjected to inflationary pressure. The current stagnation in the price of office space and
industrial premises contrasts sharply with steep price hikes of residential premises.
6.14 Labour which is not highly mobile internationally is also a relatively non-traded resource
and its value rises in the short run. If wages continue to rise as a result of economic
restructuring, some of the existing firms and industries will become less competitive and will
eventually be relocated elsewhere. In the long run, real wages are determined by labour
productivity and not by the scarcity of labour. The persistent rise in wages since 1986 is a sign
of a continual process of economic restructuring that is still in progress and shows little signs of
abating.
6.15 The analysis presented in this part offers an explanation for a wide array of phenomena
in Hong Kong. First, we have an explanation for high inflation caused by rapid structural
transformation of the Hong Kong economy that created a continuous excess demand for non-
tradeables. Second, the opening of China generated an enormous boom in economic activity in
Hong Kong, especially in the service sectors. The rapid growth in demand for labour ran
against a slow growing labour force, leading to a situation of over full employment. Third, the
slow growing labour force and full employment imposed capacity constraints on the economy.
This is consistent with the observation of slow GDP growth. Fourth, the increase in wealth that
accrued to Hong Kong from investments in China explains why despite slow GDP growth, asset

41
prices in Hong Kong have risen faster than inflation. Fifth, in a full employment economy,
excess demand for non-tradeables imply that there is an excess supply of tradeables which
means that the value of exports is greater than that of imports. This is consistent with the
observation that the real value of merchandise trade began to have surplus balances after 1985; a
phenomenon that is in sharp contrast with the characteristic deficit balance that is typical of
Hong Kong's trade position throughout the post-war period.

42
PART 7: POLICY PROPOSALS
Adjustment of Economy
7.1 In the previous analysis it has been argued that while there are many contributing factors
to the current inflation in Hong Kong, the main cause is rapid economic restructuring and
expansion in outward processing proceeding within the context of a tight labour market. The
opening up of China since 1989 creates enormous profitable opportunities for businesses in
Hong Kong, as it offers an almost unlimited supply of cheap resources. Outward processing
and servicing our hinterland in South China expand as Hong Kong entrepreneurs take advantage
of these opportunities. The economy of Hong Kong as a whole benefits from the profits and
employment opportunities generated by these activities. These economic activities in South
China have been a major impetus to the economic growth of Hong Kong in recent years.
7.2 Economic integration exposes the economy of Hong Kong to greater risks as our
interdependence with South China increases. This is the downside of investing heavily in a very
profitable relationship and not diversifying. But by and large, outward expansion and the
economic transformation that proceeds in tandem should be taken as a positive development for
the Hong Kong economy as a whole. Inflation should therefore be viewed in the proper
perspective as a problem that arises from a positive development. This, of course, does not
mean that the government should not take any policy action against inflation. It does mean,
however, that any policy action taken should be confined to dealing with inflation, but should
not reverse the development that is beneficial to the economy.
7.3 What will be the likely outcome if the economy adjusts under high inflation? At present
the economy is growing at capacity level and yet the growth rate is very low. Given this
constraint on capacity, any further stimulation of aggregate demand, notably by the PADS
projects, will translate more into price increases than real output growth. With excess demand

43
in the labour market and nominal wages rising faster than labour productivity growth, the unit
labour cost of firms operating in Hong Kong are escalating. Accelerating inflation also
increases the uncertainty of doing business. Since capital is internationally mobile, firms which
cannot bear the high labour costs will move their operations overseas. There will be further
expansion of manufacturing outward processing into South China. Not only will production
facilities move out of Hong Kong, backroom services of firms will also be relocated, a process
which has already begun.
7.4 The adjustment process continues as long as restructuring goes on. This process is
likely to be fairly drawn out given the enormous opportunities for outward expansion into South
China. Only high value added services and production that service the local economy and
therefore cannot be relocated will remain in Hong Kong. The manufacturing sector will
dwindle further. The economy will become even more oriented towards servicing our
hinterland in South China, thereby exposing it more to the risks of political upheavals in China.
At the same time, new inflow of capital from overseas that is not related to servicing our
hinterland will be discouraged by the high labour costs. Eventually the growth in demand for
labour will slow down until it falls in line with the labour supply. Nominal wage growth will
moderate and inflation cools off. Constrained by the stagnant growth in the labour force the
economy could settle into a prolonged period of slower growth as we have begun to experience
since 1989.
Distributional Impact of Inflation
7.5 Perhaps the most severe macroeconomic consequences of persistent inflation is the
distributional impact on the welfare of different types of workers. In the past few years,
especially in 1987-89, because of labour shortage there had been substantial increases in real
wages in some sectors of the economy, notably construction, finance and community and
44
personal services. Workers in these service sectors enjoyed substantial real wage increases as a
scarcity rent. They are in a relatively better position to cope with double-digit inflation. By
contrast, manufacturing workers, in indirect competition with low wage workers across the
border in South China, experienced only modest growth in real wages. The manufacturing
work force in Hong Kong has been aging; the largest proportion of them are in their 30s and
40s. These middle-aged manufacturing workers cannot take advantage of employment
opportunities in the tight labour market of the better paid service sectors because of skill
mismatch. They are the most hurt by inflation. The distributional impact among workers in
different sectors of a restructuring economy is uneven.
7.6 Look at another division in society, the poor and the wealthy. Inflation redistributes
wealth and those who fail to hedge will lose out in an inflationary environment. Low income
workers will be hurt by inflation even if their nominal wages manage to increase faster than
inflation because the purchasing power of the little amount of wealth they possess will be
eroded by inflation. Take the hypothetical case of an old worker who is close to retirement and
who has accumulated a life-time savings of $150,000 after decades of hard work. Last year he
earned $60,000, spent $54,000 of that income and saved $6,000. This year prices increase by
12% but his annual salary manages to grow faster than the inflation rate at 15% to $69,000.
Therefore, he is better off in terms of the purchasing power of his take-home pay. Because of
inflation, buying the same basket of goods as last year now requires $60,480, leaving a flow of
nominal savings of $8,520 which adds to his life-time savings. However, the worker is unable
to hedge against inflation with his small sum of life-time savings of $150,000 which he placed
as fixed HK Dollar deposit in the bank at an interest rate of 5% at the end of last year. By the
end of this year he will have $157,500 plus $8,520 in the balance of his deposit account. At an
inflation rate of 12%, his current real savings in last year's dollar are only 148,232, representing

45
a loss of purchasing power of $1,768. At this rate of reduction the purchasing power of the
worker's life-time savings gets eroded rather rapidly. If inflation is allowed to run its course as
the adjustment of the economy is drawn out, the worker will go into retirement and his situation
will become more dire because he will have no flow of income. His life-time savings will get
eroded even faster. An alternative for the worker is to deposit the amount into foreign currency
deposit accounts which yield a higher interest rate. This will slow down the erosion but will
subject his life-time savings to exchange rate risks. Elderly low income workers simply have
little resources and means to diversify their asset portfolios.
7.7 For low income workers who cannot hedge against inflation, the good fortune of wages
rising faster than inflation because of labour shortage is an illusion even in the short run. By
contrast, rich people are less affected by inflation and may benefit from inflation because they
can always hedge, say by holding real estate, and diversify. Inflation is a regressive tax. It is a
poor man's tax because it hits the low income workers the hardest and especially the elderly.
7.8 To conclude, the distributional impact of perennial inflation falls disproportionately on
low income earners and those with fixed income. Inflation could be divisive to society. Even
though economic adjustment to restructuring is inevitable, there is a strong argument for the
government to at least adopt policies that will dampen inflation so as to soften the distributional
impact on those who are least able to bear it.
Structural Solution to a Structural Problem
7.9 Since the main cause of inflation in Hong Kong is structural, the ultimate solution to the
problem is a structural one, and that means halting or even reversing the trend of outward
processing in South China. In that event the restructuring of the economy towards services will
slow down considerably as there will then be less demand for servicing the relocated
manufacturing activities in South China. This should slow down the inflation generation
46
process outlined in Part 6.
7.10 In a free and open economy like Hong Kong, the government cannot reverse the trend of
outward expansion and restructuring by policies, nor, as we have argued, should it do so even if
it had the means. Therefore, the government is left in an unenviable position of having no
effective policy tool that will get at the core of inflation because it is structural in origin.
However, developments outside the control of Hong Kong can achieve the result of significantly
reducing inflation which the government cannot achieve with the policy instruments it has at
hand. If China's Most Favoured Nation (MFN) status is revoked by the U.S. or if disruptive
political upheavals break out in China, further relocation of manufacturing into South China
will be deterred. Indeed foreign capital may even pull out of China. That should halt the trend
of restructuring and the inflationary process. At the same time, however, the economy of Hong
Kong will be dealt a heavy blow.
7.11 Though there is no feasible policy that can get at the core of inflation, some alleviation
of the current situation of double-digit inflation should be possible. With a properly chosen set
of policies the government should be able to bring inflation down to perhaps the high single-
digit level. This is nevertheless desirable and important as it will arrest the acceleration of
inflation, break the inflationary expectation and soften the distributional impact on people's
welfare. Even here the menu of policy choices is rather limited and none of it will be palatable
to everyone. In what follows we examine a range of options to try to decide on a set of
appropriate policies that can bring some relief to the current situation.
Monetary and Fiscal Policies
7.12 The conventional prescription of anti-inflationary measures is for the government to
adopt tight monetary and fiscal policies to restrain aggregate demand. However, within the
unique context of Hong Kong, the effectiveness of these measures is limited.

47
7.13 On the monetary side, available policy instruments are limited because of the linked
exchange rate arrangement. This is exemplified by the ill-conceived action by the government
of asking the Association of Banks to raise interest rate by 1% in May 1991 as a means to
deflate inflationary expectation, only to find that under the linked exchange rate, local interest
rate cannot deviate too much from the U.S. interest rate for too long. The local interest rate was
lowered one month later. This episode confirms the theoretical reasoning that under the present
exchange rate arrangement the government is incapable of fighting inflation using monetary
instruments.
7.14 On the fiscal side, the government has more leeway for manoeuvring. Reducing the
tobacco duty has a one-off effect (just like the increase in tobacco duty) and will cause a minor
dent on measured inflation. Government restraint in raising charges for its services and public
housing rents will help to slow measured inflation but the impact will probably not be
significant enough to lower inflation to below double-digit level. Furthermore with wage
increases pushing up costs, there is a limit as to how long the government can freeze these
charges. Experience from numerous countries has shown that price and wage controls can at
best suppress the symptoms of inflation for a year or two. Eventually bottled up pressure will
break through and inflation will rise to even higher levels.
7.15 Restraint in government overall spending, however, may have a larger impact on
inflation. Afterall government spending now represents 19% of GDP. This percentage could
get higher when the PADS projects get into full swing.
7.16 With resources being increasingly taken up by the government and the economy
growing at close to capacity, it will be difficult to contain inflation. There are two ways to
relieve the situation. The first way is to provide relief on the demand side. The government
will have to apply strict fiscal discipline by tightening other spending to make room for PADS.
48
This will contain the rise in the share of government spending. Efficiency gains that may be
obtained from privatisation of some government services will also relieve the pressure on
resources. Fiscal restraint will probably be the most significant fiscal policy which the
government can adopt to fight inflation. The impact will be to slow the momentum of inflation.
Given the structural cause of inflation, this measure alone will probably not be sufficient to
suppress inflation much below the double-digit level.
7.17 The second way to relieve the resource constraint on the economy is to increase the
supply of resources, notably land and human resources. These issues will be explored in detail
later.
Exchange Rate Policy
7.18 Besides monetary and fiscal policies, another approach that will cool off aggregate
demand is to tamper with the current arrangement of the linked exchange rate and manage a
continuous appreciation of the HK Dollar over time. We have established earlier that linking
the HK Dollar to a basket of currencies cannot effectively curb inflationary pressure generated
by rapid economic restructuring in a tight labour market. One has to appreciate the HK Dollar
on a continuing basis. It is important to recognise that a once and for all appreciation of the HK
Dollar can only lead to a temporary slowdown of the inflation rate. To use the exchange rate as
a tool to offset the inflationary pressure generated by a continual process of economic
restructuring, the HK Dollar has to keep on appreciating period after period.
7.19 If the linked exchange rate system is retained but the value of the HK Dollar is adjusted
from time to time as in an adjustable peg system, it may be possible to curb inflation. However,
exports will be hurt by the appreciating exchange rate and the economy will slow down. These
are the economic costs of currency appreciation. Furthermore deterioration in the terms of trade
will accelerate the process of outward expansion and economic restructuring, thus defeating the
49
purpose of currency appreciation as a means to curbing inflation.
7.20 A move to a flexible exchange rate system will in principle allow the government the
option of letting the HK Dollar float upwards through controlling the supply of money. But in
order to have this option, Hong Kong has to alter its existing monetary system and establish a
central bank. The desirability of such a step is controversial and involves both economic and
political considerations that goes far beyond the issue of inflation.
7.21 Once the exchange rate is used as a tool to offset inflation, the public will come to
expect periodic adjustments in the value of the HK Dollar. It encourages speculation as to when
and by how much the HK Dollar will be repegged. Such a situation creates uncertainty in the
markets. Exchange rate policy will become highly politicized. In the end, it may be extremely
difficult for the government to operate such a system effectively. The political uncertainties
about the future of Hong Kong is also an important consideration as to whether one should
tamper with the value of the HK Dollar at this juncture.
7.22 From a purely theoretical point of view, it is not clear whether a flexible exchange rate
system can work well for a small open economy where capital is internationally mobile.
Conventional economic wisdom has typically maintained that for such an economy a fixed
exchange rate system is usually preferable.
7.23 Hong Kong's problem is not unique, although the speed at which economic restructuring
has taken place is unprecedented. Countries with similar problems such as Singapore have tried
to use exchange rate policies to curb inflation. Singapore is also going through economic
restructuring, but at a slower pace than Hong Kong, and in recent years has experienced slow
labour force growth just like Hong Kong (See Figure 25) but it has responded in rather different
ways.
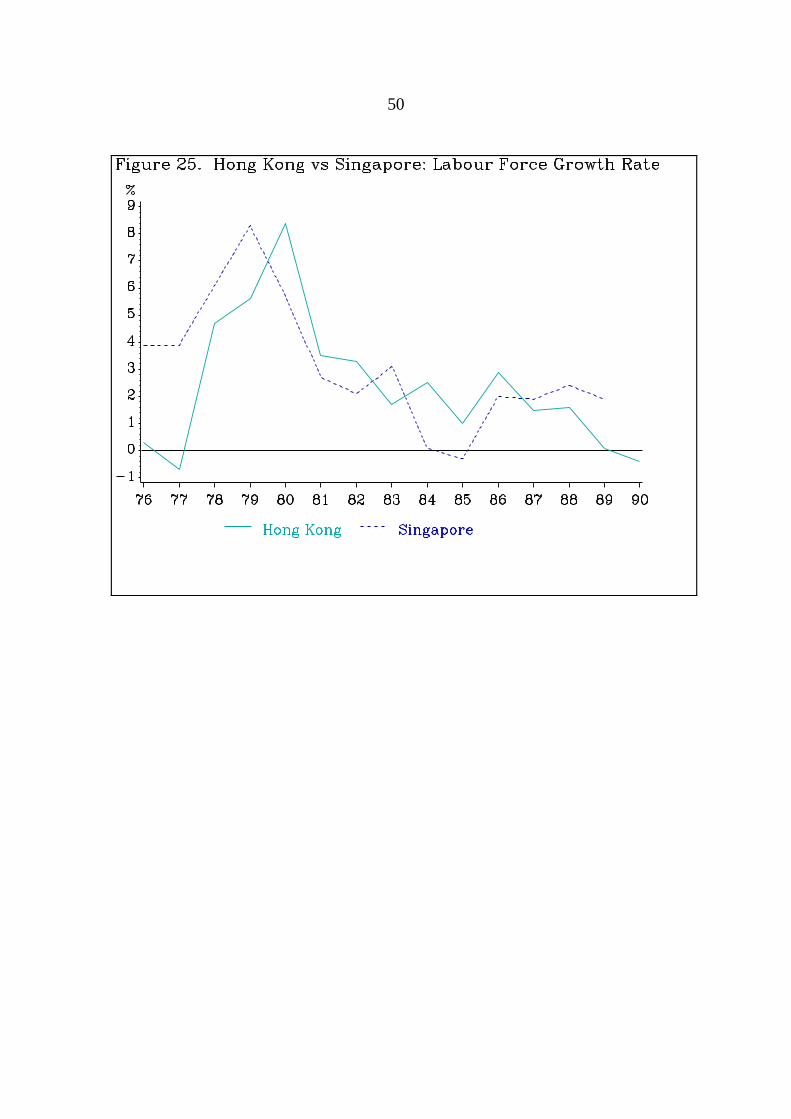
50

51
7.24 Figure 26 shows that since 1975, Singapore has consistently had a lower rate of
inflation than Hong Kong averaging about 2.7% per year. During that same period, Singapore's
currency had been appreciating relative to the US Dollar by about 20%, while the HK Dollar
had either been depreciating relative to the US Dollar in the period before October 1983 or has
since been linked to the US Dollar (see Figure 27). The adoption of such an exchange rate
policy is possible in Singapore because it has a different set of monetary arrangements from that
of Hong Kong. But this is not their only tool. Singapore also imports large numbers of foreign
employees to help alleviate its tight labour market. As such the burden of the adjustment does
not
fall entirely on the exchange rate.
52
7.25 On balance we do not advocate the adoption of an exchange rate policy to curb inflation
at the present time. To do so, one has to make basic changes to our monetary arrangements that
are extremely costly to undertake for economic and political reasons. This may be too risky a
step to take at this time, because it is not clear what the future course of economic restructuring
and political development will take.
Land Policy
7.26 One major resource which the government has control of is land. Subject to the
agreement of the Land Commission, the government can increase the supply of land for
residential and commercial use to relieve the pressure on resources, and thereby the inflationary
pressure. In fact, it has already announced that it will make available an additional 5.9 hectares
of land this year.
7.27 An increase in the supply of land will have the effect of moderating the steep rise in
property prices. But as we have discussed in Part 3, property prices are not included in CPI(A);
therefore, a moderation in property prices will have no immediate impact on measured inflation.
It does, however, reduce the cost of living due to housing of prospective homeowners. On the
other hand, it will have no effect on the cost of living of existing homeowners because their
mortgage payments have been locked in.
7.28 To the extent that the public perceive, albeit erroneously, that inflation is caused by
property price increases, moderation of property price increases may have the effect of
dampening inflationary expectation. Whether this will in fact generate a measurable impact on
inflation is open to question.
7.29 In the longer term, say two to three years after the increase in the supply of land, the
53
additional supply of completed flats available for occupancy will come on the market. The
availability of rental units will increase. This should slow down rent increase somewhat and
therefore lower CPI inflation. The magnitude of the impact will depend on the size of the
additional supply and the demand for rental housing at that time. In any case, relief brought on
by the increase in the supply of land to CPI inflation will not be immediate.
7.30 The current overheated property market is mainly demand driven. The supply of new
property units has been rather steady over a period of time but demand is more volatile.
Demand can fluctuate widely within a short period of time because of economic and political
changes, while adjustment in supply to changing conditions always falls behind with long lags.
The volatility of property demand is evident in the sudden surge of demand in March and July
1991. One should be reminded that demand could also shrink just as abruptly as in the property
market crash in 1982. If the increase in the supply of land is not correctly scaled and timed,
there may be a danger that it could unwittingly bring on a collapse in property prices. In that
case what is intended to be a cure for inflation could bring on a host of problems triggered by a
collapsed property market.

54
Human Resource Strategy
7.31 Even though economic restructuring is inevitable, the government can relax the
constraints of the tight labour market by adopting a human resource strategy. The human
resource strategy should aim at slowing down the rate of increase in unit labour cost in the
economy in general and in the service sectors in particular, thereby dampening the inflationary
impact of economic restructuring. This will entail slowing down the rate of wage increase and
increasing the rate of labour productivity growth.
7.32 Productivity growth depends on long term investments in human capital including
education and training, investments in physical capital and technological innovation. Increasing
the rate of productivity growth of the labour force significantly above the current trend level so
as to have a sizeable impact on curbing inflation will require massive long-term investments
which will not be cheap. The annual rate of increase in unit labour cost in the service sectors
has been 10-20% in the last few years. To just reduce the rate of increase to half of that level
will require an additional labour productivity gain of 5-10% a year on top of the current rate of
productivity increase. To achieve this margin of growth requires massive investments in human
and physical capital. Investing in labour productivity growth is a long term strategy but it is
unlikely to have a significant impact on curbing inflation in the near term.
7.33 The rapid rise in unit labour cost in the economy in the last few years is more the result
of a steep rise in nominal wage than a slow growth in labour productivity. This means that the
relevant policy is to slow down wage growth. But wage inflation is mainly the result of labour
shortage in a tight labour market, whereas the tight labour market is due to growth in labour
demand generated by economic restructuring outstripping the stagnant growth of the labour
force in Hong Kong. Therefore, the relevant human resource strategy must aim at expanding
the labour force.

55
7.34 There are four basic long-term factors contributing to the stagnant growth of the labour
force in Hong Kong. They are
(1) declining rate of natural population increase due to a secular fall in fertility in the
last two decades;
(2) declining labour force participation rates of the young population following the
rapid expansion of secondary and tertiary education and of the old population
due to earlier retirement;
(3) rising outflow of emigrants because of concern over 1997; and
(4) diminishing intake of immigrants following the abolition of the "reach-base"
policy in October 1980.
7.35 With regard to (1) and (2) there is not much room for government policies to
manoeuvre. Because (3) is motivated by political concern outside the control of the Hong Kong
government, what the government can achieve in curbing brain drain is limited. To cope with
the problem of drainage, the government has adopted stop-gap measures of retaining manpower
through arranged immigration schemes, encouraging return migration, replacing emigrants by
increasing the number of graduates from the tertiary institutions and retraining existing staff.
Some of these measures will slow the attrition of the labour force through emigration but will
not be significant enough to accelerate the growth of the labour force. The two policies that will
effectively increase the size of the labour force are importing foreign employees and increasing
the intake of immigrants.
7.36 How many additional members of the labour force over and above its projected growth
should be brought in from outside Hong Kong? What should be the criterion that determines
this number? Bearing in mind that the current rapid wage growth is due to excess demand for
labour over its supply causing labour shortage, the additional number should be sufficient to

56
increase the supply of labour until there is no excess demand. In that case, the labour market
will be in equilibrium. There will be full employment and real wage will grow at the same rate
as labour productivity. At full employment, the natural rate of unemployment equals the
vacancy rate thus stabilising wage growth. By contrast, when the number of unemployed is
smaller than the number of vacancies and there is over full employment, there will be excess
demand for workers with upward pressure on wages.
7.37 To determine the natural rate of unemployment in Hong Kong we estimate a model
based on Okun's Law which relates the gap between actual GDP and capacity GDP, and
unemployment rate. Detailed estimation is reported in Appendix 7. The natural rate of
unemployment in Hong Kong is estimated to be 2.64%. In other words the labour force in
Hong Kong is fully employed when there is an unemployment rate of 2.64%. Since 1987 the
unemployment rate in Hong Kong has been persistently lower than 2.64%, indicating that the
economy has been over-employed. The manifestation of this phenomenon is of course labour
shortage and rapid wage growth.
7.38 In principle the human resource strategy should take full employment as the target. We
therefore do not propose to increase the labour force by such a large number as to cause
considerable unemployment and actual decline in nominal wage. The goal is not to halt
outward expansion into China by massive importation of cheap labour but to stabilise wage
growth at full employment. That means the aim should be to expand the labour force above its
projected rate of growth just sufficiently to close the gap between the natural rate of
unemployment and the actual rate of unemployment.
7.39 Based on a forecast of GDP growth rate of 4% in 1991, we predict in Appendix 7 that
the unemployment rate for the year will be 2.09%. Given an estimated natural rate of
unemployment of 2.64%, the unemployment gap is 0.55%. This translates into 15,000
57
additional members of the labour force required this year to close the gap while maintaining full
employment.
7.40 As 1991 is drawing to a close, a projection on the additional number of potential
employees to be brought in from outside Hong Kong for next year has more policy relevance.
Since GDP is forecasted to grow faster than 4% in 1992, the unemployment gap will widen if
there is no additional infusion into the labour force. Predictions on the future unemployment
rate and the unemployment gap can be obtained from the parameter estimates of the Okun's
model on the basis of a forecast on 1992 GDP growth rate. Detailed procedures of the
estimation are reported in Appendix 7. The estimates are based on available government
statistics and should be taken as indication of the magnitude of the problem rather than exact
values.
7.41 The predicted outcomes and the proposed numbers based on two forecasts on GDP
growth rate in 1992 are as follows:
1992 GDP Growth Rate Forecast
5% 6%
Predicted Unemployment Rate (%) 1.83 1.71
Unemployment Gap (%) 0.81 0.93
Additional Number to be Brought in 23,000 26,000
7.42 If the economy of Hong Kong grows at 5% in 1992, next year we can bring in 23,000
additional members of the labour force to close the unemployment gap and still maintain full
employment. If the growth is faster at 6%, the corresponding number will be 26,000. These
numbers are estimated from the projected growth in capacity GDP. They have taken into

58
account all existing factors that impinge on the growth of the labour force and are therefore over
and about the projected labour force for next year. Since the size of the unemployment gap
widens and narrows with economic conditions, the numbers beyond 1992 should be reviewed
and adjusted annually.
Importing Foreign Employees
7.43 In the short term, a quick and effective way to increase the size of the labour force is to
import foreign employees. In 1989 the government introduced a scheme for importing foreign
employees which was subsequently expanded in 1990. The scheme was not introduced with
curbing inflation as the objective. It aroused considerable debate at the time it was introduced.
In what follows, we provide a detailed analysis of such a policy so that public debate on the
issue is better informed. In particular, we propose a more efficient scheme than the existing one
with lowering inflation as the objective.
7.44 Based on our analysis in the previous section, the quota for importing foreign employees
in 1992 is 23,000 (26,000) if GDP grows at 5% (6%). This number is over and above the
existing numbers of imported foreign employees including the quotas approved in the 1989 and
1990 exercises, as well as categories which have not been subjected to quota restriction, such as
housemaids and highly skilled technicians, professionals and managers from overseas sponsored
by their employers.
7.45 We propose to continue the practice of exempting these categories from quota
restriction. In particular, in place of a skill criterion for the technicians, professionals and
managers, we propose a salary criterion. Imported employees who will be paid a certain
monthly salary or above should not be subjected to quota restriction.3 The rationale for the
3 It is assumed that a change from the skill criterion to the salary criterion will not
have a significant impact on the projected growth in the labour force so that the quota
59
change is that salary is an objective criterion; it is a good indicator of the earner's value to the
employer. By contrast, skill criterion is more subjected to interpretation. Government officials
have to make a distinction between what are high skills and what are low skills. Without the
benefit of on-site inspection, these decisions could be arbitrary, causing frustration and
grievances among the employers who make the applications.
7.46 It is proposed that local employees whose salaries are among the top 15% of the labour
force do not require quota protection from competition by foreign employees because they are
financially less vulnerable than workers with low income. Furthermore, there is negligible
unemployment and underemployment among local employees in this category. According to
the figures reported in the General Household Survey for January to March 1991, $10,000 a
month is the cut-off income for the top 15% of the income earners in Hong Kong. Therefore, it
is suggested that imported employees who will be paid a monthly salary of $10,000 or above
should not be subjected to quota restriction.
Minimum Wage
7.47 It is proposed that foreign employees imported under the quota be subjected to a
minimum wage requirement. The minimum wage should be set at that level which protects the
low income half of the labour force from being adversely affected by importation of foreign
employees. According to the General Household Survey $5,000 is about the median monthly
wage of the entire labour force. Therefore, it is suggested that imported employees must be paid
at least $5,000 a month, inclusive of accommodation charges. In addition, employers must
provide transportation from the sending country and arrange accommodation as in the current
import scheme.
for importing foreign employees remains the same as estimated.

60
7.48 A minimum wage requirement is superior to the present practice requiring employers to
pay foreign employees imported under the current quota scheme the median wage for the job
categories to which they belong. There are several problems with this median wage
requirement. First, job categories or titles, being generalisation of the jobs performed, fail to
capture the variety of job tasks that are actually performed. Two workers with the same job title
could be doing very different things in their jobs. Pooling these jobs together to determine the
median wage does not do justice to the rich diversity of jobs involved. Second, more
importantly, the median wage requirement makes it unattractive for the employers to import
foreign employees. This is because imported foreign employees usually have lower productivity
than the average local worker doing the same job. This is especially likely if the employers
cannot screen applicants in their home countries before they are admitted due to poor
information on the workers and other hiring costs.
7.49 By contrast, an overall minimum wage which is not linked to job categories is much
simpler to implement. If it is set properly and policed stringently to ensure compliance, it can
provide effective protection for low wage local workers from competition by imported
employees.
Allotment of Quotas
7.50 The current scheme of importing foreign employees is based on a set of quotas
categorized by industries. The size of these quotas presumably reflects the extent of labour
shortage in the industries concerned. Typically manpower surveys and projections are used to
determine the extent of shortage in each category. There are several problems with this
approach.
7.51 First, manpower surveys are notoriously inaccurate. Under a survey situation when an
employer is asked whether he is short of a certain type of worker, there is an incentive for him to
61
overstate his difficulty in recruitment. Hence manpower surveys tend to exaggerate the extent
of the labour shortage.
7.52 Second, even if the manpower surveys were initially accurate, changing economic
conditions would soon cause shifts in the demand for different types of workers. Extensive
bureaucratic support in monitoring the changing manpower situation is required. Quotas by
categories of workers are unlikely to correspond closely with the actual and changing
requirements of the economy. If the government makes a mistake in announcing a quota for
importing a certain category of worker when in fact there is substantial unemployment or
underemployment of local workers of the same type, local workers and labour organisations will
be justifiably aggrieved. The political repercussion on the import scheme will be negative.
7.53 A third problem with allocating quotas according to job categories is that it is based on
simply defined occupations. There is considerable room for the employer to import a
foreign worker in a category for which there is quota available and asks him to perform
the tasks of a worker in some other categories. Short of on-site monitoring of the work
of the imported employees, there is no way for the government to effectively police this
violation of quota allotment.

62
7.54 Our proposal on allocation of quotas moves away from the morass of job category-
specific quotas. Instead it is proposed that quotas be allotted by categories of minimum
wage as follows:
Quota
Minimum wage requirement 5% GDP growth rate 6% GDP growth rate
$5,000 17,000 19,000
$7,500 6,000 7,000
--------- --------
23,000 26,000
In other words if the growth rate is 5% (6%), 17,000 (19,000) quotas should be allotted to
employers who will pay imported employees a monthly wage of at least $5,000. The remaining
6,000 (7,000) quotas should be allotted to employers who will pay a wage of at least $7,500.
This breakdown reflects the relative proportion of workers within the income range of $5,000 to
$10,000 that exists at present. Imported employees who are paid at least $10,000 will not be
subjected to quota restriction.
7.55 This proposal will still require policing of violations of the minimum wage regulation.
In this regard, it is no different from the present regulation of median wage which requires
policing also. It is superior to the present scheme because it eliminates all the problems arising
from categorising quotas by jobs and industries. The question that remains then is how can the
quotas be allocated to employers who have the greatest demand.

63
Bidding for Quotas
7.56 A market solution is the most efficient in allocating valuable resources and quotas for
importing foreign employees are valuable resources. Instead of having government officials
find out who have the greatest need for importing foreign employees, let the preference of the
employers be revealed in the market by tendering. It is well-known in economics that an
efficient mechanism in allocating resources to those who place the highest value on them is
through tenders.
7.57 We propose to allocate the two categories of quotas by sealed bids. There should be no
restriction on the number of quotas that any employer can bid for. After successfully bidding
for quotas, employers must utilise them to import foreign employees within a specified period
of time which should be sufficient for recruitment from overseas. Once it is utilised to import a
foreign employee, the quota will remain effective for two years lasting the same length of time
as the contract for the foreign employee.
7.58 To ensure that quotas will end up in the hands of those employers who have the greatest
demand for them, private transfers in quotas should be allowed. Quotas can be transferred
before they are utilised. After the foreign employees have arrived, they can transfer to a new
firm which can hire them for the remaining effective period of the quota. Such transfers should
be permissible provided that the foreign employee and the old employer agree to the transfer
and the new employer observes the minimum wage regulation. Transfers of quotas and foreign
employees allow flexibility for firms to cope with changes in economic conditions which may
increase or decrease their demand for workers.
7.59 The bid prices for the two categories of quotas will provide information for the
government to adjust the relative size of the two categories of quotas. The ratios of the bid
prices to the wages offered to the foreign employees are indicators of the tightness of the labour
64
market in Hong Kong. A large ratio means that employers are willing to pay a large fraction of
the wage for the right to import a foreign employee, thus indicating shortage of workers at that
income level. The relative size of the quotas in the two minimum wage categories should be
adjusted to bring these two ratios in line.
7.60 The government should consider using the revenue obtained from the quotas for
importing foreign employees to help fund programs devoted to the training, welfare and benefits
of local workers in Hong Kong.
7.61 Tendering is superior to the present practice of distributing quotas for free to employers
who apply. Under the existing import scheme, the initial response among employers was
enthusiastic in the two exercises in 1989 and 1990; the number of applications far exceeded the
quotas available. But when cases were approved and employers must proceed to the final stage
of recruiting workers and applying for employment visas, the take-up rate was low. In fact in
the second exercise it fell far short of the overall quota at the deadline. It took a long time
before all quotas were finally taken up by employers on the reserve list. Some firms which were
allocated quotas did not use them while other firms in great demand for quotas to import
employees did not get any. The existing scheme is inefficient as it allows employers to place a
bid for a valuable resource at no cost and requires government officials to try to determine who
have the greatest demand.
7.62 The tendering mechanism also has the effect of encouraging the importation of foreign
employees who can generate the highest valued added to their employers, or in other words,
make the greatest contribution to our economy. This is because firms that import foreign
employees who can generate high value added will be more able to out-bid their competitors for
the quotas.
Foreign Employee Levy

65
7.63 In addition to paying the bid prices for the quotas to import foreign employees, firms are
required to pay to the government a foreign employee levy for every employee they import. An
imported employee imposes an external social cost on society because he imposes a burden on
the infrastructure of the economy, causing congestion, for instance. A levy on the employers
will induce them to internalize the external social costs in their decision to import foreign
employees so that the marginal social costs of importing employees are brought in line with its
marginal benefits. This enhances efficiency in allocating labour resources.
7.64 It is proposed that the foreign employee levy be set at 10% of the minimum wage for
importing foreign employees, that is $500 a month. This levy is payable by the employer.
7.65 In this report we do not intend to go into the technicalities of a scheme for importing
foreign employees. Issues concerning the provision of food, accommodation and transportation
for the imported employees need to be addressed. Contracting out the construction of the new
airport as turnkey projects in which the contractors bring in their teams of workers, bringing in
employees from across the border on a day return basis and other ideas merit consideration.
Technical details will have to be worked out before the scheme can be implemented.
Singapore's Experience in Importing Foreign Employees
7.66 In connection with the proposal to import foreign employees, it is instructive to compare
Singapore with Hong Kong. As we have discussed earlier, Singapore has consistently had a
much lower inflation rate than Hong Kong in the last 15 years (Figure 26). Over the same
period, Singapore has persistently appreciated its currency and imported large numbers of
foreign employees to alleviate its tight labour market.
7.67 Singapore has a long history of importing foreign workers to increase the growth rate of
its labour force. Conservative estimates put Singapore's imported workers at 14% of its total
labour force. This percentage grew from the late 1960s when Singapore first imported workers
66
from Malaysia. If the same percentage were to apply to Hong Kong, the territory would have a
stock of 390,000 foreign workers. It is not recommended that Hong Kong should import 14%
of its labour force at this stage. After all the 14% for Singapore has been accumulated over a
period of two decades. When a society has such a large stock of foreign workers in midst of its
population, serious social and political problems are bound to emerge. The number is only an
indication of the scale of the response taken by the Singapore government in relieving its tight
labour market.
7.68 It should also be noted that our proposed scheme for importing foreign employees has
similarities with the Singapore scheme but there are important differences. Under the Singapore
scheme quotas are distributed free by sectors subject to the limit of a maximum percentage of a
firm's work force. The Singapore government imposes a levy of about 250-350 Singapore
dollars per month on each imported worker. It is now considering the idea of auctioning quotas.
Impact on Local Workers
7.69 The main aim of a policy on importing foreign employees is to relieve the labour supply
constraints on the economy so as to slow down wage growth and hence inflation. The added
bonus is that it will accelerate economic growth by increasing the resource capacity of the
economy and stimulating investments. Faster economic growth will ultimately benefit local
workers as well as employers.
7.70 Reducing wage increases will not be palatable to local employees but neither is the
option of doing nothing and allowing inflation to run its cause. As we have analyzed earlier,
inflation hits the low income families hardest. Capital has the option of moving out but not
workers. Slow nominal wage growth in face of rampant inflation is painful to workers as they
find it difficult to make ends meet with their take-home pay. However, a decelerating wage
growth that brings down with it inflation would be less painful.

67
7.71 We have built into the policy of importing foreign employees safeguards for low wage
local workers such as the minimum wage requirement. Since the policy aims at full
employment, the employment prospect of local workers as a whole will not be adversely
affected. However, even though at full employment when the number of vacancies available
equals the number of unemployed, it does not mean that there will be no individual hardship
cases in looking for jobs. Individual workers may have the wrong skills and find that they
cannot obtain employment even though there are vacancies. A good example will be a
manufacturing worker in her 40s who loses her job because her employer has relocated his
production facilities into South China. She will find it difficult to seek employment in the retail
sector even though there is a shortage of workers there. These cases are bound to emerge
because of the rapid restructuring of our economy and outward processing. They will appear
regardless of whether foreign employees are imported or not. To deal with this problem the
government should be more active in encouraging the provision of opportunities for re-training
for these dislocated workers who suffer from skill mismatch.
Increasing Intake of Immigrants From China
7.72 Another effective policy on expanding the labour force is to increase the intake of legal
immigrants from China. Since the abolition of the "reach-base" policy in 1980, illegal
immigration has been largely contained and a major source of labour supply for Hong Kong was
blocked. Beginning from 1983, the government further tightened its control on immigration
from China. Hitherto holders of two-way permits issued by Chinese authorities who could
return to China on those documents were allowed to take up residence in Hong Kong upon
entry. In 1983 this policy was changed so that only holders of one-way permits who were
officially approved to emigrate by Chinese authorities were allowed to enter Hong Kong to take
up residence. Legal immigration since 1983 has been halved to around 27,000 a year,
68
corresponding roughly to a quota of 75 immigrants a day. What is unique about this
immigration arrangement is that Hong Kong has no control over whom to admit for residence.
The selection and approval for issuing one-way permits are entirely the business of China.
Hong Kong just admits whoever holds the one-way permits, subject to a daily quota of 75.
7.73 From the perspective of contribution to the expansion of the local labour force, the
composition of legal immigrants admitted after the abolition of the "reach-base" policy is less
than desirable, mainly because Hong Kong cannot screen applicants for immigration in
accordance to its manpower needs. The 1986 By-Census contains information on recent
immigrants from China who arrived Hong Kong within the last 5 years. It shows that, in
comparison to local residents, there is a disproportionately large percentage of school age
children and economically inactive housewives among the legal immigrants from China. While
school age children will contribute to the labour force in the future, they do not bring relief to
the current tight labour market.
7.74 We propose to increase the daily quota for the intake of immigrants from China. To
improve the quality of the intake, Hong Kong government should negotiate with the Chinese
government to gain some control over its composition. For instance, Hong Kong could request
the Chinese government to allow Hong Kong to screen and select immigrants from China under
a point system to fill the additional quota while the Chinese government will determine who
will fill the original quota of 75 a day. Such negotiation has a better chance of success if there is
a friendly, cooperative and trusting relation between the two governments. The issue is of such
significance that the Hong Kong government must persuade the Chinese government of the
importance of an expanded intake of suitable immigrants for the future prosperity and stability
of Hong Kong.
7.75 Under a point system that screens applicants for immigration to fill the expanded quota
69
according to their age, education, skill and work experience, the labour force participation rate
of the immigrants admitted will be much higher than the existing rate. A priori, there is not
enough information to make a reliable estimation of what should be the size of the expanded
quota that will yield sufficient new members of the labour force to close the unemployment gap.
We propose as a start to double the daily quota to 150 and to have it kept under review.
7.76 The policy of increasing immigrant intake has several advantages over a policy of
importing foreign employees. Employers have little incentive to invest in the training of
imported employees given the short term nature of their contracts. The value added per
imported employee to production is relatively small. By contrast, immigrants do invest in
further training. After settling down in Hong Kong, some of them may train to become highly
skilled technicians and professionals while others may develop into entrepreneurs and
industrialists. Indeed throughout the history of Hong Kong many successful industrialists and
entrepreneurs were immigrants from China. In short, the value added per immigrant is
potentially much larger than that of an imported employee.
7.77 Second, even though on a short term basis importing employees with the right skills is
an effective stop-gap measure to relieve labour bottlenecks, in the long run, immigration is more
flexible in addressing long-term manpower needs of the economy. This is because immigration
increases the population base forever. In the long run, working members of the population will
always respond to economic incentives which induce them to invest in human capital and take
specific jobs. The labour market, using wage as a signal, will match workers of a certain skill
with employers who demand that skill, thus solving the manpower problem.
7.78 Finally, immigrants from China readily adapt and integrate into society whereas
imported employees tend to form enclave communities of their own which could lead to social
conflict, discrimination and exploitation. Immigrants have a much stronger sense of belonging
70
to their new home countries while guest workers are sojourners. In terms of community
building and identity, immigration is preferable to importing foreign employees.
Conclusion on Policy Proposals
7.79 We are now faced with a serious problem of inflation the cause of which is structural.
Short of reversing the process of economic restructuring and outward expansion, there is no
effective means of getting at the core of the inflation problem. However, a carefully chosen set
of policies will lower inflation somewhat, thereby bringing relief and softening the distributional
impact. None of the policies will be palatable to everyone, but a human resource strategy based
on importing foreign employees and increasing immigrant intake complemented by a tight
discipline on government spending appears more desirable than tampering with the linked
exchange rate and managing a continuous appreciation of the HK Dollar. When implemented
together, these policies should be sufficient to lower inflation to the high single-digit level. This
will provide relief to the current situation even though the core of inflation remains intractable.
7.80 Specifically, the policy proposals are as follows:
1. Tight fiscal discipline by the government to reduce the share of government
spending in GDP.
2. On the basis of a forecast GDP growth rate of 5% (6%) and no increase in the
intake of immigrants, import 23,000 (26,000) foreign employees next year.
3. Increase the intake of legal immigrants from China from the present 75 a day to
150 a day and negotiate with China to gain some control on screening applicants
for immigration to fill the additional daily quota of 75.
7.81 Importing foreign employees is an effective short term solution to clear bottlenecks in
the labour market. It is swift and specific in meeting the needs of employers. On the other
hand, immigration expands the population base which is the long term source of the labour

71
force. In Hong Kong a mix of the two policies offers the best solution to our structural problem.
If the two policies are implemented together, the number of imported foreign employees will
have to be scaled down to allow for the increase in economically active immigrants. In the long
run, the labour force must grow faster. In the face of declining fertility, the most effective way
of increasing our population is immigration. However, a market-oriented scheme on importing
foreign employees is a flexible approach in addressing short-term shortages that are bound to
occur from time to time, as the economy restructures and responds to changes in world
economic conditions.
7.82 In the long run, the standard of living of the people of Hong Kong will only rise as fast
as productivity increase. As the economy increasingly shifts toward the high value added
manufacturing and services, productivity of the Hong Kong labour force will have to grow to
match this trend. To achieve the productivity growth in an environment of restructuring, long
term human capital investments in education and training will be necessary to prepare the local
labour force with the relevant skills for a transforming economy.

72
Appendix 1
Inflation Decomposition
The Consumer Price Index is a Laspeyres index and is defined as follows:
where Pt is the CPI at time t, Pit is the price indexes of individual components and i are the
weights. Following Blinder,4 inflation rate can be computed as
where it is the relative importance of component i at time t. Hence, inflation rate is a weighted
average of the rates of change of its individual components. An item's relative importance in
the CPI automatically increases (decreases) as its price rises (falls) relative to the CPI as a
whole. The contribution of item i to the overall inflation rate is therefore:
4 Blinder, A.S. 1982, "The Anatomy of Double-Digit Inflation in the 1970s," in
Inflation: Causes and Effects, edited by R. Hall, pp. 261-282. Chicago: The
University of Chicago Press.
P = P iti
=1i
t
itit
=1i
t
1-it
1-itit
1-t
1-iti
=1i
1-t
1-ititi
1-t
1-tt
=
)P
P-P)(
P
P( =
P
)P-P( =
P
P-P
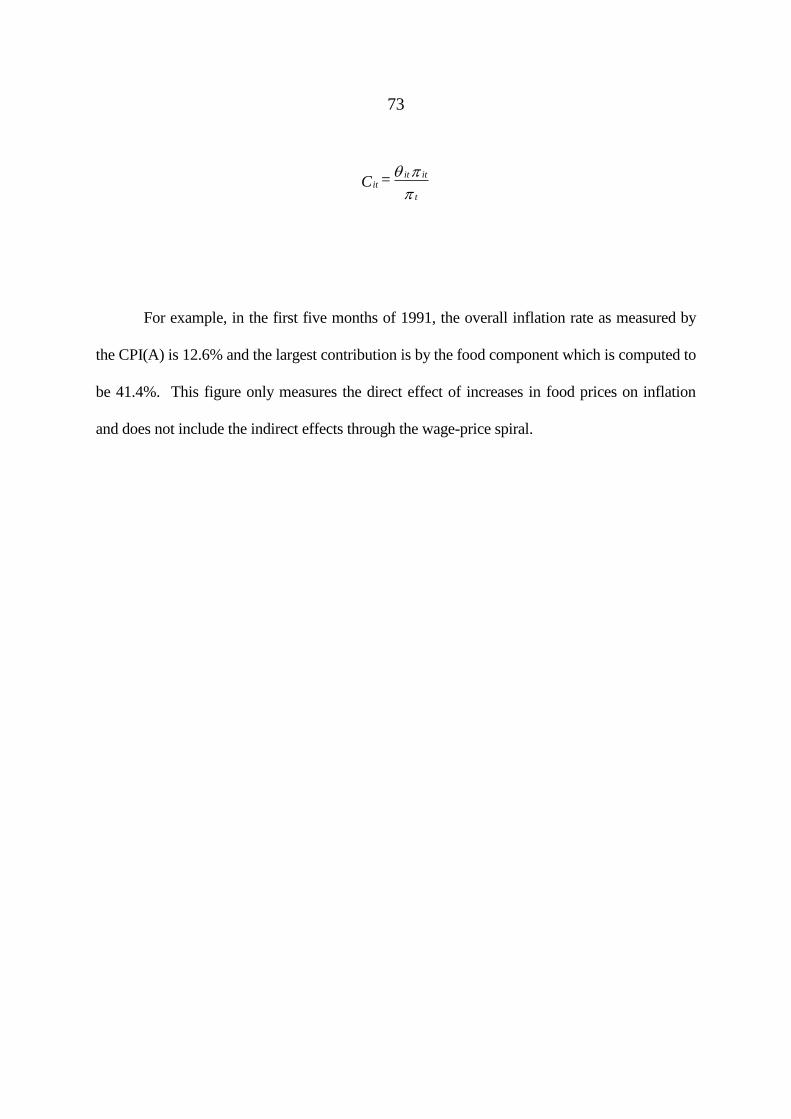
73
For example, in the first five months of 1991, the overall inflation rate as measured by
the CPI(A) is 12.6% and the largest contribution is by the food component which is computed to
be 41.4%. This figure only measures the direct effect of increases in food prices on inflation
and does not include the indirect effects through the wage-price spiral.
t
ititit = C
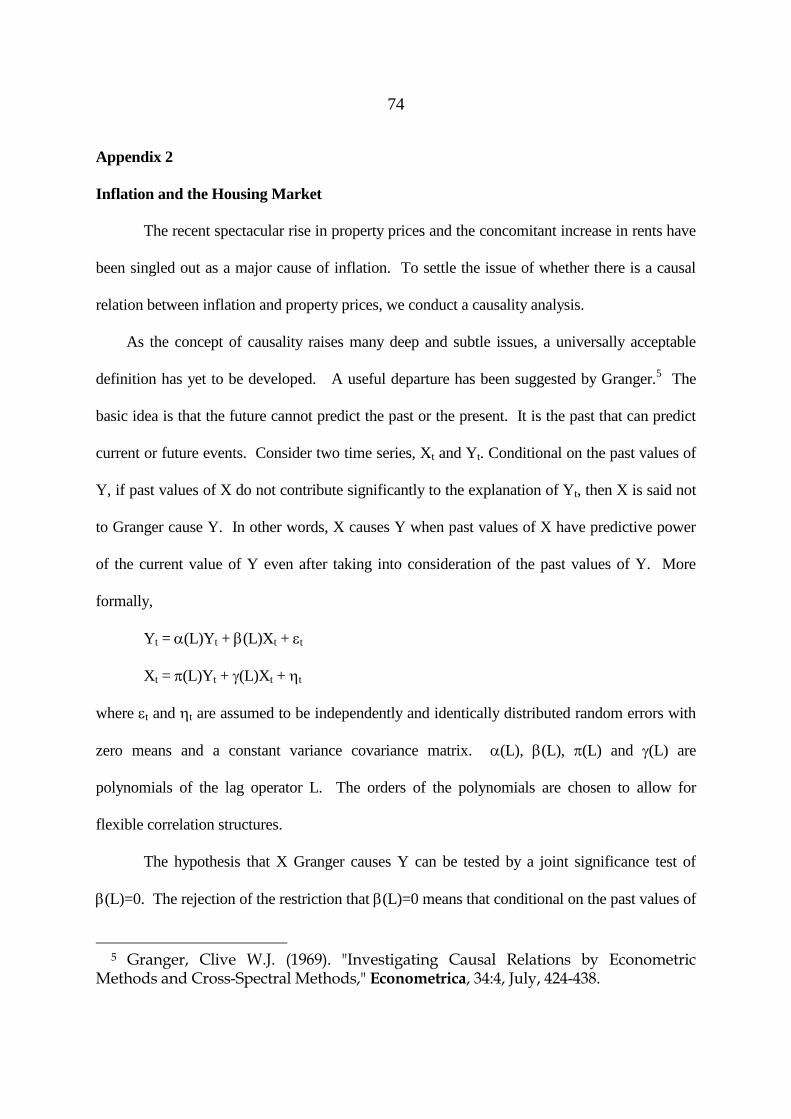
74
Appendix 2
Inflation and the Housing Market
The recent spectacular rise in property prices and the concomitant increase in rents have
been singled out as a major cause of inflation. To settle the issue of whether there is a causal
relation between inflation and property prices, we conduct a causality analysis.
As the concept of causality raises many deep and subtle issues, a universally acceptable
definition has yet to be developed. A useful departure has been suggested by Granger.5 The
basic idea is that the future cannot predict the past or the present. It is the past that can predict
current or future events. Consider two time series, Xt and Yt. Conditional on the past values of
Y, if past values of X do not contribute significantly to the explanation of Yt, then X is said not
to Granger cause Y. In other words, X causes Y when past values of X have predictive power
of the current value of Y even after taking into consideration of the past values of Y. More
formally,
Yt = (L)Yt + (L)Xt + t
Xt = (L)Yt + (L)Xt + t
where t and t are assumed to be independently and identically distributed random errors with
zero means and a constant variance covariance matrix. (L), (L), (L) and (L) are
polynomials of the lag operator L. The orders of the polynomials are chosen to allow for
flexible correlation structures.
The hypothesis that X Granger causes Y can be tested by a joint significance test of
(L)=0. The rejection of the restriction that (L)=0 means that conditional on the past values of
5 Granger, Clive W.J. (1969). "Investigating Causal Relations by Econometric Methods and Cross-Spectral Methods," Econometrica, 34:4, July, 424-438.

75
Y, the past values of X contribute significantly to the explanation of the current value of Y. In
other words, rejection implies that the evidence is not consistent with the hypothesis that X
Granger causes Y. If the restriction is not rejected, nothing can be presumed about the causality
from X to Y.
Symmetrically, we can examine the joint significance of (L) in testing the hypothesis
that Y Granger causes X. To get more efficient test statistics, the model should be estimated
jointly as a system of two seemingly unrelated regressions.
To get a handle on the causal relationship between inflation and the property market, let
us examine the historical records. Figure 9 shows the time profiles of inflation rate () as
measured by the HSCPI and two indicators of the housing market, namely the rates of change of
the property price index (A) and of the rental index (R) for private domestic premises. The two
indexes move together in similar patterns over time. The property price index fluctuates more
than the rental index. There is some evidence that the rental index lags behind the property
price index.
Over the period from the first quarter of 1981 to the second quarter of 1991, the profile
of inflation rate is not very similar to that of the rates of change of the two indexes. The
property market took a tumble in the second half of 1989, and only started to recover last year.
Inflation rate has accelerated almost continuously since 1986. Over the whole period, the
simple correlation coefficient between the inflation rate and the rate of increase in the property
price index of private domestic premises is -0.20. Contrary to expectation, inflation is
negatively associated with the rate of change of housing prices, but the correlation is not strong
and is statistically insignificant. The simple correlation coefficient between inflation and the
rental index is 0.11 and is also statistically insignificant. These linear correlation structures can
be summarized by the following regression equations:

76
= 9.48 - 0.033 A + residual R2 = 0.039
(0.53) (.026)
= 8.88 + 0.027 R + residual R2 = 0.013
(0.59) (.037)
The results make it very clear that in the sample there is no regression relationship between the
inflation rate and the property market as proxied by the rates of change of the property price
index and the rental index of private domestic premises.
The finding that inflation is not related to contemporaneous movements in the property
market is strengthened by the results of Granger causality analysis. As shown in Table A.1,
conditional on past inflation rates, neither the past values of the growth rate of property prices
nor those of the growth rate of rents have predictive power for the future evolution of inflation
at conventional significance levels. The converse is also found to be true. Changes in the
inflation rate and movements in the housing market are not closely related in the sample. The
data offer no evidence on any causal structure between the two.
Our empirical results simply bring out the message contained in Figure 9. Over the past
ten years, movements in the inflation rate and the property market are not synchronized. No
simple relationship can be distilled from the historical records. The popular contention that the
rising housing market is causing inflation in the sense of Granger, has no strong empirical
support. In the sample, neither property price nor rent has been found to be a statistically
significant predictor of current inflation.

77
Table A.1: Inflation and the Property Market
Hypothesis P-Value Sample Number of
Lags
Inflation Granger Causes Property
Value (A)
.15 81Q1-91A2 4
Property Value (A) Granger Causes
Inflation
.41
No Casual Relationship between π and
A
.22
Inflation Granger Causes Rental Value
(R)
.18 81Q1-91Q2 4
Rental Value (R ) Granger Causes
Inflation
.41
No Casual Relationship between π and
A
.27
Appendix 3
Imported Inflation
The Hong Kong dollar was linked to the US dollar on October 17, 1983. The US dollar
has depreciated against other major currencies for most of the time since that date. Given that
the link has been successfully maintained, the HK Dollar has also depreciated in step with the
US Dollar.
Depreciation aggravates the problem of imported inflation. If the HK Dollar had been
pegged to a basket of currencies, instead of just to the US Dollar, what would have been the
picture of imported inflation? To approach this counterfactual question, we first construct a
fixed basket of 15 currencies, and define the value of this basket as follows:

78
where V15 is the value of the fixed basket of 15 currencies, wi is the weight of the ith currency
in the basket and eit is the value of the ith currency in terms of US dollar at time t. The value of
the basket is normalized at one US dollar in October 1983.
The 15 currencies included in the basket are listed in Table A.2 and are those used in
the construction of Hong Kong's effective exchange rate index.6 The weight of the ith currency
in the basket is based on the average share of the ith country in the total imports of Hong Kong
from 1984 to 1986.
6 For a discussion of the effective exchange rate index, please refer to the article "Revision of the Effective Exchange Rate Indexes (EERI) for the Hong Kong Dollar", Hong Kong Monthly Digest of Statistics, November 1987, pp. 99-109.
e w = 15V iti
15
=1i
t

79
Table A.2: Fixed Basket of 15 Currencies
Currency Weight
China 28.16
USA. 10.63
Japan 24.35
Taiwan 9.03
U.K. 4.58
Singapore 5.28
West Germany 2.74
Rep. of Korea 5.57
Australia 2.13
Canada 0.78
Switzerland 1.89
France 1.57
Italy 1.68
Netherlands 0.63
Belgium 0.98
A realistic basket would not include so many currencies, and would exclude Renminbi.
Another basket containing only four major currencies, namely the US Dollar, Yen, Sterling, and
Deutsche Mark, is also constructed based on the proportions of 5:3:1:1. These weights are
roughly the same as the proportional shares of total trade between Hong Kong and these four
countries.
Imported inflation is measured by the change in the unit value index of imports. Simulated

80
imported inflation is derived from the unit value index of imports deflated by the value of the
basket of four major currencies. The difference between actual and simulated imported inflation
is therefore just equal to the change in the value of the fixed basket. When the fixed basket
appreciates in value, simulated imported inflation will be below that of the actual one, and vice
versa.
The computation is mechanical and does not allow for changes in the patterns of imports in
response to changes in the value of the fixed basket. When substitution possibilities are taken
into consideration, the amount of simulated imported inflation would be less. Information on
the magnitudes of elasticities of imports from various countries are scanty, and cannot support a
more sophisticated analysis. However, given that imported inflation can at most account for a
small proportion of the domestic inflation rate, even if the HK Dollar had been pegged to the
basket of four major currencies, the picture of domestic inflation would not have been much
different.
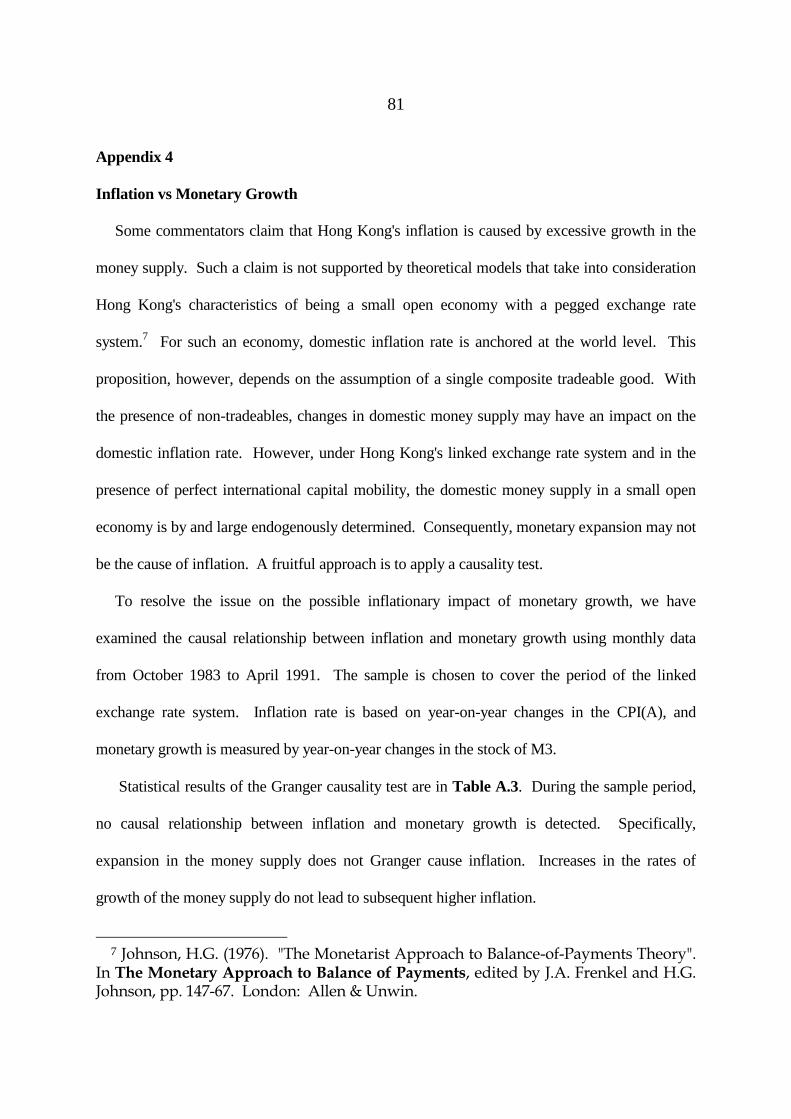
81
Appendix 4
Inflation vs Monetary Growth
Some commentators claim that Hong Kong's inflation is caused by excessive growth in the
money supply. Such a claim is not supported by theoretical models that take into consideration
Hong Kong's characteristics of being a small open economy with a pegged exchange rate
system.7 For such an economy, domestic inflation rate is anchored at the world level. This
proposition, however, depends on the assumption of a single composite tradeable good. With
the presence of non-tradeables, changes in domestic money supply may have an impact on the
domestic inflation rate. However, under Hong Kong's linked exchange rate system and in the
presence of perfect international capital mobility, the domestic money supply in a small open
economy is by and large endogenously determined. Consequently, monetary expansion may not
be the cause of inflation. A fruitful approach is to apply a causality test.
To resolve the issue on the possible inflationary impact of monetary growth, we have
examined the causal relationship between inflation and monetary growth using monthly data
from October 1983 to April 1991. The sample is chosen to cover the period of the linked
exchange rate system. Inflation rate is based on year-on-year changes in the CPI(A), and
monetary growth is measured by year-on-year changes in the stock of M3.
Statistical results of the Granger causality test are in Table A.3. During the sample period,
no causal relationship between inflation and monetary growth is detected. Specifically,
expansion in the money supply does not Granger cause inflation. Increases in the rates of
growth of the money supply do not lead to subsequent higher inflation.
7 Johnson, H.G. (1976). "The Monetarist Approach to Balance-of-Payments Theory". In The Monetary Approach to Balance of Payments, edited by J.A. Frenkel and H.G. Johnson, pp. 147-67. London: Allen & Unwin.
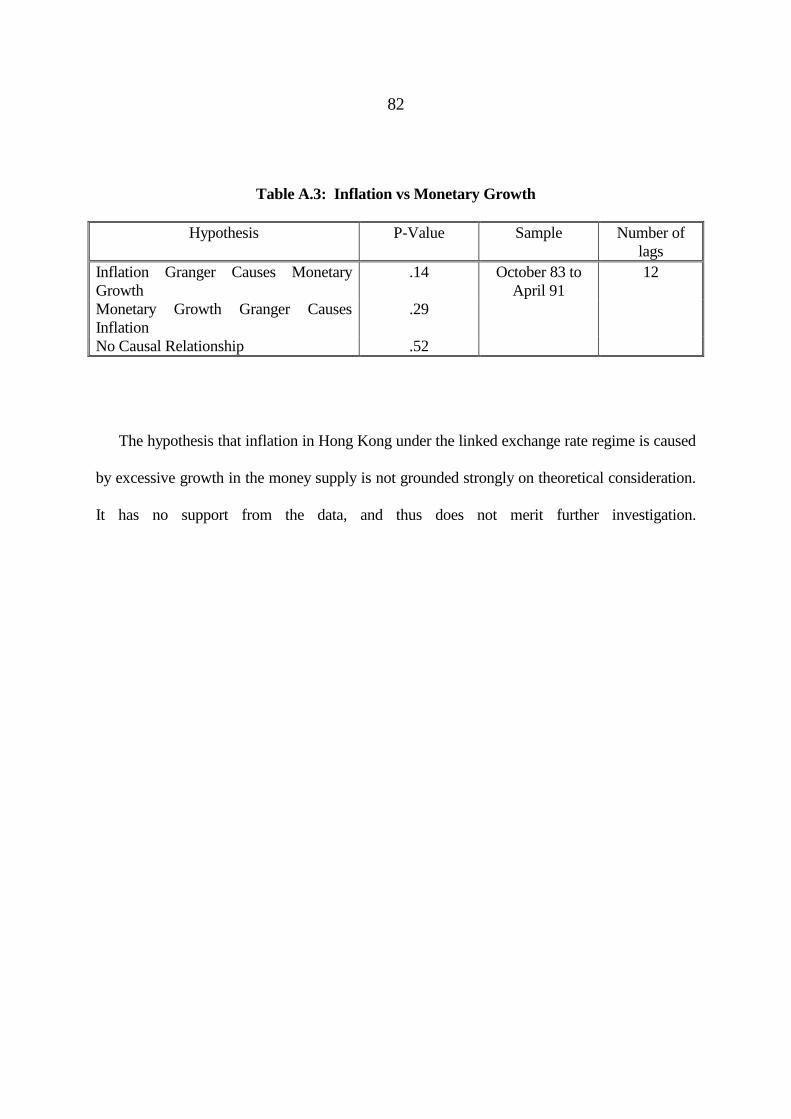
82
Table A.3: Inflation vs Monetary Growth
Hypothesis P-Value Sample Number of
lags
Inflation Granger Causes Monetary
Growth
.14 October 83 to
April 91
12
Monetary Growth Granger Causes
Inflation
.29
No Causal Relationship .52
The hypothesis that inflation in Hong Kong under the linked exchange rate regime is caused
by excessive growth in the money supply is not grounded strongly on theoretical consideration.
It has no support from the data, and thus does not merit further investigation.
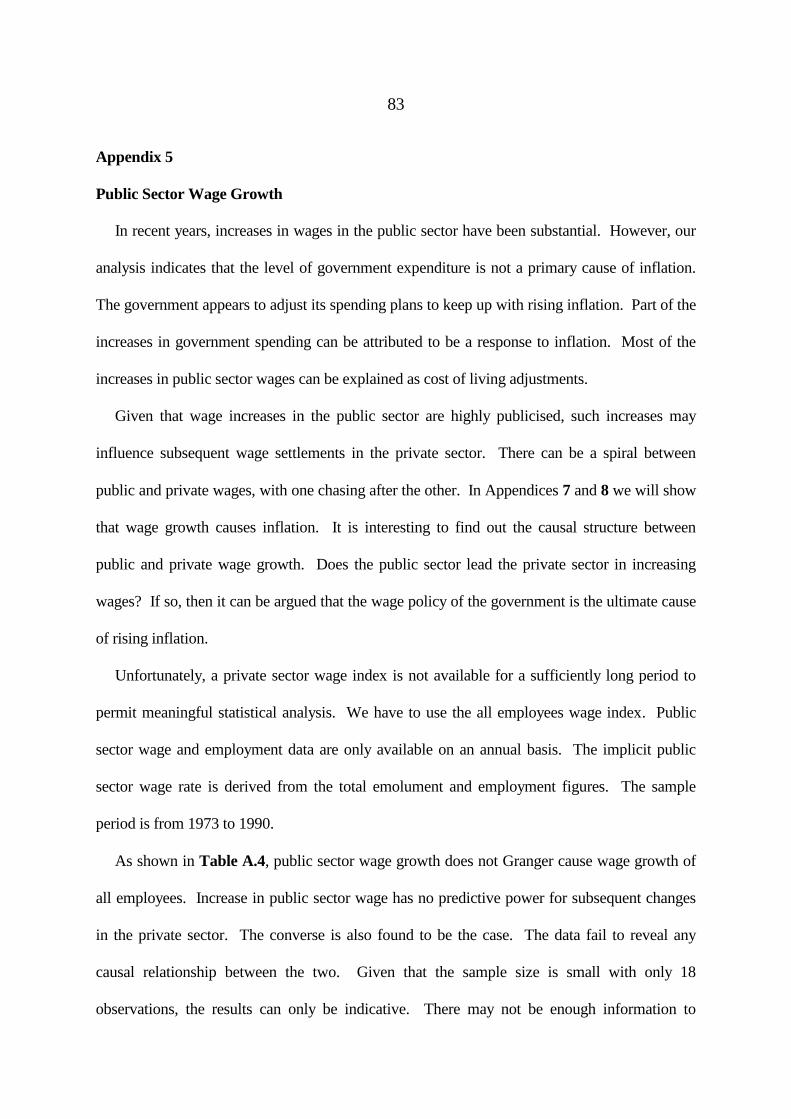
83
Appendix 5
Public Sector Wage Growth
In recent years, increases in wages in the public sector have been substantial. However, our
analysis indicates that the level of government expenditure is not a primary cause of inflation.
The government appears to adjust its spending plans to keep up with rising inflation. Part of the
increases in government spending can be attributed to be a response to inflation. Most of the
increases in public sector wages can be explained as cost of living adjustments.
Given that wage increases in the public sector are highly publicised, such increases may
influence subsequent wage settlements in the private sector. There can be a spiral between
public and private wages, with one chasing after the other. In Appendices 7 and 8 we will show
that wage growth causes inflation. It is interesting to find out the causal structure between
public and private wage growth. Does the public sector lead the private sector in increasing
wages? If so, then it can be argued that the wage policy of the government is the ultimate cause
of rising inflation.
Unfortunately, a private sector wage index is not available for a sufficiently long period to
permit meaningful statistical analysis. We have to use the all employees wage index. Public
sector wage and employment data are only available on an annual basis. The implicit public
sector wage rate is derived from the total emolument and employment figures. The sample
period is from 1973 to 1990.
As shown in Table A.4, public sector wage growth does not Granger cause wage growth of
all employees. Increase in public sector wage has no predictive power for subsequent changes
in the private sector. The converse is also found to be the case. The data fail to reveal any
causal relationship between the two. Given that the sample size is small with only 18
observations, the results can only be indicative. There may not be enough information to

84
unearth any deep causal structure that might exist between public and private sector wages.
Table A.4: Public Sector vs All Employees Wage Growth
Hypothesis P-Value Sample Number of
lags
Public Sector Granger Causes All
Employees
.32 1973-1990 1
All Employees Granger Causes Public
Sector
.57
No Causal Relationship .57

85
Appendix 6
Two-Sector Model on Economic Restructuring
Our analysis of Hong Kong's inflation in recent years is based on a two-sector model which
takes into account Hong Kong's characteristics as being a small open economy with perfect
international capital mobility operating under a pegged exchange rate system.8 The two sectors
in the economy are tradeables (E) and non-tradeables (S). The law of one price dictates that the
supply price of tradeable goods in the domestic economy is equal to that of the world price
measured in domestic currency. Under a fixed exchange rate, this implies that the inflation rate
in the tradeable goods sector E is equal to the world rate of inflation W:
E = W (1)
The labour market in the tradeable goods sector is assumed to be perfectly competitive.
Each worker is paid the value of his marginal product. In the long run, the rate of growth of
money wages WE is equal to the sum of the inflation rate plus the rate of growth of labour
productivity in the tradeable goods sector E.
WE = E + E (2)
In the model, the rate of growth of money wages in the non-tradeable sector can be the same
as or different from that of the tradeable sector. In the context of Hong Kong, it is appropriate
to assume that the two growth rates of wages to be different.
8 Aukrust, O. (1977), "Inflation in the Open Economy: A Norwegian Model," in Worldwide Inflation, edited by L.W. Krause and W.S. Salant, pp.107-53. Washington, D.C.: The Brookings Institution. Frisch, H. (1983), Theories of Inflation, pp. 163-186. Cambridge: Cambridge University Press.

86
WS = WE (3)
In recent years, money wages in the non-tradeable sector are growing faster than the wages in
the tradeable sector, i.e. > 1.
Without the constraint imposed by international competition, firms in the non-tradeable
sectors are assumed to protect profit margins by means of a constant percentage markup on unit
labour costs. The rate of increase of prices in this sector is therefore equal to the difference
between the rate of growth of money wages and the rate of labour productivity.
S = WS - S (4)
Inflation rate is defined as the weighted average of the inflation rates in the two sectors:
= EE + SS (5)
where E is the share of the value of tradeable output in the total national product. Solving for
the inflation rate in terms of the exogenous variables, we have:
= [E + S] W + S [E - S] (6)
In this model of a small open economy under a fixed exchange rate, domestic inflation is
explained by exogenous increases in world prices, labour productivities and changes in relative
wages. Labour productivity in the non-tradeable sector is assumed to be lower than the one in
the tradeable sector. This model can be expanded to examine the effects of changes in the
exchange rate and trade balance.9 The two labour markets can be fleshed out in more details.
Equation (6) provides us with a framework to examine why the inflation rate in Hong Kong
has been substantially higher than the rates prevailing in our major trading partners in recent
years. The restructuring of the economy is accomplished by the shrinking of the share of
9 Dornbusch, R. (1973), "Devaluation, Money and Non-Traded Goods," American Economic Review, Vol. 63, pp. 871-880.
87
tradeables in total output. The relocation of low-end manufacturing processes to South China
pushes up labour productivity in the tradeable sector. Labour productivity growth in the non-
tradeable sector has been reduced by rising emigration from Hong Kong. Emigrants are mostly
professionals working in the service sectors. Coupled with the faster growth of the non-
tradeable sector and the tight labour market, money wages in the non-tradeable sector are rising
faster than wages in the tradeable sector. All these three factors work in the same direction in
making domestic inflation rate higher than the world inflation rate.

88
Appendix 7
Natural Rate of Unemployment
The concept of the natural rate of unemployment was introduced by Friedman who
wrote that:
At any moment of time, there is some level of unemployment which has the property that it is
consistent with equilibrium in the structure of real wage rates. At that level of
unemployment, real wage rates are tending on the average to all at a "normal" secular
rate, i.e. at a rate that can be indefinitely maintained so long as capital formation,
technological improvements, etc., remain on their long-run trends. A lower level of
unemployment is an indication that there is an excess demand for labour that will
produce upward pressure on real wage rates. A higher level of unemployment is an
indication that there is an excess supply of labour that will produce downward pressure
on real wage rates. (Friedman, 1968 p.8)10
The natural rate is therefore an equilibrium concept. It is the rate of unemployment when the
economy is at long run equilibrium.
Empirically, Okun (1974) suggested to identify the natural rate of unemployment at the
level when the output of the economy is at its potential or capacity level.11
10
Friedman, M. (1968), "The Role of Monetary Policy," American Economic
Review, March, 58(1): 1-17.
11
Okun, A.M. (1974), "Unemployment and Output," Brookings Papers on
Economic Activity, 2:495-505.
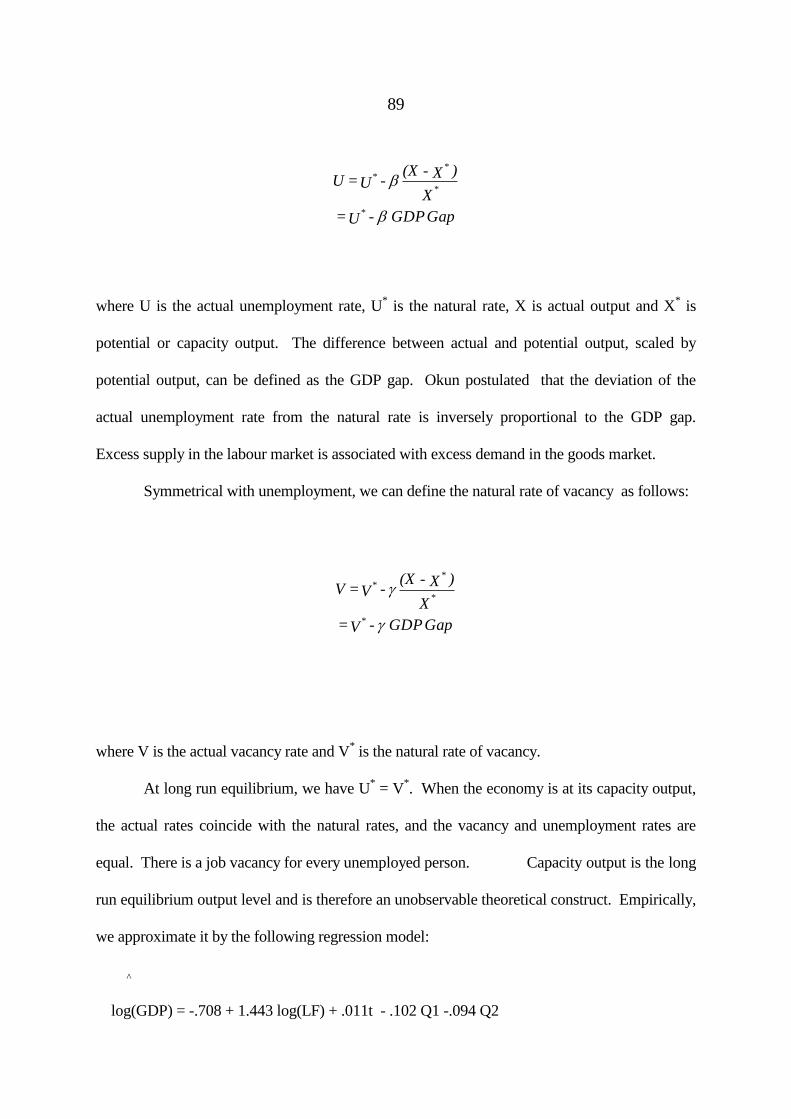
89
where U is the actual unemployment rate, U* is the natural rate, X is actual output and X
* is
potential or capacity output. The difference between actual and potential output, scaled by
potential output, can be defined as the GDP gap. Okun postulated that the deviation of the
actual unemployment rate from the natural rate is inversely proportional to the GDP gap.
Excess supply in the labour market is associated with excess demand in the goods market.
Symmetrical with unemployment, we can define the natural rate of vacancy as follows:
where V is the actual vacancy rate and V* is the natural rate of vacancy.
At long run equilibrium, we have U* = V
*. When the economy is at its capacity output,
the actual rates coincide with the natural rates, and the vacancy and unemployment rates are
equal. There is a job vacancy for every unemployed person. Capacity output is the long
run equilibrium output level and is therefore an unobservable theoretical construct. Empirically,
we approximate it by the following regression model:
^
log(GDP) = -.708 + 1.443 log(LF) + .011t - .102 Q1 -.094 Q2
Gap GDP - U =
X
)X - (X - U = U
*
*
**
Gap GDP - V =
X
)X - (X - V = V
*
*
**
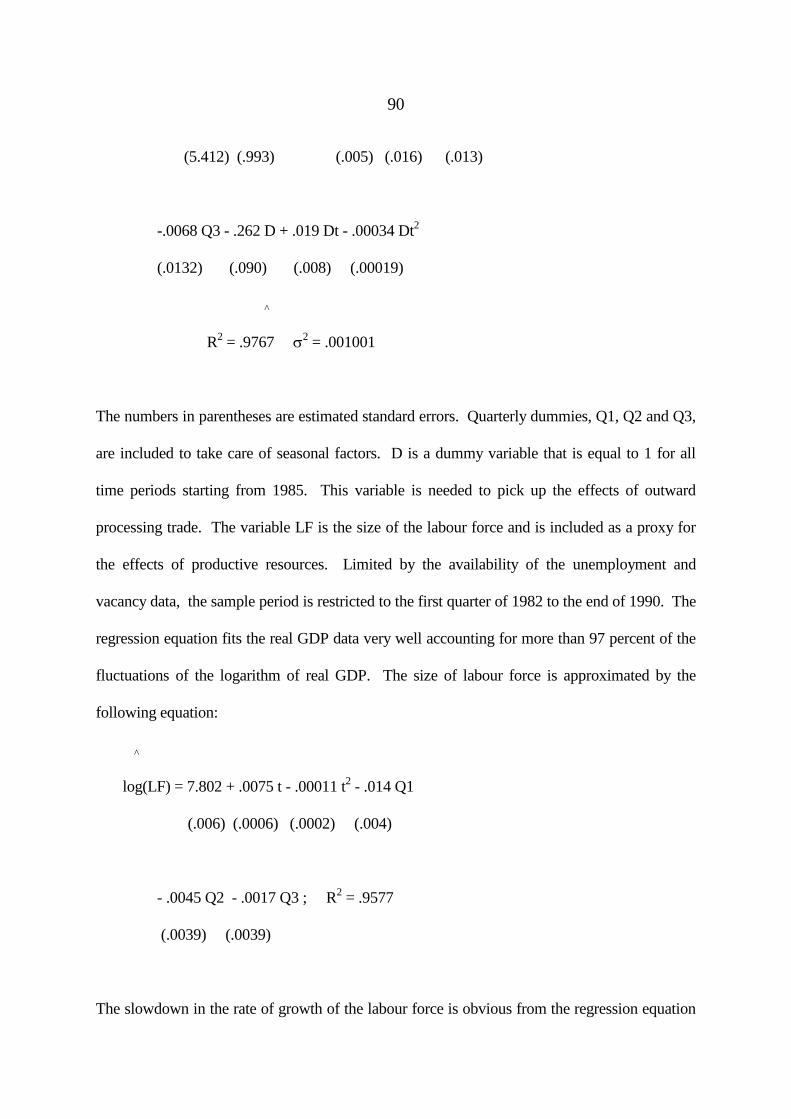
90
(5.412) (.993) (.005) (.016) (.013)
-.0068 Q3 - .262 D + .019 Dt - .00034 Dt2
(.0132) (.090) (.008) (.00019)
^
R2 = .9767
2 = .001001
The numbers in parentheses are estimated standard errors. Quarterly dummies, Q1, Q2 and Q3,
are included to take care of seasonal factors. D is a dummy variable that is equal to 1 for all
time periods starting from 1985. This variable is needed to pick up the effects of outward
processing trade. The variable LF is the size of the labour force and is included as a proxy for
the effects of productive resources. Limited by the availability of the unemployment and
vacancy data, the sample period is restricted to the first quarter of 1982 to the end of 1990. The
regression equation fits the real GDP data very well accounting for more than 97 percent of the
fluctuations of the logarithm of real GDP. The size of labour force is approximated by the
following equation:
^
log(LF) = 7.802 + .0075 t - .00011 t2 - .014 Q1
(.006) (.0006) (.0002) (.004)
- .0045 Q2 - .0017 Q3 ; R2 = .9577
(.0039) (.0039)
The slowdown in the rate of growth of the labour force is obvious from the regression equation

91
which indicates on average a deceleration of .022 percent per quarter.
To remove bias, estimated capacity output and GDP gap (Gaphat) are computed as:
^ ^
GDP* = exp( log(GDP) + .5
2) ,
Gaphat = (GDP - GDP*) / GDP
* ,
respectively.
When we regress unemployment rate and vacancy rate on the estimated GDP gap, we
get:
^
Ut = .0264 - .153 Gaphatt-1 R2 = .2112
(.00065) (.074)
^
Vt = .0264 + .094 Gaphatt-1 R2 = .1833
(.00065) (.056)
The lagged value of GDP gap, Gaphatt-1, is used as regressor to allow for inertia in the labour
market. The long run equilibrium restriction is imposed. All the parameter estimates have the
expected signs, and the natural rate of unemployment or vacancy is very precisely estimated at
2.64 percent, with a standard error of .00065. A 95% confidence interval of the natural rate of
unemployment is from 2.51% to 2.77%. A one percent increase in the GDP gap will decrease
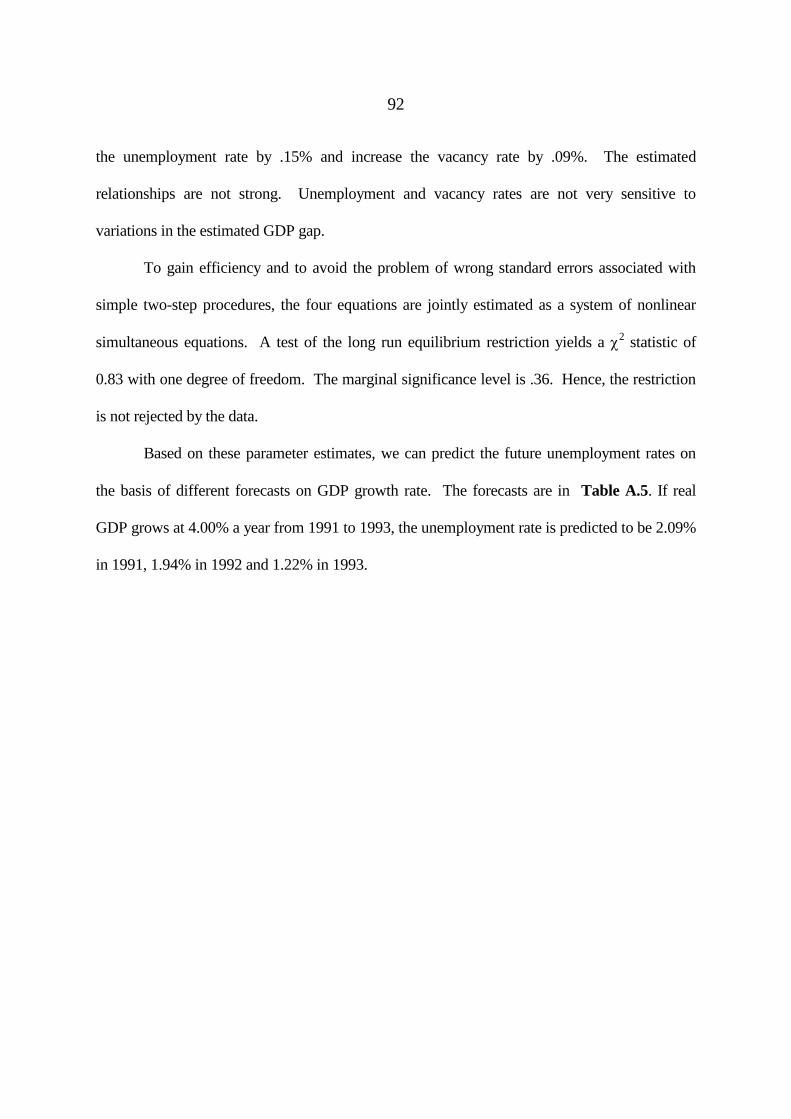
92
the unemployment rate by .15% and increase the vacancy rate by .09%. The estimated
relationships are not strong. Unemployment and vacancy rates are not very sensitive to
variations in the estimated GDP gap.
To gain efficiency and to avoid the problem of wrong standard errors associated with
simple two-step procedures, the four equations are jointly estimated as a system of nonlinear
simultaneous equations. A test of the long run equilibrium restriction yields a 2 statistic of
0.83 with one degree of freedom. The marginal significance level is .36. Hence, the restriction
is not rejected by the data.
Based on these parameter estimates, we can predict the future unemployment rates on
the basis of different forecasts on GDP growth rate. The forecasts are in Table A.5. If real
GDP grows at 4.00% a year from 1991 to 1993, the unemployment rate is predicted to be 2.09%
in 1991, 1.94% in 1992 and 1.22% in 1993.

93
Table A.5: Forecasts of Unemployment Rates
Percent
GDP U GDP U GDP U
1991 4.00 2.09 4.00 2.09 4.00 2.09
1992 4.00 1.94 5.00 1.83 6.00 1.71
1993 4.00 1.22 5.00 0.93 6.00 0.64
The point forecasts of unemployment rates are averages of quarterly figures. The
forecasts in 1992 are found to be not very sensitive to changes in the assumed real GDP growth
rates. This is due to a combination of two factors. Firstly, the estimated Okun curve is
relatively steep. One percent increase in GDP gap will only reduce unemployment rate by .15
percent. Secondly, the differences in the projected GDP gap in 1992 under the three different
scenarios are not that far apart. The differences only become significant in 1993.
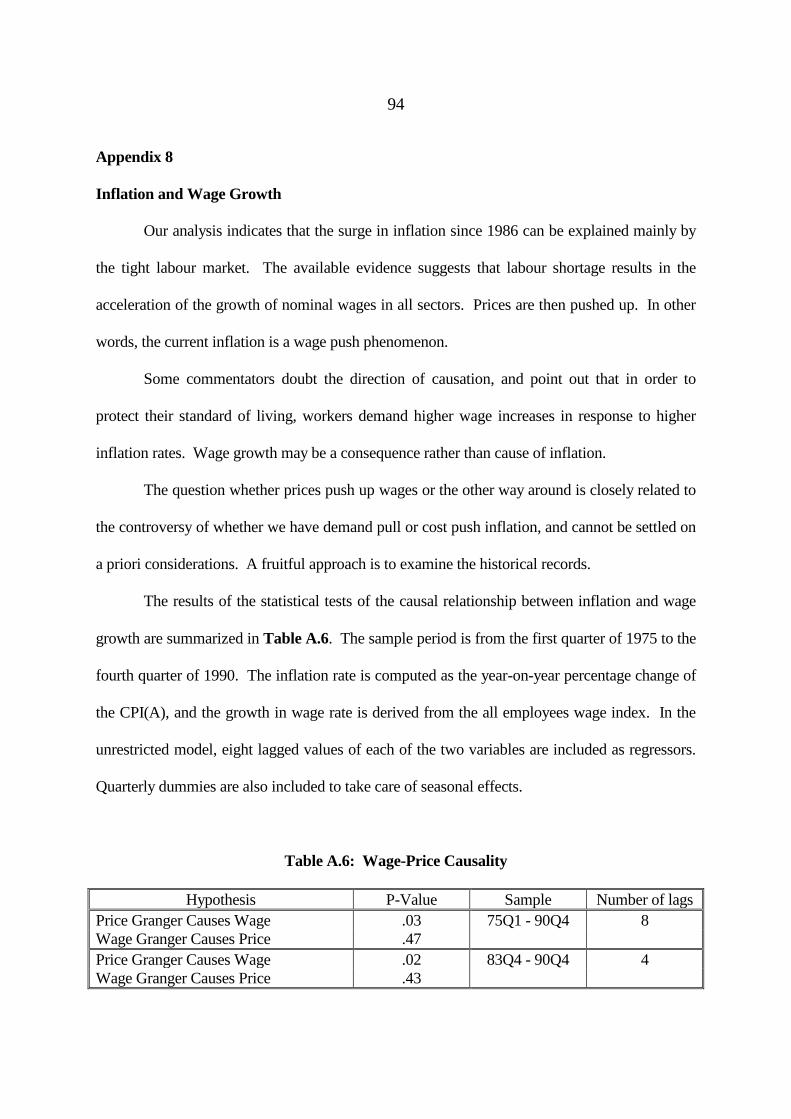
94
Appendix 8
Inflation and Wage Growth
Our analysis indicates that the surge in inflation since 1986 can be explained mainly by
the tight labour market. The available evidence suggests that labour shortage results in the
acceleration of the growth of nominal wages in all sectors. Prices are then pushed up. In other
words, the current inflation is a wage push phenomenon.
Some commentators doubt the direction of causation, and point out that in order to
protect their standard of living, workers demand higher wage increases in response to higher
inflation rates. Wage growth may be a consequence rather than cause of inflation.
The question whether prices push up wages or the other way around is closely related to
the controversy of whether we have demand pull or cost push inflation, and cannot be settled on
a priori considerations. A fruitful approach is to examine the historical records.
The results of the statistical tests of the causal relationship between inflation and wage
growth are summarized in Table A.6. The sample period is from the first quarter of 1975 to the
fourth quarter of 1990. The inflation rate is computed as the year-on-year percentage change of
the CPI(A), and the growth in wage rate is derived from the all employees wage index. In the
unrestricted model, eight lagged values of each of the two variables are included as regressors.
Quarterly dummies are also included to take care of seasonal effects.
Table A.6: Wage-Price Causality
Hypothesis P-Value Sample Number of lags
Price Granger Causes Wage .03 75Q1 - 90Q4 8
Wage Granger Causes Price .47
Price Granger Causes Wage .02 83Q4 - 90Q4 4
Wage Granger Causes Price .43
95
The test of the hypothesis that price Granger causes wage yields a marginal significance level of
.03, and can thus be rejected at conventional levels. The hypothesis that the causation is from
wage growth to inflation cannot be rejected. The result shows that past inflation rates offer no
information on current wage growth, but past wage growth contributes significantly to the
explanation of current inflation. Higher growth in wages would lead to higher inflation. The
data are consistent with the view that prices are pushed up by wages, but not vice versa.
To see whether the results are sensitive to the sample period, the tests are conducted
again on another sample. The second sample is a subset of the first and starts in the fourth
quarter of 1983 and is intended to cover only the period of the linked exchange rate system. The
results of the second sample are similar to that of the first. The causal structure with wage
growth causing inflation remains the same.

96
Appendix 9
Unit Labour Cost
Unit labour cost measures the current labour cost in producing one unit of output and is
defined as follows:
where ULC is unit labour cost, W is nominal wage rate, L is labour input and Q is output level.
Changes in unit labour cost depend on the relative movement in labour productivity and
nominal wage, and will increase when wage growth is larger than the increase in labour
productivity.
To compute ULC by sector, we need to compute the labour productivity by sector.
Labour productivity is given by the real value added per employee in the sector adjusted for
changes in the hours of work over time. Unfortunately the government publishes only statistics
on value added by sector at current prices. To compute the value added in constant prices we
need deflators by sector. To derive the manufacturing deflator we begin by computing the
manufacturing value added at constant prices indirectly. It is the difference between
manufacturing output at constant prices and manufacturing intermediate inputs at constant
prices. Now statistics on manufacturing output and intermediate inputs at current prices are
available. One requires only their deflators to compute their values at constant prices. The
L
Q
W =
Q
L W =
Output
Cost Labour = ULC

97
deflator of domestic exports is used as a proxy for the deflator of manufacturing output. The
deflator of imported materials and semi-manufactures is used as a proxy for the deflator of
intermediate inputs. This should be a good approximation as most of the intermediate inputs
used in manufacturing in Hong Kong are imported. Having computed manufacturing value
added at constant prices, the ratio between its value at current prices and its value at constant
prices yields the deflator for manufacturing value added. This procedure was devised by Sung
(1991)12
.
For the non-manufacturing sectors, most of which are service sectors, there is no
information on intermediate inputs. Therefore, their deflators cannot be estimated in the same
way as the manufacturing sector. Instead it is derived indirectly by taking the GDP deflator as
the weighted sum between the deflator for manufacturing value added and the deflator for value
added of all the other sectors. The weights adopted are their proportions in GDP. The deflator
so derived is taken to apply to all non-manufacturing sectors.
12 Sung, Yun-Wing (1991), "Competitiveness of Hong Kong Manufacturing Versus
its Major Competitors," Department of Economics, The Chinese University of Hong
Kong, July 1991.

98
Authors
Dr. Richard Y.C. Wong is currently Director of the Hong Kong Centre for Economic
Research. He is also Senior Lecturer in Economics, Director of the Hong Kong and Asia-
Pacific Economies Research Programme at the Chinese University of Hong Kong, and
Secretary General of the East Asian Economic Association. Dr. Wong received his A.B., A.M.,
and Ph.D. in Economics from the University of Chicago. He was Visiting Scholar at the
National Opinion Research Centre, University of Chicago in 1985 and at the Hoover Institution,
Stanford University in 1989. His research interest is in macroeconomics, political economy of
public policy, and the Hong Kong economy.
Dr. Pak-Wai Liu is currently Research Director of the Hong Kong Centre for Economic
Research. He is also Reader in Economics, Chairman of the Department of Economics and
Director of the Hong Kong and Asia-Pacific Economies Research Programme at The Chinese
University of Hong Kong, Managing Editor of the Asian Economic Journal and member of the
Hong Kong Committee for Pacific Economic Co-operation. Dr. Liu received his A.B. in 1971
from Princeton University, M.A. in Economics and M.A. in Education and Ph.D. in Economics
in 1977 from Stanford University. He was Visiting Scholar at Harvard-Yenching Institute,
Harvard University in 1981-82. His research interests cover the areas of applied theory, labour
market and employment, and the Hong Kong economy.
Dr. Alan K.F. Siu is currently Lecturer in Economics at the University of Hong Kong. He did
his undergraduate work in economics at Brandeis University, and obtained his Ph.D. degree in
Economics from Harvard University in 1984. His research interests are the economics of
research and development, productivity growth, technical change and statistical computing.