inferring organic content of sediments by scanning reflectance spectroscopy (380–730 nm):...
TRANSCRIPT

NOTE
Inferring organic content of sediments by scanningreflectance spectroscopy (380–730 nm): applying a novelmethodology in a case study from proglacial lakesin Norway
Mathias Trachsel • Bjørn Christian Kvisvik •
Pal Ringkjøb Nielsen • Jostein Bakke •
Atle Nesje
Received: 18 May 2012 / Accepted: 11 July 2013 / Published online: 17 September 2013
� Springer Science+Business Media Dordrecht 2013
Abstract Reflectance spectroscopy in the visible
spectrum (VIS-RS) is a method that has been
successfully applied for inferring organic content of
sediments. In this study, we test the applicability of
VIS-RS to lake sediments in Norway. On the one hand
we use conventional, established algorithms for infer-
ring organic content of sediments, on the other hand
we test the potential of multivariate calibration
techniques to infer organic content. For absolute
quantification of organic content, conventional Corg
measurements are needed when using conventional
algorithms as well as when employing multivariate
calibration techniques. Both, conventional algorithms
and multivariate calibrations, result in estimates of
organic content closely mirroring loss-on-ignition
measurements. When using multivariate calibration
techniques, a conventional Corg measurement every
5 cm is sufficient to obtain estimates of organic matter
that are more accurate than those obtained by means of
conventional algorithms. Therefore, the potential of
multivariate calibration techniques and VIS-RS to
substitute measurements of more time consuming and
costly sediment parameters (e.g. clay minerals) should
be tested.
Keywords Reflectance spectroscopy �Multivariate calibration � LOI � Organic carbon
Introduction
Loss-on-ignition at 550 �C (LOI550) is a method
commonly used to determine the organic content of
sediments (Heiri et al. 2001; Nesje et al. 2004) and is
one of the most widely measured sediment parameters
(Heiri et al. 2001). Organic matter in a sediment is
composed of autochthonous organic production in a
lake, and allochthonous input of terrestrial organic
matter. Additionally, organics in sediments are subject
to microbial decomposition and alteration (Janbu et al.
2011). The concentration of organic matter in
M. Trachsel (&) � J. Bakke � A. Nesje
Department of Earth Science, University of Bergen,
Allegaten 41, Bergen, Norway
e-mail: [email protected]
J. Bakke
e-mail: [email protected]
A. Nesje
e-mail: [email protected]
M. Trachsel � B. C. Kvisvik � J. Bakke � A. Nesje
Bjerknes Centre for Climate Research, University of
Bergen, Allegaten 55, Bergen, Norway
e-mail: [email protected]
Present Address:
M. Trachsel
Department of Biology, University of Bergen,
Thormøhlensgate 53 A, Bergen, Norway
B. C. Kvisvik � P. R. Nielsen
Department of Geography, University of Bergen,
Fosswinckelsgate 6, Bergen, Norway
e-mail: [email protected]
123
J Paleolimnol (2013) 50:583–592
DOI 10.1007/s10933-013-9739-1

sediments is influenced by the amount of allochtho-
nous clastic sediment input (Nesje et al. 2004). LOI550
of sediments of proglacial lakes is therefore inversely
related to glacier activity (Dahl and Nesje 1996; Nesje
et al. 2001). Scanning in situ reflectance spectroscopy
in the visible spectrum (380—730 nm; VIS-RS) is a
non-destructive sediment scanning technique. VIS-RS
has been applied successfully in many studies to infer
the amount of organic material (Rein and Sirocko
2002; Wolfe et al. 2006; Michelutti et al. 2010), the
amount of clastic material (Rein et al. 2005), for
developing climate reconstructions based on calibra-
tion in time (von Gunten et al. 2009; Trachsel et al.
2010), and for general characterisations of sediments
(Debret et al. 2011). Specific compounds (e.g. pig-
ments, clay minerals) show distinct absorption/reflec-
tion characteristics, and three different algorithm types
for extracting reflectance characteristics were pro-
posed (Rein and Sirocko 2002; Wolfe et al. 2006).
These algorithms are based on relative absorption
band depths and relative absorption band areas
respectively (i.e. the absorption change compared to
a theoretical continuum), and on ratios of reflectances
in two wavelengths.
Rein and Sirocko (2002) and Debret et al. (2011)
additionally demonstrated different reflectance prop-
erties of constituents of organic matter [e.g. carote-
noids, chlorins (chlorophyll a derivatives)] or altered
organic matter.
Algorithms used in these studies were specifically
developed for the sediment type analysed. For instance
the relative absorption band depth at 670 nm was used
for sediments rich in organics while the ratio between
reflectances at 570 and 630 nm was preferred for
exclusively clastic sediments. The three lakes included
in the present study experienced massive changes in
sedimentation regime throughout the sediment
sequences considered (presence and absence of gla-
ciers). The lakes have therefore undergone changes
from organic rich lakes to lakes dominated by clastic
sedimentation. Because of these factors, it is not a
priori clear which of the algorithms proposed is best
suited for inferring the amount of organic matter.
Relative absorption band areas, relative absorption
band depths, and ratios of reflectances in two specific
wave-length have in common that they only use a part
of the reflectance spectrum for inference, but do not
use data from other parts of the spectrum that might be
useful as well. In contrast to VIS-RS, in Fourier
transform infrared spectroscopy, the entire measured
spectrum is calibrated to specific compounds (e.g.
Corg, biogenic silica) by means of multivariate
calibration (Rosen et al. 2010).
In this study, we first tested the applicability of VIS-
RS to sediments in Northern Europe using two
conventional algorithms (min670 and d590d690, see
‘‘Materials and methods’’ section) that previously have
been successfully applied. We then tested the potential
of two multivariate calibration techniques partial least
squares regression (PLS) and random forests for
inferring LOI550. Preliminary tests with nine lakes
showed that calibrations based on training sets were
not successful. In this study, we therefore concentrated
on internal calibrations of individual lakes, i.e. cali-
brating on a part of the data and predicting the data not
used for calibration (Vogel et al. 2008). After first
successful tests of this approach, we assessed how
much data was needed for calibration to accurately
infer LOI550 values. At last we compared the accuracy
of LOI550 inferred by multivariate calibration and by
conventional algorithms.
Study sites
The study sites (lakes) are all situated along the western
coast of Norway (Fig. 1), and are all receiving (or
received) glacial melt water. Lake Goddalsvatnet
(60�1005600N, 6�2002800E) is situated to the North-East
of Maurangerfjorden, a branch of Hardangerfjorden, at an
altitude of 532 m a.s.l. Glaciers from the western side of
the Folgefonna icecap drain melt water into Goddalsvat-
net. The catchment area has a total of 65.5 km2. The
bedrock consists of gneiss, migmatite, andesite, dacite
and meta-basalt (Bryhni et al. 2007). The sediment core,
GOP, was retrieved in a distal position of the lake and
spans a late Holocene time interval. LOI550 values vary
between 0.3 and 20 % (Table 1).
The lake Lower Sørsendalsvatnet (61�6703500N,
6�2808500E) is located at 918 m a.s.l. to the south of
Gloppefjorden, a south-easterly trending branch of
Nordfjorden. The glacier Blabreen covers one quarter
of 8.5 km2 catchment area. The bedrock in the area
consists of migmatite, granite, feldspar and augen-
gneiss. The core (SOP) spans the entire Holocene
(Bakke et al. 2013) and a LOI550 range from 0.5 to
17.5 % (Table 1).
Lake Nattmalsvatn (N69�1303900, E15�5901400,160 m a.s.l.) is situated at Andøya, an archipelago of
584 J Paleolimnol (2013) 50:583–592
123
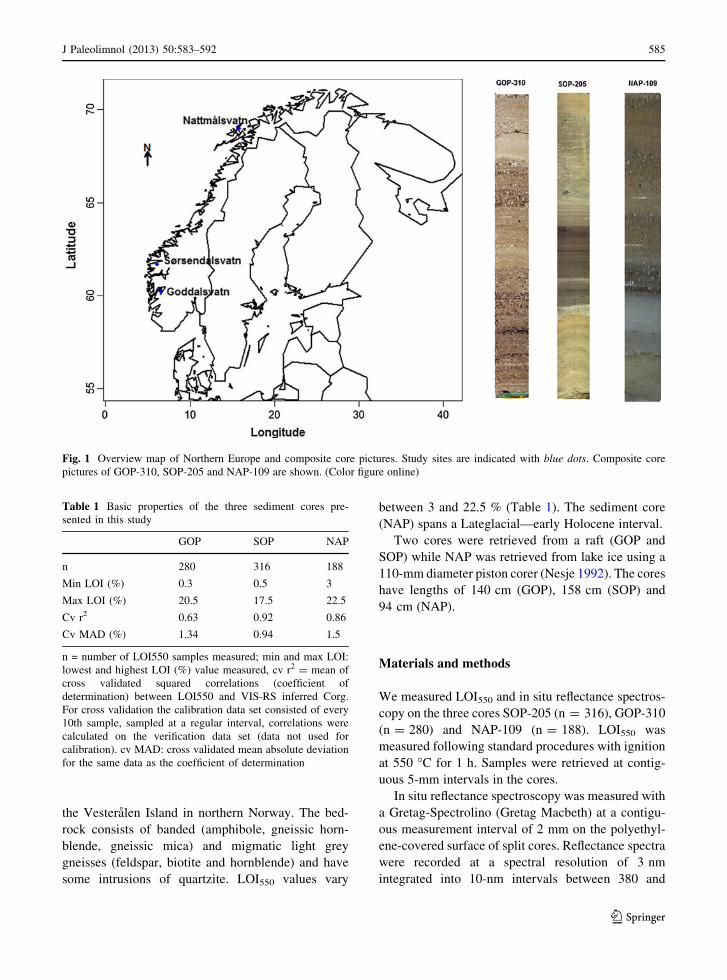
the Vesteralen Island in northern Norway. The bed-
rock consists of banded (amphibole, gneissic horn-
blende, gneissic mica) and migmatic light grey
gneisses (feldspar, biotite and hornblende) and have
some intrusions of quartzite. LOI550 values vary
between 3 and 22.5 % (Table 1). The sediment core
(NAP) spans a Lateglacial—early Holocene interval.
Two cores were retrieved from a raft (GOP and
SOP) while NAP was retrieved from lake ice using a
110-mm diameter piston corer (Nesje 1992). The cores
have lengths of 140 cm (GOP), 158 cm (SOP) and
94 cm (NAP).
Materials and methods
We measured LOI550 and in situ reflectance spectros-
copy on the three cores SOP-205 (n = 316), GOP-310
(n = 280) and NAP-109 (n = 188). LOI550 was
measured following standard procedures with ignition
at 550 �C for 1 h. Samples were retrieved at contig-
uous 5-mm intervals in the cores.
In situ reflectance spectroscopy was measured with
a Gretag-Spectrolino (Gretag Macbeth) at a contigu-
ous measurement interval of 2 mm on the polyethyl-
ene-covered surface of split cores. Reflectance spectra
were recorded at a spectral resolution of 3 nm
integrated into 10-nm intervals between 380 and
Fig. 1 Overview map of Northern Europe and composite core pictures. Study sites are indicated with blue dots. Composite core
pictures of GOP-310, SOP-205 and NAP-109 are shown. (Color figure online)
Table 1 Basic properties of the three sediment cores pre-
sented in this study
GOP SOP NAP
n 280 316 188
Min LOI (%) 0.3 0.5 3
Max LOI (%) 20.5 17.5 22.5
Cv r2 0.63 0.92 0.86
Cv MAD (%) 1.34 0.94 1.5
n = number of LOI550 samples measured; min and max LOI:
lowest and highest LOI (%) value measured, cv r2 = mean of
cross validated squared correlations (coefficient of
determination) between LOI550 and VIS-RS inferred Corg.
For cross validation the calibration data set consisted of every
10th sample, sampled at a regular interval, correlations were
calculated on the verification data set (data not used for
calibration). cv MAD: cross validated mean absolute deviation
for the same data as the coefficient of determination
J Paleolimnol (2013) 50:583–592 585
123
730 nm. Each spectrum was corrected accounting for
illumination and transparency effects by dividing it by
the spectrum of a transparency-covered white standard
(BaSO4). Data was subsequently integrated to inter-
vals of 5 mm for comparison with LOI550.
In the literature, many algorithms have been
proposed to extract information from reflectance
spectra (Rein and Sirocko 2002; Wolfe et al. 2006;
von Gunten et al. 2009; Trachsel et al. 2010; Debret
et al. 2011). They are all based on relative absorption
band depths and relative absorption band areas,
respectively (i.e. the absorption change compared to
a theoretical continuum), and on ratios of reflectances
in two wavelengths. These algorithms are reducing the
effects of water content and changing grain-sizes on
results extracted from reflectance spectra (Rein and
Sirocko 2002). In this study, we used the algorithms
relative absorption band depth at 670 nm (hereafter
referred to as min670, calculated as ((6 9 R590 ?
7 9 R730)/13)/R670, where Rx indicates reflectance
at x nm, indicative of chlorins (Rein and Sirocko 2002)
and the ratio between the reflectances at 590 and
690 nm. (590d690, calculated as R590/R690) indica-
tive of terrigenous mineroclastics (Rein and Sirocko
2002; Trachsel et al. 2010). We chose an algorithm
indicative of chlorins as a proxy for organic matter
since first derivatives of spectra did not indicate the
presence of altered organic matter in the sediments
(Debret et al. 2011). The reflectance change between
590 and 690 nm indicative of terrigenous mineroclas-
tics is mainly caused by clay minerals (chlorite, illite
and biotite, USGS 2010), whereas most other minerals
have no diagnostic reflectance features in the visible
spectrum. The algorithm derived, dimensionless data
series were re-sampled to an interval of 5 mm. We then
used standard major axis regression (Legendre and
Legendre 1998, a type II regression also referred to as
scaling) to calibrate re-sampled VIS-RS data to
LOI550. The accuracy of these LOI550 estimates was
assessed calculating mean absolute deviations
(MAD ¼ 1=nR LOIi � VISij j where n is the number
of samples, VISi is the ith VIS-RS inferred LOI
concentration and LOIi is the ith LOI sample).
Debret et al. (2011) used first derivatives to describe
reflectance spectra. Following this idea, we created a
data set consisting of first derivatives and ratios among
reflectances in adjacent wavelengths [i.e. (R440–R430)/
10, (R450–R440)/10 … (R730-R720)/10 and R430/
R440, R440/R450 … R720/R730] for multivariate
calibration. Measurements in the wave-length between
380 and 420 nm were not included in the calibration
data set because of low signal to noise ratios in these
wavelengths (Rein 2003). Prior to multivariate calibra-
tion, we tested to which extent the new data set was
related to LOI550 by means of redundancy analysis
(RDA, van den Wollenberg 1977).
To calibrate the aforementioned data set to LOI550,
we used the two multivariate techniques of random
forests (Breiman 2001) and PLS (Martens and Naes
1989). Random forests are computational learning
algorithms consisting of a set of regression trees
(Breiman et al. 1984; De’ath and Fabricius 2000). We
used 500 trees in which 21 variables (i.e. 1/3 of the 62
available variables) were randomly sampled at each
nod. PLS is a dimension reduction technique that
reduces a large number of predictors to a small number
of components (latent variables) that are then used in
place of the original predictors. Unlike similar tech-
niques, such as principal component regression,
components are chosen to provide maximum correla-
tion with the dependent variable (Martens and Naes
1989; de Jong 1993). The number of components
included in the model was assessed by tenfold cross-
validation: Only components leading to a reduction of
the root mean square error of prediction of more than
5 % were retained in the model (Birks 1998).
Preliminary tests including nine lakes showed that
calibrations based on training sets (using data from
several lakes to predict LOI550 of sediments not used
for calibration) were not successful. We therefore
developed VIS-RS based LOI inference models for
each lake individually (Vogel et al. 2008). To test the
performance of the three calibration approaches (i.e.
conventional univariate and two multivariate), we
divided the measurements obtained on one core into a
calibration and a verification data set. We additionally
wanted to assess how much data was required in the
calibration to obtain meaningful estimates of LOI550.
We therefore varied the amount of data used for
calibration between 3 and 50 % of the total data, and
applied the models to a verification data set consisting
of the data not used for calibration (i.e. between 97 and
50 % of the data). Samples used for calibration were
randomly chosen among all samples (sampling with-
out replacement). For a given amount of data (e.g.
50 %) this procedure was repeated 1,000 times.
Performance was assessed calculating mean absolute
deviation (MAD) for the verification data set.
586 J Paleolimnol (2013) 50:583–592
123
We then tested two additional, realistic ways of
constructing calibration and verification data sets. We
used data sampled at regular intervals of 5 cm (i.e.
every 10th measurement) as calibration data set and
used the remaining data for verification. In total, this
approach resulted in 10 calibration and verification
possibilities. In a realistic study, we would have had
10 % of the data measured conventionally (i.e. a
sample every 5 cm) and would have had to decide
based on this constrained data set which method to use
for inferring LOI throughout the core. We therefore
split the data set consisting of a sample every 5 cm in
two equal parts consisting of estimates of LOI550 at
10 cm intervals. We thereby built new calibration and
verification data sets (twofold cross-validation, result-
ing in 20 calibration and verification possibilities) that
were used to select the best model (i.e. lowest MAD)
for the entire core. All numerical analyses were carried
out using R (R Development Core Team 2011) and its
add-on packages PLS (Wehrens and Mevik 2007),
random forest (Liaw and Wiener 2011), boot (Canty
and Ripley 2011) and lmodel2 (Legendre 2013).
Results
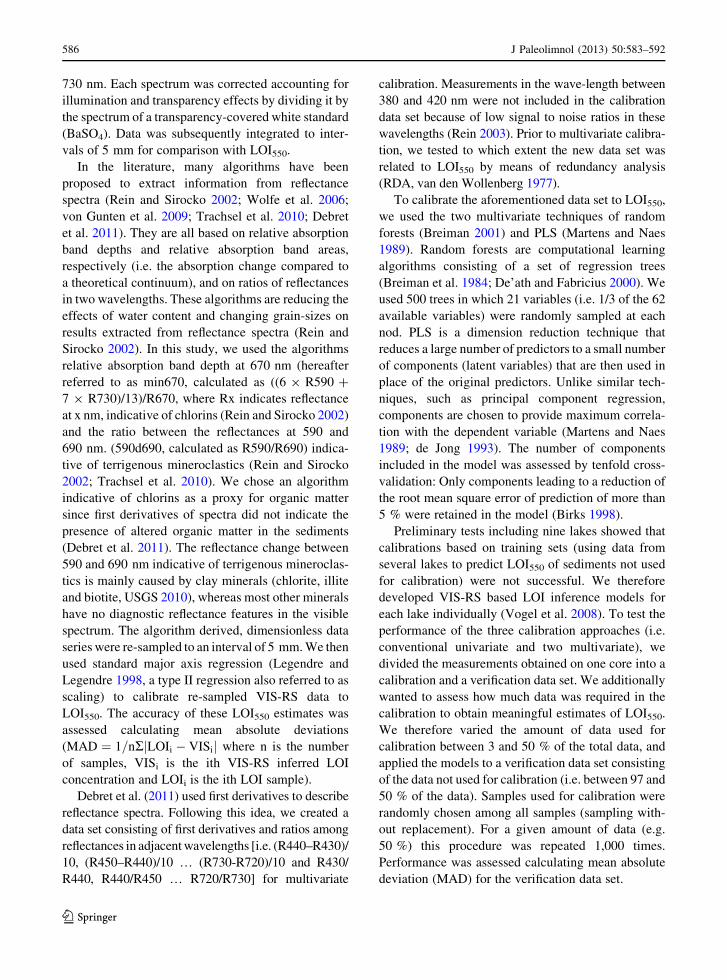
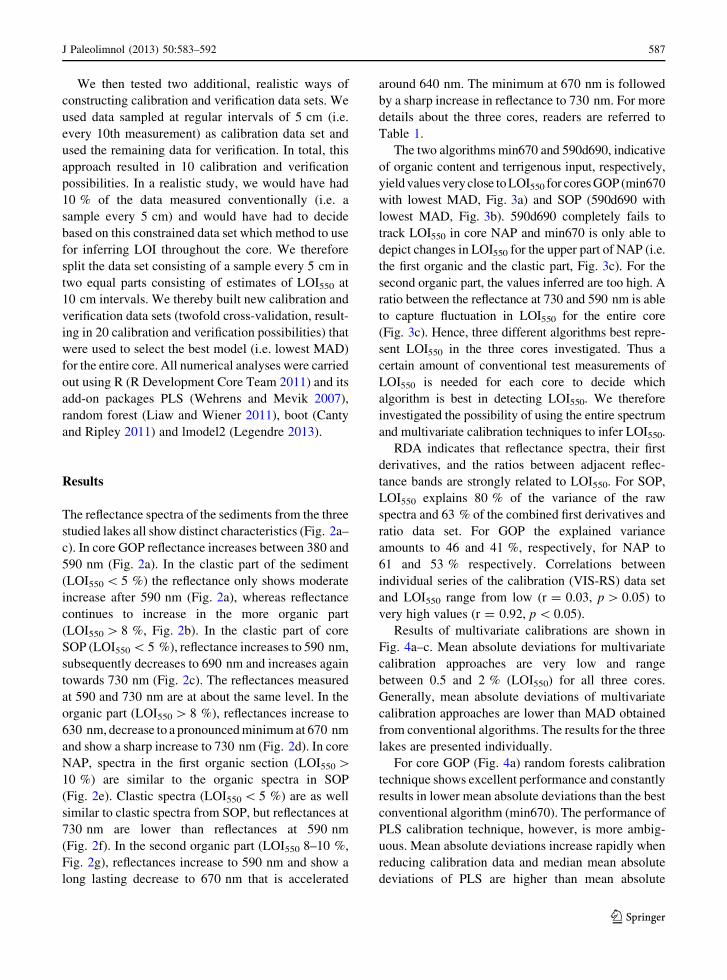
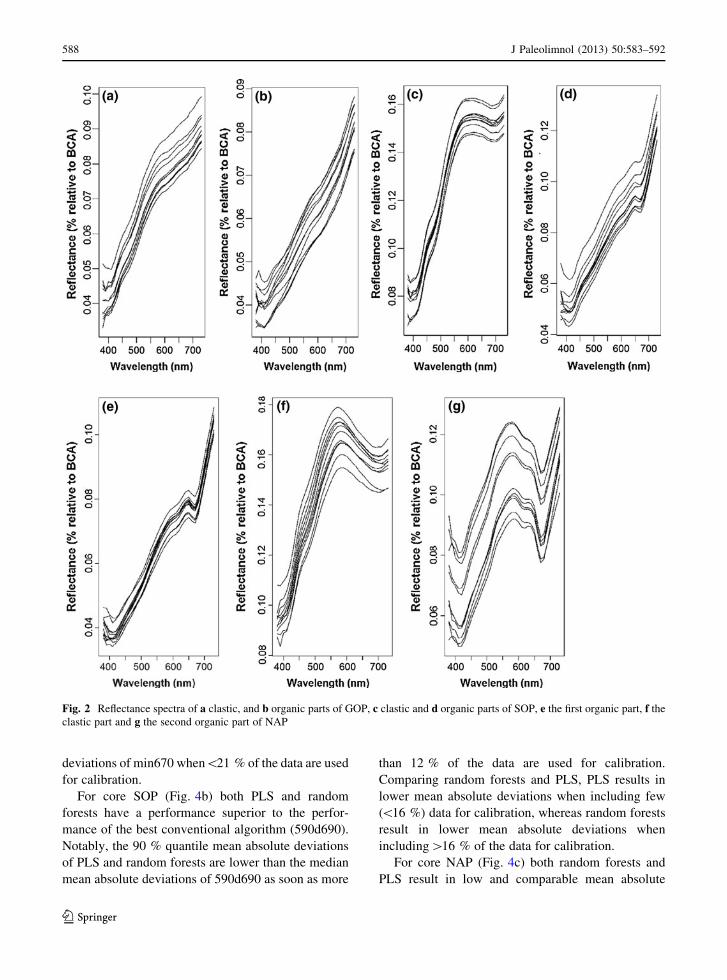
The reflectance spectra of the sediments from the three
studied lakes all show distinct characteristics (Fig. 2a–
c). In core GOP reflectance increases between 380 and
590 nm (Fig. 2a). In the clastic part of the sediment
(LOI550 \ 5 %) the reflectance only shows moderate
increase after 590 nm (Fig. 2a), whereas reflectance
continues to increase in the more organic part
(LOI550 [ 8 %, Fig. 2b). In the clastic part of core
SOP (LOI550 \ 5 %), reflectance increases to 590 nm,
subsequently decreases to 690 nm and increases again
towards 730 nm (Fig. 2c). The reflectances measured
at 590 and 730 nm are at about the same level. In the
organic part (LOI550 [ 8 %), reflectances increase to
630 nm, decrease to a pronounced minimum at 670 nm
and show a sharp increase to 730 nm (Fig. 2d). In core
NAP, spectra in the first organic section (LOI550 [10 %) are similar to the organic spectra in SOP
(Fig. 2e). Clastic spectra (LOI550 \ 5 %) are as well
similar to clastic spectra from SOP, but reflectances at
730 nm are lower than reflectances at 590 nm
(Fig. 2f). In the second organic part (LOI550 8–10 %,
Fig. 2g), reflectances increase to 590 nm and show a
long lasting decrease to 670 nm that is accelerated
around 640 nm. The minimum at 670 nm is followed
by a sharp increase in reflectance to 730 nm. For more
details about the three cores, readers are referred to
Table 1.
The two algorithms min670 and 590d690, indicative
of organic content and terrigenous input, respectively,
yield values very close to LOI550 for cores GOP (min670
with lowest MAD, Fig. 3a) and SOP (590d690 with
lowest MAD, Fig. 3b). 590d690 completely fails to
track LOI550 in core NAP and min670 is only able to
depict changes in LOI550 for the upper part of NAP (i.e.
the first organic and the clastic part, Fig. 3c). For the
second organic part, the values inferred are too high. A
ratio between the reflectance at 730 and 590 nm is able
to capture fluctuation in LOI550 for the entire core
(Fig. 3c). Hence, three different algorithms best repre-
sent LOI550 in the three cores investigated. Thus a
certain amount of conventional test measurements of
LOI550 is needed for each core to decide which
algorithm is best in detecting LOI550. We therefore
investigated the possibility of using the entire spectrum
and multivariate calibration techniques to infer LOI550.
RDA indicates that reflectance spectra, their first
derivatives, and the ratios between adjacent reflec-
tance bands are strongly related to LOI550. For SOP,
LOI550 explains 80 % of the variance of the raw
spectra and 63 % of the combined first derivatives and
ratio data set. For GOP the explained variance
amounts to 46 and 41 %, respectively, for NAP to
61 and 53 % respectively. Correlations between
individual series of the calibration (VIS-RS) data set
and LOI550 range from low (r = 0.03, p [ 0.05) to
very high values (r = 0.92, p \ 0.05).
Results of multivariate calibrations are shown in
Fig. 4a–c. Mean absolute deviations for multivariate
calibration approaches are very low and range
between 0.5 and 2 % (LOI550) for all three cores.
Generally, mean absolute deviations of multivariate
calibration approaches are lower than MAD obtained
from conventional algorithms. The results for the three
lakes are presented individually.
For core GOP (Fig. 4a) random forests calibration
technique shows excellent performance and constantly
results in lower mean absolute deviations than the best
conventional algorithm (min670). The performance of
PLS calibration technique, however, is more ambig-
uous. Mean absolute deviations increase rapidly when
reducing calibration data and median mean absolute
deviations of PLS are higher than mean absolute
J Paleolimnol (2013) 50:583–592 587
123
deviations of min670 when\21 % of the data are used
for calibration.
For core SOP (Fig. 4b) both PLS and random
forests have a performance superior to the perfor-
mance of the best conventional algorithm (590d690).
Notably, the 90 % quantile mean absolute deviations
of PLS and random forests are lower than the median
mean absolute deviations of 590d690 as soon as more
than 12 % of the data are used for calibration.
Comparing random forests and PLS, PLS results in
lower mean absolute deviations when including few
(\16 %) data for calibration, whereas random forests
result in lower mean absolute deviations when
including[16 % of the data for calibration.
For core NAP (Fig. 4c) both random forests and
PLS result in low and comparable mean absolute
Fig. 2 Reflectance spectra of a clastic, and b organic parts of GOP, c clastic and d organic parts of SOP, e the first organic part, f the
clastic part and g the second organic part of NAP
588 J Paleolimnol (2013) 50:583–592
123
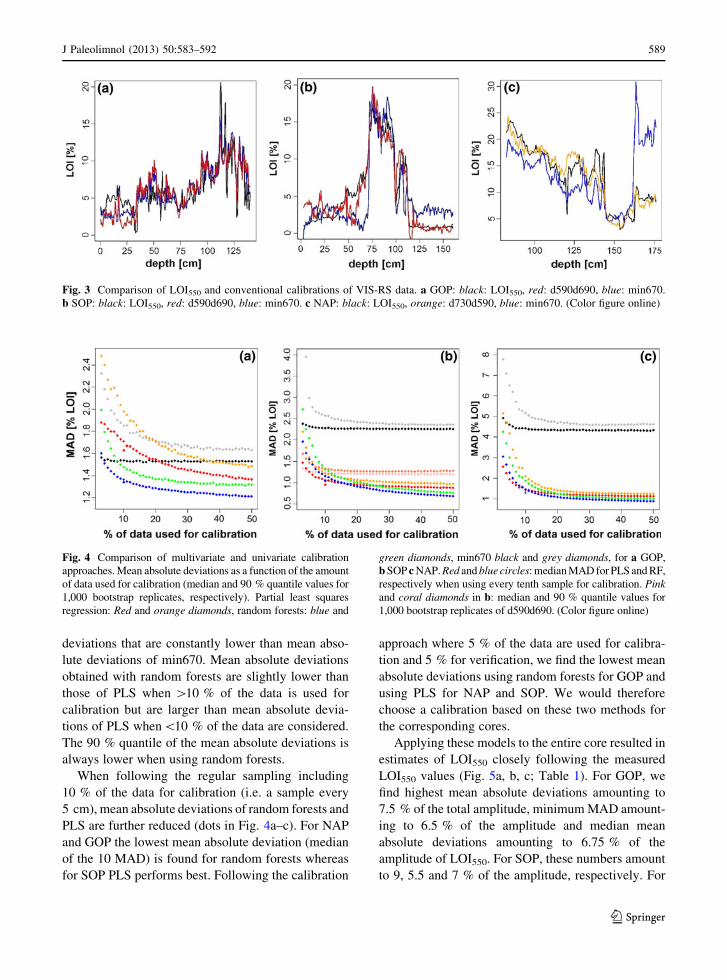
deviations that are constantly lower than mean abso-
lute deviations of min670. Mean absolute deviations
obtained with random forests are slightly lower than
those of PLS when [10 % of the data is used for
calibration but are larger than mean absolute devia-
tions of PLS when\10 % of the data are considered.
The 90 % quantile of the mean absolute deviations is
always lower when using random forests.
When following the regular sampling including
10 % of the data for calibration (i.e. a sample every
5 cm), mean absolute deviations of random forests and
PLS are further reduced (dots in Fig. 4a–c). For NAP
and GOP the lowest mean absolute deviation (median
of the 10 MAD) is found for random forests whereas
for SOP PLS performs best. Following the calibration
approach where 5 % of the data are used for calibra-
tion and 5 % for verification, we find the lowest mean
absolute deviations using random forests for GOP and
using PLS for NAP and SOP. We would therefore
choose a calibration based on these two methods for
the corresponding cores.
Applying these models to the entire core resulted in
estimates of LOI550 closely following the measured
LOI550 values (Fig. 5a, b, c; Table 1). For GOP, we
find highest mean absolute deviations amounting to
7.5 % of the total amplitude, minimum MAD amount-
ing to 6.5 % of the amplitude and median mean
absolute deviations amounting to 6.75 % of the
amplitude of LOI550. For SOP, these numbers amount
to 9, 5.5 and 7 % of the amplitude, respectively. For
Fig. 3 Comparison of LOI550 and conventional calibrations of VIS-RS data. a GOP: black: LOI550, red: d590d690, blue: min670.
b SOP: black: LOI550, red: d590d690, blue: min670. c NAP: black: LOI550, orange: d730d590, blue: min670. (Color figure online)
Fig. 4 Comparison of multivariate and univariate calibration
approaches. Mean absolute deviations as a function of the amount
of data used for calibration (median and 90 % quantile values for
1,000 bootstrap replicates, respectively). Partial least squares
regression: Red and orange diamonds, random forests: blue and
green diamonds, min670 black and grey diamonds, for a GOP,
b SOP c NAP. Red and blue circles: median MAD for PLS and RF,
respectively when using every tenth sample for calibration. Pink
and coral diamonds in b: median and 90 % quantile values for
1,000 bootstrap replicates of d590d690. (Color figure online)
J Paleolimnol (2013) 50:583–592 589
123
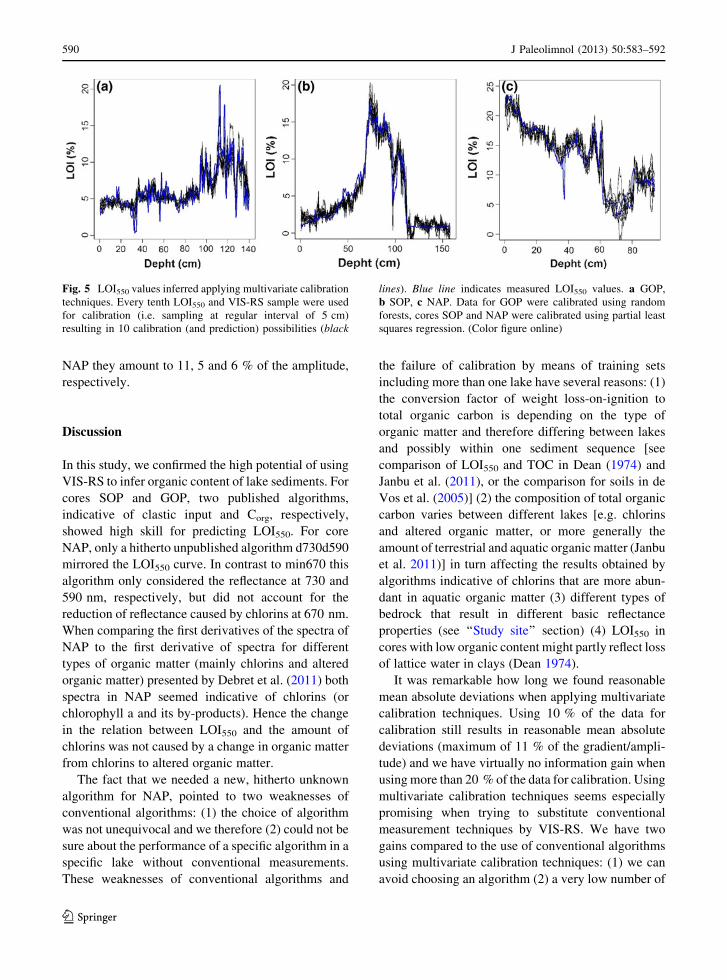
NAP they amount to 11, 5 and 6 % of the amplitude,
respectively.
Discussion
In this study, we confirmed the high potential of using
VIS-RS to infer organic content of lake sediments. For
cores SOP and GOP, two published algorithms,
indicative of clastic input and Corg, respectively,
showed high skill for predicting LOI550. For core
NAP, only a hitherto unpublished algorithm d730d590
mirrored the LOI550 curve. In contrast to min670 this
algorithm only considered the reflectance at 730 and
590 nm, respectively, but did not account for the
reduction of reflectance caused by chlorins at 670 nm.
When comparing the first derivatives of the spectra of
NAP to the first derivative of spectra for different
types of organic matter (mainly chlorins and altered
organic matter) presented by Debret et al. (2011) both
spectra in NAP seemed indicative of chlorins (or
chlorophyll a and its by-products). Hence the change
in the relation between LOI550 and the amount of
chlorins was not caused by a change in organic matter
from chlorins to altered organic matter.
The fact that we needed a new, hitherto unknown
algorithm for NAP, pointed to two weaknesses of
conventional algorithms: (1) the choice of algorithm
was not unequivocal and we therefore (2) could not be
sure about the performance of a specific algorithm in a
specific lake without conventional measurements.
These weaknesses of conventional algorithms and
the failure of calibration by means of training sets
including more than one lake have several reasons: (1)
the conversion factor of weight loss-on-ignition to
total organic carbon is depending on the type of
organic matter and therefore differing between lakes
and possibly within one sediment sequence [see
comparison of LOI550 and TOC in Dean (1974) and
Janbu et al. (2011), or the comparison for soils in de
Vos et al. (2005)] (2) the composition of total organic
carbon varies between different lakes [e.g. chlorins
and altered organic matter, or more generally the
amount of terrestrial and aquatic organic matter (Janbu
et al. 2011)] in turn affecting the results obtained by
algorithms indicative of chlorins that are more abun-
dant in aquatic organic matter (3) different types of
bedrock that result in different basic reflectance
properties (see ‘‘Study site’’ section) (4) LOI550 in
cores with low organic content might partly reflect loss
of lattice water in clays (Dean 1974).
It was remarkable how long we found reasonable
mean absolute deviations when applying multivariate
calibration techniques. Using 10 % of the data for
calibration still results in reasonable mean absolute
deviations (maximum of 11 % of the gradient/ampli-
tude) and we have virtually no information gain when
using more than 20 % of the data for calibration. Using
multivariate calibration techniques seems especially
promising when trying to substitute conventional
measurement techniques by VIS-RS. We have two
gains compared to the use of conventional algorithms
using multivariate calibration techniques: (1) we can
avoid choosing an algorithm (2) a very low number of
Fig. 5 LOI550 values inferred applying multivariate calibration
techniques. Every tenth LOI550 and VIS-RS sample were used
for calibration (i.e. sampling at regular interval of 5 cm)
resulting in 10 calibration (and prediction) possibilities (black
lines). Blue line indicates measured LOI550 values. a GOP,
b SOP, c NAP. Data for GOP were calibrated using random
forests, cores SOP and NAP were calibrated using partial least
squares regression. (Color figure online)
590 J Paleolimnol (2013) 50:583–592
123

conventional measurements (10 % of the data, a
sample every 5 cm) enables us to obtain more accurate
estimates of LOI550 than obtained with any conven-
tional algorithm. Hence, the data we additionally
include in multivariate calibration have the potential
to improve our inference of a specific chemical
compound found in the sediments. We, however,
move away from a (geo)chemical and physical
understanding of reflectance spectra to a purely
numerical approach. This is a major weakness of our
approach. We further have to apply complex numer-
ical methods to calibrate reflectance measurements to
LOI550. In light of available software packages this is,
however, not a major problem.
Conclusions
In this study, we tested the potential of using VIS-RS
for inferring organic content of proglacial lake sedi-
ments. We confirmed the high potential of using
published algorithms for inferring organic content of
sediment cores, but found a few shortcomings of these
algorithms, mainly the ambiguous choice of algo-
rithm. We therefore tested the ability of two multi-
variate calibration techniques, random forests and
PLS, for inferring LOI550 of sediment cores. The two
techniques generally result in estimates of LOI550 that
are closer to the measured values (i.e. mean absolute
deviations lower) than conventional algorithms. Using
a sample every 5 cm for calibration seems sufficient to
obtain low mean absolute deviations (lower than 10 %
of the amplitude). Furthermore these mean absolute
deviations are lower than mean absolute deviations of
conventional algorithms. The same amount of data is
needed to decide which conventional algorithm to use.
In this study we tested the potential for substituting
LOI550 by VIS-RS. In future studies, the potential of
multivariate calibration techniques and VIS-RS to
substitute measurements of more time consuming and
costly sediment parameters should be tested. These
tests could comprise two directions: (1) testing if the
determination of the amount of clay minerals (mainly
chlorite and illite) in clastic sediments are possible.
Clay minerals are usually measured by sediment
destructive and time consuming X-ray diffraction; (2)
as done by Rein and Sirocko (2002) and Michelutti
et al. (2010) the possibility to determine sedimentary
pigments (e.g. chlorins) as conventionally measured
by means of high-performance liquid chromatography
should be pursued. Additionally, applying the methods
used in this study to more sophisticated reflectance
scanning techniques like hyper spectral sediment core
scanners that measure at higher spatial and spectral
resolution should be tested.
Acknowledgments We would like to thank Richard J. Telford
and H. John B. Birks for discussions on multivariate calibration
techniques. We thank two anonymous reviewers and Oliver
Heiri for comments that greatly improved the clarity of this
manuscript. Funding was provided by the Swiss National
Science Foundation through a personal grant to MT and the
Bjerknes Centre for Climate Research. This is publication no.
A430 from the Bjerknes Centre for Climate Research.
References
Bakke J, Trachsel M, Kvisvik BC, Nesje A, Lysa A (2013)
Numerical analysis of a multi-proxy data set from a distal
glacier-fed lake, Sørsendalsvatnet, western Norway. Quat
Sci Rev 73:182–195
Birks HJB (1998) Numerical tools in palaeolimnology—pro-
gress, potentialities, and problems. J Paleolimnol
20:307–332
Breiman L (2001) Random forests. Mach Learn 45:5–32
Breiman L, Friedman JH, Olshen RH, Stone CG (1984) Clas-
sification and regression trees. Wadsworth International
Group, Belmont
Bryhni I, Nøttvedt A, Ramberg IB (2007) Landet blir til: Norges
geologi. Trondheim, Norsk geologisk forening
Canty A, Ripley B (2011) Boot: bootstrap functions, version
1.3-5. http://stat.ethz.ch/CRAN
Dahl SO, Nesje A (1996) A new approach to calculating
Holocene winter precipitation by combining glacier equi-
librium line altitudes and pine-tree limits: a case study from
Hardangerjøkulen. Holocene 6:381–398
de Jong S (1993) PLS fits closer than PCR. J Chemom
7:551–557
De Vos B, Vandecasteele B, Deckers J, Muys B (2005) Capa-
bility of loss—as a predictor of total organic carbon in non-
forest soils. Soil Sci Plant Anal 36:2899–2921
Dean WE (1974) Determination of carbonate and organic matter
in calcareous sediments and sedimentary rocks by loss on
ignition: comparison with other methods. J Sediment Petrol
44:242–248
De’ath G, Fabricius KE (2000) Classification and regression
trees: a powerful yet simple technique for ecological data.
Ecology 81:3178–3192
Debret M, Sebag D, Desmet M, Balsam W, Copard Y, Mourier
B, Susperrigui AS, Arnaud F, Bentaleb I, Chapron E,
Lallier-Verges E, Winiarski T (2011) Spectrocolorimetric
interpretation of sedimentary dynamics: the new ‘‘Q7/4
diagram’’. Earth Sci Rev 109:1–19
Heiri O, Lotter AF, Lemcke G (2001) Loss on ignition as a
method for estimating organic and carbonate content in
sediments: reproducibility and comparability of results.
J Paleolimnol 25:101–110
J Paleolimnol (2013) 50:583–592 591
123

Janbu AD, Paasche Ø, Talbot MR (2011) Paleoclimate changes
inferred from stable isotopes and magnetic properties of
organic-rich lake sediments in Arctic Norway. J Paleolim-
nol 46:29–44
Legendre P (2013) lmodel2: model II regression, version 1.7-1.
http://cran.r-project.org/
Legendre P, Legendre L (1998) Numerical ecology. Elsevier,
Amsterdam
Liaw A, Wiener M (2011) randomForest: Breiman and Cutler’s
random forests for classification and regression, version
4.6-5. http://stat.ethz.ch/CRAN
Martens H, Naes T (1989) Multivariate Calibration. Wiley,
Chichester
Michelutti N, Blais JM, Cumming BF, Paterson AM, Ruhland
K, Wolfe AP, Smol JP (2010) Do spectrally inferred
determinations of chlorophyll a reflect trends in lake tro-
phic status? J Paleolimnol 43:205–217
Nesje A (1992) A piston corer for lacustrine and marine sedi-
ments. Arct Antarct Alp Res 24:257–259
Nesje A, Matthews JA, Dahl SO, Berrisford MS, Andersson C
(2001) Holocene glacier fluctuations of Flatebreen and
winter-precipitation changes in the Jostedalsbreen region,
western Norvay, based on glaciolacustrine sediment
records. Holocene 11:267–280
Nesje A, Dahl SO, Lie Ø (2004) Holocene millennial-scale
summer temperature variability inferred from sediment
parameters in a non-glacial mountain lake: Danntjørn,
Jotunheimen, central southern Norway. Quat Sci Rev
223:2183–2205
R Development Core Team (2011) R: a language and environ-
ment for statistical computing. R Foundation for Statistical
Computing, Vienna
Rein B (2003) In-situ Reflektionsspektroskopie und digitale
Bildanalyse—Gewinnung hochauflosender Pal-
aoumweltdaten mit fernerkundlichen Methoden. Univer-
sitat Mainz, Habilitationsschrift
Rein B, Sirocko F (2002) In situ reflectance spectroscopy–
analysing techniques for high-resolution pigment logging
in sediment cores. Int J Earth Sci 91:950–954
Rein B, Lueckge A, Reinhardt L, Sirocko F, Wolf A, Dullo W
(2005) El Nino variability off Peru during the last 20,000
years. Paleoceanography 20(4):PA 4003
Rosen P, Vogel H, Cunningham L, Reuss N, Conley DJ, Persson
P (2010) Fourier transform infrared spectroscopy, a new
method for rapid determination of total organic and inor-
ganic carbon and biogenic silica concentration in lake
sediments. J Paleolimnol 43:247–259
Trachsel M, Grosjean M, Schnyder D, Kamenik C, Rein B
(2010) Scanning reflectance spectroscopy (380–730 nm): a
novel method for quantitative high-resolution climate
reconstructions from minerogenic lake sediments. J Paleo-
limnol 44:979–994
USGS (2010) Digital Spectral Library, splib06a. http://speclab.
cr.usgs.gov/spectral-lib.html
van den Wollenberg AL (1977) Redundancy analysis: an
alternative for canonical correlation analysis. Psychomet-
rika 42:207–219
Vogel H, Rosen P, Wagner B, Melles M, Persson P (2008)
Fourier transform infrared spectroscopy, a new cost-
effective tool for quantitative analysis of biogeochemical
properties in long sediment records. J Paleolimnol
40:689–702
von Gunten L, Grosjean M, Rein B, Urrutia R, Appleby P (2009)
A quantitative high-resolution summer temperature
reconstruction based on sedimentary pigments from
Laguna Aculeo, central Chile, back to AD 850. Holocene
19:873–881
Wehrens R, Mevik B-H (2007) PLS: partial least squares
regression (PLSR) and principal component regression
(PCR), version 2.1-0. http://cran.r-project.org/web/
packages/pls/index.html
Wolfe AP, Vinebrooke R, Michelutti N, Rivard B, Das B (2006)
Experimental calibration of lake-sediment spectral reflec-
tance to chlorophyll a concentrations: methodology and
paleolimnological validation. J Paleolimnol 36:91–100
592 J Paleolimnol (2013) 50:583–592
123