inference of human transcription regulatory … . of human. transcription. regulatory networks ....
TRANSCRIPT

Inference Inference of humanof humantranscriptiontranscription regulatory networks regulatory networks
usingusing deep sequencingdeep sequencing datadata
Erik van NimwegenBiozentrum, University of Basel,
and Swiss Institute of Bioinformatics

What does What does ““Inferring transcription regulatory networksInferring transcription regulatory networks””
mean?mean?• For each TF, determine its cis-regulatory elements (binding sites) genome-wide.• Determine which TFs are active under what conditions:
• expression.• nuclear localization.• post-translational modifications.• anything that affects the TF’s affect on its target genes.
• Determine time-dependent activities of TFs in dynamic processes such as cell cycle, developmental processes, etc.
• Determine the effect of each cis-regulatory element on the expression of the target gene.• Determining the transcription regulatory logic of the cis-regulatory elements, i.e.mapping from TF binding configurations to effects on expression.
Ultimately we would like to be able to predict the expression dynamics of all genesessentially just from their DNA sequences

Typical highTypical high--throughput approachesthroughput approaches
Gene expression data(microarray)
clustering
Regulatory“modules”
Pathways/Functionalcategories
Regulatorymotifs
TF expressionprofiles
Association
Over-representation
Correlation
Examples:Segal et al. Nat. Genet 2003Beer and Tavazoie Cell 2004
Benefits:• One identifies regulatory programsi.e. cohorts of co-regulated genes in theprocess/condition under study.• Relevant pathways identified.• TFs/regulatory motifs are associatedwith the modules.
Disadvantages:• Only some genes cluster, cluster boundariesare often unclear.• Direct physical meaning often lacking.• Gene expression profiles are not explained,but just classified.

Targeted highTargeted high--throughput approachesthroughput approacheschIP-chipchIP-seq
Genome-wide binding targets
Examples:Boyer et al. Cell 2005Jakobsen et al. Genes & Dev. 2007
Benefits:• Infer direct molecular interactions.• Genome-wide.
Disadvantages:• Binding does not imply expression effects.
TF knock-down(e.g. siRNA)
Downstream targetsExamples:Davidson et al Science 2002Imai et al. Science 2006
Benefits:• Identify effects on expression.• Genome-wide.
Disadvantages:• Direct and indirect effects entangled..
• Labor intensive (one TF at a time)• Need to know the relevant TFs in advance

Accelerating regulatory network reconstructionAccelerating regulatory network reconstructionthrough computational predictionthrough computational prediction
Develop a computational frame-work that:• Uses easily produceable high-throughput data, e.g. micro-array data.
• Predict the transcription regulators that play a key role in the process under study(developmental time course, response to perturbations, disease versus healthy tissue).
• Predict how the regulators change activity (up-regulation, down-regulation, transient changes).
• Predict the target gene sets of the key regulators.
• Identify the cis-regulatory elements on the genome through which the regulators acts.
• Real network reconstruction requires targeted and detailed experimental work.• Provide analysis of high-throughput data that most efficiently tells where to look.

Linear modelsLinear models
• Explicitly predicting gene expression in terms of activities of the transcription factors,and the response coefficients of each gene to each transcription factor:
fsf gfgsgs ARcce ∑+++= ~noise
Expression of gene g in sample s
Basal gene expression
Response of gene g to factor f.
Activity of factor fin sample s
• Assumes a linear function. This is wrong but never a bad approximation when changes are not too large.
• The activities and response coefficients are inferred from the data and/or computational analysis.
Review: Bussemaker et al. Annu Rev Biophys Biomol Struct 2007

Linear modelsLinear models
• Explicitly predicting gene expression in terms of activities of the transcription factors,and the response coefficients of each gene to each transcription factor:
fsf gfgsgs ARcce ∑+++= ~noise
Response of gene g to factor f.
We use DNA sequence analysis to predict transcription factor binding sites and estimate response coefficients in human genome-wide.

TFBS prediction in mammals:TFBS prediction in mammals:Focus on proximal promotersFocus on proximal promoters
Challenge:• The intergenic regions in mammals are vast and functional sites can occur far from the
gene.
• Data from the ENCODE project suggests a large fraction of functional regulatorysites occurs near TSS. (Nature. 447:799-816 2007 )
• Regulatory sites thought to be distal often turn out to be alternative promoters.• chIP-chip for several TFs shows peaks at TSS:
However,
We have a technology for mapping TSSs and their expression genome-wide.

Deep sequencing of 5Deep sequencing of 5’’ ends of mRNAsends of mRNAsCAGE technologyCAGE technology
Cap analysis gene expression for high-throughput analysis of transcriptional starting point andidentification of promoter usage.Shiraki et el. PNAS 23 15776-81 (2003)
Tag-based approaches for transcriptome researchand genome annotationHarbers M, Carninci P.Nat Methods 2 495-502 (2005)
Tagging mammalian transcriptome complexityP. CarninciTrends Genet 22 501-10 (2006)
454/Solexa sequencing.Mapping to the genome.

Deep sequencing of 5Deep sequencing of 5’’ ends of mRNAsends of mRNAsNumber of samples with > 105 tags 56
Total number of mapped CAGE tags 25,469,648Number of unique TSS positions 3,006,003
For any given sample the distribution of tags per TSS is a power-law:
The vast majority of TSSs have very low expression: `background transcription’.The distribution can be used to normalize CAGE-tag counts across samples.

NoiseNoise--model for CAGE expression datamodel for CAGE expression data
( )( )( )nt
n
xt
xtP12
1)log(
21exp
),|(2
2
2
+
⎟⎟
⎠
⎞
⎜⎜
⎝
⎛
+−
−
=σπ
σσ
x = true log-expression (per million).n = raw number of tags.t = normalized number of tags.σ2 = variance of the multiplicative noise.
Measure distribution of observed z-valuesfor replicates.
21
2
21
112
)log()log(
nn
ttz++
−=
σ
Expression noise can be modeled as multiplicative noise, followed by Poisson sampling.
z
Observed and predicted replicate noise

Constructing promotersConstructing promoters
Time course
Knowntranscripts
What is a promoter?Answer: A set of neighboring TSSs whose expression-profile is indistinguishable up to noise. We also cluster nearby promoters into promoter regions.
Number of promoter regions 43,164Number of promoters 74,273
Number of TSSs in promoters 860,823Total number of TSSs 3,006,003
Human promoterome

Predicting TFBSs in all proximal promotersPredicting TFBSs in all proximal promotersInput:• 203 mammalian regulatory motifs (weight matrices) representing 551 human TFs.
• 43,164 proximal promoter regions (-300,+100) with respect to each TSS.• Alignments with orthologous regions from other mammals.
• The phylogenetic tree relating the species:
IRF7 E2F REST GATA2/4
CATTCGCAGTGGCAAGGGACTGCCCTGGTCCCTGTGGAGC—GTCCCATTCGGTGACTTCCCACCAGCCCTTCCCCAGCGCCTCTGGAGGTCCAGACTGTCAGGTTGGAGCCTGGGCATTCACAGTGGCAAGGGTCCGCCCTGGTCCCTGTGGAGG--GTCCCAGTCGGTGACTTCCCGCCAGCCCTTCCCCAGTGCCTCTGGAGGTC--GACTGTC-GGTTGGAGCCTGGGAGGGGCGG---CTCGGGAGG---------CCTGCGGACC--GGGCGAG-CGGGGGCG-GCG----GGGCGGCGGGGGAGCCGGGCGGGGGCC------TGCGGTCGG-GCCTGGGATTGGCCGCGGCCAAGGACCCC-----TCCCTGGGGAGC--GTCCGGGTCGGAGACT-CCCACTTGCCCTTCTCCAGCACCTCGTGAAGTCCGGACTGTACGGTTTG-GACTCGTATCTACAACAGCAAG-GA--------GTC--TG-GAAGCAAGTCCAAGT-GATGGA-TACAGCCATCACTTACC--GGGCCTCTGCTGGTCGTGACTT----------------
Human
Rhesus macaque
Cow
Dog
Mouse

MotEvo AlgorithmMotEvo Algorithm
Scer AAAAAATGAAAAATTCATGAGAAAAGAGTCAGACATC-GAAACATACATAA--GTTGATATTC-CTTTGATATCG-----ACGACTASpar AAAAAATGAAAAATTCATGAGAAAAGAGTCAGACATC-GAAACATACATAA--ATTGATATTC-CTTTAGCTTTT----AAAGACTASmik GAAAAACGAAAAATTCATG-GAAAAGAGTCAACCGTC-GAAACATACATAA--ACCGATATTT-CTTTAGCTTTCGACAAAAATCTGSbay GAAAAATAAAAAGTGATTG-GAAAAGAGTCAGATCTCCAAAACATACATAATAACAGGTTTTTACATTAGCTTTT----GAAAACTA
lnF − ),|( ],[ TwSP lln−
Scer AAAAAATGAAAAATTCATGAGAAAAGAGTCAGACATC-GAAACATACATAA--GTTGATATTC-CTTTGATATCG-----ACGACTASpar AAAAAATGAAAAATTCATGAGAAAAGAGTCAGACATC-GAAACATACATAA--ATTGATATTC-CTTTAGCTTTT----AAAGACTASmik GAAAAACGAAAAATTCATG-GAAAAGAGTCAACCGTC-GAAACATACATAA--ACCGATATTT-CTTTAGCTTTCGACAAAAATCTGSbay GAAAAATAAAAAGTGATTG-GAAAAGAGTCAGATCTCCAAAACATACATAATAACAGGTTTTTACATTAGCTTTT----GAAAACTA
1−nF ),|( TbSP n
Scer AAAAAATGAAAAATTCATGAGAAAAGAGTCAGACATC-GAAACATACATAA--GTTGATATTC-CTTTGATATCG-----ACGACTASpar AAAAAATGAAAAATTCATGAGAAAAGAGTCAGACATC-GAAACATACATAA--ATTGATATTC-CTTTAGCTTTT----AAAGACTASmik GAAAAACGAAAAATTCATG-GAAAAGAGTCAACCGTC-GAAACATACATAA--ACCGATATTT-CTTTAGCTTTCGACAAAAATCTGSbay GAAAAATAAAAAGTGATTG-GAAAAGAGTCAGATCTCCAAAACATACATAATAACAGGTTTTTACATTAGCTTTT----GAAAACTA
lnF − dwwPTwSP lln )(),|( ],[∫ −
MotEvo:
van Nimwegen, E.
BMC Bioinf 8 Suppl 6, S4 (2007)
MONKEY:
Moses, A.M., Chiang, D.Y., Pollard, D.A., Iyer, V.N. & Eisen, M.B.
Genome Biol 5, R98 (2004).

Transcription factor binding sites Transcription factor binding sites have strong positional preferenceshave strong positional preferences
relative to TSSrelative to TSSTBP
NF-Y CAAT-box
YY1
NRF1
SP1RREB1
E2FMyb
Sox17
Foxq1FOXI1

GenomeGenome--wide annotation of regulatory siteswide annotation of regulatory sites
Example: Predicted TFBSs in the proximal promoter of the SNAI3 TF.
http://www.swissregulon.unibas.ch
For each promoter p and motif m calculate the predicted number of functional sites
pmN

Linear models of promoter expressionLinear models of promoter expression
msm pmpsps ANcce ∑+++= ~noise
Expression of promoter p in sample s
Basal promoter expression
Number of functional sites in promoter p for
motif m
Activity of motif min sample s
∑ ∑ ⎟⎟⎠
⎞⎜⎜⎝
⎛−−−
p mspmspmps ccANe
2
~
msms AA δ±*
SVD
Fitting activities, minimize:
Similar approach in yeast: Nguyen DH, and P. D'haeseleer Mol. Syst. Biol. (2006)doi:10.1038/msb4100054 Application to human:Das, D., Nahle, Z. & Zhang, M.Q. Mol Syst Biol 2, 2006 0029 (2006).
∑=
⎟⎟⎠
⎞⎜⎜⎝
⎛=
S
s ms
msm A
AS
z1
21
δ
Significance of the motif:

Human tissue atlas and Human tissue atlas and cancer cell expression datacancer cell expression data
79 human tissues, Affymetrix micro-array
60 cancer cell lines, same Affymetrix micro-array
We associate probes with promoters and apply the same analysis to this data set.

In which samples is a given motif In which samples is a given motif most active? most active?
Fetal liver
Liver
Kidney
A known liver-specific factor indeed shows highest activity in liver tissues.
ms
ms
AAδ
*
sample s

Immune tissues
Testissamples
leukemia
MYB is high in testis. It is also up-regulated in all NCI60 samples.
MYB
In which samples is a given motif In which samples is a given motif most active? most active?
ms
ms
AAδ
*
sample s

Which motifs differentiateWhich motifs differentiaterelated tissues?related tissues?
• We can focus in on a set of related tissues, e.g. muscle tissues, and determine whichTFs vary most in activity across these tissues.
*msA
sample s

Which motifs change Which motifs change in development of a tissue?in development of a tissue?
Fetal thyroid and thyroid

Which motifs differentiate Which motifs differentiate healthy from tumor tissues?healthy from tumor tissues?
Lung and lung tumors

Which motifs change activityWhich motifs change activityunder a perturbation?under a perturbation?
Monocytes before and after treatment with retinoic acid

Example ApplicationExample Application
Collaboration with Dirk Schubeler, FMI, Basel
epigenetic reprogramming during terminal neuronal differentiation of murine stem cells in vitro
Neuron-specific class III -tubulin
• Micro-array expression data at 4 time points (ESC, early NP, late NP, TN) in duplicate.• Nimblegen human promoter chips. • chIP-chip for methylated DNA, Polymerase II, H3K4me, and H3K27me (3 time points).
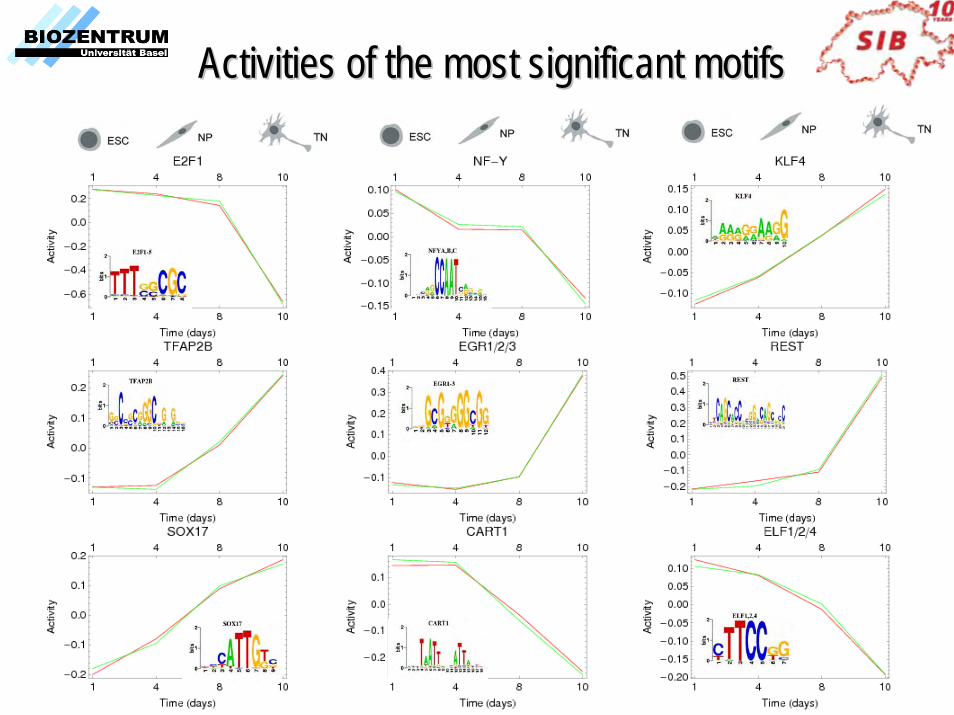
Activities of the most significant motifsActivities of the most significant motifs

Prediction of regulated target promotersPrediction of regulated target promoters• For each motif go through list of all promoters with predicted TFBSs• Investigate the correlation between expression profile of the promoter and activity profile of the motif.
0>pmN
Our final predictions of regulatory targets of each motif obey• The promoter has a predicted TFBS for the motif.• The TFBS shows conservation and correct positioning w.r.t. TSS.• The expression of the promoter significantly correlates with the activity profile of the motif.

Targets of the most significant motifs:Targets of the most significant motifs:Association with Gene Ontology categoriesAssociation with Gene Ontology categories
DNA replicationcell cycle
cell cycle M phase
neurological system processcell communicationcell surface receptor linked signal transduction
nervous system developmentneurite morphogenesis generation of neurons
cell-cell signalingsynaptic transmissionneurological system process
transmission of nerve impulsesynaptic transmissionneurological system process
developmental process nervous system development DNA binding
gene expressionRNA processingribosome biogenesis and assembly

Predicted effects of expression of regulatory sitesPredicted effects of expression of regulatory sites
http://www.swissregulon.unibas.chGenome browser:
Example: Predicted TFBSs in the proximal promoter of the SNAI3 TF.
Z-values quantify correlation between motif activity and target expression.
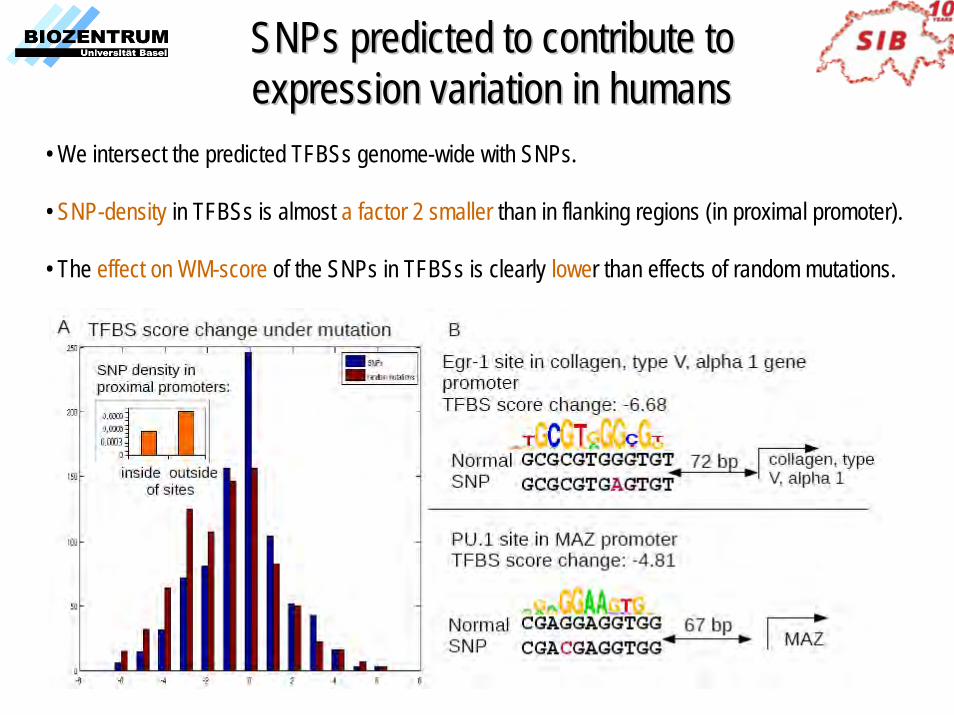
SNPs predicted to contribute to SNPs predicted to contribute to expression variation in humansexpression variation in humans
• We intersect the predicted TFBSs genome-wide with SNPs.
• SNP-density in TFBSs is almost a factor 2 smaller than in flanking regions (in proximal promoter).
• The effect on WM-score of the SNPs in TFBSs is clearly lower than effects of random mutations.

AcknowledgmentsAcknowledgments
Piotr Balwierz (motif activity inference)Phil Arnold (MotEvo, epigenetic signals)
Mikhail Pachkov (SwissRegulon)
Dirk Schübeler
Omics Science CenterRIKEN Institute, Yokohama, Japan
Yoshihide Hayashizaki Harukazu Suzuki Piero Carninci
Alistair Forrest Carsten Daub
Ippon jime
Gerhard Christofori
Biozentrum