infectious disease physician compensation - idsa several organizations, such as medscape, mgma, and...
TRANSCRIPT

Infectious Diseases Physician Compensation
Assessment
Prepared for: Infectious Diseases Society of America Oct. 2015

Table of Contents
• Background
• Study Details
• Survey Flow
• Executive Summary
• Detailed Findings
• Appendix

Background
• Several organizations, such as MedScape, MGMA, and AAMC, report on annual physician compensation by specialty type; however, these reports have not provided adequate insight into the Infectious Diseases physician’s compensation, partly due to the small sample sizes collected
• As result, the IDSA commissioned research to capture compensation information directly from a broad set of their members
3

Study Details
4
• A self-administered web survey • Included a range of quantitative exercises; such as choice selection,
numeric and open-ended questions • Completion of the web survey took ~ 5 -10 minutes per respondent
• IDSA sent invitations directly to member inviting them to take part in the survey
• Target groups were ID Physicians involved with Patient Care, Research and Public Health
Objectives • Gauge physicians’ total actual compensation • Determine the sources of their compensation • Assess how compensation is structured by group
Method of Data Collection
Sample
• The survey was fielded July 15 through August 22, 2015 Timing
Survey Flow
5
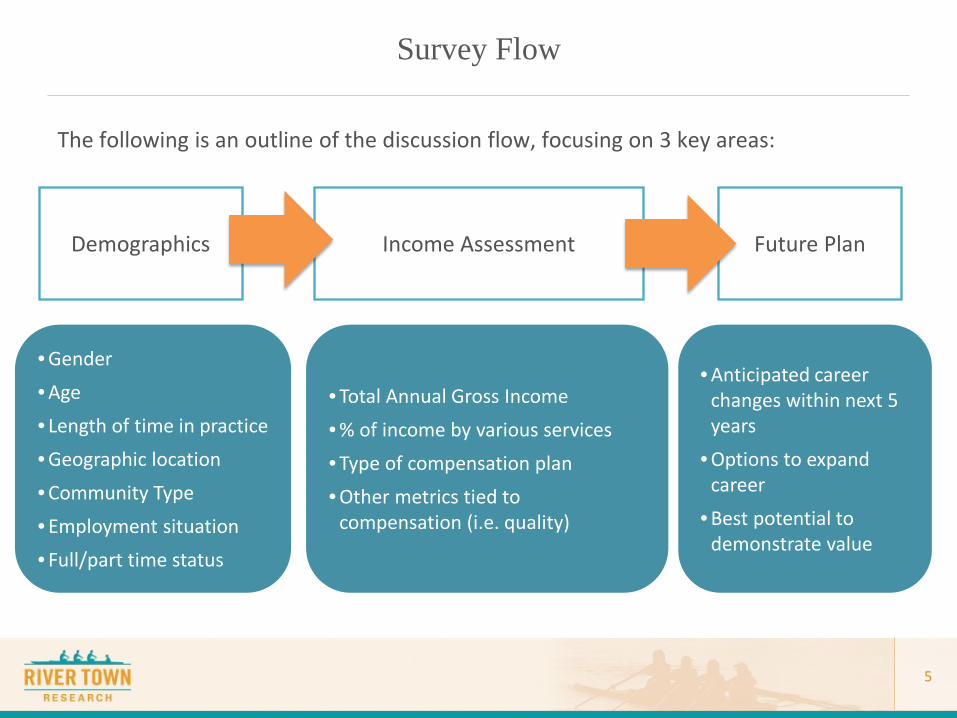
Demographics Income Assessment Future Plan
• Gender • Age • Length of time in practice • Geographic location • Community Type • Employment situation • Full/part time status
• Total Annual Gross Income • % of income by various services • Type of compensation plan • Other metrics tied to
compensation (i.e. quality)
• Anticipated career changes within next 5 years
• Options to expand career
• Best potential to demonstrate value
The following is an outline of the discussion flow, focusing on 3 key areas:

Sample Segmentation & Presentation of Findings
6
Throughout the presentation, financial and other numerical values
will be presented in the following format:
[Average] [Median] [Range]
The entire survey sample was segmented as follows: • Full sample segmented into
Part-time vs Full time Full time respondents
segmented by Primary Responsibility o Patient Care segmented
into Private Practice, Hosp/Clinic Employed, or Academic Medical Center (AMC) Employed Private Practice
segmented into Solo/Owner/ Partner vs Associate
Part-time employment
Full Sample
Full-time employment
Patient Care
Research
Public Health
Private Practice
Hosp/Clinic Employed
AMC Employed
Solo/Owner/ Partner
Associate
Survey questions that relate to findings appearing on the slide will appear towards the bottom of the slide

Executive Summary

Sample Size and Summary Statistics
8
1,878 Physicians Completed the Survey 1,768 are full time employees
Avg. Compensation (full time) [median] [range]
$230,031 [$205,000] [$50K - $1.45M]
Avg. Participant Age [median] [range]
50 years old [48] [24-88]
Avg. Years in Practice [median] [range]
16 years [15] [0-60]
D1. What is your gender? D2. What is your age? D6. How long have you been in your profession since completion of your training program?
41%
24% 22% 13%
0%
10%
20%
30%
40%
50%
< 10 years 11-20 years 21-30 years > 30 years
Respondents by years in practice
Male 60%
Female 40%
Gender Overall Male Avg. Income
$261,415 [$235K] [$50K-$2M]
Overall Female Avg. Income
$193.950 [$180K] [$55K-700K]

Geographic Distribution of Respondents and Community Setting
9 D3. In which state do you practice? D4. How would you describe the area in which you practice?
17% 22%
7%
22%
20%
13%
Urban 71%
Suburban 24%
Rural 5%
Community Type

The Majority of Respondents (64%) Indicate Patient Care as Their Primary Responsibility
10
Private Practice 19%
Hosp/clinic Employed 22%
AMC Employed 26%
Research (Basic, Clinical) 19%
Public Health 4%
Other 10%
By Primary Responsibility Includes full and part time
12% Sole Practitioner, Owner, or Partner
7% Employee/Associate
D5: Please indicate your primary responsibility?

Most of the Respondents in Patient Care Are Male. Most of the Public Health Respondents are Female with an Equal Proportion of Research Respondents
11
66% 61% 55% 50% 45%
34% 39% 45% 50% 55%
0%
10%
20%
30%
40%
50%
60%
70%
Private Practice Hosp/clinic employed AMC employed Research Public Health
Gender by Affiliation % of Respondents
Male Female
D1. What is your gender? D5. Please indicate your primary responsibility. PC1. Which of the following best describes your primary place of employment?
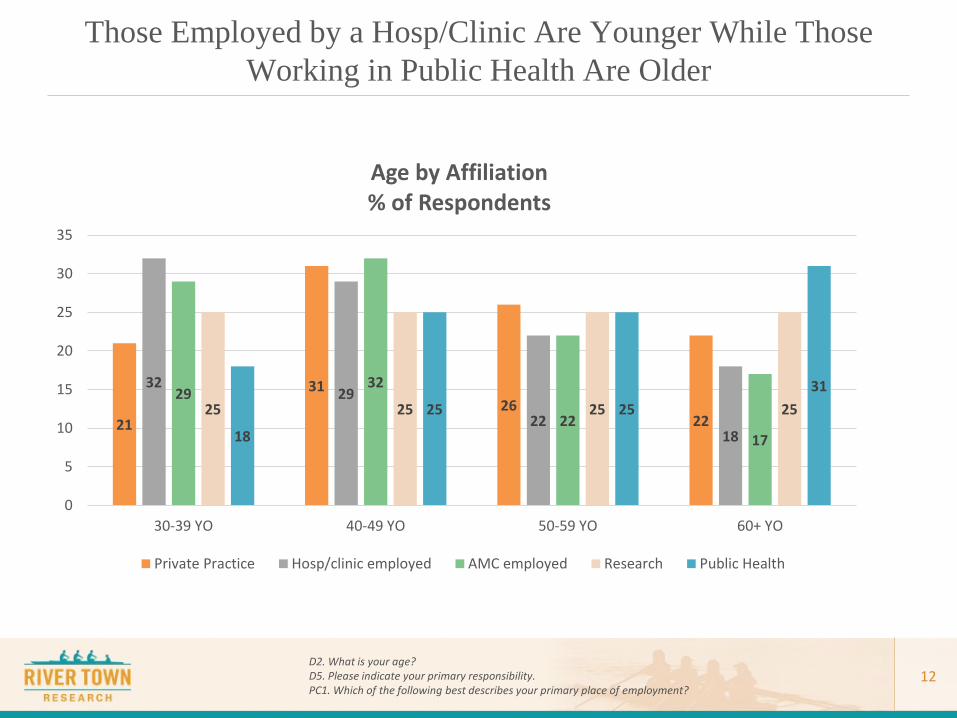
Those Employed by a Hosp/Clinic Are Younger While Those Working in Public Health Are Older
12
21
31 26
22
32 29
22 18
29 32
22 17
25 25 25 25
18
25 25 31
0
5
10
15
20
25
30
35
30-39 YO 40-49 YO 50-59 YO 60+ YO
Age by Affiliation % of Respondents
Private Practice Hosp/clinic employed AMC employed Research Public Health
D2. What is your age? D5. Please indicate your primary responsibility. PC1. Which of the following best describes your primary place of employment?

Segments by full vs. part time status
13
Primary Responsibility Total Number
# who are full time
% Full time
# who are part time
% part time
Patient Care 1,257 1,177 94% 80 6%
Private Practice 350 321 92% 29 8%
Hosp/Clinic Employed 418 396 95% 22 5%
AMC Employed 489 460 94% 29 6%
Research 363 351 97% 12 3%
Public Health 71 60 85% 11 15%
Other 187 180 96% 7 3%
Total 1,878 1,768 94% 110 6%
D5. Please indicate your primary responsibility. D7. Please indicate your working status.

14
Topline Compensation Figures (based on those that reported as working full-time)
Salary Average
[Median] [Range]
25th percentile
75th percentile
90th percentile
Full-time Patient Care (n=1,177)
$231,702 [$210K] [$50K – 1.45M] $170,000 $260,000 $350,000
Private Practice (n=321)
$277,611 [$248K] [$50K - $1.45M] $185,000 $341,250 $431,000
Hosp/clinic employed (n=396)
$241,319 [$230K] [$80-$865K) $200,000 $270,000 $327,500
AMC Employed (n=460)
$191,485 [$179K] [$78-$770K] $150,000 $216,000 $261,400
Full-time Research (n=351)
$199,110 [$175K] [$52-$750K] $135,000 $234,500 $310,000
Full-time Public Health (n=60)
$180,845 [$180K] [$96-$260K] $155,000 $207,250 $229,100
Full-time Other (n=180)
$295,811 [$260K] [$65K - $1M] $205,000 $350,000 $452,300

Comparison of Salary by Gender and Age
15
30-39 year olds 40-49 year olds 50-59 year olds 60+ year olds
Private practice Solo/Partner
Men $320,750
[$300K] [$185-$600K] N=16
$351,140 [$300K] [$85K-$1.45M]
N=45
$326,013 [$300K] [$50K-$1.03M]
N=45
$308,527 [$280K] [$77-$730K]
N=37
Women $210,909
[$180K] [$115-$375K] N=11
$230,391 [$200K] [$150-$400K]
N=21
$283,470 [$255K] [$105-$544K]
N=18
$190,000 [$200K] [$100-$250K]
N=7 Private practice Associate
Men $201,400
[$183K] [$92-$515K] N=22
$267,106 [$250K] [$134-$550K]
N=22
$272,917 [$213K] [$120-$575K]
N=12
$259,147 [$250K] [$90-$500K]
N=17
Women $191,762
[$185K] [$100-$260K] N=21
$247,917 [$205K] [$170-$500K]
N=12
$203,333 [$190K] [$70-$350K]
N=9
$140,000 [$140K] [$120-$160K]
N=2
D2. What is your age? PP3. What is your total annual gross income?

Comparison of Salary by Gender and Age
16
30-39 year olds 40-49 year olds 50-59 year olds 60+ year olds
Hosp/Clinic Employed
Men $228,876
[$223K] [$134-$350K] N=72
$256,470 [$250K] [$92-$537K]
N=67
$278,548 [$250K][$155-$650K]
N=58
$260,012 [$240K] [$130-$865K]
N=55
Women $204,216
[$200K] [$115-$345K] N=51
$221,559 [$210K) ($145-$500K)
N=43
$226,927 [$205K] [$80-$577K]
N=32
$235,545 [$210K] [$160-443K]
N=18
AMC Employed
Men $150,013
[$145K] [$100-265K] N=57
$202,773 [$195K] [$120-$400K]
N=89
$247,310 [$223K] [$120-$770K]
N=54
$242,574 [$220K] [$158-$430K]
N=53
Women $152,124
[$150K] [$88-$240K] N=71
$169,966 [$160K] [$115-$285K]
N=63
$187,717 [$190K] [$78-$275K]
N=48
$194,249 [$180K] [$149-$330K]
N=21
D2. What is your age? EP1/AM3. What is your total annual gross income?

Comparison of Salary by Gender and Age
17
30-39 year olds 40-49 year olds 50-59 year olds 60+ year olds
Research
Men $133,625
[$131K] [$54-$400K] N=35
$170,280 [$156K] [$65-$340K]
N=62
$251,206 [$220K] [$135-$750K]
N=55
$279,678 [$265K] [$52-$650K]
N=57
Women $120,448
[$123K] [$56-$173K] N=40
$161,132 [$150K] [$100-$320K]
N=51
$233,357 [$197K] [$105-$700K]
N=32
$231,173 [$207K] [$100-$500K]
N=19
Public Health
Men $140,000
[$123K] [$115-$200K] N=4
$167,333 [$167K] [$132-$208K]
N=6
$218,200 [$215K] [$190-250K]
N=10
$212,333 [$213K] [$168-$260K]
N=6
Women $152,444
[$157K] [$96-$190K] N=9
$175,019 [$180K] [$132-$229K]
N=11
$180,750 [$178K] [$165-$200K]
N=6
$178,625 [$165K] [$137-$250K]
N=8
D2. What is your age? R8/PH6. What is your total annual gross income?

Comparison of Salary by Gender and Age
18
30-39 year olds 40-49 year olds 50-59 year olds 60+ year olds
Other
Men $155,000
[$190K] [$65 - $210K] N=3
$255,178 [$231K] [$111-$480K]
N=21
$324,334 [$300K] [$144 - $991K]
N=48
$367,423 [$325K] [$185K - $1M]
N=49
Women $155,600
[$150K] [$104- $220K] N=9
$212,278 [$210K] [$124 - $350K]
N=18
$243,621 [$214K] [$125-420K]
N=21
$336,300 [$270K] [$145-$700K]
N=10
D2. What is your age? O5. What is your total annual gross income?

The majority plan to remain in their current position
19
% which plan to retire per segment within next 5 years Private Practice Hosp/Clinic
Employed AMC
Employed Research Public Health
< 50 year olds (n=914) 0.2% 2.7% 0.2% 0.0% 0.1%
50-59 year olds (n=380) 2% 3% 2% 2% 0%
60+ year olds (n=312) 9% 3% 12% 9% 5%
Total =1,606 ( who completed question in full) 11.2% 8.7% 14.2% 11% 5.1%
70%
19%
11%
Future plans in next 5 years Avg. % of respondents across all segments
Remain in current position
Change to new position
Retire
PP7/EP5/AM7/R16/PH8. Looking ahead 5 years, which best characterizes your future plan:

Detailed Findings

Detailed Findings Physicians in Patient Care
21
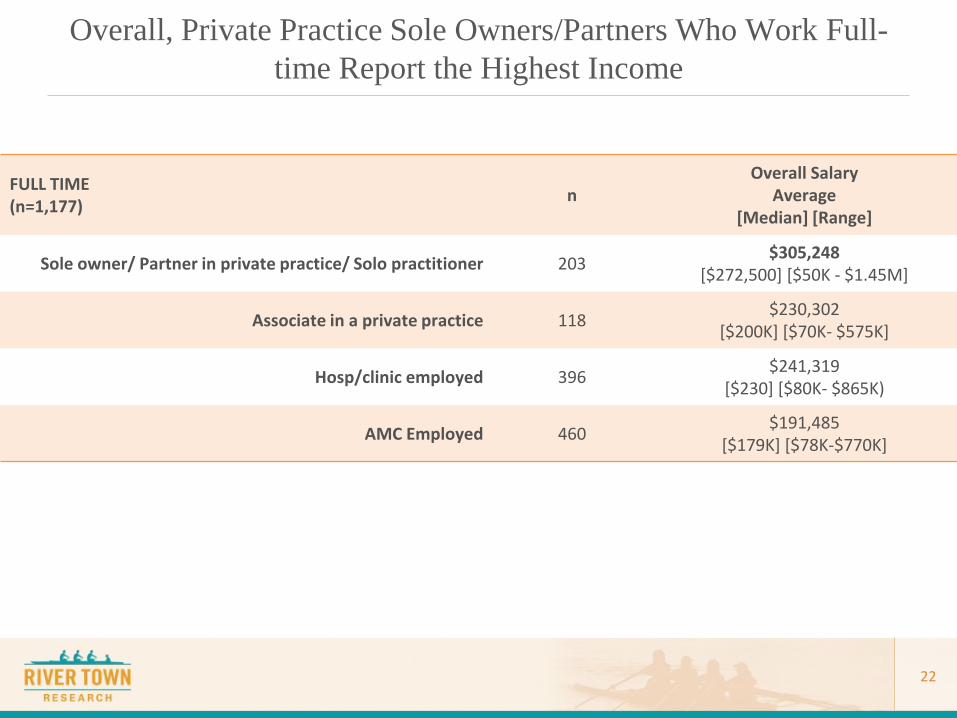
Overall, Private Practice Sole Owners/Partners Who Work Full-time Report the Highest Income
22
FULL TIME (n=1,177) n
Overall Salary Average
[Median] [Range]
Sole owner/ Partner in private practice/ Solo practitioner 203 $305,248 [$272,500] [$50K - $1.45M]
Associate in a private practice 118 $230,302 [$200K] [$70K- $575K]
Hosp/clinic employed 396 $241,319 [$230] [$80K- $865K)
AMC Employed 460 $191,485 [$179K] [$78K-$770K]

Average Salaries of Those Who Work Part-time
23
PART TIME (n=80) n
Overall Salary Average
[Median] [Range]
Sole owner/ Partner in private practice/ Solo practitioner 21 $175,714 [$166K] [$40K - $390K]
Employee/Associate in a private practice 8 $125,000 [$109K] [$48K - $230K]
Hosp/clinic employed 22 $138,344 [$132,500] [$30-$288K]
AMC Employed 29 $125,947 [$120K] [$21-$255K]

Segments by Full vs. Part-time Status
24
Primary Responsibility (n=1,257)
Total Number % Full time % part time
Patient Care 1,257 94% 6%
Sole owner/ Partner in private practice/ Solo practitioner 224 91% 9%
Associate in a private practice 126 94% 6%
Hosp/clinic employed 418 95% 5%
AMC Employed 489 94% 6%
D5. Please indicate your primary responsibility. D7. Please indicate your working status.

Summary of Average Salaries by Area of Focus
25
Primary Responsibility
Pediatrics*
HCV & HIV*
HIV & IC (w/or w/o steward-
ship)*
HIV and Steward-ship*
HIV* IC and
Steward-ship*
IC only*
Steward-ship only*
General ID/Oth
er
Private practice
3% ($237K)
21% ($295K)
17% ($286K)
1% ($236K)
8% ($249K)
8% ($334K)
9% ($299K)
2% ($212K)
30% ($256K)
Hosp/Clinic Employed
7% ($208K)
20% ($258K)
14% ($258K)
5% ($216K)
12% ($219K)
8% ($238K)
5% ($238K)
8% ($243K)
20% ($240K)
AMC Employed
19% ($175K)
13% ($190K)
4% ($175K)
3% ($212K)
18% ($188K)
6% ($209K)
8% $198K
5%
($201K)
24% ($202K)
*With or without transplant
61% of private practice, 55% of Hosp/Clinic employed and 51% of AMC selected more than 1 focus area
D10. Please indicate if your work has a particular focus (select all that apply). PP3/EP1/AM3. What is your total annual gross income?

Opportunities to Expand Career
26
6%
13%
50%
10%
30% 31%
21% 21% 18%
35%
26%
36%
10%
21%
0%
10%
20%
30%
40%
50%
60%
Incorporatingclinical
research intopractice
Adoptingtelemedicine
Providingadmin svcs to
hospitals
Offering woundcare
Leadership Teaching Other
Private Practice Employed Academic
Other Services: • Wound care • Teaching • Public Health • Stewardship • Travel medicine
In terms of expanding your career, what options have you identified?

Best Potential to Demonstrate Value
27
72%
18%
9% 2%
Patient care
Antimicrobial stewardship svcs
Infection control and prevention
Other
55% 24%
16% 5%
Patient careAntimicrobial stewardship svcsInfection control and preventionOther
Private Practice Employed
41%
11% 15%
6%
13%
9%
4%
Patient careAntimicrobial stewardshipInfection control and preventionQuality improvement/patient safetyTeachingConducting researchOther
Academic
PP9/EP7/AM9. What area below represents your best potential for demonstrating your value as an ID specialist to your practice?
Detailed Findings Private Practice Physicians
28

The sample includes 321 full time physicians who report their primary place of employment as private practice
29
Private Practice
12%
21% 18% 18%
10%
10%
9%
3%
0%
5%
10%
15%
20%
25%
30%
35%
30-39 YO 40-49 YO 50-59 YO 60+ YO
Age
Male Female
Avg. age = 49
D1. What is your gender? D2. What is your age?
Male 68%
Female 32%
Gender
203 are a sole owner/partner or solo practitioner 118 are an employee or associate of the practice
N = 321
N = 321

Overall private practice distribution by age/gender and years in practice
30
41%
24% 23%
12%
0%
5%
10%
15%
20%
25%
30%
35%
40%
45%
< 10 years 11-20 years 21-30 years > 31 years
Years in Practice
Private Practice
Avg. YIP = 16
Urban 49%
Suburban 46%
Rural 5%
Community Type
D4. How would you describe the area in which you practice? D6. How long have you been in your profession since completion of your training program?
N = 321 N = 321

Private Practice Associates are Younger, While Solo/Owners/Partners Trend Older
31
8%
21% 20%
14% 14% 11%
6% 6%
0%
5%
10%
15%
20%
25%
30-39 YO 40-49 YO 50-59 YO 60+ YO
Solo/Partner vs. Employee/Associate in Private Practice by Age
Sole Owner/Partner/Solo Employee/Associate
Private Practice
Male 71%
Female 29%
Gender (Sole Owner/Partner)
Male 62%
Female 38%
Gender (Employee/Associate)
D1. What is your gender? PC1. Which of the following best describes your primary place of employment?
N = 203
N = 118
N = 321
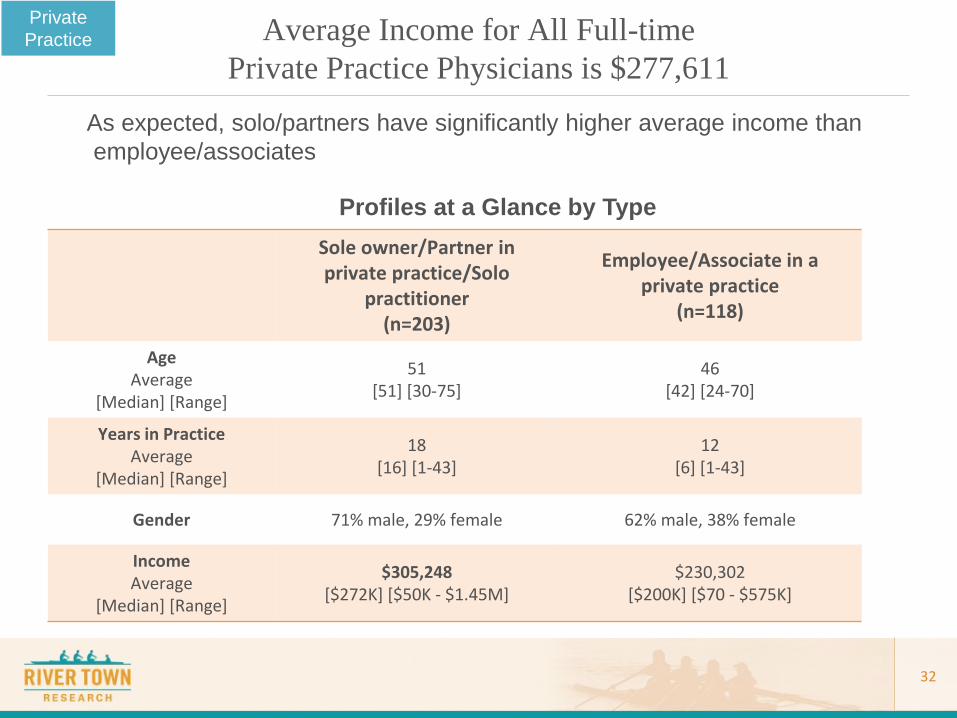
Average Income for All Full-time Private Practice Physicians is $277,611
32
Sole owner/Partner in private practice/Solo
practitioner (n=203)
Employee/Associate in a private practice
(n=118)
Age Average
[Median] [Range]
51 [51] [30-75]
46 [42] [24-70]
Years in Practice Average
[Median] [Range]
18 [16] [1-43]
12 [6] [1-43]
Gender 71% male, 29% female 62% male, 38% female
Income Average
[Median] [Range]
$305,248 [$272K] [$50K - $1.45M]
$230,302 [$200K] [$70 - $575K]
Private Practice
Profiles at a Glance by Type
As expected, solo/partners have significantly higher average income than employee/associates
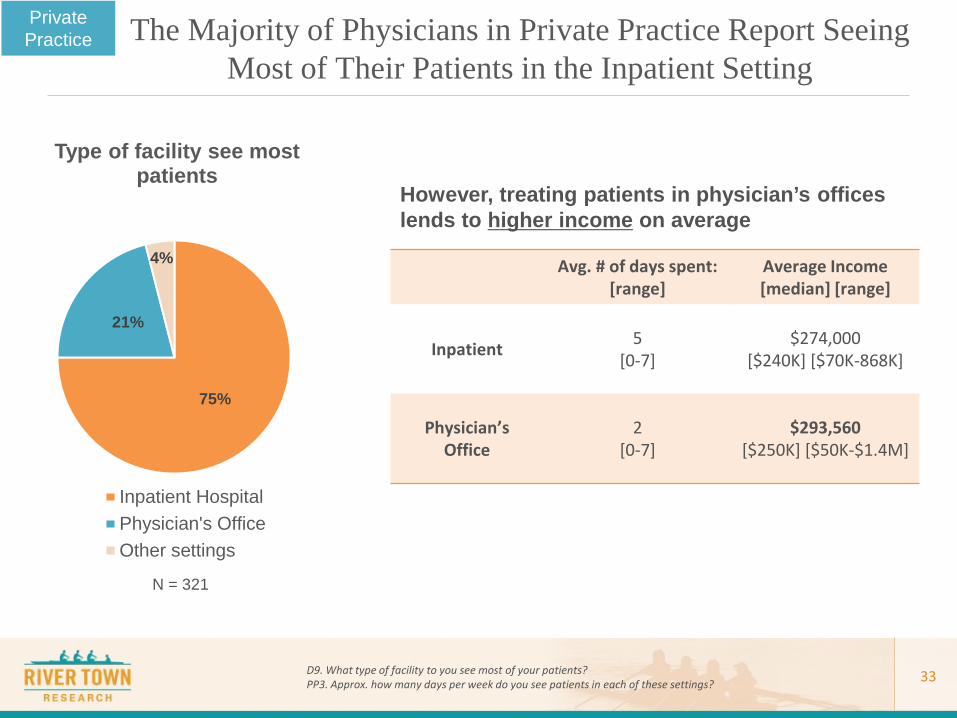
The Majority of Physicians in Private Practice Report Seeing Most of Their Patients in the Inpatient Setting
33
Private Practice
Avg. # of days spent: [range]
Average Income [median] [range]
Inpatient 5 [0-7]
$274,000 [$240K] [$70K-868K]
Physician’s Office
2 [0-7]
$293,560 [$250K] [$50K-$1.4M]
75%
21%
4%
Type of facility see most patients
Inpatient HospitalPhysician's OfficeOther settings
However, treating patients in physician’s offices lends to higher income on average
D9. What type of facility to you see most of your patients? PP3. Approx. how many days per week do you see patients in each of these settings?
N = 321

34
26%
58%
17%
Practice Type
SoloSingle specialty groupMultispecialty group
Average Income
Solo $302,329 [$255K] [$77K-$1.45M]
Single Specialty $272,900 [$240K] [$70K-$1M]
Multispecialty $256,175 [$225K] [$50K-$600K]
Private Practice
Single Specialty Size of Practice: Avg. = 9 physicians
Range = [1-91]
Multispecialty Size of Practice Avg. = 76 physicians
Range = [2-750]
Most Private Practice Physicians who Participated in the Survey are Part of a Single Specialty Group
However, income for those who are in solo practice is higher on average
PP1: What type of private practice is this?
N = 321

Overall Men in Private Practice Report Higher Compensation With Largest Gender Disparity in the 40-49 and 60+ Groups
35
252
324 315 293
198 237 257
179
$0
$50
$100
$150
$200
$250
$300
$350
24-39 age group 40-49 age group 50- 59 age group 60+ age group
Avg. Income by Age and Gender (Shown in thousands)
Male Female
Private Practice
D1: What is your gender? D2. What is your age?
N = 321

Few Private Practice Physicians Have Compensation Tied to Quality Metrics Nor Have Separately Negotiated Hourly On-call Rate
• Only 11% of private practice reported physicians that any part of their patient care compensation is tied to quality metrics such as C-diff, CLABSI or CAUTI infection rate
• No unique commonalities were found versus the overall group among these
• Only 9% reported having a separately negotiated hourly on-call rate, on average $155 ($45-$250)
36
Private Practice
PP5. If you provide a separately negotiated on-call service, what is your hourly rate? PP6. Is any part of your patient care compensation tied to quality metrics?

HIV and Infection Control are Highest Focus Areas For Private Practice Physicians
37
Private Practice
D10: Please indicate if your work has a particular focus [select all that apply].
N = 321
Pediatrics* HCV & HIV*
HIV & IC (w/or w/o steward-
ship)*
HIV and Steward-
ship* HIV*
IC and Steward-
ship* IC only*
Steward-ship
only*
General ID/Other
3% ($237K)
21% ($295K)
17% ($286K)
1% ($236K)
8% ($249K)
8% ($334K)
9% ($299K)
2% ($212K)
30% ($256K)

% of Income from Various Services
N=321
Service % of Physicians who perform
% of Income this activity represents Average
[Median] [Range]
Patient Care 100% 86% [90%] [10 – 100%]
Epidemiology/Infection Control 44% 9% [7.5%] [1 – 55%]
Antimicrobial Stewardship 32% 7% [5%] [1 – 50%]
Other Sources (Speaking, laboratory oversight, utilization management) 15% 16%
[10%] [1 – 70%]
Hospital P&T or Other Facility/System-Wide Committee 14% 4%
[3%] [1 – 10%]
Expert Witness Testimony/External Consultant 13% 7% [5%] [1 – 40%]
PP4: Approximately, what percentage of your income comes from these services?
Private Practice Patient Care Accounts for Most of Private Practice
Physicians’ Income
37

% of Income from Various Services
N=321
Service % of Physicians who perform
% of Income this activity represents Average
[Median] [Range]
Academics/Teaching 13% 7% [5%] [1 – 30%]
Bonus 10% 13% [10%] [2 – 40%]
Patient Safety/ Healthcare Quality Improvement 6% 4% [5%] [1 – 10%]
Employee Health 6% 3% [2%] [1 – 10%]
Program Director 6% 11% [10%] [2 – 30%]
Grant Funding for Clinical/Translational Research 4% 25% [20%] [2 – 50%]
Basic Research 1% 30% [30%] [10 – 50%]
PP4: Approximately, what percentage of your income comes from these services?
Private Practice Other Activities Contribute to the Overall Compensation of
Private Practice Physicians
38

The Vast Majority of Private Practice Physicians Report They Plan to Remain in Their Current Position
40
63%
15% 13% 4% 3% 2% 2%
0%
10%
20%
30%
40%
50%
60%
70%
Remain in currentmodel
Seek emplomentwithin health
system
Retire Other Seek employmentin academia
Seek position inpublic health
Seek position inindustry
Future plans in next 5 years
% of Respondents
Private Practice
PP7. Looking ahead 5 years, which best characterizes your future plan?
N = 309

6% 13%
50%
10% 21%
0%
10%
20%
30%
40%
50%
60%
Incorporating clinresearch into
practice
Adoptingtelemedicine
Providing adminsvcs to hospitals
Offering woundcare
Other
Opportunities to expand career
% of Respondents
Other Services:
• Working in an Infusion center or nursing home
• Independent medical reviews
• Physician Case Mgr.
• Working at state medical hospital
• Travel medicine/international relief work
• Informatics
• Sell practice to healthcare system
Private Practice Private Practice Physicians Report Strong Interest in Providing
Administrative Services to Hospitals to Expand Career
PP8. In terms of expanding your career, what options have you identified? 40
N = 309
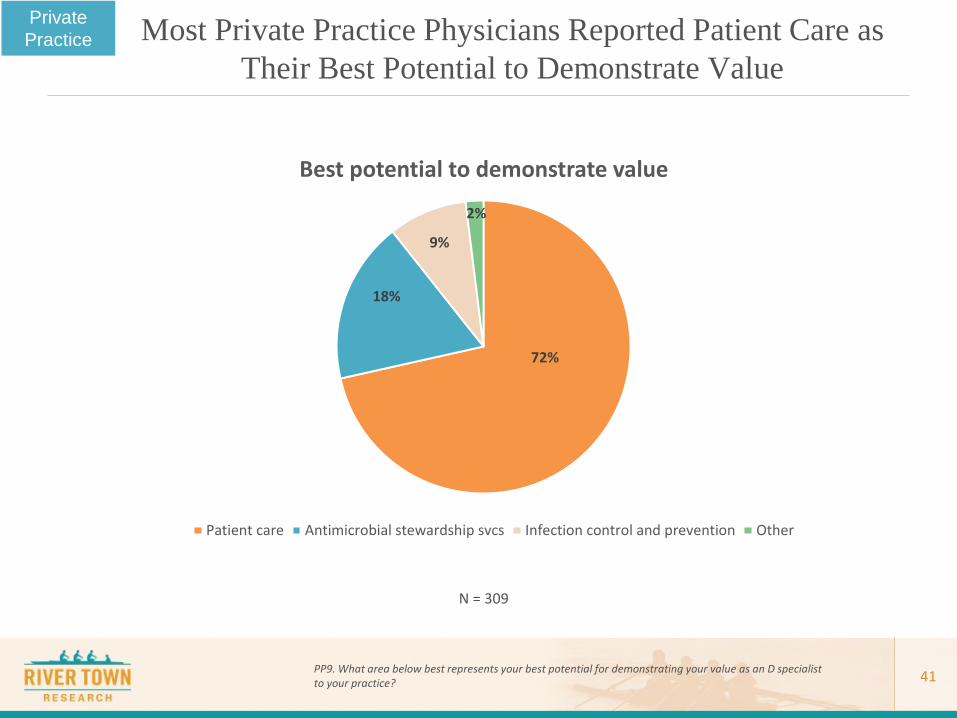
Most Private Practice Physicians Reported Patient Care as Their Best Potential to Demonstrate Value
72%
18%
9%
2%
Best potential to demonstrate value
Patient care Antimicrobial stewardship svcs Infection control and prevention Other
Private Practice
PP9. What area below best represents your best potential for demonstrating your value as an D specialist to your practice? 41
N = 309
Detailed Findings Hosp/Clinic Employed
43

Sample Included 396 Full-time Physicians who Report Their Primary Affiliation is a Hospital or Clinic
Male 64%
Female 36%
Gender
18% 17% 14% 13%
13% 11%
8% 4%
0%
5%
10%
15%
20%
25%
30%
35%
30-39 YO 40-49 YO 50-59 YO 60+ YO
Age
Male Female
D1. What is your gender? D2. What is your age?
Avg. = 48
Hosp/Clinic Employed
43
N = 396
N = 396

Overall Distribution by Community Setting and Years in Practice for Hosp/Clinic Employed Physicians
45
48%
22% 20%
8% 0%
10%
20%
30%
40%
50%
60%
< 10 years 11-20 years 21-30 years > 31 years
Years in Practice
D4. How would you describe the area in which you practice? D8. Do you work in a clinic that receives Ryan White funding? D6. How long have you been in your profession since completion of your training program?
Avg. YIP = 14
Urban 56%
Suburban 32%
Rural 12%
Community Type
Across all settings, only 29% receive Ryan White funding
Hosp/Clinic Employed
N = 396
N = 396

46 D9. What type of facility do you see most of your patients?
Type of facility where see most patients % of Respondents
Salary Average
[Median] [Range]
All full time N=396 $241,319 [$230] [$80-$865K)
Hospital (Inpatient) 67% $242,400 [$244,500K] [$80-650K)
Hospital (Outpatient) 17% $240,000 [$225K] [$120-$865K]
Community based clinic 10% $231,200 [$203K] [$92-$577K]
Other 5% $251,000 [$250K] [$145-$443K]
The majority see patients in an inpatient setting; however, those who earn the highest income on average treat most of their patients in private practice
Hosp/Clinic Employed physicians’ income averaged $241,319 ($80-$865K)
Hosp/Clinic Employed

47
229 256
279 260
204 222 227 236
$0
$50
$100
$150
$200
$250
$300
30-39 YO 40-49 YO 50-59 YO 60+ YO
Avg. Income by Age and Gender (Shown in thousands)
Male Female
Overall, Men Report Higher Compensation with the Largest Gender Disparity in the 50-59 year Group
Hosp/Clinic Employed
D1: What is your gender? D2: What is your age? EP1.What is your total annual gross income?
N = 396

49%
5% 3% 12% 30%
0%10%20%30%40%50%60%
wRVU Total Collections Total Billings Don't know Other
Basis for Compensation
% of Respondents
• 34% of physicians report any part of their patient care compensation is tied to quality metrics such as C-diff, CLABSI or CAUTI infection rate
o No unique commonalities were found versus the overall group
• 49% use wRVU as the basis for compensation
o For those who use wRVU, average target or threshold is 4,763
Several unsure of the basis of their compensation
Most here stated they were salaried
Some Physicians Have Compensation Tied to Quality Metrics and About Half Use wRVU as the Basis for Their Compensation
EP3. What is the basis for your compensation related to patient care? EP3a. What is the wRVU for a clinical FTE in your practice? EP4. Is any part of your patient care compensation tied to quality metrics?
Hosp/Clinic Employed
47
N = 378

HIV and Stewardship are the Highest Focus Areas for Employed Physicians
49 D10: Please indicate if your work has a particular focus [select all that apply].
Hosp/Clinic Employed
Pediatrics* HCV & HIV*
HIV & IC (w/or w/o steward-
ship)*
HIV and Steward-
ship* HIV*
IC and Steward-
ship* IC only*
Steward-ship
only*
General ID/Other
7% ($208K)
20% ($258K)
14% ($258K)
5% ($216K)
12% ($219K)
8% ($238K)
5% ($238K)
8% ($243K)
20% ($240K)
N = 379
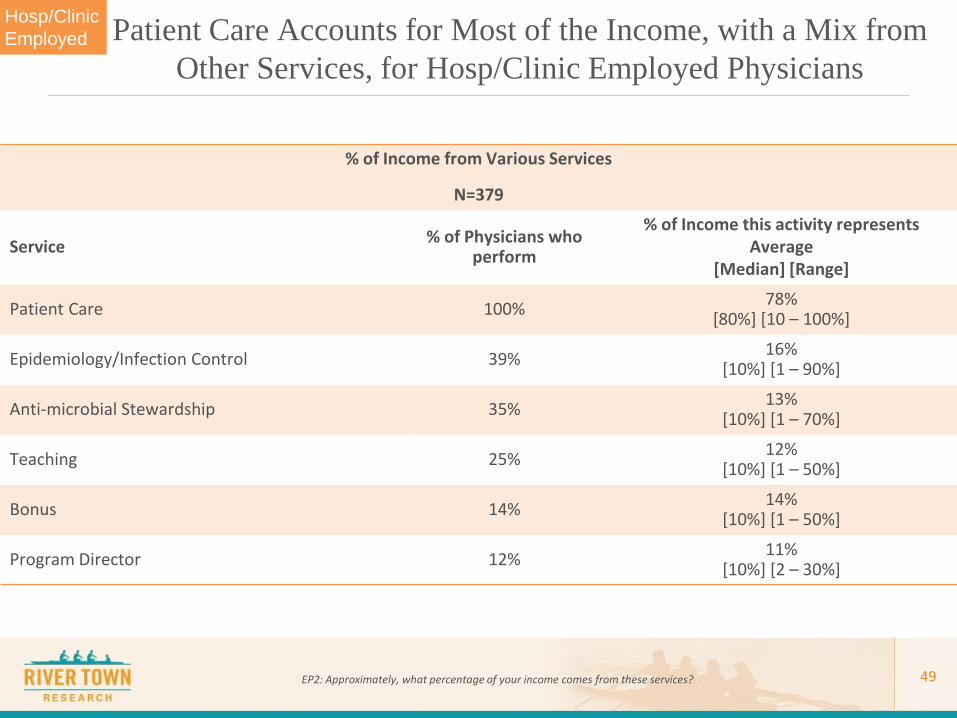
% of Income from Various Services
N=379
Service % of Physicians who perform
% of Income this activity represents Average
[Median] [Range]
Patient Care 100% 78% [80%] [10 – 100%]
Epidemiology/Infection Control 39% 16% [10%] [1 – 90%]
Anti-microbial Stewardship 35% 13% [10%] [1 – 70%]
Teaching 25% 12% [10%] [1 – 50%]
Bonus 14% 14% [10%] [1 – 50%]
Program Director 12% 11% [10%] [2 – 30%]
EP2: Approximately, what percentage of your income comes from these services?
Patient Care Accounts for Most of the Income, with a Mix from Other Services, for Hosp/Clinic Employed Physicians
Hosp/Clinic Employed
49

% of Income from Various Services
N=379
Service % of Physicians who perform
% of Income this activity represents Average
[Median] [Range]
Hospital P&T or other facility/system wide committee 12% 6% [5%] [1 – 30%]
Grant Funding for Clinical/Translational Research 11% 16% [10%] [1 – 50%]
Other Sources (Speaking, laboratory oversight, utilization management) 10% 18%
[10%] [1 – 75%]
Patient Safety / Healthcare Quality Improvement 9% 9% [5%] [1 – 32%]
Employee Health 5% 5% [5%] [1 – 10%]
Expert Witness Testimony/External Consultant 4% 5% [5%] [1 – 20%]
Basic Research 2% 9% [10%] [5 – 10%]
EP2: Approximately, what percentage of your income comes from these services?
Very few Employed Physicians Engage in Services such as Employee Health or Basic Research
Hosp/Clinic Employed
50

The Vast Majority of Employed Physicians Plan to Remain in Their Current Employment
52
72%
11% 7% 4% 3% 3% 0%
10%
20%
30%
40%
50%
60%
70%
80%
Remain in currentmodel
Retire Other Seek employment inacademics
Seek position in PH Seek to start/join aPP
Future plans in next 5 years
% of Respondents
Other: • Unsure • Adopting telemedicine • Incorporate clinical research into practice • Hospital leadership • Training • Preventative medicine • Change fields completely
EP5. Looking ahead 5 years, which best characterizes your future plan?
Hosp/Clinic Employed
N = 378

21% 18%
35%
26%
0%
5%
10%
15%
20%
25%
30%
35%
40%
Incorporating clinresearch into practice
Adopting telemedicine Pursuing position inhospital leadership
Other
Opportunities to expand career
% of Respondents
Other Services:
• Wound care
• Teaching
• Public Health
• Stewardship
• Travel medicine
Employed Physicians Look to Pursue Positions in Hospital Leadership or Other Services to Expand Their Careers
EP6. In terms of expanding your career, what options have you identified?
Hosp/Clinic Employed
52
N = 378

Most Employed Physicians Reported that Patient Care is Their Best Potential to Demonstrate Value
56% 24%
15% 5%
Best potential to demonstrate value
Patient care Antimicrobial stewardship svcs Infection control and prevention Other
EP7: What area below best represents your best potential for demonstrating your value as an D specialist to your practice?
Hosp/Clinic Employed
53
N = 378

Detailed Findings AMC Employed
55

Sample Included 460 full-time Physicians who Report their Primary Affiliation is an Academic Medical Center
Male 55%
Female 45%
Gender
13% 20%
12% 12%
16%
14%
11% 5%
0%
5%
10%
15%
20%
25%
30%
35%
40%
30-39 YO 40-49 YO 50-59 YO 60+ YO
Age
Male Female
AMC Employed
D1: What is your gender? D2: What is your age?
Avg. = 48
55
N = 460
N = 460
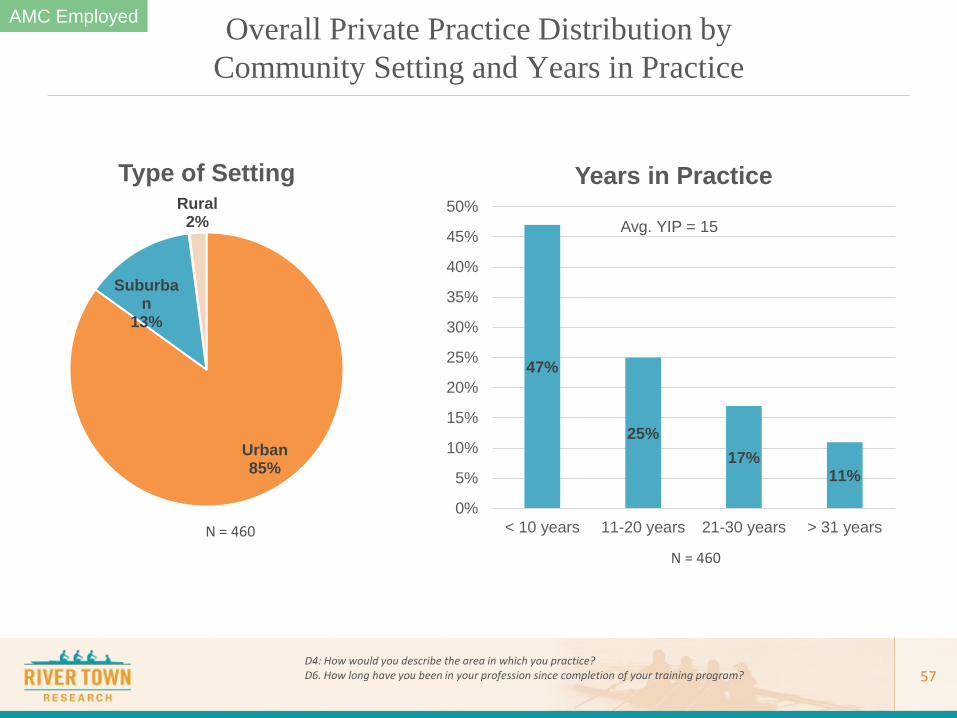
Overall Private Practice Distribution by Community Setting and Years in Practice
57
47%
25% 17%
11%
0%
5%
10%
15%
20%
25%
30%
35%
40%
45%
50%
< 10 years 11-20 years 21-30 years > 31 years
Years in Practice
Avg. YIP = 15
Urban 85%
Suburban
13%
Rural 2%
Type of Setting
D4: How would you describe the area in which you practice? D6. How long have you been in your profession since completion of your training program?
AMC Employed
N = 460
N = 460

58
Type of facility where see most patients
% of Respondents
(n=460)
Salary Average
[Median] [Range]
Hospital (Inpatient) 67% $195,277 [$180K] [$78-$700K]
Hospital (Outpatient) 27% $181,000 [$166K] [$100-$770K]
Other 6% $193,125 [$185K] [$125-$350K]
AM2. Please indicate your compensation plan status. D9: What type of facility do you see most of your patients? [Select one]
Full-time Academic physicians’ income averaged $191,485 ($78k -770K) Across All Facility Types
AMC Employed
40%
17%
42%
1%
Type of Compensation Plan
Not in comp plan (salary only)
Not in comp plan but potential for incentive
In comp plan
Other
N = 448

59
Academic Rank % of Respondents (n=460)
Salary Average
[Median] [Range]
Professor 27% $223,000 [$202K] [$78-$770K]
Assistant Professor 33% $188,500 [$174K] [$99-$430K]
Associate Professor 34% $171,300 [$166,500] [$87-$350K]
Instructor/Lecturer 2% $143,000 [$130K] [$100-$205K]
Other (Program Dir., Course Dir., Division Head, clinical assistant) 4% $195,600
[$190K] [$140-$310K]
AM1: What is your academic rank?
Professors Report the Highest Income, Followed by Other Academic Roles, such as Program Directors, etc.
AMC Employed

AMC Employed Men Report Higher Compensation with the Largest Gender Disparity in the 50-59 year Group
60
150
203
247 243
152 170
188 194
$0
$50
$100
$150
$200
$250
$300
30-39 YO 40-49 YO 50-59 YO 60+ YO
Avg. Income by Age and Gender (Shown in thousands)
Male Female
AMC Employed
D1. What is your gender? D2. What is your age? AM. What is your total annual gross income?
N = 460
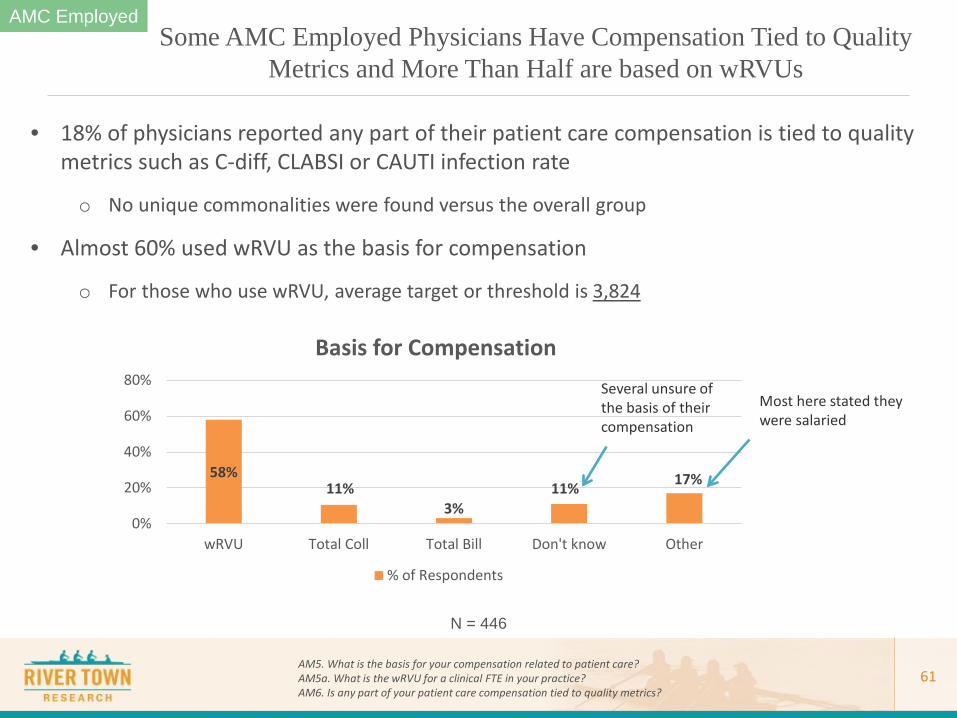
58% 11%
3% 11% 17%
0%
20%
40%
60%
80%
wRVU Total Coll Total Bill Don't know Other
Basis for Compensation
% of Respondents
• 18% of physicians reported any part of their patient care compensation is tied to quality metrics such as C-diff, CLABSI or CAUTI infection rate
o No unique commonalities were found versus the overall group
• Almost 60% used wRVU as the basis for compensation
o For those who use wRVU, average target or threshold is 3,824
Several unsure of the basis of their compensation
Most here stated they were salaried
Some AMC Employed Physicians Have Compensation Tied to Quality Metrics and More Than Half are based on wRVUs
AM5. What is the basis for your compensation related to patient care? AM5a. What is the wRVU for a clinical FTE in your practice? AM6. Is any part of your patient care compensation tied to quality metrics?
AMC Employed
61
N = 446

Pediatrics and HIV are the Highest Focus Areas for AMC Employed Physicians
62 D10. Please indicate if your work has a particular focus [select all that apply].
AMC Employed
Pediatrics HCV & HIV HIV & IC (w/or w/o steward-
ship)
HIV and Steward-
ship* HIV
IC and Steward-
ship* IC only Steward-
ship only
19% ($175K)
13% ($190K)
4% ($175K)
3% ($212K)
18% ($188K)
6% ($209K)
8% $198K
5%
($201K)
N = 449

% of Income from Various Services
N=449
Service % of Physicians who perform
% of Income this activity represents Average
[Median] [Range]
Patient Care 100% 61% [60%] [10 – 100%]
Academics/Teaching 51% 16% [10%] [1 – 75%]
Grant Funding for Clinical/Translational Research 32% 17% [15%] [1 – 70%]
Epidemiology/Infection Control 27% 29% [25%] [1 – 80%]
Program Director 26% 18% [20%] [1 – 64%]
Anti-microbial Stewardship 23% 20% [10%] [1 – 65%]
AM2. Approximately, what percentage of your income comes from these services?
Patient Care Accounts for Most of the Income for AMC Employed Physicians, with a Mix from Other Services
AMC Employed
63

% of Income from Various Services
N=449
Service % of Physicians who perform % of Income this activity represents
Average [Median] [Range]
Other Sources (Speaking, laboratory oversight, utilization management) 19% 18%
[11%] [1 – 75%]
Bonus 11% 8% [5%] [1 – 28%]
Patient Safety / Healthcare Quality Improvement 7% 16% [10%] [3 – 75%]
Basic Research 6% 19% [10%] [3– 55%]
Expert Witness Testimony/External Consultant 6% 9% [5%] [1 – 25%]
Hospital P&T or other Facility/System-Wide Committee 6% 11%
[5%] [1 – 25%]
Employee Health 3% 7% [5%] [1 – 20%]
AM2: Approximately, what percentage of your income comes from these services?
Very Few AMC Physicians Engage in Services such as Employee Health, Basic Research or Hospital P&T
AMC Employed
64

The Majority of AMC Employed Physicians Plan to Remain with Their Current Employment
65
74%
9%
17%
0%
10%
20%
30%
40%
50%
60%
70%
80%
Remain in current model Retire Other
Future plans in next 5 years
% of Respondents
AM7. Looking ahead 5 years, which best characterizes your future plan?
Seek employment in different areas: 5% Other (not sure, change to another field, etc.) 4% In health system 3% In academics 2% In private practice 2% Industry 1% Public Health
AMC Employed
N = 447

36%
10%
30% 31%
21%
0%
5%
10%
15%
20%
25%
30%
35%
40%
Incorporating CR Telemedicine Leadership Teaching Other
Opportunities to expand career
% of Respondents
Other Services:
• Wound care
• Travel medicine
• Teaching
• Infection control
• Industry consulting
• Medical journalism
• Quality improvement
• Moonlighting for other primary care
• Disaster preparedness
AMC Employed Physicians See Incorporating Clinical Research and Pursuing Hospital Leadership as Career Opportunities
AM8. In terms of expanding your career, what options have you identified?
AMC Employed
66
N = 447
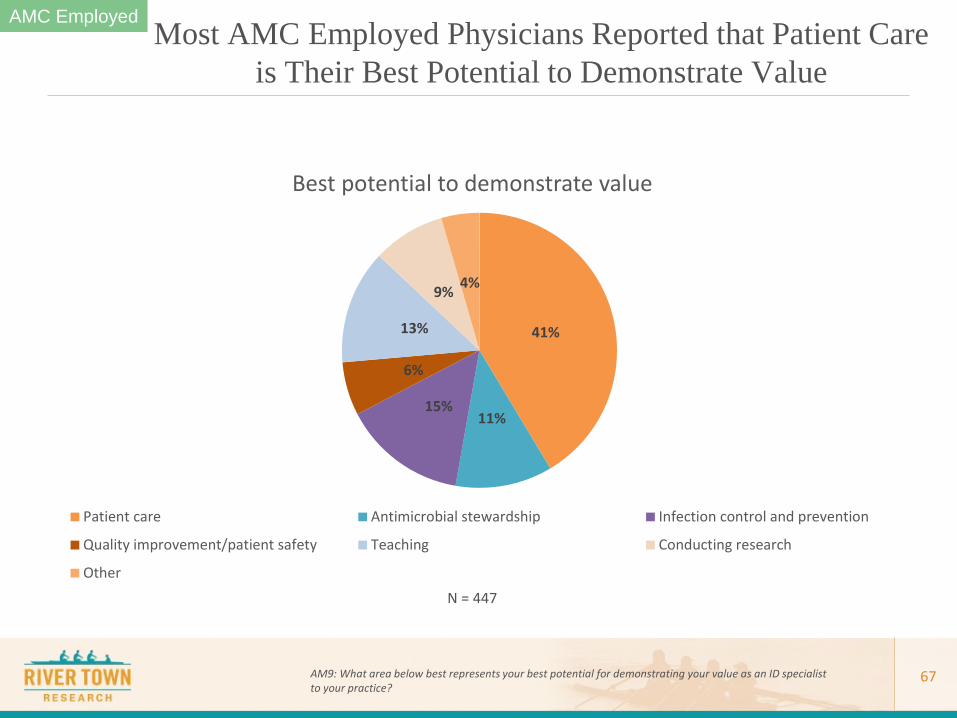
41%
11% 15%
6%
13%
9% 4%
Best potential to demonstrate value
Patient care Antimicrobial stewardship Infection control and prevention
Quality improvement/patient safety Teaching Conducting research
Other
Most AMC Employed Physicians Reported that Patient Care is Their Best Potential to Demonstrate Value
AM9: What area below best represents your best potential for demonstrating your value as an ID specialist to your practice?
AMC Employed
67
N = 447
Detailed Findings Research Physicians (Basic or Clinical)
68
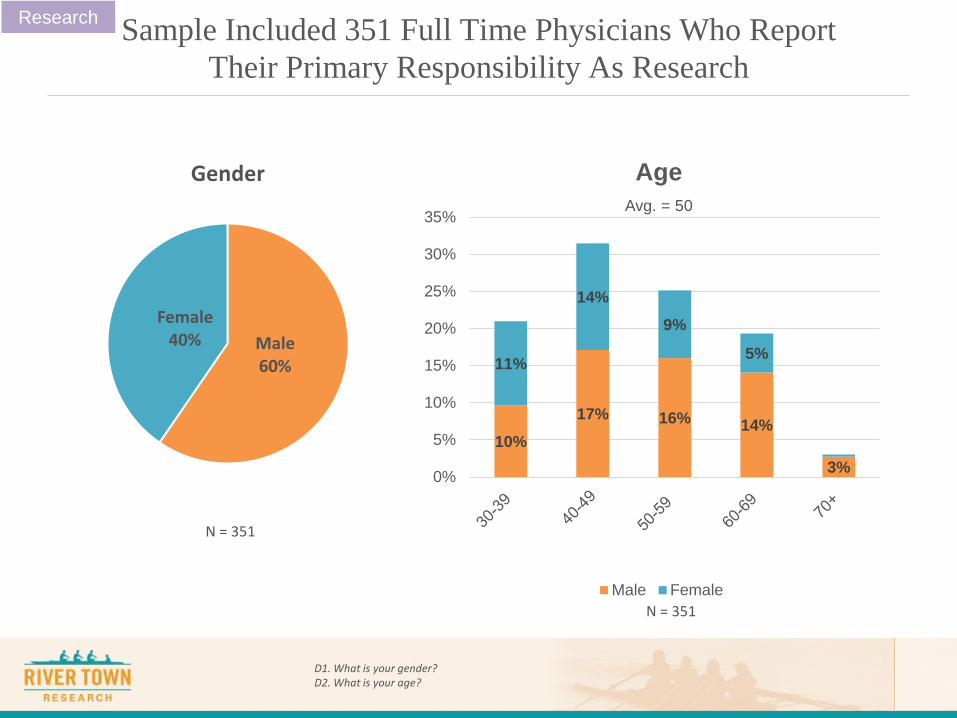
Sample Included 351 Full Time Physicians Who Report Their Primary Responsibility As Research
Male 60%
Female 40%
Gender
10% 17% 16% 14%
3%
11%
14% 9%
5%
0%
5%
10%
15%
20%
25%
30%
35%
Age
Male Female
D1. What is your gender? D2. What is your age?
Research
Avg. = 50
N = 351
N = 351

70
44
19 25
12
0
5
10
15
20
25
30
35
40
45
50
< 10 years 11-20 years 21-30 years 31-40 years
Years in Practice
97%
3%
Working Status
Full time Part time
R6. Please indicate your working status. R5. How long have you been in your profession since completion of your training program
Almost All Research Physicians Work Full-time and ~ Half Report Being in Practice 10 years or less
Research
Avg. YIP = 16
N = 363 N = 349

Majority of Physicians in Research are in an Urban Area
71
Urban 88%
Suburban 11%
Rural 1%
Community Setting
D4. How would you describe the area in which you practice?
Research
N = 351

Most Researchers Do Not Sit in an Administrative Appointment at Their Facility
72
28%
72%
Perform in academic administrative appointment
(dean, chair, etc.)
Yes
No
Research
R4. Do you have an academic administrative appointment (i.e. dean, chair, division chief, etc.)?
N = 351

Almost 60% report Their Institution Does Not Provide Subsidies and Most Are Not in a Set Compensation Plan
73
45%
12%
35%
9%
Type of Compensation Plan
Not in comp plan (salary only)Not in comp plan but potential for incentiveIn comp planOther
R9. Does your institution provide subsidies for your work such as provision of support staff, technician, free core services, etc.? R7. Please indicate your compensation plan status.
Research
41%
59%
Institutional provision of subsidies for work
Yes, provides subsidies No, does not provide subsidies
Other = Salaried with or without bonus
N = 351
N = 351
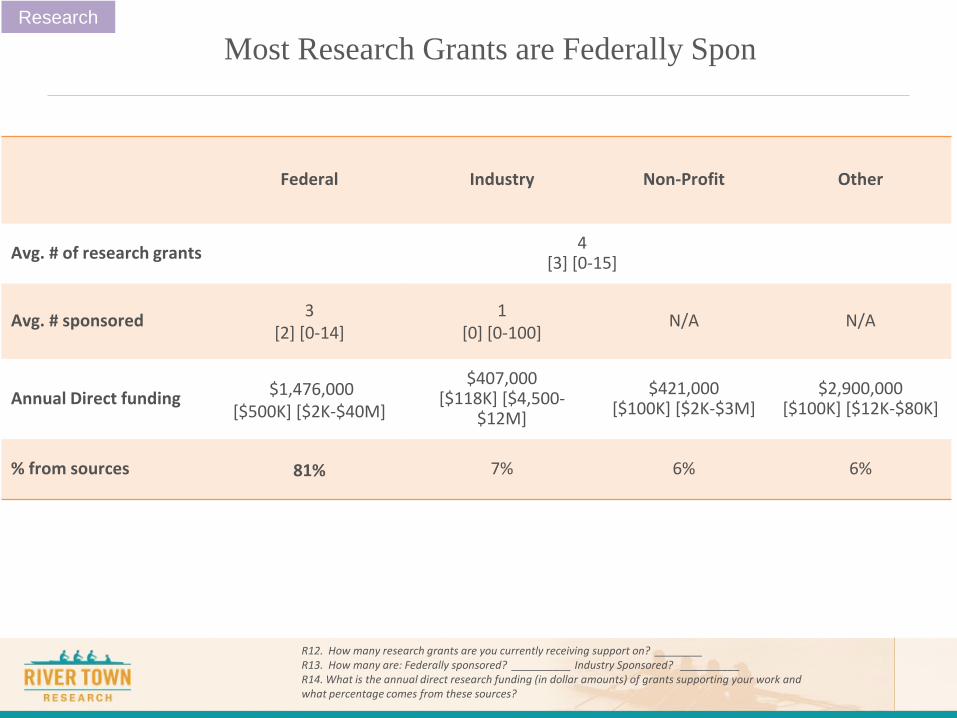
Federal Industry Non-Profit Other
Avg. # of research grants 4 [3] [0-15]
Avg. # sponsored 3 [2] [0-14]
1 [0] [0-100]
N/A N/A
Annual Direct funding $1,476,000 [$500K] [$2K-$40M]
$407,000 [$118K] [$4,500-
$12M]
$421,000 [$100K] [$2K-$3M]
$2,900,000 [$100K] [$12K-$80K]
% from sources 81% 7% 6% 6%
R12. How many research grants are you currently receiving support on? ________ R13. How many are: Federally sponsored? __________ Industry Sponsored? __________ R14. What is the annual direct research funding (in dollar amounts) of grants supporting your work and what percentage comes from these sources?
Most Research Grants are Federally Spon Research
75
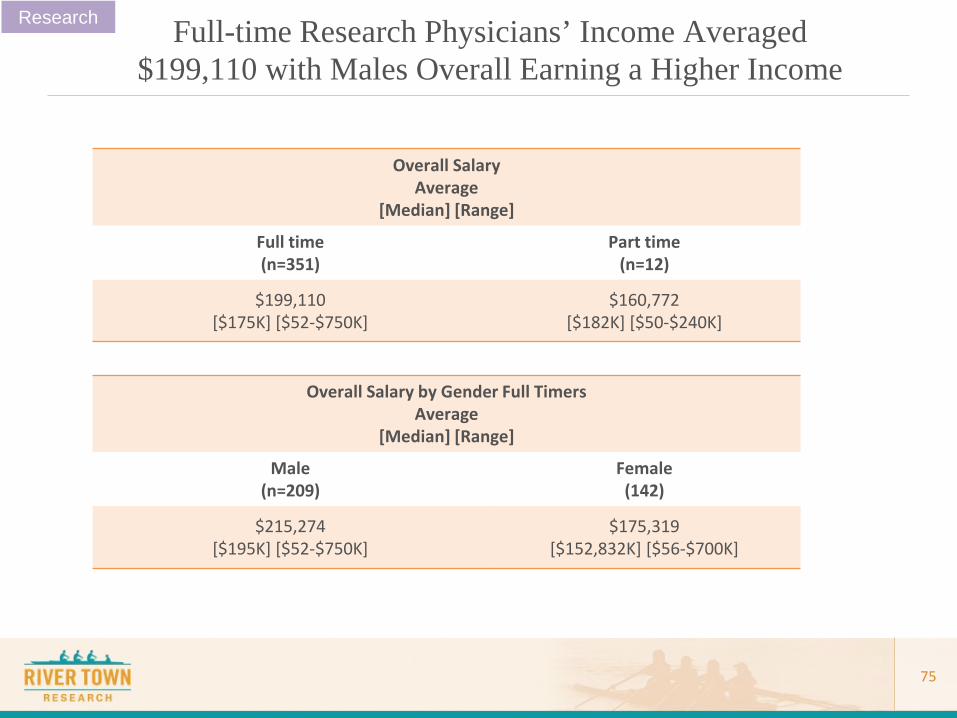
Overall Salary Average
[Median] [Range]
Full time (n=351)
Part time (n=12)
$199,110 [$175K] [$52-$750K]
$160,772 [$182K] [$50-$240K]
Overall Salary by Gender Full Timers Average
[Median] [Range]
Male (n=209)
Female (142)
$215,274 [$195K] [$52-$750K]
$175,319 [$152,832K] [$56-$700K]
Full-time Research Physicians’ Income Averaged $199,110 with Males Overall Earning a Higher Income
Research

76
134
170
251 280
120
161
233 231
$0
$50
$100
$150
$200
$250
$300
30-39 40-49 50-59 60+
Avg. Income by Age and Gender (Shown in thousands)
Male Female
Research Overall men report higher compensation, the largest disparity was in the 60+ year old group
D1. What is your gender? D2. What is your age? R. What is your total annual gross income?
N = 351

77 R3. What is your academic rank? R8. What is your total annual gross income?
Research Professors Have Significantly Higher Incomes than Assistant and Associate Professors
Academic Rank % of Respondents Salary
Average [Median] [Range]
Professor 40% $260,863 [$234,500] [$52-$750K]
Assistant Professor 33% $143,750 [$135K] [$65-$600K]
Associate Professor 17% $180,334 [$173K] [$105-$320K]
Instructor/Lecturer 5% $97,818 [$95K] [$65-$143K]
Other (Senior Directors, clinical faculty) 5% $239,275 [$183,000] [$54-$580K]
N = 351

% of Income from Various Services
N=351
Service % of Physicians who perform
% of Time this activity represents
Average
% of Income this activity represents
Average
Patient Care 84% 27% 23% [20%] [1 – 100%]
Teaching 77% 12% 11% [10%] [1 – 70%]
Clinical/Translational Research 80% 76% 61% [65%] [2 – 100%]
Basic Research 40% 52% 58% [60%] [5 – 100%]
Administration 60% 19% 23% [15%] [2 – 10%]
Epidemiology/Infection Control 9% 13% 12% [10%] [1 – 30%]
R11: Approximately, what percentage of your income comes from these services?
Research Accounts for Most of Their Income, with a Mix from Other Services
Research
% of Income from Various Services
N=351
Service % of Physicians who perform
% of Time this activity represents
Average
% of Income this activity represents
Average [Median] [Range]
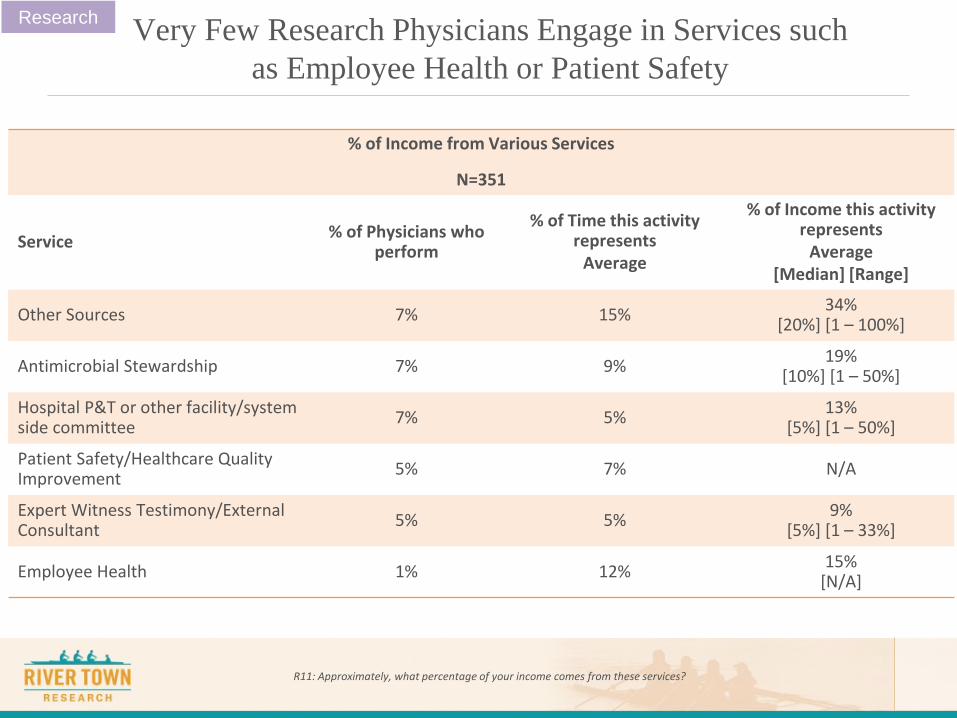
Other Sources 7% 15% 34% [20%] [1 – 100%]
Antimicrobial Stewardship 7% 9% 19% [10%] [1 – 50%]
Hospital P&T or other facility/system side committee 7% 5% 13%
[5%] [1 – 50%]
Patient Safety/Healthcare Quality Improvement 5% 7% N/A
Expert Witness Testimony/External Consultant 5% 5% 9%
[5%] [1 – 33%]
Employee Health 1% 12% 15% [N/A]
R11: Approximately, what percentage of your income comes from these services?
Very Few Research Physicians Engage in Services such as Employee Health or Patient Safety
Research

The Majority of Research Physicians Plan to Remain in Current Employment
80
76%
5% 9% 10%
0%
10%
20%
30%
40%
50%
60%
70%
80%
Remain in my currentemployment model
Seek employment inacademics
Retire Other
Future plans in next 5 years
% of Respondents
R16. Looking ahead 5 years, which best characterizes your future plan?
Research
Seek employment in different areas
N = 351

76%
13% 3% 8% 0%
10%
20%
30%
40%
50%
60%
70%
80%
90%
Conducting research Patient care Teaching Other
Best potential to demonstrate value
% of Respondents
Most Reported that Conducting Research is Their Best Potential to Demonstrate Value
R17: What area below best represents your best potential for demonstrating your value as an ID specialist to your practice?
Research
Quality improvement Antimicrobial stewardship Infection control
N = 351

Detailed Findings Public Health
82

Male 43%
Female 57%
Gender
6% 7%
14% 17%
12%
17%
12%
14%
0%
5%
10%
15%
20%
25%
30%
35%
30-39 YO 40-49 YO 50-59 YO 60+ YO
Age
Male Female
Public Health Sample Included 60 Full-time Physicians who Report
Their Primary Responsibility as Public Health
Avg. = 50
D1: What is your gender? D2: What is your age?
N = 60
N = 60

84
31 26
31
12
0
5
10
15
20
25
30
35
< 10 years 11-20 years 21-30 years 31-40 years
Years in Practice
85%
15%
Working Status
Full time Part time
PH4. Please indicate your working status. PH3. How long have you been in your profession since completion of your training program?
Public Health The Majority of Those in Public Health Work Full-time
Avg. YIP = 17
N = 71
N = 60

85
Urban 88%
Suburban 8%
Rural 4%
Community Setting
D4. How would you describe the area in which you practice?
Public Health Majority of Physicians in Public Health are in an Urban Area
86
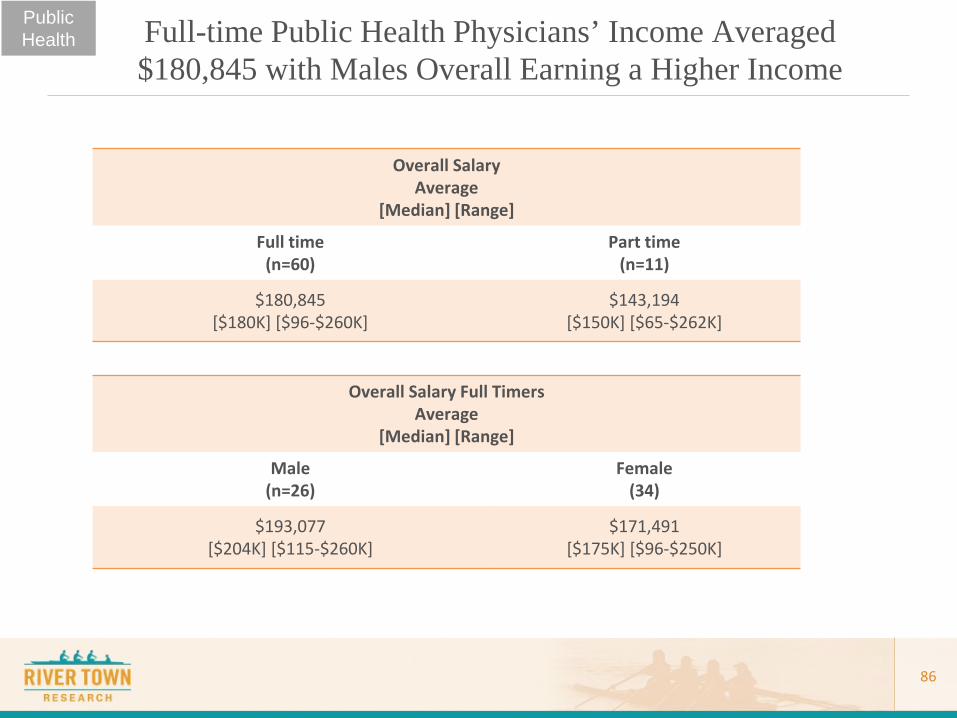
Overall Salary Average
[Median] [Range]
Full time (n=60)
Part time (n=11)
$180,845 [$180K] [$96-$260K]
$143,194 [$150K] [$65-$262K]
Overall Salary Full Timers Average
[Median] [Range]
Male (n=26)
Female (34)
$193,077 [$204K] [$115-$260K]
$171,491 [$175K] [$96-$250K]
Full-time Public Health Physicians’ Income Averaged $180,845 with Males Overall Earning a Higher Income
Public Health
87
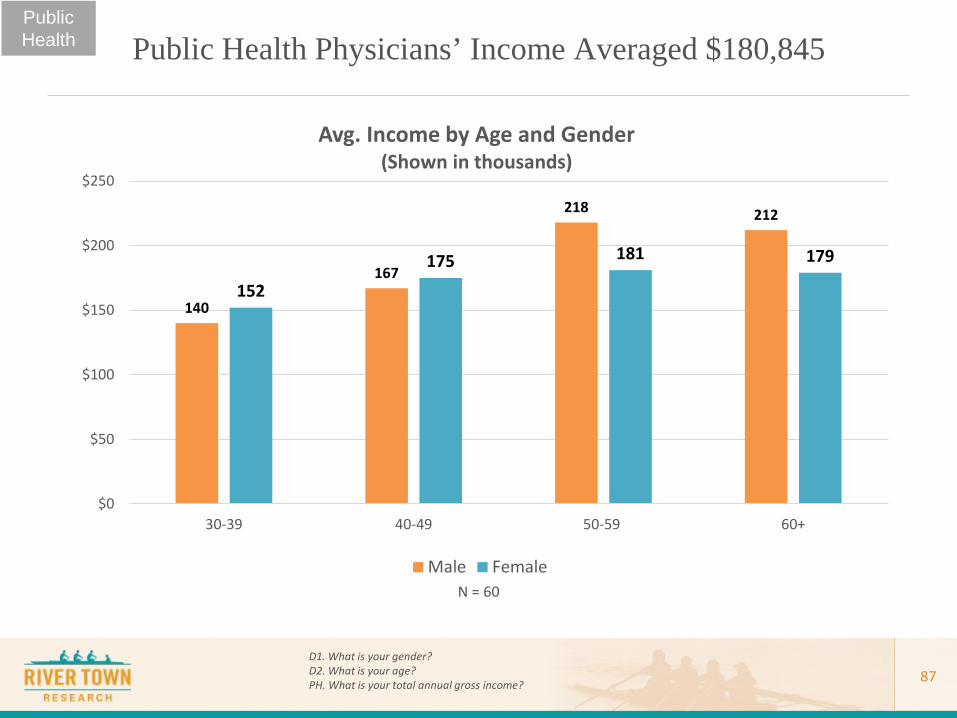
140
167
218 212
152
175 181 179
$0
$50
$100
$150
$200
$250
30-39 40-49 50-59 60+
Avg. Income by Age and Gender (Shown in thousands)
Male Female
Public Health Public Health Physicians’ Income Averaged $180,845
D1. What is your gender? D2. What is your age? PH. What is your total annual gross income?
N = 60

Federal Government Employees Command the Highest Income on Average in Public Health
88
Primary Work Location with Mean Income
PH2. Where is your primary site of work? PH6. What is your total annual gross income?
Public Health
Primary Work location % of Respondents (n=60)
Salary Average
[Median] [Range]
Federal government 38% $188,803 [$200K] [$115-$260K]
State 15% $183,801 [$180K] [$132-$239K]
County 25% $181,641 [$180K] [$96-$229K]
Academic 15% $161,600 [$156K] [$132-$210K]
Other (private contractor) 7% $168,750 [$160K] [$140-$215K]

89
TB clinic, 18%
HIV clinic, 39%
STD clinic, 18%
Other, 24%
Type of Public Health Setting
Yes 55%
No 45%
See Patients in a Public Health Setting
(e.g. Indian Hospital or Travel Clinic)
N = 33 N = 60
PH5. Do you see patients in a public health setting? PH5a. In what setting?
Public Health 55% Report Seeing Patients in the PH setting

90
Yes 12%
No 88%
Compensated for Non Clinical Duties
On official time 85%
On own time 9%
Not at all 6%
Type of Time Spent on Infectious Disease Patients
N = 33 N = 33
PH5b. How do you see patients as an infectious disease/HIV specialist? PH5c. If you see patients as an infectious disease/HIV specialist on official job time in your public health
role, do you receive additional or enhanced payment beyond your normal pay for your non-clinical duties?
Public Health Most See Patients on Official time Yet Few Receive
Additional Compensation for Non-clinical Duties

Service % Physicians who Perform Service
N=60
Mean % of Income Received for Service
N=60
Epidemiology/Infection control 65% 50%
Patient care 62% 21%
Teaching 51% 14%
Other Sources 33% 50%
Grant Funding 29% 25%
Patient Safety/Healthcare Quality Improvement 26% 15%
Program Director 23% 40%
Antimicrobial Stewardship 17% 19%
Employee Health 10% 10%
Basic Research 9% 12%
Expert Witness testimony/External Consultant 9% 9%
Hospital P&T or other facility/system-wide committee 7% 9%
PH7. Approximately, what percentage of your income comes from these services
Public Health PH Physicians Perform Mostly Epidemiology and
Infection Control

The Majority of Public Health Physicians Plan to Remain with Current Employment
92
67%
7%
17% 11%
0%
10%
20%
30%
40%
50%
60%
70%
80%
Remain in currentposition
Look for position inindustry
Retire Other
Future plans in next 5 years
% of Respondents
R16. Looking ahead 5 years, which best characterizes your future plan?
Public Health
Seek employment in different areas
N = 60
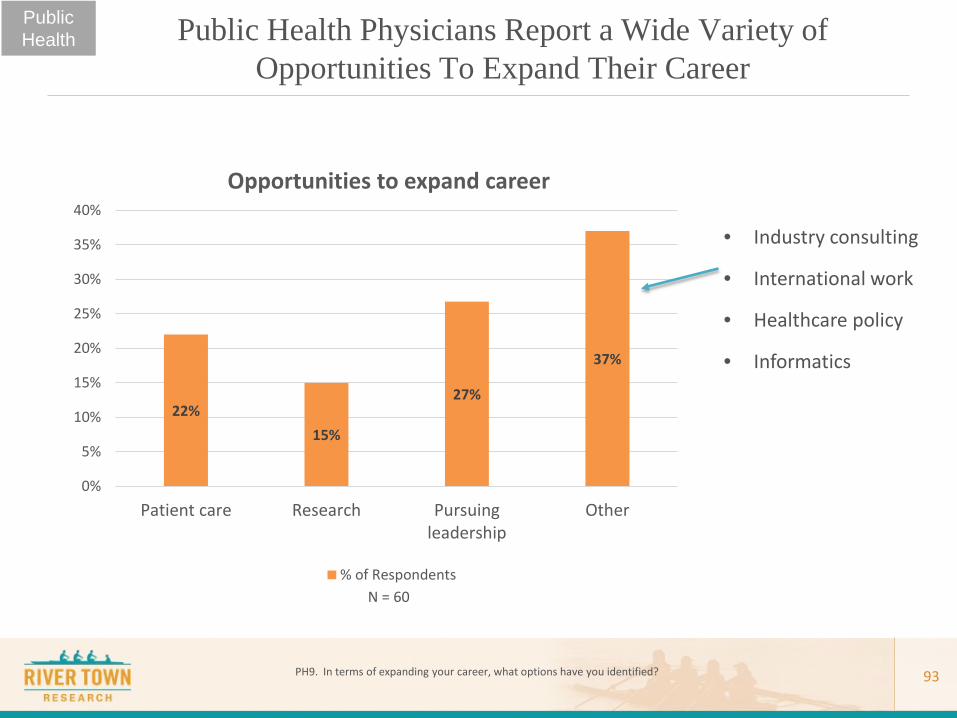
22% 15%
27%
37%
0%
5%
10%
15%
20%
25%
30%
35%
40%
Patient care Research Pursuingleadership
Other
Opportunities to expand career
% of Respondents
Public Health Physicians Report a Wide Variety of Opportunities To Expand Their Career
PH9. In terms of expanding your career, what options have you identified?
Public Health
• Industry consulting
• International work
• Healthcare policy
• Informatics
93
N = 60

Detailed Findings Other
94

2% 12%
27% 27%
6%
10%
12% 6%
0%
5%
10%
15%
20%
25%
30%
35%
40%
45%
30-39 YO 40-49 YO 50-59 YO 60+ YO
Age
Male Female
Other 180 Classify Themselves as Full-time “Other” – Very Few Commonalities Exist, Although Most Tend to be Older (50+)
Avg. = 55
D1. What is your gender? D2. What is your age?
Male 67%
Female 33%
Gender
95
N = 180
N = 180

96
Overall Salary Average
[Median] [Range]
Full time (n=180)
Part time (n=7)
$295,200 [$260K] [$65K-$1M]
$564,750 [$92K] [$75-$2M]
Overall Salary Full Timers Average
[Median] [Range]
Male (n=121)
Female (n=59)
$325,583 [$300K] [$65K – $1M]
$234,753 [$210K] [$104-$700K]
Overall salary of those categorized as “Other”
O5: What is your total gross income?
Other
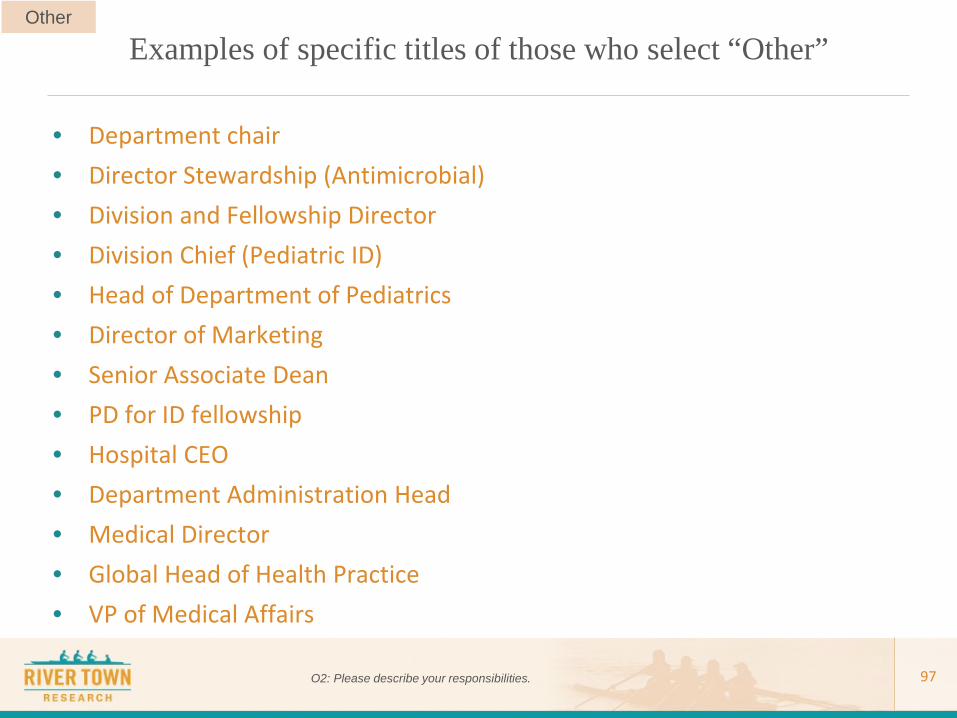
Examples of specific titles of those who select “Other”
• Department chair • Director Stewardship (Antimicrobial) • Division and Fellowship Director • Division Chief (Pediatric ID) • Head of Department of Pediatrics • Director of Marketing • Senior Associate Dean • PD for ID fellowship • Hospital CEO • Department Administration Head • Medical Director • Global Head of Health Practice • VP of Medical Affairs
97 O2: Please describe your responsibilities.
Other

Appendix

Appendix
99
Survey Instrument