infant mortality in new york state, 2002-2012 · trends and maternal and infant characteristics...
TRANSCRIPT

1
Poisoning Deaths Involving Opioid Analgesics in New York State, 2003 – 2012
Infant Mortality in New York State, 2002-2012
Tong Wang, MA, MS, Larry D. Schoen, MBA, Thomas A. Melnik, DrPH
Abstract
Objectives: This report presents 2002-2012 infant mortality statistics for New York State from the linked birth/death certificate data set by maternal and infant characteristics.
Methods: Birth and infant death certificate records for New York State residents were linked using both deterministic and probabilistic record linkage algorithms. Descriptive analysis was conducted to examine trends and maternal and infant characteristics associated with infant mortality in New York State.
Results: The New York State infant mortality rate was 4.97 per 1,000 live births in 2012; this represents a 16.6% decline from a rate of 5.96 per 1,000 live births in 2002. The number of infant deaths was 1,188 in 2012: 308 fewer than in 2002. From 2002 to 2012, the infant mortality rate declined 20.1% for non-Hispanic whites to 3.70 per 1,000 live births; 17.6% for non-Hispanic blacks to 8.96 per 1,000 live births; and 0.8% for Hispanics to 5.27 per 1,000 live births. Asian and Pacific Islanders had the lowest rate in 2012 at 3.54 per 1,000 live births; however, this represented a 6.9% increase since 2002 for this group. From 2002 to 2012, the neonatal mortality rate declined by 20.7% to 3.37 per 1,000 live births, while the post-neonatal mortality rate declined 7.0% to 1.59 per 1,000 live births. In 2012, the mortality rate for early term infants (37-38 weeks gestation) was more than twice the rate of full term infants (39-40 weeks gestation): 2.61 and 1.21 per 1,000 live births, respectively. For multiple births, the infant mortality rate was 21.51 per 1,000 live births in 2012, almost five times the rate of 4.22 per 1,000 live births for singleton births. The three leading causes of infant death in 2012 were prematurity, congenital malformation and cardiovascular disorders originating in the perinatal period.
Introduction
Infant mortality is a key indicator of a population’s overall health and is defined as the number of infant deaths occurring within the first year of life per 1,000 live births. Infant mortality surveillance provides important information regarding the factors associated with infant mortality that can be useful for program planning and prevention activities. New York State is committed to addressing risk factors that lead to poor birth outcomes, especially in hard to reach populations. State and local efforts have been successful in improving women's health before pregnancy, promoting quality and safety in prenatal care, promoting
New York State Department of Health Office of Quality and Patient Safety Bureau of Vital Statistics
2
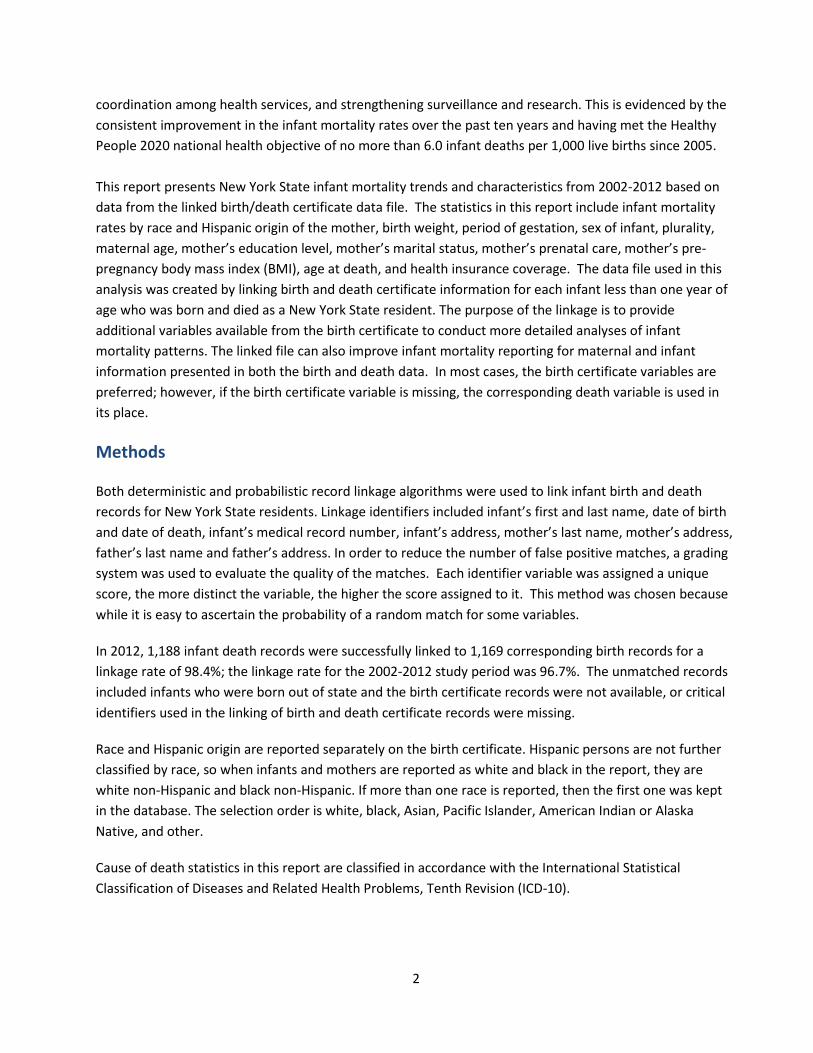
coordination among health services, and strengthening surveillance and research. This is evidenced by the consistent improvement in the infant mortality rates over the past ten years and having met the Healthy People 2020 national health objective of no more than 6.0 infant deaths per 1,000 live births since 2005. This report presents New York State infant mortality trends and characteristics from 2002-2012 based on data from the linked birth/death certificate data file. The statistics in this report include infant mortality rates by race and Hispanic origin of the mother, birth weight, period of gestation, sex of infant, plurality, maternal age, mother’s education level, mother’s marital status, mother’s prenatal care, mother’s pre-pregnancy body mass index (BMI), age at death, and health insurance coverage. The data file used in this analysis was created by linking birth and death certificate information for each infant less than one year of age who was born and died as a New York State resident. The purpose of the linkage is to provide additional variables available from the birth certificate to conduct more detailed analyses of infant mortality patterns. The linked file can also improve infant mortality reporting for maternal and infant information presented in both the birth and death data. In most cases, the birth certificate variables are preferred; however, if the birth certificate variable is missing, the corresponding death variable is used in its place.
Methods
Both deterministic and probabilistic record linkage algorithms were used to link infant birth and death records for New York State residents. Linkage identifiers included infant’s first and last name, date of birth and date of death, infant’s medical record number, infant’s address, mother’s last name, mother’s address, father’s last name and father’s address. In order to reduce the number of false positive matches, a grading system was used to evaluate the quality of the matches. Each identifier variable was assigned a unique score, the more distinct the variable, the higher the score assigned to it. This method was chosen because while it is easy to ascertain the probability of a random match for some variables.
In 2012, 1,188 infant death records were successfully linked to 1,169 corresponding birth records for a linkage rate of 98.4%; the linkage rate for the 2002-2012 study period was 96.7%. The unmatched records included infants who were born out of state and the birth certificate records were not available, or critical identifiers used in the linking of birth and death certificate records were missing.
Race and Hispanic origin are reported separately on the birth certificate. Hispanic persons are not further classified by race, so when infants and mothers are reported as white and black in the report, they are white non-Hispanic and black non-Hispanic. If more than one race is reported, then the first one was kept in the database. The selection order is white, black, Asian, Pacific Islander, American Indian or Alaska Native, and other.
Cause of death statistics in this report are classified in accordance with the International Statistical Classification of Diseases and Related Health Problems, Tenth Revision (ICD-10).
3
Results and Discussion
Trends in infant mortality
Statewide trends provide important information regarding the trajectory of infant mortality, a key indicator of New York State’s health. Detailed information describing infant and maternal factors associated with infant, neonatal, and post neonatal mortality can be found in Tables 1 and 2.
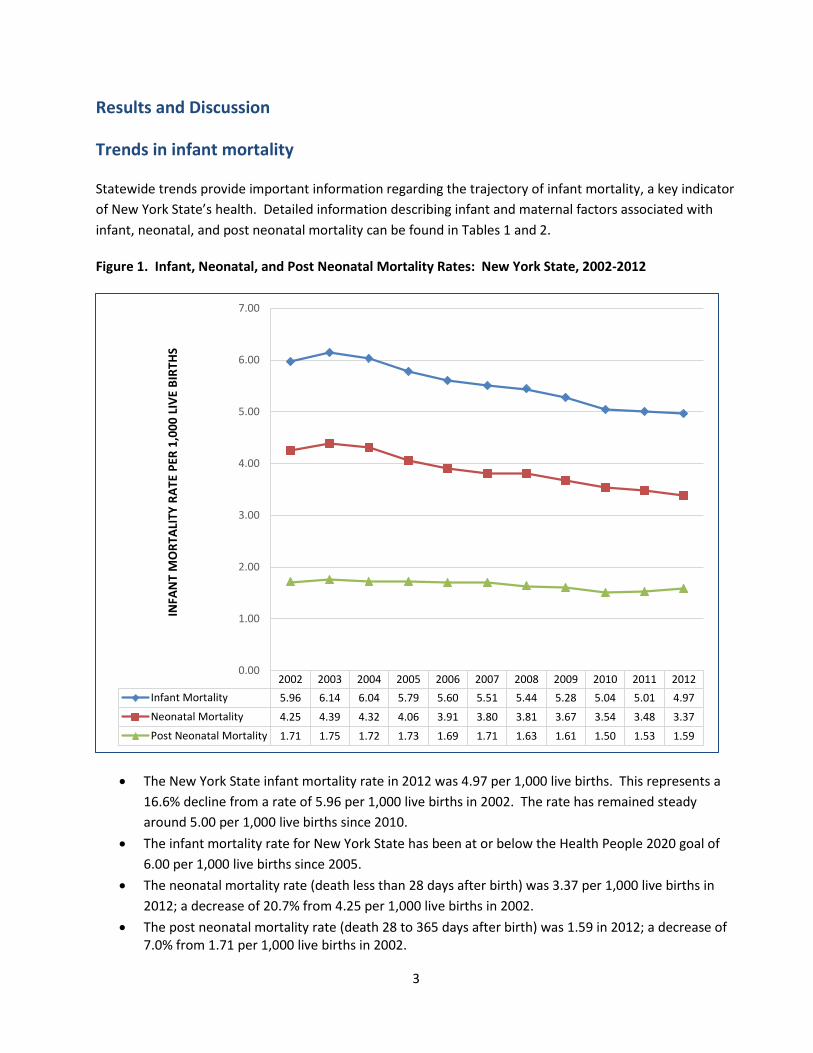
Figure 1. Infant, Neonatal, and Post Neonatal Mortality Rates: New York State, 2002-2012
• The New York State infant mortality rate in 2012 was 4.97 per 1,000 live births. This represents a 16.6% decline from a rate of 5.96 per 1,000 live births in 2002. The rate has remained steady around 5.00 per 1,000 live births since 2010.
• The infant mortality rate for New York State has been at or below the Health People 2020 goal of 6.00 per 1,000 live births since 2005.
• The neonatal mortality rate (death less than 28 days after birth) was 3.37 per 1,000 live births in 2012; a decrease of 20.7% from 4.25 per 1,000 live births in 2002.
• The post neonatal mortality rate (death 28 to 365 days after birth) was 1.59 in 2012; a decrease of 7.0% from 1.71 per 1,000 live births in 2002.
2002 2003 2004 2005 2006 2007 2008 2009 2010 2011 2012Infant Mortality 5.96 6.14 6.04 5.79 5.60 5.51 5.44 5.28 5.04 5.01 4.97Neonatal Mortality 4.25 4.39 4.32 4.06 3.91 3.80 3.81 3.67 3.54 3.48 3.37Post Neonatal Mortality 1.71 1.75 1.72 1.73 1.69 1.71 1.63 1.61 1.50 1.53 1.59
0.00
1.00
2.00
3.00
4.00
5.00
6.00
7.00
INFA
NT
MO
RTAL
ITY
RATE
PER
1,0
00 L
IVE
BIRT
HS

4
Mother’s region of residence: New York City and Rest of State
Figure 2. Infant Mortality Rates by Mother’s Region of Residence: New York State, 2002-2012
• In 2012, the infant mortality rate was at 4.48 per 1,000 live births among mothers who were New York State residents and living in New York City (NYC), and at 5.45 among mothers living in New York State exclusive of New York City referred to as Rest of State (ROS).
• Since 2002, the infant mortality rate decreased 23.2% among mothers living in NYC, and only 10.5% among mothers living in ROS.
2002 2003 2004 2005 2006 2007 2008 2009 2010 2011 2012New York City 5.83 6.37 6.04 5.56 5.65 5.09 5.05 4.88 4.49 4.36 4.48Rest of State 6.09 5.94 6.03 5.99 5.56 5.90 5.81 5.67 5.58 5.64 5.45
0.00
1.00
2.00
3.00
4.00
5.00
6.00
7.00
INFA
NT
MO
RTAL
ITY
RATE
PER
1,0
00 L
IVE
BIRT
HS

5
Mother’s race/ethnicity
Figure 3. Infant Mortality Rates by Mother's Racial/Ethnic Group: New York State, 2002-2012
• In 2012, the infant mortality rate was highest among non-Hispanic blacks at 8.96 per 1,000 live births, followed by Hispanics (5.27 per 1,000 live births), non-Hispanic whites (3.70 per 1,000 live births), and Asian and Pacific Islanders (3.54 per 1,000 live births).
• From 2002 to 2012, infant mortality rates declined 20.1% among non-Hispanic whites, followed by non-Hispanic blacks (17.6%), and Hispanics (0.8%), but increased 6.9% among Asian and Pacific Islanders.
• In 2012, non-Hispanic whites accounted for 51.7% of total births, followed by Hispanics (19.4%), non-Hispanic blacks (16.2%), Asian and Pacific Islanders (10.9%), American Indian/Alaska Natives (0.2%), and Unknown race/ethnicity (1.5%).
2002 2003 2004 2005 2006 2007 2008 2009 2010 2011 2012Asian or Pacific Islander 3.31 3.63 4.17 3.50 3.00 2.88 3.13 2.66 3.82 3.00 3.54Black Non-Hispanic 10.87 11.50 11.53 10.78 10.63 10.46 10.86 10.22 9.46 8.96 8.96Hispanic 5.31 5.65 5.16 4.98 4.89 4.63 4.72 4.75 5.06 4.70 5.27White Non-Hispanic 4.63 4.20 4.58 4.47 4.07 4.12 3.78 4.14 3.67 4.10 3.70
0.00
2.00
4.00
6.00
8.00
10.00
12.00
14.00IN
FAN
T M
ORT
ALIT
Y RA
TE P
ER 1
,000
LIV
E BI
RTHS

6
Mother’s age
Figure 4. Infant Mortality Rates by Mother's Age: New York State, 2002-2012
• In 2012, the infant mortality rate was highest among infants born to the youngest group of mothers (aged <20 years) at 7.23 infant deaths per 1,000 live births, followed by infants born to the oldest group of mothers (aged >40 years) at 5.43 per 1,000 live births. Infants born to mothers aged 20-29 years and aged 30-39 years had the lowest rates at 5.13 and 4.33 per 1,000 live births, respectively.
• Since 2002, infant mortality rates decreased in all age groups: 32.1% among infants born to mothers aged 40 and older; 25.8% to mothers aged < 20 years, 22.3% to mothers aged 30-39 years; and 3.8% to mothers aged 20-29 years.
• In 2012, 12,733 (92 died) infants were born to mothers aged 13-19 years compared to 18,661 (182 died) in 2002. This represents a 25.8% decrease in the infant mortality rate for teenage mothers from 9.75 per 1,000 live births in 2002 to 7.23 per 1,000 live births in 2012.
2002 2003 2004 2005 2006 2007 2008 2009 2010 2011 2012<20 Years 9.75 8.07 10.06 7.63 8.96 8.43 8.69 8.99 8.19 8.52 7.2320-29 Years 5.30 5.71 5.74 5.66 5.45 5.28 5.23 5.28 5.09 5.11 5.1030-39 Years 5.57 5.48 5.10 5.10 4.40 4.44 4.38 4.46 4.24 4.27 4.33>=40 Years 8.00 7.54 8.21 7.16 6.28 6.52 6.47 5.65 6.27 5.47 5.43
0.00
2.00
4.00
6.00
8.00
10.00
12.00
INFA
NT
MO
RTAL
ITY
RATE
PER
1,0
00 L
IVE
BIRT
HS

7
Mother’s education
Figure 5. Infant Mortality Rate by Mother's Education: New York State, 2002-2012
• In 2012, the infant mortality rate was highest among infants born to the least educated mothers
(<12th grade) at 6.53 infant deaths per 1,000 live births followed by births to mothers who graduated high school (6.00 per 1,000 live births), had some college education (4.39 per 1,000 live births), and mothers who graduated from college (3.33 per 1,000 live births).
• Since 2002, infant mortality rates decreased in all education groups: 12.2% among infants born to high school graduates, 11.7% to college graduates, 9.3% to those with less than a high school education, and 7.6% to mothers with some college education.
2002 2003 2004 2005 2006 2007 2008 2009 2010 2011 2012<12th Grade 7.20 7.28 7.58 6.83 6.61 6.52 6.82 6.71 6.72 6.42 6.53High School Graduate or GED 6.83 6.98 6.73 6.84 6.40 6.65 5.84 5.80 5.89 5.70 6.00Some College 4.75 5.27 6.04 5.51 4.64 5.37 5.41 5.64 5.09 4.79 4.39College Graduate 3.77 3.62 3.63 3.47 3.49 3.03 3.15 3.25 2.99 3.43 3.33
0.00
1.00
2.00
3.00
4.00
5.00
6.00
7.00
8.00IN
FAN
T M
ORT
ALIT
Y RA
TE P
ER 1
,000
LIV
E BI
RTHS

8
Mother’s marital status
Figure 6. Infant Mortality Rates by Mother’s Marital Status: New York State, 2002-2012
• In 2012, 58.6% of births were to married women and 41.4% to unmarried. The infant mortality rate among unmarried women was much higher compared to married women: 6.69 and 3.60 per 1,000 live births, respectively.
• Since 2002, mortality rates decreased 19.6% for both groups.
2002 2003 2004 2005 2006 2007 2008 2009 2010 2011 2012Married 4.48 4.34 4.44 4.09 3.66 3.72 3.71 3.84 3.46 3.41 3.60Not Married 8.32 8.51 8.14 7.97 7.68 7.31 7.20 7.06 7.03 7.10 6.69
0.00
1.00
2.00
3.00
4.00
5.00
6.00
7.00
8.00
9.00
INFA
NT
MO
RTAL
ITY
RATE
PER
1,0
00 L
IVE
BIRT
HS

9
Preterm births
Preterm birth is the major cause of infant deaths and illnesses in the United States (1). Infants born extremely preterm (<28 weeks gestation) or very preterm (28-31 weeks gestation) are at very high risk for infant mortality. Premature babies also face an increased risk of lasting disabilities, such as mental retardation, learning and behavioral problems, cerebral palsy, lung problems and vision and hearing loss.
Figure 7. Infant Mortality Rate by Preterm Birth Group: New York State, 2002-2012
• In 2012, the infant mortality rate for all preterm births was 38.50 per 1,000 live births. The rate was highest among extremely preterm births at 376.36 per 1,000 live births, followed by very preterm births (42.25 per 1,000 live births), and moderately preterm births (6.62 per 1,000 live births).
• Since 2002, the infant mortality rate declined 11.5% among extremely preterm births, 8.3% among very preterm births, 32.1% among moderately preterm births, and 16.7% among all preterm births.
2002 2003 2004 2005 2006 2007 2008 2009 2010 2011 2012Extremely Preterm (<28 Weeks) 425.19420.23409.45402.78374.17397.31371.40386.87377.17393.70376.36Very Preterm (28-31 Weeks) 46.07 50.29 36.45 46.11 42.15 44.69 44.67 47.58 33.18 39.31 42.25Moderately Preterm (32-36 Weeks) 9.75 9.42 9.76 7.78 7.54 8.00 8.56 8.04 7.34 6.57 6.62
0.00
50.00
100.00
150.00
200.00
250.00
300.00
350.00
400.00
450.00
INFA
NT
MO
RTAL
ITY
RATE
PER
1,0
00 L
IVE
BIRT
HS

10
Figure 8. Infant Mortality Rate among Term Live Births: New York State, 2002-2012
• Term births (>37 weeks) include early term (37-38 weeks), full-term (39-40 weeks), and late and post term (>41 weeks) births. In 2012, term births accounted for 90.7% of all births: the same percentage as in 2002.
• The rate for all term births in 2012 was 1.53 per 1,000 live births. The rate was highest among early term births at 2.61 deaths per 1,000 live births, followed by full term births (1.21 per 1,000 live births), and late and post term births (0.83 per 1,000 live births).
• Since 2002, the infant mortality rate among all term births decreased 11.2%. The rate increased 6.1% among early term births, but decreased 16.0% among full term births and 49.1% among late and post term births.
2002 2003 2004 2005 2006 2007 2008 2009 2010 2011 2012Early Term (37-38 Weeks) 2.46 2.46 2.52 2.46 2.49 1.94 2.21 2.17 2.30 2.42 2.61Full Term (39-40 Weeks) 1.44 1.41 1.44 1.44 1.36 1.39 1.38 1.26 1.32 1.23 1.21Late and Post Term (>40 Weeks) 1.63 1.73 1.77 1.65 1.38 1.58 1.58 1.40 1.01 1.59 0.83
0.00
0.50
1.00
1.50
2.00
2.50
3.00
INFA
NT
MO
RTAL
ITY
RATE
PER
1,0
00 L
IVE
BIRT
HS

11
Infant’s sex
Figure 9. Infant Mortality Rates by Gender: New York State, 2002-2012
• In the New York State in 2012, the infant mortality rate for male infants was at 5.20 per 1,000 live births, 14.27% higher than the rate for female infants at 4.55 per 1,000 live births.
• Since 2002, the infant mortality rate decreased 17.1% among male infants and 15.4% among females.
2002 2003 2004 2005 2006 2007 2008 2009 2010 2011 2012Male 6.27 6.37 6.41 6.27 5.80 5.60 5.70 5.65 5.21 5.22 5.20Female 5.38 5.30 5.26 4.94 4.72 4.76 4.56 4.70 4.68 4.65 4.55
0.00
1.00
2.00
3.00
4.00
5.00
6.00
7.00
INFA
NT
MO
RTAL
ITY
RATE
PER
1,0
00 L
IVE
BIRT
HS

12
Figure 10. Non-Hispanic Black, Non-Hispanic White and Hispanic Infant Mortality Rates by Infant's gender: New York State, 2002-2012
• From 2002 to 2012, the infant mortality rate among males born to non-Hispanic blacks decreased 22.9% to 9.37 per 1,000 live births and 10.1% to 8.54 per 1,000 among females.
• From 2002 to 2012, the infant mortality rate among males born to Hispanics increased 1.3% to 5.55 per 1,000 live births and decreased 2.7% to 4.97 per 1,000 live births for females.
• From 2002 to 2012, the infant mortality rate among males born to non-Hispanic whites decreased 20.9% to 3.91 per 1,000 live births and 18.5% to 3.47 per 1,000 live births for females.
2002 2003 2004 2005 2006 2007 2008 2009 2010 2011 2012Black Males 12.15 12.39 12.18 12.17 11.94 11.36 12.09 11.12 9.96 9.46 9.37Black Females 9.50 10.57 10.80 9.32 9.18 9.39 9.45 9.28 8.93 8.46 8.54Hispanic Males 5.48 6.23 5.76 5.56 5.32 4.92 5.27 5.65 5.51 4.98 5.55Hispanic Females 5.11 5.04 4.54 4.38 4.44 4.28 4.14 3.79 4.59 4.42 4.97White Males 4.94 4.71 5.06 4.95 4.36 4.40 4.21 4.38 3.69 4.27 3.91White Females 4.26 3.65 4.02 3.95 3.72 3.82 3.28 3.86 3.59 3.89 3.47
0.00
2.00
4.00
6.00
8.00
10.00
12.00
14.00IN
FAN
T M
ORT
ALIT
Y RA
TE P
ER 1
,000
LIV
E BI
RTHS

13
Birthweight
Birth weight is another important predictor of infant health. It is closely associated with, but does not exactly correspond with the period of gestation. Low birth weight is defined as a birth weight of a live born infant of less than 2,500 g (5.5 pounds) regardless of gestational age. Infant mortality rates are highest for the smallest infants and decrease sharply as birth weight increases.
Figure 11. Infant Mortality Rates by Low Birthweight: New York State, 2002-2012
• In 2012, infant mortality rates was 374.93 per 1,000 live births among those with a birthweight less than 1000 grams, 39.01 per 1,000 live births among those between 1000 and 1499 grams, 16.66 per 1,000 live births among those between 1500 and 1999 grams infants, and 6.49 per 1,000 live births among those between 2000 and 2499 grams birthweight.
• From 2002 to 2012, infant mortality rates declined for all low birthweight categories: 10.3% among those <1000 grams, 13.7% among those 2000-2499 grams, 17.5% among those 1000-1499 grams, and 36.3% among those 1500-1599 grams birthweight.
• Infants born weighing less than 1,000 grams accounted for only 0.7% of births in New York State, but for more than half (54.5%) of all infant deaths in the New York State in 2012.
2002 2003 2004 2005 2006 2007 2008 2009 2010 2011 2012<1000 grams 417.92 418.59 400.41 406.08 363.44 395.74 375.72 378.87 361.56 380.14 374.931000-1499 grams 47.31 46.29 44.65 42.25 49.82 46.28 46.64 49.46 34.32 40.46 39.011500-1999 grams 26.15 22.94 22.34 19.87 17.87 17.91 23.29 17.72 20.51 13.45 16.662000-2499 grams 7.52 8.16 9.90 7.10 8.77 8.85 7.35 7.90 6.76 6.82 6.49
0.00
50.00
100.00
150.00
200.00
250.00
300.00
350.00
400.00
450.00
INFA
NT
MO
RTAL
ITY
RATE
PER
1,0
00 L
IVE
BIRT
HS

14
Figure 12. Infant Mortality Rates by Normal Birthweight: New York State, 2002-2012
• Infant mortality rates are lower among all categories of normal birthweight compared to low birthweight infants. The infant mortality rate was lowest among those with birthweights of >3,500 grams (0.96 death per 1,000 live births) followed by birthweights of 3,000-3,499 grams (1.35 per 1,000 live births) and birthweights of 2,500-2,999 grams (2.61 per 1,000 live births).
• From 2002 to 2012, the infant mortality rates declined for all normal birth weight categories: 11.8% among those with birthweights of 2,500-2,999 grams, 16.1% among those 3,000-3,499 grams, and 23.8% among those with birthweights >3,500 grams.
2002 2003 2004 2005 2006 2007 2008 2009 2010 2011 20122500-2999 grams 2.96 2.88 2.91 3.07 2.80 2.62 2.92 2.42 2.45 2.60 2.613000-3499 grams 1.61 1.71 1.54 1.62 1.39 1.31 1.25 1.46 1.38 1.34 1.35>=3500 grams 1.26 1.14 1.10 1.07 1.06 1.08 1.12 0.89 1.01 1.09 0.96
0.00
0.50
1.00
1.50
2.00
2.50
3.00
3.50
INFA
NT
MO
RTAL
ITY
RATE
PER
1,0
00 L
IVE
BIRT
HS

15
First prenatal care visit
Figure 13. Infant Mortality Rates by Trimester First Prenatal Care Started: New York State, 2002-2012
• In 2012, the infant mortality rate among infant born to mothers without prenatal care was 35.67 per 1,000 live births. For mothers having some level of prenatal care, the infant mortality rate for those starting prenatal care at their second trimester of pregnancy was 5.07 per 1,000 live births, at their first trimester 4.20 per 1,000 live births, and at their third trimester 3.41 per 1,000 live births.
• Since 2002, the infant mortality rate decreased 16.4% among infants born to mothers having no prenatal care, and the mortality rates were substantially higher than any of the prenatal care groups over the ten year period. However, the rates over time are unstable likely due to small numbers or reporting problems.
• Since 2002, the infant mortality rate decreased 16.8% among infants born to mothers starting prenatal care in their first trimester and 2.1% for mothers starting in their second trimester, while increasing 12.2% for mothers starting in the third trimester.
2002 2003 2004 2005 2006 2007 2008 2009 2010 2011 2012First Trimester 5.05 5.09 5.05 4.82 4.58 4.37 4.38 4.30 4.20 4.34 4.20Second Trimester 5.18 6.34 5.74 5.33 4.30 4.43 4.70 5.07 4.79 4.34 5.07Third Trimester 3.04 4.58 4.88 4.48 4.92 5.20 3.74 3.95 4.46 4.06 3.41No Prenatal Care 42.68 30.79 32.22 25.00 19.43 21.94 13.74 27.59 38.84 30.24 35.67
0.00
5.00
10.00
15.00
20.00
25.00
30.00
35.00
40.00
45.00
INFA
NT
MO
RTAL
ITY
RATE
PER
1,0
00 L
IVE
BIRT
HS

16
Mother’s weight status1
Figure 14. Infant Mortality Rates by Pre-Pregnancy Body Mass Index: New York State, 2002-2012
• In 2012, the infant mortality rate among infants born to pre-pregnancy obese mothers was 7.02 per 1,000 live births, followed by those overweight (4.92 per 1,000 live births), underweight (3.61 per 1,000 live births), and normal weight (3.57 per 1,000 live births).
• Since 2002, the infant mortality rate among infants born to pre-pregnancy obese mothers increased 3.5%, but the rate decreased by 35.2% for those underweight, by 15.9% for those overweight, and by 15.8% for normal weight mothers.
1 Weight status categories were defined based on the body mass index (BMI) as Underweight (BMI<18.5), Normal weight (18.5<BMI<25), Overweight (25<BMI<30), and Obese (BMI>30)
2002 2003 2004 2005 2006 2007 2008 2009 2010 2011 2012Underweight 5.57 3.50 6.76 5.67 3.73 5.87 4.56 4.04 2.50 3.64 3.61Normal Weight 4.24 4.56 4.59 4.53 4.20 4.79 3.90 4.18 3.85 3.68 3.57Overweight 5.85 5.20 5.54 5.05 4.94 4.02 4.48 4.61 5.28 4.64 4.92Obese 6.78 7.03 6.69 5.97 6.29 6.57 6.48 7.17 6.37 6.78 7.02
0.00
1.00
2.00
3.00
4.00
5.00
6.00
7.00
8.00
INFA
NT
MO
RTAL
ITY
RATE
PER
1,0
00 L
IVE
BIRT
HS

17
Hospital births2
Figure 15. Infant Mortality Rates by Hospital and Non-Hospital Births: New York State, 2002-2012
• In 2012, 98.00% of live birth infants were born in hospitals and only 2.00% were born in other places. The infant mortality rate among those born in hospitals was 4.82 per 1,000 live births, but among those non-hospital born infants, the rate was 7.96 per 1,000 live births.
• Since 2002, the infant mortality rate among those born in hospitals declined steadily by approximately 17.7%. The rate increased 43.9% among those born outside hospitals, but the trend was unstable likely due to the small number of non-hospital births.
2 The non-hospital births include home birth intended, home birth unintended, home birth unknown intent, out of state hospital, and other or unknown births. The non-hospital birth group is heterogeneous, and includes subpopulations with high and low infant mortality rates.
2002 2003 2004 2005 2006 2007 2008 2009 2010 2011 2012Hospital Birth 5.86 5.79 5.80 5.58 5.25 5.19 5.14 5.15 4.96 4.92 4.82Non-Hospital Birth 5.53 8.69 13.96 12.21 7.39 5.89 6.90 7.83 5.38 6.77 7.96
0.00
2.00
4.00
6.00
8.00
10.00
12.00
14.00
16.00
INFA
NT
MO
RTAL
ITY
RATE
PER
1,0
00 L
IVE
BIRT
HS

18
Plurality
The risk of infant death increases with the increasing number of infants in the pregnancy (1). Multiple births were closely correlated with low birth weight and short gestation.
Figure 16. Infant Mortality Rates by Plurality, New York State: 2002-2012
• In 2012, the infant mortality rate among singleton births was 4.22 per 1,000 live births. The rate among multiple births was 21.51 per 1,000 live births - more than 5 times that of singleton births.
• Since 2002, the infant mortality rate among singleton births declined 15.4%, while multiple births declined 21.7%.
2002 2003 2004 2005 2006 2007 2008 2009 2010 2011 2012Multiple 27.46 25.50 27.57 24.24 24.53 21.75 22.10 25.19 22.74 23.73 21.51Singleton 4.99 5.09 4.97 4.90 4.53 4.52 4.50 4.36 4.25 4.19 4.22
0.00
5.00
10.00
15.00
20.00
25.00
30.00
INFA
NT
MO
RTAL
ITY
RATE
PER
1,0
00 L
IVE
BIRT
HS
19
Payer information
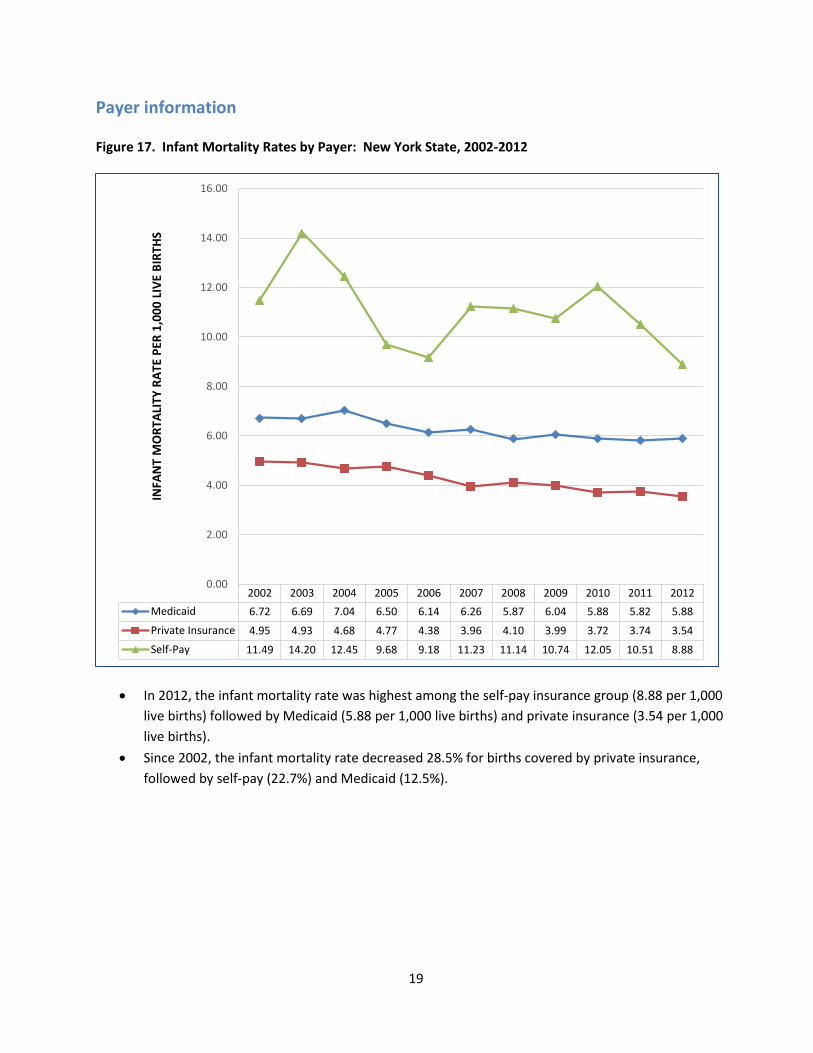
Figure 17. Infant Mortality Rates by Payer: New York State, 2002-2012
• In 2012, the infant mortality rate was highest among the self-pay insurance group (8.88 per 1,000 live births) followed by Medicaid (5.88 per 1,000 live births) and private insurance (3.54 per 1,000 live births).
• Since 2002, the infant mortality rate decreased 28.5% for births covered by private insurance, followed by self-pay (22.7%) and Medicaid (12.5%).
2002 2003 2004 2005 2006 2007 2008 2009 2010 2011 2012Medicaid 6.72 6.69 7.04 6.50 6.14 6.26 5.87 6.04 5.88 5.82 5.88Private Insurance 4.95 4.93 4.68 4.77 4.38 3.96 4.10 3.99 3.72 3.74 3.54Self-Pay 11.49 14.20 12.45 9.68 9.18 11.23 11.14 10.74 12.05 10.51 8.88
0.00
2.00
4.00
6.00
8.00
10.00
12.00
14.00
16.00
INFA
NT
MO
RTAL
ITY
RATE
PER
1,0
00 L
IVE
BIRT
HS
20
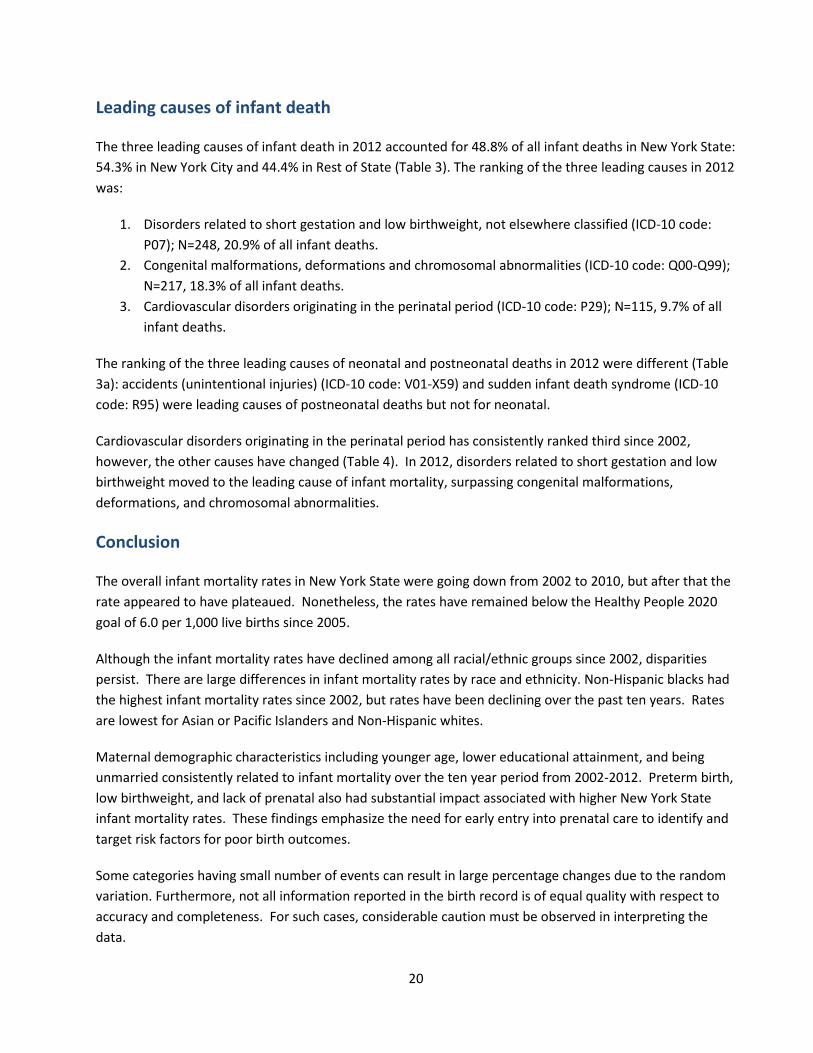
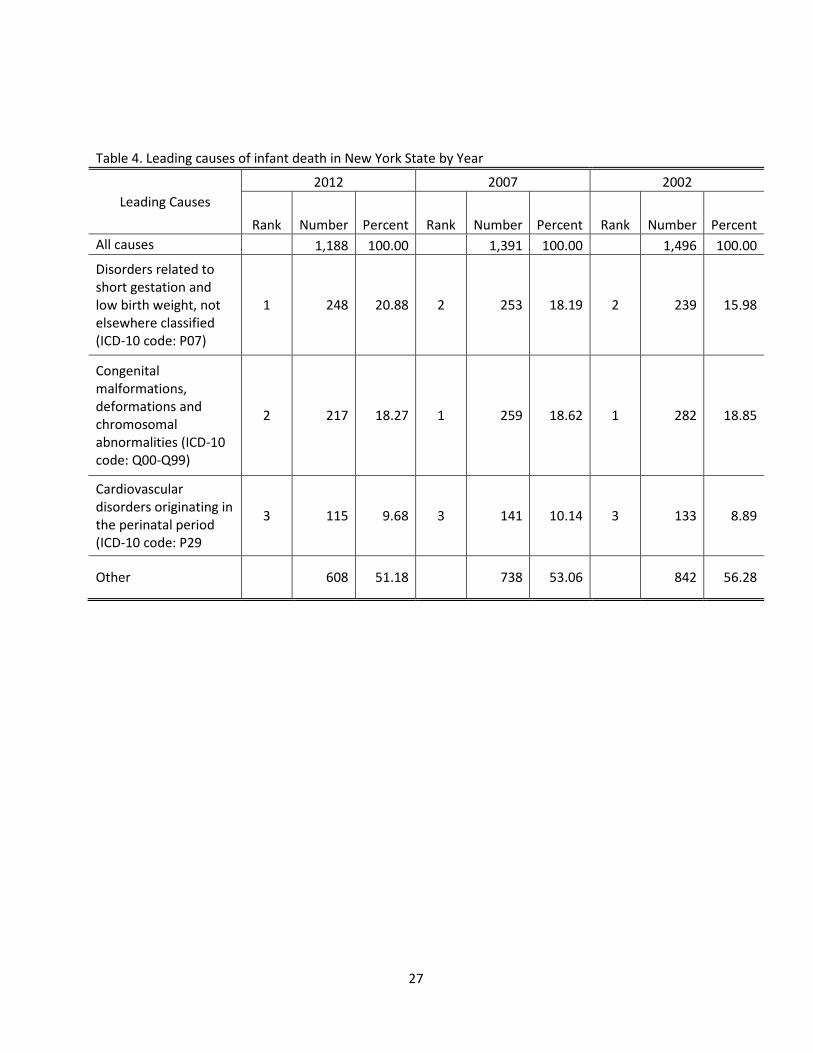
Leading causes of infant death
The three leading causes of infant death in 2012 accounted for 48.8% of all infant deaths in New York State: 54.3% in New York City and 44.4% in Rest of State (Table 3). The ranking of the three leading causes in 2012 was:
1. Disorders related to short gestation and low birthweight, not elsewhere classified (ICD-10 code: P07); N=248, 20.9% of all infant deaths.
2. Congenital malformations, deformations and chromosomal abnormalities (ICD-10 code: Q00-Q99); N=217, 18.3% of all infant deaths.
3. Cardiovascular disorders originating in the perinatal period (ICD-10 code: P29); N=115, 9.7% of all infant deaths.
The ranking of the three leading causes of neonatal and postneonatal deaths in 2012 were different (Table 3a): accidents (unintentional injuries) (ICD-10 code: V01-X59) and sudden infant death syndrome (ICD-10 code: R95) were leading causes of postneonatal deaths but not for neonatal.
Cardiovascular disorders originating in the perinatal period has consistently ranked third since 2002, however, the other causes have changed (Table 4). In 2012, disorders related to short gestation and low birthweight moved to the leading cause of infant mortality, surpassing congenital malformations, deformations, and chromosomal abnormalities.
Conclusion
The overall infant mortality rates in New York State were going down from 2002 to 2010, but after that the rate appeared to have plateaued. Nonetheless, the rates have remained below the Healthy People 2020 goal of 6.0 per 1,000 live births since 2005.
Although the infant mortality rates have declined among all racial/ethnic groups since 2002, disparities persist. There are large differences in infant mortality rates by race and ethnicity. Non-Hispanic blacks had the highest infant mortality rates since 2002, but rates have been declining over the past ten years. Rates are lowest for Asian or Pacific Islanders and Non-Hispanic whites.
Maternal demographic characteristics including younger age, lower educational attainment, and being unmarried consistently related to infant mortality over the ten year period from 2002-2012. Preterm birth, low birthweight, and lack of prenatal also had substantial impact associated with higher New York State infant mortality rates. These findings emphasize the need for early entry into prenatal care to identify and target risk factors for poor birth outcomes.
Some categories having small number of events can result in large percentage changes due to the random variation. Furthermore, not all information reported in the birth record is of equal quality with respect to accuracy and completeness. For such cases, considerable caution must be observed in interpreting the data.

21
References
1. Mathews TJ, MacDorman MF. Infant mortality statistics from the 2010 period linked birth/infant death data set. National vital statistics reports; vol 62 no 8. Hyattsville, MD: National Center for Health Statistics. 2013.
2. Zimmerman R, Li W, Gambatese M, Madsen A, Lasner-Frater L, Kelley D, Kennedy J, Maduro G, Sun Y. SUMMARY OF VITAL STATISTICS, 2012: INFANT MORTALITY. New York City Department OF Health AND Mental Hygiene, Office OF Vital Statistics, 2013.

22
Table 1. Live Birth and Infant Mortality Rate by Characteristics of Mother: New York State, 2012
Characteristics Live Births
Infant Mortality Rate per 1,000 Live Births
All Neonatal Post-neonatal Number Percent Deaths Rate Deaths Rate Deaths Rate
Total 239,224 100.00 1,188 4.97 798 3.34 390 1.63 Race/Ethnicity
Non-Hispanic White 123,663 51.69 458 3.70 307 2.48 151 1.22 Non-Hispanic Black 38,854 16.24 348 8.96 238 6.13 110 2.83 Asian and Pacific Islander 26,011 10.87 92 3.54 61 2.35 31 1.19 American Indian and
Alaska Native 497 0.21 3 6.04 2 4.02 1 2.01
Hispanic 46,518 19.45 245 5.27 166 3.57 79 1.70 Other and Unknown 3,681 1.54 23 6.25 14 3.80 9 2.44 Unmatched 19 10 9
Age of Mother Age <20 12733 5.32 92 7.23 64 5.03 28 2.20 Age 20-29 108573 45.39 554 5.10 355 3.27 199 1.83 Age 30-39 107045 44.75 464 4.33 331 3.09 133 1.24 Age 40-59 10866 4.54 59 5.43 38 3.50 21 1.93 Other and Unknown 7 0.00 0 0.00 0 0.00 0 0.00 Unmatched 19 10 9
Mother's Education < 12th grade 44,708 18.69 292 6.53 189 4.23 103 2.30 High school graduate or GED 52,339 21.88 314 6.00 211 4.03 103 1.97
some college 40,309 16.85 177 4.39 106 2.63 71 1.76 college graduate 100,708 42.10 335 3.33 234 2.32 101 1.00 Unknown 1,160 0.48 51 43.97 48 41.38 3 2.59 Unmatched 19 10 9
Marital Status of Mother Married 140,145 58.58 505 3.60 356 2.54 149 1.06 Not Married 99,061 41.41 663 6.69 432 4.36 231 2.33 Unknown 18 0.01 1 55.56 0 0.00 1 55.56 Unmatched 19 10 9
Primary Payer Medicaid/Family Health Plus/Child Health PlusB/Other Government
122,309 51.13 719 5.88 447 3.65 272 2.22
Private Insurance 106,381 44.47 377 3.54 284 2.67 93 0.87 Self-Pay 3,718 1.55 33 8.88 25 6.72 8 2.15 Other and Unknown 6,816 2.85 40 5.87 32 4.69 8 1.17 Unmatched 19 10 9

23
Plurality Multiple 9,205 3.85 198 21.51 166 18.03 32 3.48 Single 229,984 96.14 971 4.22 622 2.70 349 1.52 Unknown 35 0.01 0 0.00 0 0.00 0 0.00 Unmatched 19 10 9
First Prenatal Care First trimester (1-3 months) 171,805 71.82 721 4.20 500 2.91 221 1.29
Second trimester (4-6 months) 47,953 20.05 243 5.07 140 2.92 103 2.15
Third trimester (7-9 months) 11,439 4.78 39 3.41 15 1.31 24 2.10
No prenatal care 1,514 0.63 54 35.67 49 32.36 5 3.30 Unknown 6,513 2.72 112 17.20 84 12.90 28 4.30 Unmatched 19 10 9
Pre-pregnancy Body Mass Index (BMI)
Underweight (BMI<18.5) 10,532 4.40 38 3.61 24 2.28 14 1.33 Normal weight (18.5<=BMI<25) 116,969 48.90 417 3.57 289 2.47 128 1.09
Overweight (25<=BMI<30) 57,571 24.07 283 4.92 174 3.02 109 1.89
Obese (BMI>=30) 46,837 19.58 329 7.02 220 4.70 109 2.33 Unknown 7315 3.06 102 13.94 81 11.07 21 2.87 Unmatched 19 10 9

24
Table 2. Live Birth & Infant Mortality Rate by Characteristics of Infant: New York State, 2012
Characteristics Live Births
Infant Mortality Rate per 1,000 Live Births
All Neonatal Post-neonatal Number Percent Deaths Rate Deaths Rate Deaths Rate
Total 239,224 100.00 1,188 4.97 798 3.34 390 1.63 Gender
Male 122,520 51.22 637 5.20 434 3.54 203 1.66 Female 116,703 48.78 531 4.55 353 3.02 178 1.53 Other and Unknown 1 0.00 1 1000.00 1 1000.00 0 0.00 Unmatched 19 10 9
Birth Weight < 1000g 1,699 0.71 637 374.93 543 319.60 94 55.33 1000-1499g 1,820 0.76 71 39.01 52 28.57 19 10.44 1500-1999g 3,722 1.56 62 16.66 37 9.94 25 6.72 2000-2499g 11,709 4.89 76 6.49 39 3.33 37 3.16 2500-2999g 44,489 18.60 116 2.61 47 1.06 69 1.55 3000-3499g 93,313 39.01 126 1.35 38 0.41 88 0.94 >=3500g 82,245 34.38 79 0.96 30 0.36 49 0.60 Other and Unknown 227 0.09 2 8.81 2 8.81 0.00 Unmatched 19 10 9
Period of Gestation < 28 weeks 1,658 0.69 624 376.36 547 329.92 77 46.44 28-31 weeks 2,154 0.90 91 42.25 57 26.46 34 15.78 32-36 weeks 17,822 7.45 118 6.62 62 3.48 56 3.14 37-38 weeks 55,885 23.36 146 2.61 51 0.91 95 1.70 39-40 weeks 140,718 58.82 170 1.21 62 0.44 108 0.77 > 40 weeks 20,364 8.51 17 0.83 7 0.34 10 0.49 Unknown 623 0.26 3 4.82 2 3.21 1 1.61 Unmatched 19 10 9
Birth Order 1 234,590 98.06 1,063 4.53 699 2.98 364 1.55 2 4,518 1.89 95 21.03 81 17.93 14 3.10 3+ 116 0.05 11 94.83 8 68.97 3 25.86 Unmatched 19 10 9
Birth Place Hospital 234,449 98.00 1,131 4.82 759 3.24 372 1.59 Home and Other 4,775 2.00 38 7.96 29 6.07 9 1.88 Unmatched 19 10 9

25
Table 3. Leading causes of infant death: New York State, 2012
Leading Causes New York State New York City Rest of State
Rank Number Percent Rank Number Percent Rank Number Percent All causes 1,188 100.00 532 100.00 656 100.00 Disorders related to short gestation and low birth weight, not elsewhere classified (ICD-10 code: P07)
1 248 20.88 1 115 21.62 1 133 20.27
Congenital malformations, deformations and chromosomal abnormalities (ICD-10 code: Q00-Q99)
2 217 18.27 2 105 19.74 2 112 17.07
Cardiovascular disorders originating in the perinatal period (ICD-10 code: P29
3 115 9.68 3 69 12.97 3 46 7.01
Other 608 51.18 243 45.68 365 55.64

26
Table 3a. Leading causes of infant, neonatal, and postneonatal death: New York State, 2012
Leading Causes Infant Neonatal Postneonatal3
Rank Number Percent Rank Number Percent Rank Number Percent All causes 1,188 100.00 798 100.00 390 100.00
Disorders related to short gestation and low birth weight, not elsewhere classified (ICD-10 code: P07)
1 248 20.88 1 235 29.45
Congenital malformations, deformations and chromosomal abnormalities (ICD-10 code: Q00-Q99)
2 217 18.27 2 144 18.05 1 73 18.72
Cardiovascular disorders originating in the perinatal period (ICD-10 code: P29
3 115 9.68 3 113 14.16
Accidents (unintentional injuries) (ICD-10 code: V01-X59)
2 34 8.72
Sudden infant death syndrome (ICD-10 code: R95)
3 29 7.44
Other 608 51.18 306 38.34 254 65.12
3 Among postneonatal deaths, there are 32 records whose causes of death were coded as “R99” (Other ill-defined and unspecified causes of mortality) and 31 records as “Y34” (Unspecified event, undetermined intent). Both causes were not listed as leading causes due to their un-specifications.
27
Table 4. Leading causes of infant death in New York State by Year
Leading Causes 2012 2007 2002
Rank Number Percent Rank Number Percent Rank Number Percent All causes 1,188 100.00 1,391 100.00 1,496 100.00
Disorders related to short gestation and low birth weight, not elsewhere classified (ICD-10 code: P07)
1 248 20.88 2 253 18.19 2 239 15.98
Congenital malformations, deformations and chromosomal abnormalities (ICD-10 code: Q00-Q99)
2 217 18.27 1 259 18.62 1 282 18.85
Cardiovascular disorders originating in the perinatal period (ICD-10 code: P29
3 115 9.68 3 141 10.14 3 133 8.89
Other 608 51.18 738 53.06 842 56.28