inexpensive cross-flow hydropower turbine at …
TRANSCRIPT

NOV1 2 19gr
SMALL-SCALE HYDROELECTRIC POWERDEMONSTRATION PROJECT "
i
INEXPENSIVE CROSS-FLOW HYDROPOWER TURBINE ATARBUCKLE MOUNTAIN HYDROELECTRIC PROJECT
FINAL OPERATION AND MAINTENANCE REPORT
_ent of Energy FieldOffice,Idaho-!
Dt_ __lL_k.._ ii,ON 0_" Ihi,.S DC.U,U:.,,i_('4.,'r tS LI!_LIMi'I"E[)

Printed in the United States of America
Available from
National Technical Information Service
U.S. Department of Commerce
5285 Port Royal Road
Springfield, VA 22161
NTIS Price Codes: Printed Copy A02Microfiche A01
DISCLAIMER
This book was prepared as an account of work sponsored by an agency of the UnitedStates Government. Neither the United States Government nor any agency thereof,
nor any of their employees, makes any warranty, express or implied, or assumes any
legal liability or responsibility for the accuracy, completeness, or usefulness of anyinformation, apparatus, product or process disclosed, or represents that its use would
not infringe privately owned rights. References herein to any specific commercial
product, process, or service by trade name, trademark, manufacturer, or otherwise,does notnecessarily constitute or imply _tsendorsement, recommendation, or favoring
by the United States Government or any agency thereof. The views and opinions of
authors expressed herein do not necessarily state or reflect those of the United StatesGovernment or any agency thereof.

Distribution
DOE/ID/12481--3
DE92 002716
SMALL-SCALE HYDROELECTRIC POWERDEMONSTRATION PROJECT
INEXPENSIVE CROSS-FLOW HYDROPOWER TURBINE ATARBUCKLE MOUNTAIN HYDROELECTRIC PROJECT
FINAL OPERATION AND MAINTENANCE REPORT
ByOTT Engineering,Inc.Bellevue, Washington
July, 1991
Prepared for theU.S. Department of Energy
Cooperative Agreement No. DE-FC07-841D12481
MASTERo-- ,._...."':"_' <>F"""'_" t"3OCU_-_.._,r'rI8 UNLIMITED

TABLE OF CONTENTS
Page
INTRODUCTION 1
PROJECT DESCRIPTION 2
KEY PROJECT DATA 3
MAJOR REPAIRS 3
ANNUAL OPERATING EXPENSES 6
EFFECTS OF LOW WATER YEARS 8
LIST OF PHOTOGRAPHS
Photograph Pa_.a_gg
1 TURBINE - GENERATOR 10
2 GENERATOR - SWlTCHGEAR 10
3 DIVERSION AT HIGH FLOWS 11
4 POWERHOUSE AT HIGH FLOWS 11
LIST OF TABLES
Table
1 OPERATION AND MAINTENANCE COST i2
2 STREAM FLOW AND PRODUCTION 14
LIST OF FIGURES
Figure Page
1 FACILITY LOCATION 16
2 GENERAL PROJECT CROSS SECTION 17
3 TURBINE- DRAFr TUBE, SECTION 18
4 TURBINE DIMENSIONS 19
5 TURBINE EFFICIENCY 20

INEXPENSIVE CROSS-FLOW HYDROPOWER TURBINE ATARBUCKLE MOUNTAIN HYDROELECTRIC PROJECT
FINAL OPERATION AND MAINTENANCE REPORT
INTRODUCTION
This report documents the first three and half years of operation and maintenance on the
Arbuckle Mountain Hydroelectric Project. Located on a flashy mountain stream in northern
California, the project was designed, built and tested through a Cooperative Agreement
between the U.S. Department of Energy (DOE) and Oq'T Engineering, Ill c. (OTI') of
Redding, California. The purpose of the Agreement is to build and intensively test an
inexpensive American-made cross-flow turbine and to provide information to the DOE on
the cost, efficiency, operation, and maintenance of the unit. It requires that OTI" document
for DOE a summary of the complete operating statistics, operation and maintenance cost,
and revenues from power sales for a two-year operating period.
A complete report covering the environmental, technical criteria, design, construction, and
other related aspects of the total project was published by DOE as the "Final Construction
and Cost Report" in July 1988. Extensive efficiency testing of the turbine was completed in
1989 and the "Field Test Report" was published by DOE in November 1989. Since these
reports discuss the project elements in detail, they will only be mentioned here. However,
several unique events occurred between the initial start-up (December 1986) and the
beginning of the 1989 generation season (October 1988) that delayed the first year's full
operation and provided unique information for a demonstration project of this type.
Accordingly, this report will discuss certain major problems experienced with the design,
operation and maintenance, and energy production, as well as the operation and maintenance
costs and value of the power produced for the first three and half years of operation.
For reasons that are given in the body of this report, it is evident that due to numerous
problems there has been no significant period of time to date that would be representative
-1-

of operating data reflecting the normal production that can be expected from this project.
Principle among these circumstances are the following:
1. Once "on-line" the electrical system, the 1910 vintage generator, and the turbine inletvalve had to be completely rebuilt.
2. Drought of 1987.
3. An operator error flooded the powerhouse in November 1987.
4. Drought of 1988.
5. Failure of the air line from the powerhouse to the fish screens at the diversion.
6. Drought of 1989.
7. Drought of 1990.
Many of these matters were discussed in detail in the "Final Construction and Cost Report"
and the "Field Test Report" and will be covered only briefly in this report.
PROJECT DESCRIPTION
The project is located on the Middle Fork of Cottonwood Creek, five miles north of Platina
in Shasta County, California (Figure 1). The site provided an excellent opportunity to test
operation and monitoring of a remote run-of-river installation that is typical of small
hydroelectric projects. It was totally undeveloped and required extensive roads, bridges, and
five miles of powerline to connect to the local power utility. New site facilities included a
diversion and intake structure, steel penstock, powerhouse, and switchyard. Figure 2 shows
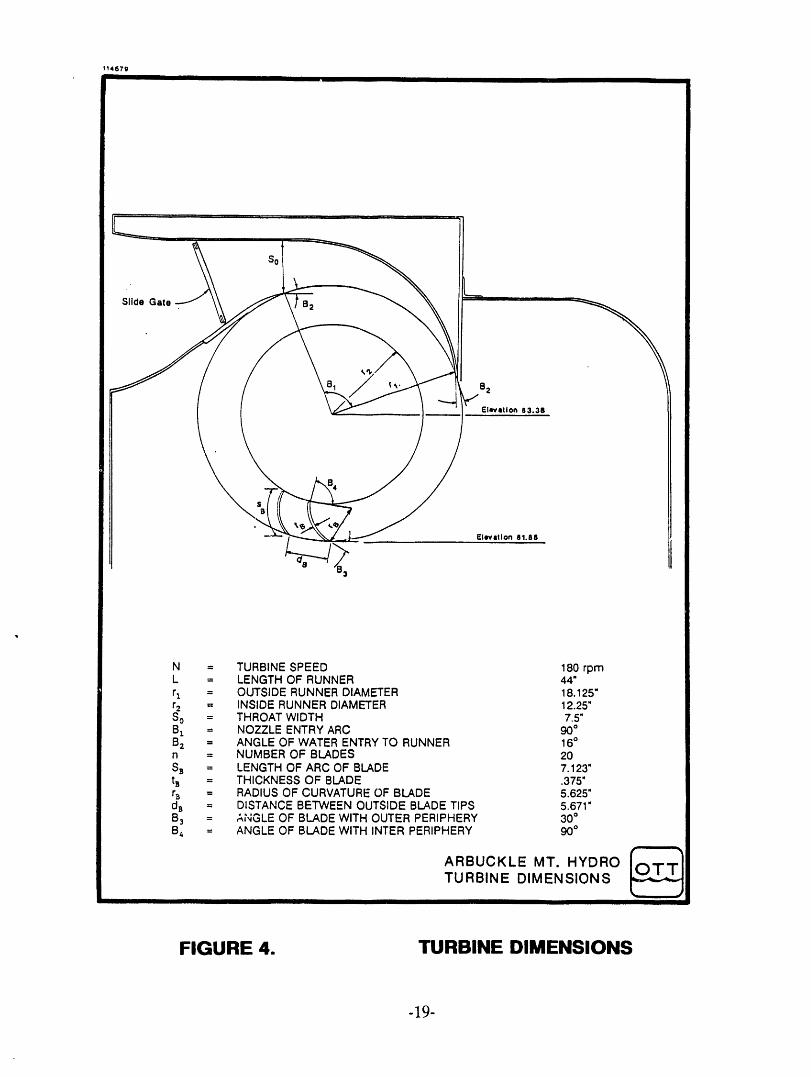
the general project cross section. The turbine section and dimensions are shown in Figures
3 and 4, respectively.
The turbine was designed for a maximum of 400 kW with an average annual project output
of 904,000 kW hours. After intensive testing the maximum turbine output was determined
to be 336 kW resulting in an average annual project output of 618,000 kW hours. The
-2-

maximum turbine efficiency, achieved averaged 79 percent. The turbine efficiency curve is
shown in Figure 5.
KEY PROJECT DATA
Project name: Arbuckle Mountain Hydroelectric
State: California
Stream: Middle Fork of Cottonwood Creek
Project type: Low head
Turbine type: Cross-flow
Number of units: 1
Installed capacity (kW): 336 (maximum)
Gross head (ft): 55
Total turbine flow (cfs): 10 to 106
Avg. annual estimated stream flow (cfs): 43
Avg. annual estimated energy (kWh): 618,000
On-Line date: December 1986
The turbine-generator and switchgear are shown in Photographs 1 and 2. The diversion
structure is shown on the cover of this report.
MAJOR REPAIRS
Even though the project came on-line in December 1986, major field modifications to the
turbine, nozzle, switchgear, and a complete rework of the generator only allowed periodic
operation during the 1987 season. While in the field, the nozzle had to be rebuilt and the
turbine reinforced to prevent the runner form grinding on the nozzle when the turbine was
under load. To alleviate the problem, clearances between the nozzle and runner were
increased to a point where considerable leakage occurs around the nozzle causing a non-
streamlined flow pattern and splash back against the runner. It was determined that building
the turbine out of thicker materials would allow tolerances to be tightened thus improving
-3-
|
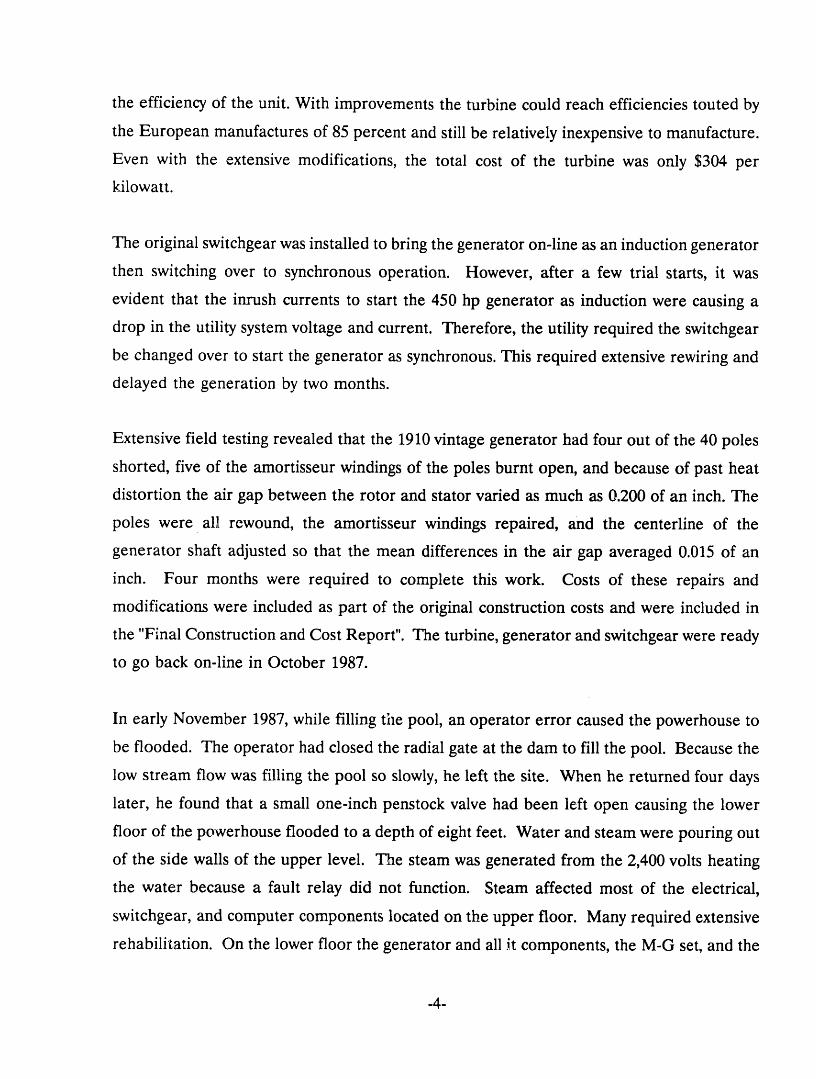
the efficiency of the unit. With improvements the turbine could reach efficiencies touted by
the European manufactures of 85 percent and still be relatively inexpensive to manufacture.
Even with the extensive modifications, the total cost of the turbine was only $304 per
kilowatt.
The original switchgear was installed to bring the generator on-line as an induction generator
then switching over to synchronous operation. However, after a few trial starts, it was
evident that the inrush currents to start the 450 hp generator as induction were causing a
drop in the utility system voltage and current. Therefore, the utility required the switchgear
be changed over to start the generator as synchronous. This required extensive rewiring and
delayed the generation by two months.
Extensive field testing revealed that the 1910 vintage generator had four out of the 40 poles
shorted, five of the amortisseur windings of the poles burnt open, and because of past heat
distortion the air gap between the rotor and stator varied as much as 0.200 of an inch. The
poles were all rewound, the amortisseur windings repaired, and the centerline of the
generator shaft adjusted so that the mean differences in the air gap averaged 0.015 of an
inch. Four months were required to complete this work. Costs of these repairs and
modifications were included as part of the original construction costs and were included in
the "Final Construction and Cost Report". The turbine, generator and switchgear were ready
to go back on-line in October 1987.
In early November 1987, while filling tile pool, an operator error caused the powerhouse to
be flooded. The operator had closed the radial gate at the dam to fill the pool. Because the
low stream flow was filling the pool so slowly, he left the site. When he returned four days
later, he found that a small one-inch penstock valve had been left open causing the lower
floor of the powerhouse flooded to a depth of eight feet. Water and steam were pouring out
of the side walls of the upper level. The steam was generated from the 2,400 volts heating
the water because a fault relay did not function. Steam affected most of the electrical,
switchgear, and computer components located on the upper floor. Many required extensive
rehabilitation. On the lower floor the generator and all .it components, the M-G set, and the
-4-

compressor motor had to be dried out and rebuilt. Ali small motors, such as the slide gate
motor, had to be replaced. All PT's and CT's had to be replaced and the switches rebuilt.
Fortunately, insurance covered most of the $100,000 worth of repairs. The repair work was
complete and the plant was back on-line in January 1988.
During the first heavy flow in the creek each year, there is so much litter and debris that the
air burst cleaning system can not completely clean the fish screens. As a result the screens
require manual cleaning with a brush on a long pole after each "first flush" event. Previously,
the operator attempted to do the cleaning from a small rubber boat which was dangerous and
ineffective. Therefore, in June 1989 a new catwalk was installed over the fish screens that
allows easy access to the screens in the event the screens require manual cleaning. The
catwalk cost approximately $2,300.
During operation in March several leaks developed in the PVC air line between the
powerhouse and the fish screens at the diversion. The compressor in the powerhouse had
to almost run constantly in order for the air pressure to remain sufficiently high to keep the
screens clean. The compressor motor requires 5.6 kW or 135 kW hours per day to operate
when running constantly. Ordinarily, it would require one sixth that amount. Since there
have been problems before with the line, it was decided to replace it with 1,640 feet of 2-inch
steel line at a cost of $2,540. The work was completed in July 1989.
Once the above modifications were made to the turbine, generator, switchgear and air system
the facility operates as planned. The sliding control gate that provides a continuous
adjustment of flow to the turbine allows the turbine to operate down to six percent of full
gate. With this feature the unit stays on line during periods of ra?idly varying stream flow,
thus optimizing the energy available from this flashy creek.
-5-
ANNUAL OPERATING EXPENSES
The annual operating expenses are those that occur each year no matter what the operating
conditions. Monthly summaries are shown for the three and half year period in Table 1 and
explained in detail below.
Special Facility Charge. is the monthly charge by the utility Pacific Gas and Electric
(PG&E) to cover the cost of special equipment that had to be added to their system before
they would accept the power from the project. The equipment include such facilities as
reclosures, meters, and line upgrades. The charge is $140.55 per month and runs the life of
the 30-year power purchase contract.
Powerhouse Utility Bill is the monthly charge form PG&E for power used in the
powerhouse that exceeds the amount being generated by the plant. When the plant is
generating and the outgoing power exceeds the needs of the powerhouse there is no charge.
In nongenerating months the utility charge averages around $0.11 per kW hour or around
$130 per month. The power usage is by the step up transformers, the generator warmers, the
computer monitor, exhaust fan, lights, sump pumps, and compressor. In a nongenerating
winter month the expense averages $250 per month.
Telephone Charge includes the monthly connection charge plus any long distance charges.
The monthly connection charge is $42 and long distance charges average $15 to $30 per
month. Since the plant is so remote ali outgoing calls are long distance and mainly consists
of the operator calling into the utility or the plant automatically calling the operator.
Fisheries Monitoring is required as part of the FERC License requirements. It consists of
a fisheries biologist conducting an underwater inspection of the fish screens, ladder, and
tailrace to ensure that ali fish protection facilities are functioning. The surveys are conducted
once per month from January through March and cost approximately $200 each.
-6-

FERC Charges are assessed to the project on an annual basis and currently runs $173 per
year.
Insurance consists of a $1 millon liability policy and a fire insurance policy in case of forest
fires. Other insurance is too costly for the project to support. These two insurances alone
cost $2,350 per year.
Plant Operator is on call continuously through out the generation season and is expected
to visit the plant three times a week under normal operating conditions. During the season
the operator is paid $400 per month.
Accounting fees for the annual income tax preparation for the project partnership averages
around $1,300.
County Taxes for the project took three years to negotiate. The final annual taxes were
settled at $1,676.
Miscellaneous Expenses such as records, bank charges, etc., average around $300 per
year.
Annual Maintenance includes a complete inspection of ali components cf the plant,
maintenance of all equipment, cleaning, and repair or replacement of any worn or damaged
components. This maintenance labor and parts averages around $3,800.
The large maintenance charge for the month of May 1990 included the cost of annual
maintenance ($3,000), new walk bridge to the operators cabin ($2,500), replacement of the
air line ($2,540), new cat walk above the screens ($2,300), and repair of insulators damaged
by hunters ($717).
-7-

As shown above and in Table 1, the annual operation and maintenance cost of the plant
averages around $17,000.
EFFECTS OF LOW WATER YEARS
In the northern California area where this project is located, the annual rainfall for the last
four years has ranged 60 to 80 percent of normal resulting in stream flows as low as 28
percent of normal. When large storms did come, they occurred in intense rainfall events
resulting in short high runoff events, thus exceeding the capacity of small run-of-river projects
such as this. Most of the small run-of-river hydro projects in this area generated only about
20 to 35 percent of their forecasted energy.
The Cottonwood Creek watershed in which this project is located is best characterized by the
USGS stream gage on the main stem of Cottonwood Creek Near Cottonwood, California
(Gage No. 11376000). The stream gage measures the total runoff of the basin and has an
excellent record since 1940. The average annual streamflow for this 50-year period is 857
cfs. Listed below are recorded stream flows for the last four years.
Year Flow (cfs) % of Normal
1987 298 34.8
1988 440 51.3
1989 481 56.1
1990 244 28.5
In the 1989 season, 35 to 45 percent of the annual precipitation and runoff occurred in the
month of March, causing high stream flows the small run-of-river plant could not effectively
utilize.
The 1990 season was the driest of the four years. One small storm occurred in mid-January,
but the only storm of any significance occurred at the end of May, which resulted in over 60
percent of the generation for that year.

Another measure of long-term water conditions in the watershed above the project is
reflected by the rain gage located at the approximate centroid of the watershed at the
Harrison Gulch Ranger station. This daily recording rain gage has a 36-year average annual
precipitation of 36.56 inches. Listed below are the recorded annual amounts for the last
three years.
Year Precipitation (inches) % of Normal
1987 24.03 65.7
i988 27.22 74.5
1989 30.14 82.4
1990 25.23 69.0
Because of these drought conditions and the storms that did occur being of the high-intense
short-duration type that produced flashy events, the production of the project has been only
a small fraction of that expected from the unit. Short-term high flows are shown in
Photographs 3 and 4. The foreca:,ted and actual stream flow and production are shown in
is shown in Table 2.
To date, the maximum monthly generations occurred in January 1988 and March 1989. Both
averaged around 108 kW for the month, with a peak day average of 313 kW at the utility
meter.
-9-

PHOTOGRAPH 1. TURBINE - GENERATOR
PHOTOGRAPH 2. GENERATOR- SWITCHGEAR
-10-
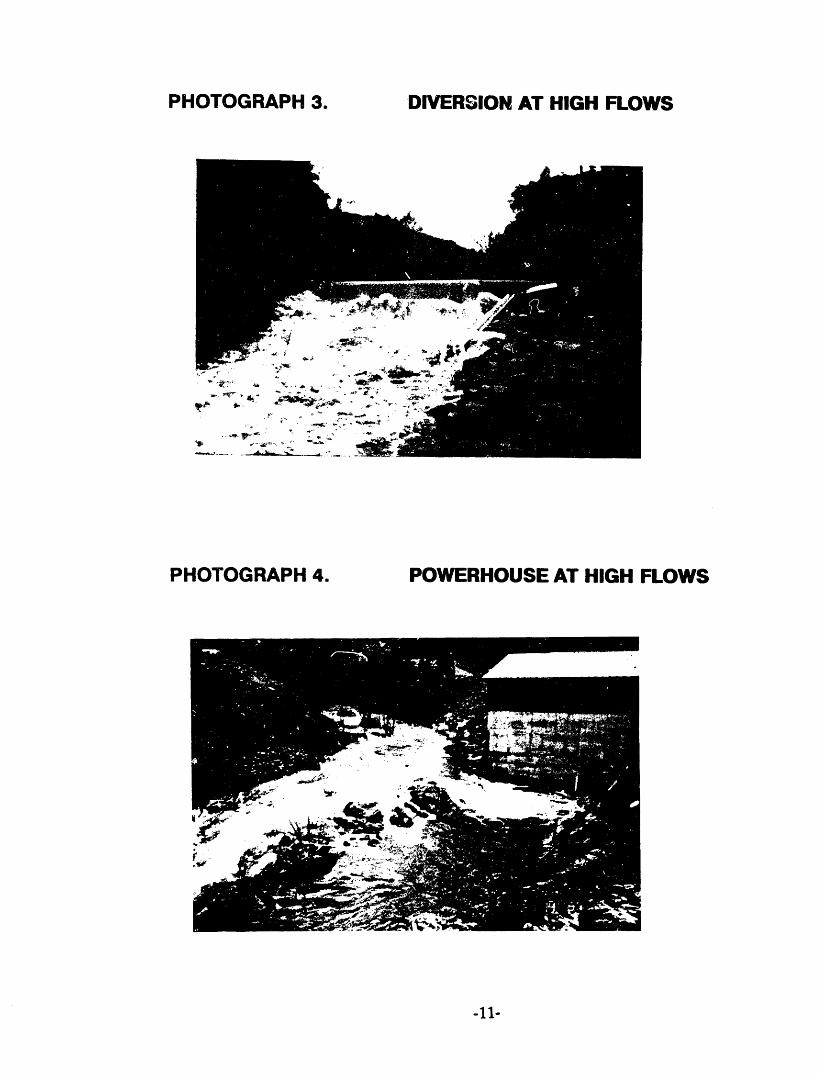
PHOTOGRAPH 3. DIVERGION AT HIGH FLOWS
PHOTOGRAPH 4. POWERHOUSE AT HIGH FLOWS
-11-

TABLE 1OPERATION AND MAINTENANCE COST
Operating Maintenance TotalCost Cost Cost
Jan 87 $ 446 $ 261 $ 707Feb 87 813 0 813
Mar 87 996 61I 1,607Apr 87 934 1,405 2,339May 87 848 24 872Jun 87 822 1,008 1,830Jul 87 1,058 0 1,058Aug 87 558 49 607Sep 87 555 912 1,467
Season 7,030 4,270 11,300
Oct 87 269 0 269Nov 87 886 1,807 2,693Dec 87 831 0 831
Jan 88 1,300 0 1,300Feb 88 2,102 0 2,102Mar 88 1,228 0 1,228Apr 88 2,856 0 2,856May 88 1,313 0 1,313Jun 88 531 3,665 4,196Jul 88 404 0 404Aug 88 480 0 480Sep 88 269 0 269
Season 12,469 5,472 17,941
Oct 88 436 714 1,150Nov 88 449 0 449
Dec 88 1,635 1,243 2,878Jan 89 424 196 620
Feb 89 1,274 0 1,274Mar 89 578 100 678Apr 89 556 992 1,548May 89 1,714 399 2,113Jun 89 526 0 526Jul 89 510 0 510Aug 89 718 2,539 3,257Sep 89 1,989 0 1,989
Season 10,809 6,183 16,992
"12-XOl-IlrO_-tbl$

TABLE 1 (Continued)
Operating Maintenance TotalCost Cost Cost
Oct 89 408 625 $ 1,033Nov 89 246 0 246
Dec 89 2,671 1,253 3,924Jan 90 585 36 621Feb 90 805 0 805
Mar 90 1,290 249 1,539Apr 90 3,364 0 3,364May 90 427 11,057 11,484Jun 90 141 0 141Jul 90 419 175 594
Aug 90 210 0 210Sep 90 2,347 0 2,347
Season 12,913 13,395 26,308
"13-OI-tiron-this

TABLE 2STREAM FLOW AND PRODUCTION
Historical Actual Forecasted Actual ProductionStream Stream Production Production Value
Flow (cfs) Flow (cfs) (kWh) (kWh) ($)
Jan 87 102 16 88,000 3,960 238Feb 87 122 52 115,000 18,180 1,143Mar 87 105 84 128,000 46,260 2,893Apr 87 72 27 98,000 180 13May 87 27 9 55,000 0 0Jun 87 10 3 9,000 0 0Jul 87 4 1 0 0 0Aug 87 1 0 0 0 0Sep 87 1 0 0 0 0
Season 43 19 493,000 68,580 4,287
Oct 87 5 0 3,000 0 0Nov 87 23 0 42,000 0 0Dec 87 45 60 80,000 0 0Jan 88 102 111 88,000 78,119 5,272Feb 88 122 32 115,000 5,749 388Mar 88 105 15 128,000 0 0Apr 88 72 10 98,000 1,452 98May 88 27 5 55,000 0 0Jun 88 10 1 9,000 0 0Jul 88 4 0 0 0 0Aug 88 1 0 0 0 0Sep 88 1 0 0 0 0
Season 43 20 618,000 85,320 5,758
Oct 88 5 0 3,000 0 6Nov 88 23 30 42,000 5,580 378Dec 88 45 15 80,000 16,560 1,160Jan 89 102 36 88,000 18,753 1,406Feb 89 122 20 115,000 332 26Mar 89 105 162 128,000 75,452 5,654Apr 89 72 45 98,000 17,388 1,302May 89 27 15 55,000 2,556 192Jun 89 10 5 9,000 0 0Jul 89 4 1 0 0 0Aug 89 1 0 0 0 0Sep 89 1 0 0 0 0
Season 43 27 618,000 136,621 10,118
xo,-,/,o.-,b,s -14-

TABLE 2 (Continued)
Historical Actual Forecasted Actual ProductionStream Stream Production Production Value
Flow (cfs) Flow (cfs) .... (kWh) (kWh) ($)
Oct 89 5 7 3,000 649 36Nov 89 23 11 42,000 171 28Dec 89 45 9 80,000 203 231Jan 90 102 52 88,000 8,713 453Feb 90 122 39 115,000 147 14Mar 90 105 21 128,000 21 0Apr 90 72 7 98,000 0 15May 90 27 10 55,000 13,175 1,727Jun 90 10 10 9,000 5,061 0Jul 90 4 2 0 0 0Aug 90 1 0 0 0 i)Sep 90 1 0 0 0 3
Season 43 13 618,000 28,140 2,504
0t-l/rort-Lbl s -15-

-!6-

-l?-

114679
Turbine
I Dye
Vacuum Exti'actlon
Gage
Elevation 84, 62¢ Runner Elevation 83.38 C Penstock
Bottom of Runner Elevation 81.88
PressureRing
Staff
Gage -__' Draft tube
Elevation 72.0 .[Tallwater
FIGURE 3. TURBINE- DRAFT TUBE SECTION
-i8-
11467gII I
SO
Slide Gate B2
B2
61Jwatlon 83.38
N = TURBINE SPEED 180 rpmL = LENGTH OF RUNNER 44"r 1 = OUTSIDE RUNNER DIAMETER 18.125"r2 = INSIDE RUNNER DIAMETER 12.25"SO = THROAT WIDTH 7,5"B1 = NOZZLE ENTRY ARC 90°B2 = ANGLE OF WATER ENTRY TO RUNNER 16°n = NUMBER OF BLADES 20SB = LENGTH OF ARC OF BLADE 7.123"t_ = THICKNESS OF 8LADE .375"r_ = RADIUS OF CURVATURE OF BLADE 5.625"d8 = OISTANCE BETWEEN OUTSIDE BLADE TIPS 5.671"B3 = ANGLE OF BLADE WITH OUTER PERIPHERY 30°B4 = ANGLE OF BLADE WITH INTER PERIPHERY 90°
ARBUCKLE MT. HYDRO rr'_-ir--;TURBINE DIMENSIONS
I II II I
FIGURE 4. TURBINE DIMENSIONS
-19-

I i i i O
0 O 0 0 0
(_) _N31Oi__l_-r:l 3Nle_l'_i.
-20-

