inês cunha rocha pereira - repositorium.sdum.uminho.ptªs... · long-term post-performance in...
TRANSCRIPT

Universidade do MinhoEscola de Economia e Gestão
Inês Cunha Rocha Pereira
abril de 2016
Announcement returns and post-merger performance: evidence of M&A momentum in the European Union market
Inês
Cun
ha R
ocha
Per
eira
A
nn
ou
nce
me
nt
retu
rns
an
d p
ost
-me
rge
r p
erf
orm
an
ce:
evid
en
ce o
f M
&A
mo
me
ntu
m in
th
e E
uro
pe
an
Un
ion
ma
rke
t U
Min
ho|2
016

Inês Cunha Rocha Pereira
abril de 2016
Announcement returns and post-merger performance: evidence of M&A momentum in the European Union market
Trabalho efetuado sob a orientação doProfessor Doutor Gilberto Ramos Loureiro
Dissertação de MestradoMestrado em Finanças
Universidade do MinhoEscola de Economia e Gestão

ii| Announcement returns and post-merger performance: evidence of M&A momentum in the European Union market
DECLARAÇÃO
Nome: Inês Cunha Rocha Pereira
Endereço eletrónico: [email protected]
Número do Cartão de Cidadão: 14415485
Título da Dissertação: Announcement returns and post-merger performance: evidence of M&A
momentum in the European Union market
Orientador: Professor Doutor Gilberto Ramos Loureiro
Ano de conclusão: 2016
Designação do Mestrado: Mestrado em Finanças
É AUTORIZADA A REPRODUÇÃO INTEGRAL DESTA DISSERTAÇÃO APENAS PARA
EFEITOS DE INVESTIGAÇÃO, MEDIANTE DECLARAÇÃO ESCRITA DO INTERESSADO, QUE
A TAL SE COMPROMETE.
Universidade do Minho, 29 de abril de 2016
Assinatura: ________________________________________________
Inês Cunha Rocha Pereira

Announcement returns and post-merger performance: evidence of M&A momentum in the European Union market |iii
Acknowledgments
At the end of one of the most important stages of my academic career, I wish to leave a
sign of appreciation and special thanks to some people.
Firstly, I would like to thank my supervisor, Professor Gilberto Ramos Loureiro, all his help,
dedication and patience. His exhaustive comments and constructive recommendations as well as
his willingness to give his time so generously are much appreciated. Additionally, I would like to
thank my friends, especially Joana Ferreira and Tânia Fernandes, for their encouragement and
help, and lastly, a special thanks to my parents and my brother for their understanding and
reinforcement when it was most necessary.

iv| Announcement returns and post-merger performance: evidence of M&A momentum in the European Union market

Announcement returns and post-merger performance: evidence of M&A momentum in the European Union market |v
Announcement returns and post-merger performance: evidence of M&A momentum in the
European Union market
Abstract
This study examines the short-term stock price reaction to an acquisition announcement and the
long-term post-performance in order to test the existence of a momentum effect in mergers and
acquisitions (M&A). The stock price reaction to the announcement of an acquisition is measured
by the cumulative abnormal announcement returns (CAARs), while the long-run performance is
estimated using the buy-and-hold abnormal returns (BHARs). Using a sample of 3,496 European
Union (EU) completed acquisitions between 2002 and 2012, I find evidence of merger momentum
by showing that (1) acquirers are more likely to obtain higher CAARs in period of “hot merger
markets” (i.e., when previous recent acquirers have also earned higher announcement returns)
and (2) the higher abnormal announcement returns tend to revert in the long-run, with acquirers
exhibiting lower BHARs. These results are in line with the investor sentiment (optimism) hypothesis
in hot merger markets. Further, the findings hold after several robustness tests, including industry
fixed effects and the elimination of consecutive acquisitions by the same acquirer that occur in a
small time window.
Keywords: Mergers & Acquisitions; Merger Momentum; Long-run Reversal; Over-optimism
Hypothesis

vi| Announcement returns and post-merger performance: evidence of M&A momentum in the European Union market

Announcement returns and post-merger performance: evidence of M&A momentum in the European Union market |vii
Rendibilidades anormais acumuladas e a performance no longo prazo após fusões e aquisições:
evidência de momentum na União Europeia
Resumo
Este estudo tem como objetivo analisar a existência de momentum em fusões e aquisições (F&A).
Consistente com a literatura, este fenómeno é analisado através da comparação das rendibilidades
anormais acumuladas com as rendibilidades a 3 anos das empresas envolventes na compra da
aquisição. Usando uma amostra de 3496 F&A efetuadas por empresas pertencentes à União
Europeia entre 2002 e 2012, encontra-se evidência de momentum, observando-se que (1)
acquirers obtêm rendibilidades positivas e elevadas na presença de hot merger markets (isto é,
quando recentes aquisições tem sido bem sucedidas) e (2) as elevadas rendibilidades tendem a
reverter no longo prazo, com as empresas adquirentes reportando rendibilidades negativas a 3
anos. Os resultados são consistentes com a teoria do sentimento do investidor (otimismo). Após
vários testes de robustez, incluindo efeitos fixos por indústria e a eliminação de aquisições
consecutivas realizadas pela mesma empresa num pequeno espaço de tempo, os resultados
mantêm-se consistentes.
Palavras-chave: Fusões e Aquisições, Rendibilidades Anormais, Momentum, Excesso de Otimismo

viii| Announcement returns and post-merger performance: evidence of M&A momentum in the European Union market

Announcement returns and post-merger performance: evidence of M&A momentum in the European Union market |ix
Table of Contents
Acknowledgments ..................................................................................................................... iii
Abstract ..................................................................................................................................... v
Resumo ................................................................................................................................... vii
Table of Contents ..................................................................................................................... ix
Index of figures and Tables ....................................................................................................... xi
1. Introduction ...................................................................................................................... 1
2. Literature review and hypotheses development .................................................................. 3
3. Empirical model related methodology ................................................................................ 7
3.1. Methodology for short-term announcement returns .................................................. 10
3.2. Methodology for long-term buy-and-hold abnormal returns ........................................ 11
4. Data description .............................................................................................................. 13
5. Results ........................................................................................................................... 17
5.1. Short-term announcement returns ........................................................................... 17
5.1.1. Discussion ....................................................................................................... 20
5.2. Long-term buy-and-hold abnormal returns ................................................................ 21
5.2.1. Discussion ....................................................................................................... 24
6. Robustness tests ............................................................................................................. 25
7. Additional analysis: Acquirers from the UK vs non UK ...................................................... 29
8. Conclusion ...................................................................................................................... 31
References ............................................................................................................................. 33
Appendix A - List of variables ................................................................................................... 37

x| Announcement returns and post-merger performance: evidence of M&A momentum in the European Union market

Announcement returns and post-merger performance: evidence of M&A momentum in the European Union market |xi
Index of figures and Tables
Figure 1-The trailing 12-month average CAAR and the trailing 12-month number of acquisitions for
acquisitions announced between 2002 and 2012. ............................................................................ 16
Table 1- Description of M&A sample by year ..................................................................................... 14
Table 2-Description of M&A sample by country .................................................................................. 15
Table 3-Summary Statistics ............................................................................................................. 17
Table 4-Regression results for the CAAR as dependent variable .......................................................... 19
Table 5-Regression results for the BHAR as dependent variable. ......................................................... 23
Table 6-Regression results for the CAAR as dependent variable: robustness test .................................. 26
Table 7-Regression results for the BHAR as dependent variable: robustness test .................................. 28
Table 8-Regression results for the BHAR as dependent variable: additional analysis ............................. 30

xii| Announcement returns and post-merger performance: evidence of M&A momentum in the European Union market
Announcement returns and post-merger performance: evidence of M&A momentum in the European Union market
|1
1. Introduction
With the strengthened competition in the capital markets, corporate organizations have put
an increased attention on their value creation strategies to ensure an advantage over competitors.
Mergers and acquisitions (M&A)1 are appointed as one of the most popular corporate strategies
through which companies create value and improve their competitiveness by achieving synergies
such as economies of scale and scope (Brealey, Myers, and Allen, 2011). Thus, M&As become an
integral part of the long-term business strategy of corporations all over the world (Mallikarjunappa
and Nayak, 2007).
The volume of mergers and acquisitions has greatly expanded over the past quarter century
and are now commonly used by corporations throughout the world to pursue their goals and
objectives related to strategic growth (Gaughan, 2005). Once a phenomenon seen primarily in the
United States (US), M&As have taken an important role in the European market as result of the
introduction of the 1992 Single Market program, the European Monetary Union, the development
of new European stock exchanges and further deregulation, privatization, and growth in the
technological industries (Weston, Mitchell, and Mulherin, 2013).
Although M&A activity should be viewed as value-enhancing strategic decisions, empirical
studies have not always shown positive wealth effects for the acquirer’s shareholders. The
overriding conclusion, in most of the studies, is that the announcement returns of the bidding firms
are slightly positive, but in the long-run they are significantly negative (Agrawal, Jaffe, and
Mandelker, 1992; Agrawal and Jaffe, 2000). Additionally, studies demonstrate that this negative
abnormal performance does not seem to be explained by specific characteristics of either the firms
involved or the acquisition deal. For instance, Harris, Frank, and Mayer (1987) analyse the
differences in the type of payment (cash or stock); Gregory (1997) studies the attitude of the
bidders and the type of acquisition. All of them find that bidders’ negative long-run performance is
not diminished or eliminated because of the type of deal.
Several recent studies on M&As have focused on merger momentum2, offering a number
of different insights into several acquisition theories. I examine these theories that are in line with
1 The concepts of merger and acquisition differs from each another as the first usually described a “friendly” union of two firms while the second is
used to describe a more hostile takeover. Although, throughout this work, these two concepts are used as synonyms. 2 Rosen (2006) defines merger momentum as a correlation between the market reaction to an acquisition announcement and previous market
conditions.
Announcement returns and post-merger performance: evidence of M&A momentum in the European Union market
2|
the notion of merger momentum, but have different expectations about the return of the bidding
firm in the long-run. The neoclassical theory considers that managers act in the best interest of the
shareholders and that merger momentum may be a response to numerous industry shocks that
increase synergies and therefore there is no long-term reversal. A second theory is that there are
managerial motivations behind M&A waves that are typically not aligned with shareholder’s interest.
If managerial goals drive merger decisions, then acquisitions during waves may be worse than
other acquisitions (Gorton, Kahl, and Rosen, 2005). The last theory is that momentum results from
the excessive optimism from shareholders and probably managers. According to Rosen (2006) this
is a suitable explanation for momentum and, at the same time, for the negative abnormal
performance in the long-run. Any increase in the returns of the bidding firm at the announcement
should reverse in the long-run as beliefs are substituted by outcomes.
The purpose of this study is to analyse the existence of a momentum effect in M&A in
periods of merger waves or hot M&A markets. Consistent with the literature, I evaluate the existence
of momentum in M&A by comparing the short-term announcement returns to the long-term
performance post M&A. If the long-term performance exhibits a downward reverse pattern with
respect to the announcement returns, then we may infer that the market overreacted to the
announcement of the acquisition, which suggests that investor sentiment may be a possible
explanation for merger momentum. This phenomenon may be more frequent during bull markets
or waves of acquisitions in certain industries.
Using a sample of 3,496 completed acquisitions by public firms announced between 2002
and 2012, I analyse the initial market reaction to the announcement of the acquisitions following
Brown, and Warner (1985) and long-run returns to acquisitions following Loughran and Vijh’s
(1997) methodology.
My results suggest the existence of merger momentum. For instance, the initial stock price
reaction to the announcement of an acquisition is positively correlated with the announcement
returns of previous recent acquisitions. However, in the long-run, there is a reversal effect. This
suggests that firms announcing an acquisition during a hot merger market perform no better and
possibly worse, all else equal, than those announcing at other times (Rosen, 2006). The results
are consistent with the overoptimism hypothesis in hot merger markets, showing that the effects
of investor optimism on the bidder performance is a phenomenon that also affects the European
Union market.

Announcement returns and post-merger performance: evidence of M&A momentum in the European Union market
|3
This study contributes to the literature on the impact that investor sentiment has on the
market reaction to M&A announcements, by exploring the effects on the European Union market.
The majority of the studies on this topic are focused mainly in the US, Canada and the UK, giving
little importance to M&A activity in the rest of Europe (Bruner, 2004; Brealey, Cooper, and Kaplanis,
2010; Sudarsanam, 2003). To the best of my knowledge, this is the first study of M&A momentum
in the EU market.
The study is organized as follows: Section 2 discusses related literature and the hypotheses
development; section 3 presents the empirical model and related methodology; section 4 describes
the sample selection and the data; the results of short-term announcement returns are discussed
in section 4 and the results for long-term returns in section 5. Section 6 presents some robustness
checks and section 7 compares the reversal effect on the UK and non-UK countries. The main
conclusions of the study are discussed in section 8.
2. Literature review and hypotheses development
It is a well-established fact that M&As come in waves and that some waves are strongly
clustered by industry (Mitchell and Mulherin, 1996). One of the most important challenges in the
M&A activity has been the explanation of this persistent pattern that is consistent with merger
momentum.
Rosen (2006) defines “merger momentum” as a correlation between the market reaction
to an acquisition announcement and recent market conditions. Thus, according to him, a “hot
merger market” is one in which recent acquisitions by other firms have been well received. Even
though “hot” markets are correlated with merger waves, they are not necessarily the same. As
Rosen (2006) refers, waves are traditionally measured by the number or value of acquisitions
rather than by the market’s reaction to acquisition announcements3.
The market reaction to an M&A announcement of the bidding firm depends naturally on
the synergies created by the acquisition. There are, however, other factors that may also explain
M&A announcement returns, such as the capacity of the managers to capture some of the
synergies created for their shareholders, whether the market anticipates or not the announcement,
or whether the shareholders react rationally to the announcement of M&As. Following Rosen
(2006), I assume, throughout this study, that the acquisitions are not fully anticipated by the market
3 The market reaction to acquisition announcements is gauged by the return of the bidding firms.

Announcement returns and post-merger performance: evidence of M&A momentum in the European Union market
4|
and that the managers of the bidding firms gain at least part of the surplus. These two assumptions
must hold, otherwise we should see no relationship between “hot merger markets” and M&A
announcements.
A sizeable stream of theoretical research attempts to explain the source of momentum
under different theories. The neoclassical theory, simplified by Andrade, Mitchell, and Stafford
(2001), advocates that acquisition waves emerge from economic, regulatory and industrial shocks.
According to this theory, shocks create high synergies and thus acquisitions following positive
shocks are better, on average, than others, leading to correlated announcement returns. In other
words, it is a reflection of merger momentum as the market reaction to M&A announcements is
positively correlated to previous market conditions with positive shocks. This hypothesis implies
that firms act in the interest of shareholders, making only acquisitions that increase the firm value.
In short, if the neoclassical theory holds, the positive abnormal returns from acquisition
announcements should not be reverted in the long-run.
A second theory for the increase in M&A activity is that there are managerial motivations
for acquisitions. For instance, some researchers claim that the “eat or be eaten” hypothesis,
proposed by Gorton, Kahl, and Rosen (2005), might explain the existence of acquisition waves.
The idea behind this theory is that managers can reduce their chances of being acquired by
acquiring other firms. A manager is willing to acquire defensively even when the acquisition is not
profitable (Rosen, 2006). If defensive aims are behind merger waves, then acquisitions during
these waves may be worse than acquisitions at other times (Gorton, Kahl, and Rosen, 2005).
Additionally, the hubris hypothesis, formulated by Roll (1986), is also appointed to explain
irrationality of the managerial behaviour. Roll advocates that managers are excessively self-
confident, mainly in bull markets, and so being misled by their overoptimism when evaluating M&A
opportunities. Driven by their excessive optimism, managers make acquisitions even when they
predict that the announcement will bring a decline in stock prices because they believe that they
will be proven correctly in the long-run. Since the acquisition hurts the value of the firm, there is
no reason to expect that the initial stock price will reverse in the long-run. Alternatively, managers
may exploit shareholders if they are compensated by increases in stock prices. They may have an
incentive to make bad acquisitions in “hot markets” since even a bad acquisition may increase the
stock price temporarily.

Announcement returns and post-merger performance: evidence of M&A momentum in the European Union market
|5
Taking into account that shareholders are rational, as assumed before, both the
neoclassical and managerial theories may explain merger momentum but in a distinct way. If the
neoclassical hypothesis holds, we should verify a positive correlation between merger waves and
the market reaction to the announcement of the acquisition, as the waves are a response to
common stocks that positively affect the potential synergies from the acquisitions. On the other
hand, if managerial motivations drive merger decisions, this correlation could be negative, i.e, may
actually exist acquisition waves, motivated by irrational or opportunistic behaviour of managers,
but the market reaction to these waves may be negative. Assuming that the market recognizes the
motivations of managers, it revises the acquisition’s valuation down when it is announced.
Another explanation that warrants further attention is the hot markets theory (Thomas and
Coakley, 2004) that was developed to explain the presence of investors’ optimism (Ljugqvist,
Nanda, and Singh, 2006). In fact, empirical studies find that, investors may be overly optimistic in
hot (bull) markets. For instance, Loughran and Ritter (1995) associate high returns on seasoned
equity offerings (SEO) to optimistic beliefs from investors. This theory was further applied by Rosen
(2006) to the market of mergers and acquisitions. He finds evidence that bidder stock prices are
more likely to increase when the acquisition is announced in a hot market as compared to a cold
market. Rosen explains this by the excessive optimism of investors, who in the presence of bull
markets or when recent M&As are well received, systematically misperceive the synergy gains from
the acquisitions.
If the investors’ overoptimism influences the market reaction to M&A announcements, then
we should see autocorrelation in bidding firms’ returns (Rosen, 2006). In the presence of bull
markets, where optimism empires, the market reaction to M&A announcements should be more
positive than other times, causing merger momentum, i.e., positive abnormal returns in the short-
run. However, this tendency should reverse, in the long-run, as the market recognizes through
results that acquisitions initiated in hot markets were not prudently evaluated and were, in fact,
bad deals, leading to negative abnormal long-run returns.
In addition to these theories, empirical studies find that acquisitions take place when the
overall stock market is hot. This relation is not new, dating back at least to Nelson’s (1959) study
of merger waves in the US, who observed that M&A activity seems to increase when the stock
prices are high: ‘‘It appears that merger expansion was not only a phenomenon of prosperity, but
that it was also closely related to the state of the capital market. Two reference cycle expansions,

Announcement returns and post-merger performance: evidence of M&A momentum in the European Union market
6|
unaccompanied by a strong upswing in stock prices, were marked by the absence of a merger
revival’’ (Nelson, 1959, p.7). Javanovic and Rousseau (2001) also confirmed this evidence on their
study. According to Rosen (2006), the positive correlation between the stock prices and the
intensity of merger activity could give support to the neoclassical theory if a raising stock market
reflects the increasing potential merger synergies.
Other reasons are appointed to explain the relation between hot stock markets and
acquisition waves. For instance, managers are more likely to make acquisitions during stock market
booms to take advantage of overvalued stocks (Dong, Hirshleifer, Richardson, and Teoh, 2006;
Rhodes-Kropf, Robinson, and Viswanathan, 2005). In that case, in a rational market, the reaction
to the announcement already considers that firm’s stock is overvalued. Thus, we would expect a
negative announcement return with no reversal in the long-run. Alternatively, this positive
correlation can also be a reflection of excessive optimism from investors. If so, we would observe
a more positive reaction to the acquisition announcement in the short-run, especially during hot
markets, with reversal in the long-run.
In sum, the previous theories of why acquisitions happen provide us different explanations
for merger momentum. Both the neoclassical and the overoptimism hypotheses indicate that the
market reaction to the announcement of the acquisitions should be more positive in the presence
of hot markets. However, while in the first theory we expect no reversal in the long-run returns, in
the second we expect a reversal in the stock returns of the bidding firms. On the other hand, if
merger decisions are motivated by managerial motivations, acquisitions during waves may be
worse than acquisitions at other times, i.e, we should verify a negative market reaction to M&A
announcements.
In light of the literature reviewed above, I formulate the following hypotheses that will be
tested in this study:
H1: The stock price reaction to M&A announcements is positively correlated with the
response to other acquisitions in the recent past, especially during hot markets.
H2: Long-term performance post-acquisition is negatively correlated with the
announcement returns in series of M&As that occur during hot markets.
Announcement returns and post-merger performance: evidence of M&A momentum in the European Union market
|7
3. Empirical model related methodology
The empirical model that I use to test the existence of merger momentum is adopted from
Rosen (2006). The model examines how recent merger activity and stock market conditions affect
the market reaction to an acquisition announcement. As in Rosen (2006), I focus only on the
acquiring firm. The market reaction to an M&A announcement, which is measured by the return of
the bidding firm, is analysed over two different horizons, in the short and long-run. It is through the
comparison of these two periods that I can infer about the existence of momentum. The
methodology used for the short-term announcement returns and long-term buy-and-hold returns is
presented in the subsection 3.1 and 3.2, respectively.
To test the first hypothesis of this study the regression model used is the following:
AcquirerCAAR=ƒ(Merger Activity, Market Momentum, Bidder-Specific Merger
Momentum, Bidder-Specific Stock Momentum, Deal-Specific and Bidder
Control Variables)
(1)
Where AcquirerCAAR is the initial market reaction to the acquisition announcements, measured by
the average five-day cumulative abnormal announcement returns (CAARs) for the bidding firms
surrounding the announcements.
The first independent variable of the model is the recent overall merger activity. As Rosen
(2006) suggests, two measures are included for this variable, one to capture merger momentum
and one to capture waves. The variable used to proxy for merger momentum is the trailing 12-
month average cumulative abnormal announcement return (CAAR), that is, the average five-day
CAAR for all sample acquisitions in the 12-month ending five days prior to the announcement. This
is the main measure of hot merger markets. If recent acquisitions created strong announcement
returns we can infer that we are in the presence of a hot merger market. Thus, per hypothesis 1,
I expect the coefficient on the trailing 12-month average CAAR to be positive and statistically
significant.
The second measure of previous merger conditions, intended to capture merger waves, is
the number of acquisitions in the previous 12-month before an announcement (hereby, trailing 12-
month number of acquisitions). According to Shughart and Tollison (1984), there is autocorrelation
between the number of acquisitions in a given year and the number of acquisitions in the following

Announcement returns and post-merger performance: evidence of M&A momentum in the European Union market
8|
year. As the factors that lead to an autocorrelation in the number of acquisitions might affect the
market reaction to an M&A announcement, this variable is used as an alternative proxy for hot
merger market (the intensity of M&A activity). Thus, I expect a positive relation between the prior
number of M&As and current announcement returns.
The next independent variable of the model (Market Momentum) considers that the market
reaction to an announcement may be affected by the existing conditions in the stock market. As
discussed early, in the literature review section, there is evidence that acquisitions tend to occur
when the overall stock market is overvalued. Thus, to measure if we are in the presence of a rising
stock prices, the return of each market in the year ending five days before an acquisition
announcement (trailing 12-month market return) is included. This variable is the proxy for the
market momentum.
The bidder-specific merger momentum factor is controlled by three variables, as suggested
by Rosen (2006). In order to evaluate the quality of the acquisitions taken by the bidder, I use the
five-day CAAR on the last acquisition by the bidding firm if it made an announcement in the previous
three years. Otherwise, it is assumed to be zero. To analyse how active the firm is, the number of
acquisitions announced in the previous three years by the bidder firm is considered. In my sample,
I have firms that make several acquisitions, the so called serial acquirers, while others make only
one. Finally, to distinguish frequent acquirers from occasional ones, a variable dummy that is one
if the bidding firm makes an acquisition in the last three years is included.
The bidder-specific returns have also an effect on the market reaction to the
announcement, as considered in the model. To account for this impact, I use the bidder’s buy-and-
hold abnormal return (BHAR) starting one year prior to the acquisition announcement and ending
five days before the announcement (bidder trailing 12-month BHAR).
Finally, to test the market reaction as correctly as possible, some control variables are
present in the model to account for characteristics related with the specific situation of the bidding
firm as well as specific conditions of the acquisitions. Firstly, I divide the means of payments in
stock, cash or mixed financing in order to control the differences reported by the types of payments.
For instance, Asquith, Bruner, and Mullins, 1983; Travlos, 1987; Servaes 1991, all document a
negative market reaction to an acquisition financed with stock, when compared to a cash offer.
Furthermore, the differences stated by Fuller, Netter and Stegemoller (2002) between public and
other type of targets are controlled. They find that bidding firm shareholders have a negative return

Announcement returns and post-merger performance: evidence of M&A momentum in the European Union market
|9
when purchasing a public target and have a positive return when buying subsidiary or private
targets.
In what concerns to the specific characteristics of the bidding firm, the size effect is
considered using the logarithm of the total assets of the firms. According to Loderer and Martin
(1997), there is a negative correlation between the size of the acquirer firm and its CAARs in the
short-run. The financial situation of the bidding firm is controlled using the book-to-market ratio
and the return on assets (ROA). Studies demonstrate that high book-to-market ratio, which is
correlated with a low Tobin’s Q, is related with higher short-run CAAR (Lang, Stulz, and Walkling,
1989). The ROA is used as a measure of the financial performance of the company, as there is
evidence that firms with a better prior performance make better acquisitions (Morck, Shleifer, and
Vishny, 1990). Additionally, I include the sales growth of the bidding firm as a proxy for the
company's growth opportunities.
Finally, Maquieira, Megginson, and Nail (1998) suggest that the returns of the acquirers
are lower when the acquisition is diversified4. So, I compare the two-digit SIC code of the bidding
firm with the two-digit SIC code of the target. A dummy variable is then included, which equals one
if the acquisition is diversified (that is, the acquirer’s industry two-digit SIC code differs from that
of the target’s).
To examine the second hypothesis, I estimate a similar regression to the previous one, but
using the 3-year buy-and-hold abnormal returns for the acquirer following the acquisition,
AcquirerBHAR, as dependent variable. Specifically, I estimate the following model to examine the
long-term performance post-acquisition:
AcquirerBHAR=ƒ(AcquirerCAAR, Merger Activity, Market Momentum, Bidder-Specific
Merger Momentum, Bidder-Specific Stock Momentum, Deal-Specific and
Bidder Control Variables)
(2)
All the remaining variables are the same described earlier and used in Model 1, with four
additional independent variables. One of them is the CAAR surrounding the announcement, which
is included as a control variable. According to the author of the model (Rosen, 2006), it allows
another test for the reversal hypothesis. The other three control variables are included under the
4 This evidence is also advocated by Morck, Shleifer, and Vishny (1990).

Announcement returns and post-merger performance: evidence of M&A momentum in the European Union market
10|
Bidder-Specific Merger Momentum5 group with the purpose to consider that firms can make
additional M&As in the post-announcement period. This decision may be affected by the return
obtained by the bidding firm after its initial acquisition announcement. According to Rosen (2006),
this “feedback effect” could inflate the long-run result of an M&A announcement. Thus, to account
for this, the number of acquisitions made by the bidding firm in the post-announcement period is
used as a control variable. Additionally, since empirical studies report differences within the method
of payment as well as in the type of target, the number of acquisitions in the post-announcement
period that use stock and those in which the target is public are also included.
If the phenomenon of merger momentum is present in my sample, I can expect a reversal in
the acquirer BHAR. Therefore, the main measure of hot merger markets, the trailing 12-month
average CAAR, should present a negative and statistically significant coefficient to confirm
hypothesis 2. The same arrangement should be analysed in the measure of merger waves, (trailing
12-month number of acquisitions).
3.1. Methodology for short-term announcement returns
To examine the initial market reaction to the acquisition announcement, I follow Browns
and Warner (1985) standard event study methodology and calculate the cumulative abnormal
announcement returns (CAARs) for the five-day (-2, +2) period surrounding the acquisition
announcement. The methodology is based on the assumption that the effect of the acquisition
announcement will be reflected immediately in the stock prices. Therefore, the stock price reaction
should incorporate any new information, including synergies created by the acquisitions, as well
as the effect of investor sentiment such as overoptimism.
Following the event study methodology, the abnormal announcement return (AAR) is
computed as the difference between the actual return of the bidding firm over the event window
and the expected return without considering the event (normal return). The expected return is
calculated using the market model, estimated over an estimation window ranging from -250 to -25
days prior to the M&A announcement date6. The market model assumes a stable linear relation
between the market return and the security return of the firm:
5 The variables are not stated in the model for reasons of brevity. 6 This period is considered a sufficiently long period for the estimation of the coefficients as suggested by Brown and Wagner, 1995, and Kothari
and Warner, 2007.

Announcement returns and post-merger performance: evidence of M&A momentum in the European Union market
|11
𝑅𝑖𝑡 = 𝛼𝑖 + 𝛽𝑖𝑅𝑚𝑡 + 𝜀𝑖𝑡 (2)
Where 𝑅𝑖𝑡 is the daily stock return of firm i in day t and 𝑅𝑚𝑡 is the daily market index return.
The model is estimated using daily stock returns and, as a proxy for the market, I use the
stock market index of each firm’s country, provided by DataStream.
With the estimates of 𝛼𝑖 and 𝛽𝑖, I compute the expected (normal) return over the 5-day (-2, +2)
event window as follows:
𝐴𝐴�̂�𝑖𝑡 = 𝑅𝑖𝑡 − 𝛼�̂� − 𝛽�̂�𝑅𝑚𝑡 (3)
To obtain the cumulative abnormal announcement return (CAAR), the daily AAR are summed over
the select event window.
𝐶𝐴𝐴𝑅 = ∑ 𝐴𝐴�̂�𝑖𝑡
𝑡=2
𝑡=−2
(4)
3.2. Methodology for long-term buy-and-hold abnormal returns
In order to test my second hypothesis, I extend the time horizon of the dependent variable
and compute long-term returns. If the initial market reaction to the M&A announcement
incorporates all the information related to the acquisition, then the post-announcement abnormal
return should be zero, on average. Deviations from this value may be partially explained by investor
sentiment in the form of over or underreaction. In fact, if the neoclassical theory holds, the CAAR
should be an unbiased estimate of the value of the acquisition as there are no deviations in the
post-announcement period. The same happens if managerial motivations drive acquisitions and
the markets knows that.7 However, if the overoptimism among investors is the source of the positive
relationship between the CAAR and merger momentum variable, then there should be a reversal
of the CAAR in the long-run.
7 If managerial motivations are responsible for acquisitions, the initial market reaction, measured by the CAARs of the bidding firms, should be
negative. Since the acquisition hurts the value of the firms, there is no reason to suppose that, in the long-run, exists a reversal. It is important to
note that the managerial motivations hypothesis is not an alternative explanation for merger momentum as high CAARs, it only justifies the existence
of waves.
Announcement returns and post-merger performance: evidence of M&A momentum in the European Union market
12|
To analyse the post-acquisition long-term performance, I follow Loughran and Vijh’s (1997)
methodology and compute the buy-and-hold abnormal return (BHAR) over a three-year horizon8.
Recent empirical evidence shows that long-horizon abnormal returns can be seriously
misspecified (Kothari and Warner, 1997). For instance, the implementation of BHAR is likely to
under-estimate the significance of long-run negative abnormal return and to over-estimate the
significance of long-run positive abnormal return (Gregory, 1997). Nevertheless, the skewness bias
associated with this methodology is not a serious problem in the context of this study because it
works against finding evidence of a reversal effect in stock returns post-acquisition. Thus, should
the results show a negative relation between BHAR and short-term announcement returns, my
confidence in the existence of a reversal effect is even stronger.
Another caveat of this methodology, referred by Fama (1998), is that the BHAR approach
ignores cross-sectional correlation in abnormal returns among firm events. This can lead to
overstated test statistics and thus produce less reliable inferences (Mitchell and Stafford, 2000).
In order to mitigate, in some way, this problem, I cluster the standard errors of the regressions at
the country and year level. Despite the criticism that involves this approach, Lyon, Barber, and Tsai
(1999, p. 166) support the use of BHAR as it “precisely measures investor experience”.
To compute the BHAR, I require that all the firms in my sample have three years of returns
after the announcement. This restriction could lead to survivorship bias as I may exclude some
non-surviving firms within the three-year period post-announcement. Although I acknowledge that
this may create a problem, I rely on Baker and Limmack (2001) as well as Higson and Elliott
(1998), who demonstrate that in their studies, the survivorship bias does not appear to have a
significant impact on the results.
The three-year BHAR is computed as a difference between buy-and-hold returns of the
firms that engaged in M&As and the buy-and-hold return of the market from the country where the
firm belongs to. The formulation is given by the following equation:
𝐵𝐻𝐴𝑅 = ∏(1 + 𝑅𝑡) − ∏(1 + 𝑅𝑚𝑎𝑟𝑘𝑒𝑡,𝑡)
𝑇
𝑡=1
𝑇
𝑡=1
8 Consistent with Rosen (2006), I adopt the three year time window as it is considered to be long enough to capture the abnormal performance of
the bidding firms.
Announcement returns and post-merger performance: evidence of M&A momentum in the European Union market
|13
Where BHAR is the compounded abnormal return for holding a stock of a firm that has engaged in
an acquisition across t periods, the 𝑅𝑡 is the daily return of the firm and 𝑅𝑚𝑎𝑟𝑘𝑒𝑡,𝑡 is daily of the
firm’s country market index. The BHAR are computed over the period that starts three days after
the announcement of the acquisition and ends three years after.
4. Data description
The sample used consists of 3,496 completed acquisitions undertaken by European Union
(EU) firms between January 1st 2002 and December 31st 2012, as provided by Securities Data
Company (SDC) database. Both targets and acquirers are members of the EU. Consistent with the
literature, I require that the acquirer purchases at least 50% of the shares of the target and after
the purchase the bidder owns at least 90% of the target company. Additionally, acquirers need to
be public firms and deals with deal value below $10 million are excluded.
For each deal, I collect the announcement date, the SIC codes, names and countries of
the acquirers and targets as well as other deal characteristics, such as the target type (public,
private or subsidiary) and the method of payment (pure cash, pure stock, or mixed9). As SDC does
not provide stock price information, I combine this sample with Thomson Reuters’ DataStream.
Further, to access the performance of the bidder firm, a set of accounting data are extracted from
Thomson Financial’s WorldScope database such as the total assets, sales, EBIT and book value of
equity. The market value of equity is collected from DataStream.
Within the group of 28 countries that compose the European Union, I only consider 21 as
the data related to the other 7 is unavailable in the pre-adoption period10. Also, I consider only deals
where the acquirers have at least five days of return data surrounding the announcement of the
acquisition. In addition, I exclude deals in which the acquirer announced more than one acquisition
in the same day. As this sample involves a set of different countries spanned over 11 years, I have
to take into account the inflation effect, so, I adjusted the dollar value of total assets to reflect 2010
prices using the Consumer Price Index (CPI) collected from the World Bank database.
9 Mixed payment acquisitions are those in which the method of financing is neither pure stock nor pure cash and integrate methods classified as
“other” by SDC. 10 M&A Deals announced in Croatia, Estonia, Hungary, Latvia, Lithuania, Malta and Slovakia were excluded.
Announcement returns and post-merger performance: evidence of M&A momentum in the European Union market
14|
Finally, any firm with a negative book value of equity is dropped and, in order to reduce
the influence of outliers, I winsorize some of the variables11 at the top and bottom 1% of the
distribution.
Table 1 presents the sample description related to the number of acquisitions and the
mean transaction value of the deals per year. A growing trend in M&A activity can be observed
during the first 6 years of the analysis period, with the highest value achieved in 2007 (560 deals).
After that, there was a decline, being 2009 the year that registers the smallest number of
acquisitions, only 187. The transaction values indicate that the increase in the merger activity was
followed by a raise in the value of the deals, with the highest values reported in 2004 and 2006.
Table 1- Description of M&A sample by year This table reports the total number of acquisitions and the mean transaction values of the deals per year. Transaction
values are reported in million of dollars. The sample comprise 3,496 completed acquisitions made by European Union
(EU) publicly firms during the 2002 to 2012 period. I define a merger as an acquisition where the acquirer purchases
at least 50% of the target firm and after the purchase the bidder owns at least 90% of the target.
Year N Mean Transaction Value
($million)
2002 228 242,702 2003 264 230,021 2004 305 514,029 2005 456 402,979 2006 490 509,177 2007 560 433,951 2008 310 332,222 2009 187 276,315 2010 252 290,116 2011 253 175,044 2012 191 268,321 Total 3,496 363,962
Table 2 reports the number of M&A announcements by country. The distribution of M&As
varies widely across countries. The UK accounts for approximately 46% of the total announcements
of the sample, followed by Sweden (9.31%) and France (9.21%), while Bulgaria and Romania have
the lowest number, with only 0.03% of the total acquisitions each.
11 I winsorize all variables except those that are already an average.

Announcement returns and post-merger performance: evidence of M&A momentum in the European Union market
|15
Table 2- Description of M&A sample by country The table lists the number of acquisitions announcements by each of the countries involved in the sample during the
2002 to 2012 period. Within the group of 28 countries that compose the European Union only 21 are considered as
the data relative to the remaining is unavailable in the pre-adoption period.
Country N Percentage
Austria 58 1.66 Belgium 86 2.46 Bulgaria 1 0.03 Cyprus 5 0.14 Czech Republic 2 0.06 Denmark 66 1.89 Finland 119 3.40 France 322 9.21 Germany 198 5.66 Greece 36 1.03 Ireland-Rep 90 2.57 Italy 208 5.95 Luxembourg 10 0.29 Netherlands 140 4.00 Poland 41 1.17 Portugal 24 0.69 Romania 1 0.03 Slovenia 2 0.06 Spain 151 4.32 Sweden 326 9.32 United Kingdom 1,610 46.05 Total 3,496 100.00
Table 3 shows descriptive statistics for all the variables used in the model. Some of them
are worth being discussed briefly. The first two variables, the trailing 12-month average CAAR and
the trailing 12-month number of acquisitions, which are the ones used to proxy for merger activity,
can be analysed in Figure 1. They are positively correlated in the first years of the sample period
(2004 a 2009). A clear uptrend in the number of acquisitions during this period is verified, with
the highest number achieved in 2008 (560 acquisitions). This evidence identifies the first period
(2002-2008) as a hot merger market when compared to the rest of the sample period. Although
the two variables show a different pattern after 2009, it is important to note that both of them
describe the conditions of the merger market but in different aspects. While the number of
acquisitions declined, the trailing 12-month CAAR had a significant increase after 2009. This may
be due to the intrinsic value of the deals. Although the number of acquisitions decreased, the deal
value of each acquisition can be higher, leading to this increase in the CAAR.
Announcement returns and post-merger performance: evidence of M&A momentum in the European Union market
16|
For the sample of 3,496 acquisitions, the average CAAR is, approximately, 1.45%, which
is significantly different from zero at 1% level. The deal-specific control variables indicate that,
approximately, 44% of targets are private companies, 11% are public, and 45% are subsidiaries.
With respect to the payment method, 30.1% of the deals were financed with 100% stock, while only
7.07% of deals were fully paid in cash. Acquirer firms have an average of $27 million in assets and
a median of $1.343 million. The log of total assets is used in order to control for this extensive
range of bidder sizes. The return on assets (ROA) of bidder firms is approximately 8% and the book-
to-market ratio presents an average of 0.81. Finally, it is important to note that almost 50% of the
deals are diversified, that is, the deals involve firms from two different industries.
0
100
200
300
400
500
600
0
0,005
0,01
0,015
0,02
0,025
0,03
2002 2004 2006 2008 2010 2012
Nu
mb
er o
f an
no
un
cmen
ts
Ave
rage
CA
AR
Year
Trailing 12-monthaverage CAAR
Trailing 12-monthnumber of acquisitions
Figure 1- The trailing 12-month average CAAR and the trailing 12-month number of acquisitions for
acquisitions announced between 2002 and 2012. Source: Self-elaboration

Announcement returns and post-merger performance: evidence of M&A momentum in the European Union market
|17
Table 3- Summary Statistics The table provides descriptive statistics of the main variables used. Target is private, subsidiary and public indicate the
percentage of acquisitions with that kind of target; Pure stock and pure cash financing is the percentage of acquisitions
that are 100% financed with stock and cash, respectively; Mixed financing is the percentage of acquisitions in which
the financing method is neither pure stock nor pure cash and methods categorized as “others” by SDC; Total assets
are in US$ million, reflecting 2010 prices; Diversifying acquisition is the percentage of acquisitions in which the
acquirer and the target firms are in different industries. The remaining variables are defined in Appendix A. All variables,
except those that are already an average, are winsorized at top and bottom 1% of the distribution.
Variables N Mean Median Std. Dev CAAR 3,496 1.45% 0.46% 8.03% Trailing 12-month average CAAR 3,488 1.56% 1.60% 0.67% Trailing 12-month number of acquisitions 3,493 354 325 136 Trailing 12-month return on market 3,496 16.81% 20.16% 32.69% CAAR of the last announcement by bidding firm 3,496 0.47% 0 3.15% Dummy that is 1 if there was a M&A in prior 3years 3,496 43.85% 0 49.63% Number of acquisitions in the last 3years 3,496 0.98 0 1.63 Trailing 12-month BHAR on the bidder's stock 3,464 15.33% 5.35% 179.50% Target is private 3,496 44.42% 0 49.70% Target is subsidiary 3,496 44.99% 0 49.76% Target is public 3,496 10.58% 0 30.77% Pure stock financing 3,496 30.09% 0 45.87% Pure cash financing 3,496 7.07% 0 25.63% Mixed financing 3,496 62.84% 1 48.33% Total assets of the bidding firm ($million) 3,404 27.1 1.343 1.16E+08 Log (total assets) 3,404 14.27 14.11 2.249 Bidder ROA 3,102 7.97% 7.82% 7.83% Bidder book-to-market 3,149 0.81 0.64 0.70 Sales growth 3,144 49.54% 12.08% 181.67% Diversifying acquisition 3,496 49.06% 0 50.00%
5. Results
5.1. Short-term announcement returns
Table 4 shows the CAAR regression results for all the acquisitions during the sample
period. The regression includes control variables that account for the type of target involved, the
method of the payment of the acquisition, the specific characteristics of the bidding firm and a
dummy that equals one if the acquisition is diversified and zero otherwise.
The regression results confirm the existence of merger momentum at the overall merger
market-level. The variable used as a proxy for merger momentum, which is the trailing 12-month
average CAAR, has a positive (0.398) and statistically significant coefficient at the 5% significance
level. This means that the average CAAR of recent M&A announcements influences positively the
initial market reaction to an acquisition announcement. A one percentage point increase in the

Announcement returns and post-merger performance: evidence of M&A momentum in the European Union market
18|
trailing 12-month CAAR increases the bidder’s CAAR by 0.398 percentage points, all else equal.
The second variable used, which aims to capture merger waves (the trailing 12-month number of
acquisitions), has also a positive and statistically significant coefficient at the same significance
level. This result shows that the initial market response to an M&A announcement is positively
related to the intensity of the M&A activity during the prior 12-months period. Rosen (2006) does
not find this effect in the US as the coefficient is described to be insignificant.
There is also evidence of merger momentum at the firm level. The CAAR on the last
announcement by the bidding firm, which is one of the proxies for bidder specific merger
momentum, is positive and statistically significant at 5% significance level. Therefore, the current
market reaction to an acquisition announcement is positively correlated with the quality of the
previous acquisitions undertaken by the firm. This value means that one percentage point in the
bidder’s previous announcement return boosts the CAAR of the current announcement by 8.1
basis points, approximately, all else equal. The number of acquisitions in the previous three years
by the bidder and the first acquisition dummy have a negative and statistically significant coefficient
at 10% and 5% significance level, respectively. This indicates that the market reaction to current
acquisitions is negatively correlated with the quantity of previous acquisitions.
As for the stock market, there is not any evidence that announcing an acquisition in a bull
stock market leads to a better CAAR than announcing an acquisition in a bear market. The
coefficient on the trailing 12-month return on market is not statistically different from zero. In
contrast, Rosen (2006) finds that the stock return of the US market influences positively the CAAR
of the acquisition announcement.
The coefficient on the idiosyncratic return of the bidding firm in the previous 12-month
(trailing 12-month BHAR) is negative and strongly significant at the 1% significance level. When the
return of the bidding firm in the last 12-month to an acquisition announcement increases by one
percentage point, the average CAAR from the announcement is 0.23 basis points lower, all else
equal.
Regarding to the control variables, the results show that both the dummy variable for
private target as well as for subsidiary target are positively and strongly correlated with the CAARs.
These results are consistent with Fuller, Netter, and Stegemoller (2002), who argue that bidders
get a better price when they purchase non-public firms. The attractive price in this type of

Announcement returns and post-merger performance: evidence of M&A momentum in the European Union market
|19
acquisitions could be justified by the liquidity discount12 and negotiation power of public targets
comparing to subsidiary or private targets. Moreover, the coefficient on the log of the total assets
is negative and statistically significant, meaning that smaller acquirer firms have, on average, larger
CAARs. This result is also consistent with the literature.
Table 4- Regression results for the CAAR as dependent variable
This table shows the cumulative abnormal announcement returns (CAARs) of acquirers over the 2002 and 2012
period. The dependent variable, the CAAR, is calculated for the five days (-2; +2) surrounding the announcement day
(day 0) of the acquisition. Abnormal returns are computed using the market model approach. All variables are defined
in Appendix A. Heteroskedasticity robust t-statistics are show in parentheses. *, ** and *** indicate statistically
significant at the 10%, 5% and 1% level, respectively. Full Sample
Coefficient t-statistics Merger momentum: Trailing 12-month average CAAR 0.3981 (1.98)** Trailing 12-month number of acquisitions/1000 0.0190 (2.10)** Market momentum: Trailing 12-month return on market -0.0008 (-0.19) Bidder-specific merger momentum: CAAR of the last announcement by bidding firm 0.0809 (2.34)** Dummy that is 1 if there was an acquisition in prior 3years -0.0060 (-2.21)** Number of acquisitions in the last 3years -0.0010 (-1.68)* Bidder-specific stock momentum: Trailing 12-month BHAR on the bidder's stock -0.0023 (-4.24)*** Control variables: Private target 0.0234 (5.59)*** Subsidiary target 0.0239 (5.61)*** Public target with stock -0.0035 (-0.46) Private target with stock 0.0015 (0.10) Subsidiary target with stock -0.0004 (-0.03) Log of total assets -0.0012 (-3.52)*** Bidder ROA -0.0175 (-0.97) Bidder book-to-market 0.0016 (0.89) Bidder sales growth 0.0002 (0.20) Diversifying acquisition -0.0012 (-0.54) Observations 2,879 Adjusted R-square 0.0688
12 The liquidity discount exists because private and subsidiaries firms cannot be bought and sold as easily as publicly traded firms (Fuller, Netter,
and Stegemoller, 2002).

Announcement returns and post-merger performance: evidence of M&A momentum in the European Union market
20|
5.1.1. Discussion
The results in the CAAR regression indicate evidence of merger momentum. The variable
used to proxy for this phenomenon is positively correlated with the CAARs. So, the short-term stock
price reaction to an acquisition announcement tends to be larger the larger is the average reaction
to other M&As that have been recently announced. Also, the overall number of acquisitions in the
recent year is positively related with the CAARs. So, the short-term stock price reaction to an M&A
announcement appears to be positively related not only with quality13 of previous acquisitions but
also with the number of acquisitions in the last 12 months.
These results provide strong support for the first hypothesis of this study. The short-term
stock price reaction to an M&A announcement is positively related to the reaction to other recent
acquisition announcements. This finding puts the overoptimism theory as one possible explanation
for merger momentum. According to it, the positive autocorrelation in announcement returns is
due to the excessive optimism from investors, who in the presence of hot merger markets,
systematically misperceive the synergy gains from the acquisitions. Although, to confirm this
theory, the long-term performance, analysed in the next section, has to exhibit a downward reverse
pattern with respect to the announcement returns.
Contrary to the results of Morck, Shleifer, and Vishny (1990), there is evidence of a negative
relation between the bidder-specific stock momentum and the initial market reaction to an
acquisition announcement. One possible explanation for the negative coefficient on the trailing 12-
month BHAR on the bidder’ stock may be the hubris hypothesis postulated by Roll (1986).
According to Roll, managers of bidding firms that had good outcomes from recent acquisitions may
be afflicted with overconfidence and so they over-estimate their ability to create value even when
they anticipate a decline in the stock price at the acquisition announcement. Managers act in this
way because they believe that the market will prove their perception in the long-run. As
shareholders have not a perfect control over managers’ decisions, they are not able to prevent
such acquisitions. Thus, if the overconfidence of managers leads to making bad acquisitions, the
stock price will be discounted and there is no reason to expect a reversal in the long-run (Rosen,
2006). This suggest a non-positive coefficient on the trailing 12-month BHAR variable in the long-
run regression. I will turn to this issue in the next section.
13 Note that the term “quality” refers to the returns obtained by the bidding firms.

Announcement returns and post-merger performance: evidence of M&A momentum in the European Union market
|21
An additional possible reason for the negative relationship between the CAAR and the
trailing 12-month BHAR variable is the use of stock to financing the acquisition when it is overvalued
(Travlos, 1987). A firm is more likely to make an acquisition with stock financing when its stock
price has been rising. This fact is recognized by the market, which leads to the negative return at
the acquisition announcement. However, when I delete the acquisitions financed with 100% of
stock and run the previous regression14, this value remains strongly negative, which indicates that
this explanation finds weak support in the data.
5.2. Long-term buy-and-hold abnormal returns
Table 5 presents the BHAR regression results. In order to avoid contamination in returns, I
focus only in the post-announcement period, which starts 3 days after the acquisition
announcement date and ends three years after. The variables in the regression are the same used
to analyse the initial market reaction, with four additional independent variables, which are the
CAAR surrounding the announcement and the bidder’s future acquisitions variables15, included
under the Bidder-Specific Merger Momentum group, (see discussion in methodology section). The
inclusion of the CAAR, as a control variable, offers another test for the long-run reversal hypothesis,
while the other three variables consider the number and type of acquisitions made by the bidding
firms in the post-announcement period.
Despite the coefficient on the CAAR being insignificant, the coefficient on the trailing 12-month
average CAAR, the variable used as a proxy for merger momentum, is negative and statistically
significant at 5% significance level. This suggests that firms that announced an acquisition in a hot
merger market have, in the post-announcement period, a downward drift on their stock prices.
Also, the coefficient on the other variable used to analyse the intensity of merger activity, the trailing
12-month number of acquisitions, is strongly negative at 1% significance level. Once again, this
evidence suggests that acquisitions announced during waves perform worse in the long-run than
acquisitions announced at other times.
14 The results are not reported for reasons of brevity. They are similar as those reported in table 4. 15 Number of M&As in the post-announcement period, number of M&As in the post-announcement with stock and number of M&As in the post-
announcement with public target.
Announcement returns and post-merger performance: evidence of M&A momentum in the European Union market
22|
In what concerns to the market momentum variable, there is no evidence of reversal. The
result is similar with that found in my regression of CAAR, but contrary to the finding of Rosen
(2006), who shows that an acquisition announced during a hot stock market performs worse than
one announced in a cold stock market, evidencing that the market participants are affected by the
investor’s optimism.
The coefficients on bidder specific merger momentum variables indicate evidence of
reversal at the firm level. The CAAR of the last announcement by the bidding firm is negative and
statistically significant at 5% significance level. The number of acquisitions in the previous three
years undertaken by the firm has also a negative and statistically significant impact at 1% level on
the post-announcement long-term returns.
Consistent with the literature, the coefficient on the number of acquisitions in the post-
announcement period is strongly positive and statistically significant at 1% significance level. This
indicates that firm that make additional acquisitions in the post-announcement have a higher buy-
and-hold abnormal return.
Some of the coefficients on the control variables are in line with the literature, such as the
return on assets of the bidding firm, the log of total assets as well as the dummy variable that
considers acquisitions of private target with stock financing.

Announcement returns and post-merger performance: evidence of M&A momentum in the European Union market
|23
Table 5- Regression results for the BHAR as dependent variable. This table shows the results using the buy-and-hold abnormal return (BHAR) as dependent variable. The BHAR is
defined as ∏ (1 + 𝑅𝑡) − ∏ (1 + 𝑅𝑚𝑎𝑟𝑘𝑒𝑡,𝑡)𝑇𝑡=1
𝑇𝑡=1 where 𝑅𝑡 is the daily return of the firms and 𝑅𝑚𝑎𝑟𝑘𝑒𝑡,𝑡 is daily
market index return. The post-announcement window stars three days after an announcement and ends up three years
after the announcement. Only the acquisitions with three year BHAR are included. All variables are defined in Appendix
A. Heteroskedasticity robust t-statistics with standard errors clustered at year and industry level are show in
parentheses. *, ** and *** indicate statistically significant at the 10%, 5% and 1% level, respectively.
Full Sample
Coefficient t-statistics CAAR 0.3668 (1.34) Merger momentum: Trailing 12-month average CAAR -5.5703 (-2.13)** Trailing 12-month number of acquisitions/1000 -0.7686 (-6.01)*** Market momentum: Trailing 12-month return on market 0.0829 (1.48) Bidder-specific merger momentum: CAAR of the last announcement by bidding firm -0.7357 (-2.01)** Dummy that is 1 if there was an acquisition in prior 3years 0.0126 (0.34) Number of acquisitions in the last 3years -0.0327 (-2.83)*** Number of M&As in the post-announcement period 0.0340 (3.51)*** Number of M&As in the post-announcement with stock -0.0146 (-0.16) Number of M&As in the post-announcement with public target 0.0235 (0.46) Bidder-specific stock momentum: Trailing 12-month BHAR on the bidder's stock -0.0020 (-0.64)
Control Variables: Private target -0.0161 (-0.33) Subsidiary target 0.0716 (1.33) Public target with stock -0.0059 (-0.05) Private target with stock -0.2651 (-2.36)** Subsidiary target with stock -0.1247 (-0.89) Log of total assets 0.0144 (2.59)*** Bidder ROA 1.0316 (4.03)*** Bidder book-to-market 0.0326 (1.33) Bidder sales growth -0.0021 (-0.16) Diversifying acquisition 0.0056 (0.22) Observations 2,879 Adjusted R-square 0.0098
Announcement returns and post-merger performance: evidence of M&A momentum in the European Union market
24|
5.2.1. Discussion
The BHAR regression results confirm the hypothesis 2, as there is evidence of reversal in
the long-run. The main measure of hot merger markets, the trailing 12-month average CAAR, is
positively correlated with the announcement returns but closely negative with the long-run return
of the bidding firms. In other words, there is evidence that acquirers are more likely to obtain higher
CAARs in period of hot merger markets but the higher abnormal announcement returns tend to
revert in the long-run, with acquirers exhibiting lower BHARs. The same arrangement is analysed
in the measure of merger waves (trailing 12-month number of acquisitions), showing that
acquisitions announced during waves are more likely to be worse, in the long-run, than those
announced at other times.
As the long-term performance exhibits a downward reverse pattern with respect to the
announcement returns, it is possible to infer that the market overreacted to the announcement of
the acquisition. Then, the results are in line with the hypothesis that merger momentum is caused
by excessive optimism from investors, putting aside the neoclassical hypothesis as it does not
predict a reversal effect in the long-run. However, this does not imply that acquisitions do not occur
as a consequence of shocks in economy, just that something else must be going as well. For
instance, it could be that the shocks result in overoptimsm from investors (Rosen, 2006).
Another result is worth observing. The CAAR regression results demonstrate a strongly
negative relationship between the bidder specific stock momentum and the market reaction to the
announcement of the acquisition, while in the BHAR regression, the coefficient on the trailing 12-
month BHAR is not statistically different from zero. As I have mentioned before, a non-positive
coefficient on this variable in the long-run may be an indication of Roll’s hypothesis. So, there is
some evidence that a portion of the gains is truncated due to bidder managerial hubris.

Announcement returns and post-merger performance: evidence of M&A momentum in the European Union market
|25
6. Robustness tests
In this section, I present some robustness tests for the main results of this study. First, I
delete from the analysis deals in which the acquirer announced two or more acquisitions within
eight days. This requirement avoids overlapping effects on the returns of the bidding firms across
different deals. Additionally, industry fixed effects16 are included in the regression to control the
differences on the returns across industries.
The table 6 presents the regression results for short-term announcement returns. The
findings uncovered in previous sections continue to hold. The coefficient on the merger momentum
variable is positive and statistically significant at 10% significance level. The number of acquisitions
in the prior 12-month, the measure of merger waves, has also a positive and statistically significant
coefficient. Although with a lower significance level, both the measures of merger activity continue
to be positively correlated with the market reaction to an acquisition announcement.
At the firm level, the coefficient used as a proxy for bidder merger momentum is positive
and (weakly) significant. So, with a lower significance level when compared to the values shown in
table 4, the CAAR of the bidder’s last acquisition continues to affect positively the initial market
reaction to an acquisition. Overall, the rest of the coefficients on the other variables remain similar
to the coefficients on the main CAAR regression.
16 Industry fixed effects are considered by including industries dummies based on 1-digitc SIC code.

Announcement returns and post-merger performance: evidence of M&A momentum in the European Union market
26|
Table 6- Regression results for the CAAR as dependent variable: robustness test This table shows the cumulative abnormal announcement returns (CAARs) of acquirers over the 2002 and 2012
period. The dependent variable, the CAAR, is calculated for the five days (-2; +2) surrounding the announcement day
(day 0) of the acquisition. Abnormal returns are computed using the market model approach. All variables are defined
in Appendix A. Heteroskedasticity robust t-statistics are show in parentheses. *, ** and *** indicate statistically
significant at the 10%, 5% and 1% level, respectively. Industry dummies are included in the regression but not shown
in the table.
Full Sample Coefficient t-statistics Merger momentum: Trailing 12-month average CAAR 0.3698 (1.85)* Trailing 12-month number of acquisitions/1000 0.0159 (1.67)* Market momentum: Trailing 12-month return on market -0.0015 (-0.34) Bidder-specific merger momentum: CAAR of the last announcement by bidding firm 0.0601 (1.70)* Dummy that is 1 if there was an acquisition in prior 3years -0.0047 (-1.65)* Number of acquisitions in the last 3years -0.0010 (-1.31) Bidder-specific stock momentum: Trailing 12-month BHAR on the bidder's stock -0.0022 (-4.21)*** Control variables: Private target 0.0207 (4.83)*** Subsidiary target 0.0228 (5.25)*** Public target with stock -0.0060 (-0.76) Private target with stock -0.0008 (-0.05) Subsidiary target with stock -0.0008 (-0.07) Log of total assets -0.0012 (-3.11)*** Bidder ROA -0.0367 (-1.90)* Bidder book-to-market -0.0000 (-0.09) Bidder sales growth 0.0001 (0.08) Diversifying acquisition -0.0001 (-0.06) Observations 2,832 Adjusted R-square 0.0753

Announcement returns and post-merger performance: evidence of M&A momentum in the European Union market
|27
Table 7 shows the same type of robustness check for the regression of BHAR. The
coefficient on the merger momentum variable, the trailing 12-month average CAAR, is negative
and still statistically significant. The conclusions are the same, that is, firms that announced an
acquisition in a hot merger market have a worse performance in the long-run, all else equal. Also,
the coefficient on the number of acquisitions in the prior 12-months is negative and strongly
significant, which provides some evidence that acquisitions announced during waves are worse
than those announced at other times.
Contrary to the result found in the main BHAR regression, there is no strong evidence of
reversal in regarding to the bidder specific merger momentum. The coefficient on the CAAR of the
bidder’s last announcement is not statistically different from zero. However, the coefficient on the
number of acquisitions in the prior three years undertaken by the firm is negative and statistically
significant at 1% level, which indicates that the number of previous acquisitions has a negative
impact in the BHAR of the bidding firm. The signals of the other coefficients are consistent with the
results found previously.
Overall, the results in both the short and long-run regressions are robust when I consider
the industry fixed effect and the exclusion of multiple acquisitions of the same bidding firms that
were announced very close together.

Announcement returns and post-merger performance: evidence of M&A momentum in the European Union market
28|
Table 7- Regression results for the BHAR as dependent variable: robustness test This table shows the results using the buy-and-hold abnormal return (BHAR) as dependent variable. The BHAR is
defined as ∏ (1 + 𝑅𝑡) − ∏ (1 + 𝑅𝑚𝑎𝑟𝑘𝑒𝑡,𝑡)𝑇𝑡=1
𝑇𝑡=1 where 𝑅𝑡 is the daily return of the firms and 𝑅𝑚𝑎𝑟𝑘𝑒𝑡,𝑡 is daily
market index return. The post-announcement window stars three days after an announcement and ends up three years
after the announcement. Only the acquisitions with three year BHAR are included. All variables are defined in Appendix
A. Heteroskedasticity robust t-statistics are show in parentheses. *, ** and *** indicate statistically significant at the
10%, 5% and 1% level, respectively. Industry dummies are included in the regression but not shown in the table.
Full Sample
Coefficient t-statistics CAAR 0.4205 (1.50) Merger momentum: Trailing 12-month average CAAR -4.7259 (-1.96)* Trailing 12-month number of acquisitions/1000 -0.7464 (-7.01)*** Market momentum: Trailing 12-month return on market 0.0829 (1.42) Bidder-specific merger momentum: CAAR of the last announcement by bidding firm -0.6166 (-1.64) Dummy that is 1 if there was an acquisition in prior 3years 0.0126 (0.36) Number of acquisitions in the last 3years -0.0352 (-3.89)*** Number of M&As in the post-announcement period 0.0435 (5.00)*** Number of M&As in the post-announcement with stock -0.0141 (-0.15) Number of M&As in the post-announcement with public target 0.0131 (0.24) Bidder-specific stock momentum: Trailing 12-month BHAR on the bidder's stock -0.0023 (-0.74) Control variables: Private target -0.0179 (-0.34) Subsidiary target 0.0789 (1.49) Public target with stock 0.0152 (0.15) Private target with stock -0.2559 (-2.30)** Subsidiary target with stock -0.0969 (-0.68) Log of total assets 0.0149 (2.93)*** Bidder ROA 0.9520 (4.80)*** Bidder book-to-market 0.0008 (0.62) Bidder sales growth 0.0006 (0.05) Diversifying acquisition -0.0138 (-0.52) Observations 2,832 Adjusted R-square 0.0502

Announcement returns and post-merger performance: evidence of M&A momentum in the European Union market
|29
7. Additional analysis: Acquirers from the UK vs non UK
From Table 2 it is possible to observe that approximately 46% of the total number of
acquisition announcements occurred in the United Kingdom (UK). Given the important role that
the UK acquisitions have in my sample, I divide it into UK and non-UK acquisitions17. Then, I
compute the variables used in the model taking into consideration this division and run the previous
regressions of CAAR and BHAR. The aim is to analyse the differences in terms of momentum effect,
between the UK and non-UK acquisitions. In order to do this, I test the following hypothesis:
H3: The reversal in the announcement returns is higher for the Non-UK acquisitions when
compared to the UK acquisitions.
This hypothesis is formulated considering the UK market specific characteristics. The UK
is considered a more developed and efficient market, with a more stringent regulation and with a
stronger investor protection when compared to the rest of the EU countries. Additionally, the less
concentrated ownership structure in the UK market may also avoid blockholders using their voting
power to expropriate private benefits from acquisitions (Faccio and Lang, 2002; Bae, Kang, and
Kim 2002). This highly regulated and transparent market may avoid investors to fall in optimism
at the acquisition announcement and allows them to have a more correct analysis of the benefits
that the acquisition involves. Thus, the reversal effect may be more evident in the EU firms.
Hypothesis 3 is tested by the inclusion of an additional independent variable in the CAAR
and BHAR regressions, which is the interaction term between an indicator variable that equals one
if acquisitions are undertaken by a non-UK firm and the trailing 12-month average CAAR variable
(the measure of merger momentum).
Table 8 shows the long-run regression results with the new interaction term variable (Non-
UK × Trailing 12month average CAAR). The CAAR regression (not reported for reasons of brevity)
shows that the coefficient on the new variable is not statistically different from zero. However, the
coefficient on the interaction term is strongly negative and statistically significant at 5% significance
level in the BHAR regression. The results suggest that the non-UK acquisitions have a reversal
effect in announcement returns when compared to UK acquisitions, which confirms the previous
hypothesis.
17 The non-UK acquisitions incorporate all acquisitions undertaken by firms from the others 20 countries that compose my sample.
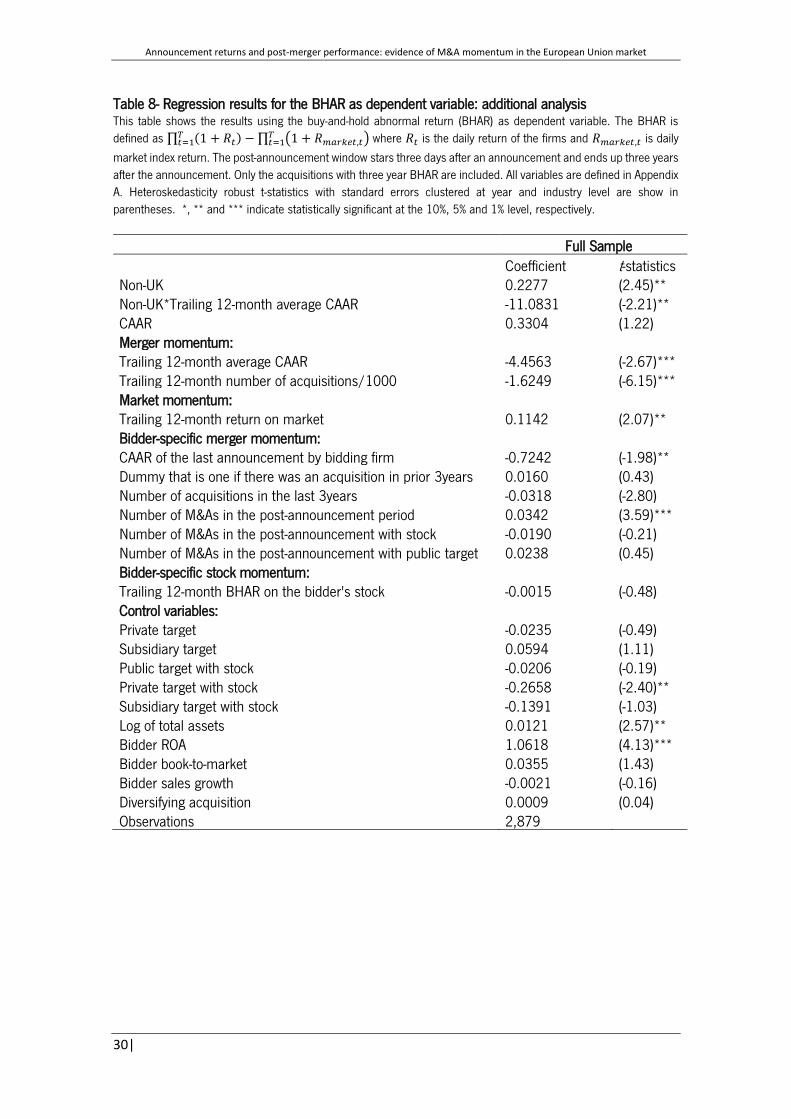
Announcement returns and post-merger performance: evidence of M&A momentum in the European Union market
30|
Table 8- Regression results for the BHAR as dependent variable: additional analysis This table shows the results using the buy-and-hold abnormal return (BHAR) as dependent variable. The BHAR is
defined as ∏ (1 + 𝑅𝑡) − ∏ (1 + 𝑅𝑚𝑎𝑟𝑘𝑒𝑡,𝑡)𝑇𝑡=1
𝑇𝑡=1 where 𝑅𝑡 is the daily return of the firms and 𝑅𝑚𝑎𝑟𝑘𝑒𝑡,𝑡 is daily
market index return. The post-announcement window stars three days after an announcement and ends up three years
after the announcement. Only the acquisitions with three year BHAR are included. All variables are defined in Appendix
A. Heteroskedasticity robust t-statistics with standard errors clustered at year and industry level are show in
parentheses. *, ** and *** indicate statistically significant at the 10%, 5% and 1% level, respectively.
Full Sample Coefficient t-statistics
Non-UK 0.2277 (2.45)** Non-UK*Trailing 12-month average CAAR -11.0831 (-2.21)** CAAR 0.3304 (1.22) Merger momentum: Trailing 12-month average CAAR -4.4563 (-2.67)*** Trailing 12-month number of acquisitions/1000 -1.6249 (-6.15)*** Market momentum: Trailing 12-month return on market 0.1142 (2.07)** Bidder-specific merger momentum: CAAR of the last announcement by bidding firm -0.7242 (-1.98)** Dummy that is one if there was an acquisition in prior 3years 0.0160 (0.43) Number of acquisitions in the last 3years -0.0318 (-2.80) Number of M&As in the post-announcement period 0.0342 (3.59)*** Number of M&As in the post-announcement with stock -0.0190 (-0.21) Number of M&As in the post-announcement with public target 0.0238 (0.45) Bidder-specific stock momentum: Trailing 12-month BHAR on the bidder's stock -0.0015 (-0.48) Control variables: Private target -0.0235 (-0.49) Subsidiary target 0.0594 (1.11) Public target with stock -0.0206 (-0.19) Private target with stock -0.2658 (-2.40)** Subsidiary target with stock -0.1391 (-1.03) Log of total assets 0.0121 (2.57)** Bidder ROA 1.0618 (4.13)*** Bidder book-to-market 0.0355 (1.43) Bidder sales growth -0.0021 (-0.16) Diversifying acquisition 0.0009 (0.04) Observations 2,879
Announcement returns and post-merger performance: evidence of M&A momentum in the European Union market
|31
8. Conclusion
This study examines the existence of a momentum effect in M&As that took place in the
European Union, in periods of merger waves or hot M&A markets. Consistent with the literature,
the presence of this phenomenon was analysed by comparing the short-term announcement
returns, which were measured by the CAARs of the bidding firms, to the long-term performance
post M&A, estimated using BHAR methodology.
I find evidence of merger momentum, that is, the market reaction to an acquisition
announcement is positively associated with the previous conditions of merger markets. In other
words, acquirers are more likely to obtain higher CAARs in period of hot merger markets (i.e., when
previous recent acquirers have also earned higher announcement returns). Although, the results
for the long-term performance post M&As indicate that, all else held equal, the initial market
reaction to an acquisition announcement is reversed over the next 3 years (i.e., the higher abnormal
announcement returns tend to revert in the long-run, with acquirers exhibiting negative BHARs.
This suggests that firms that announced an acquisition in a hot merger market have, in the long-
run, a downward reverse pattern in their stock prices. These findings hold after several robustness
tests, including industry fixed effects and elimination of consecutive acquisitions by the same
acquirer that occur in a small time window.
The results of my study seem to support the hypothesis that merger momentum is mainly
caused by the excessive optimism from investors. In the presence of hot merger markets, investors
tend to misperceive the synergy gains from the acquisitions, which leads to autocorrelation in the
announcement returns of the bidding firms. However, as the time passes, the market recognizes
through results that acquisitions initiated in hot markets were not prudently evaluated, leading to
negative BHARs. Despite the neoclassical theory may justify the positive autocorrelation in
announcement returns, it does not predict the reversal pattern that I find in the long-run. However,
this does not suggest that acquisitions do not happen as a consequence of shocks in economy but
that something else may be going as well. For instance, the combination of the excessive optimism
from investor with the occurrence of shocks in economy may be an appropriate explanation for the
evidence of momentum effect.
On the other hand, managerial motivations may operate in additional to the over-optimism
hypothesis if managers receive compensations for short-term performance. The rewards give an
incentive to make bad acquisitions since even a bad acquisition, in the presence of a hot merger

Announcement returns and post-merger performance: evidence of M&A momentum in the European Union market
32|
market, may increase the bidder’s stock price temporarily. This could explain both the positive
market reaction to M&A announcements in a bull market and the negative long-run performance
of M&A.
There are also some evidence of managerial inefficiency. I find a no positive relationship
between the bidder specific stock momentum and the market reaction to the M&A announcement
in both short and long-run. This negative relation is consistent with the hypothesis postulated by
Roll, 1986. So, I may infer that a portion of the gains in the short-run is truncated due to bidder
managerial hubris.
Finally, I find that the evidence of reversal in announcement returns is higher for
acquisitions undertaken by non-UK firms when compared to acquisitions that occurred in the UK
firms.
Announcement returns and post-merger performance: evidence of M&A momentum in the European Union market
|33
References
Agrawal, A., Jaffe, J. F., & Mandelker, G. N. (1992). The post‐merger performance of acquiring
firms: a re-examination of an anomaly. The Journal of Finance, 47(4), 1605-1621.
Agrawal, A., & Jaffe, J. F. (2000). Post-merger performance puzzle. In Cooper, C., Gregory, A.
(eds.). Advances in mergers and acquisitions. New York: JAI, Elsevier Science, 7-41
Andrade, G., Mitchell, M. L., & Stafford, E. (2001). New evidence and perspectives on mergers.
Journal of Economic Perspectives, 15(2), 103-120.
Asquith, P., Bruner, R. F., & Mullins, D. W. (1983). The gains to bidding firms from merger. Journal
of Financial Economics, 11(1), 121-139.
Bae, K. H., Kang, J. K., & Kim, J. M. (2002). Tunneling or value added? Evidence from mergers by
Korean business groups. The Journal of Finance, 57(6), 2695-2740.
Baker, R. D., & Limmack, R. J. (2001). UK takeovers and acquiring company wealth changes: The
impact of survivorship and other potential selection biases on post-outcome performance. Working
paper, University of Stirling.
Brealey, R. A., Cooper, I. A., & Kaplanis, E. (2010). Excess comovement in international equity
markets: Evidence from cross-border mergers. Review of Financial Studies, 23(4), 1718-1740.
Brealey, R. A., Myers, S. C., & Allen, F. (2011). Principles of corporate finance (10th ed.). New York:
McGraw-Hill Irwin.
Brown, S. J., & Warner, J. B. (1985). Using daily stock returns: The case of event studies. Journal
of Financial Economics, 14(1), 3-31.
Bruner, R. F. (2004). Applied mergers and acquisitions. Hoboken, New Jersey: John Wiley & Sons.
Dong, M., Hirshleifer, D., Richardson, S., & Teoh, S. H. (2006). Does investor misvaluation drive
the takeover market?. The Journal of Finance, 61(2), 725-762.
Faccio, M., & Lang, L. H. (2002). The ultimate ownership of Western European
corporations. Journal of Financial Economics, 65(3), 365-395.
Fama, E. F. (1998). Market efficiency, long-term returns, and behavioral finance. Journal of
Financial Economics, 49(3), 283-306.

Announcement returns and post-merger performance: evidence of M&A momentum in the European Union market
34|
Fuller, K., Netter, J., & Stegemoller, M. (2002). What do returns to acquiring firms tell us? Evidence
from firms that make many acquisitions. The Journal of Finance, 57(4), 1763-1793.
Gaughan, P. A. (2005). Mergers: what can go wrong and how to prevent it. Hoboken: John Wiley
& Sons.
Gorton, G., Kahl, M., & Rosen, R. (2005). Eat or be eaten: A theory of mergers and merger waves.
Working paper, National Bureau of Economic Research.
Gregory, A. (1997). An examination of the long run performance of UK acquiring firms. Journal of
Business Finance & Accounting, 24(7‐8), 971-1002.
Harris, R. S., Franks, J., & Mayer, C. (1987). Means of Payment in Takeovers: Results for the UK
and US. Working paper, National Bureau of Economic Research.
Higson, C., & Elliott, J. (1998). Post-takeover returns: The UK evidence. Journal of Empirical
Finance, 5(1), 27-46.
Jovanovic, B., & Rousseau, P. L. (2001). Mergers and technological change: 1885-1998. Working
paper, University of Vanderbilt.
Kothari, S. P., & Warner, J. B. (1997). Measuring long-horizon security price performance. Journal
of Financial Economics, 43(3), 301-339.
Lang, L. H., Stulz, R., & Walkling, R. A. (1989). Managerial performance, Tobin's Q, and the gains
from successful tender offers. Journal of Financial Economics, 24(1), 137-154.
Ljungqvist, A., Nanda, V., & Singh, R. (2006). Hot markets, investor sentiment, and IPO pricing*.
The Journal of Business, 79(4), 1667-1702.
Loderer, C., & Martin, K. (1997). Executive stock ownership and performance tracking faint
traces. Journal of Financial Economics, 45(2), 223-255.
Loughran, T., & Ritter, J. R. (1995). The new issues puzzle. The Journal of Finance, 50(1), 23-51.
Loughran, T., & Vijh, A. M. (1997). Do long‐term shareholders benefit from corporate acquisitions?.
The Journal of Finance, 52(5), 1765-1790.
Lyon, J. D., Barber, B. M., & Tsai, C. L. (1999). Improved methods for tests of long‐run abnormal
stock returns. The Journal of Finance, 54(1), 165-201.

Announcement returns and post-merger performance: evidence of M&A momentum in the European Union market
|35
Mallikarjunappa, T., & Nayak, P. (2007). Why do mergers and acquisitions quite often fail?. AIMS
International Journal of Management, 1(1), 53-69.
Maquieira, C. P., Megginson, W. L., & Nail, L. (1998). Wealth creation versus wealth redistributions
in pure stock-for-stock mergers. Journal of Financial Economics, 48(1), 3-33.
Mitchell, M. L., & Mulherin, J. H. (1996). The impact of industry shocks on takeover and
restructuring activity. Journal of Financial Economics, 41(2), 193-229.
Mitchell, M. L., & Stafford, E. (2000). Managerial decisions and long‐term stock price
performance*. The Journal of Business, 73(3), 287-329.
Morck, R., Shleifer, A., & Vishny, R. W. (1990). Do managerial objectives drive bad acquisitions?.
The Journal of Finance, 45(1), 31-48.
Nelson, R. L. (1959). Merger movements in American industry. Princeton: Princeton University
Press.
Rhodes–Kropf, M., Robinson, D. T., & Viswanathan, S. (2005). Valuation waves and merger activity:
The empirical evidence. Journal of Financial Economics, 77(3), 561-603.
Roll, R. (1986). The hubris hypothesis of corporate takeovers. Journal of Business, 59(2), 197-
216.
Rosen, R. J. (2006). Merger momentum and investor sentiment: The stock market reaction to
merger announcements*. The Journal of Business, 79(2), 987-1017.
Servaes, H. (1991). Tobin's Q and the gains from takeovers. The Journal of Finance, 46(1), 409-
419.
Shughart, W. F., & Tollison, R. D. (1984). The random character of merger activity. The Rand
Journal of Economics, 15(4), 500-509.
Sudarsanam, S. (2003). Creating value from mergers and acquisitions: The challenges: An
integrated and international perspective. Pearson Education.
Thomas, H. M., & Coakley, J. (2004). Hot markets, momentum and investor sentiment in UK
Acquisitions. Working paper, University of Essex.

Announcement returns and post-merger performance: evidence of M&A momentum in the European Union market
36|
Travlos, N. G. (1987). Corporate takeover bids, methods of payment, and bidding firms' stock
returns. The Journal of Finance, 42(4), 943-963.
Weston, J. F., Mitchell, M. L., & Mulherin, J. H. (2013). Takeovers, restructuring, and corporate
governance (4th ed.). New Delhi: Pearson Education.

Announcement returns and post-merger performance: evidence of M&A momentum in the European Union market
|37
Appendix A - List of variables
Book-to-market: Book value of equity (WC03501) in the year prior to the acquisition
announcement divided by market value of equity (MV) for the same year. Source:
WorldScope and Datastream.
CAAR of the last announcement by bidding firm: five-day cumulative abnormal
announcement return (CAAR) of the last acquisition taken by the bidder if it make an
acquisition announcement in the prior 3 years. Otherwise, it is zero.
Diversifying acquisition: dummy variable that equals to one if the acquisition is diversified
(the acquirer’s industry two-digit SIC code differs from that of the target’s).
Dummy variable that is one if there was an acquisition made by the bidder in prior 3 years
and zero otherwise.
Log of total assets: logarithm of the total assets (WC02999) of the bidder firm in year of
the acquisition announcement. Source: WorldScope.
NonUK: an indicator variable that equals one if acquisitions are undertaken by a non-UK
firm.
Number of acquisitions in the last 3years: number of M&As taken by the bidder firm in the
three years prior to the announcement.
Number of acquisitions in the post-announcement period: number of M&As taken by
the bidder firm during the post-announcement three-year period.
Number of acquisitions in the post-announcement with stock: number of M&As taken
by the bidder firm during the post-announcement three-year period with 100% stock
financing.
Number of acquisitions in the post-announcement with public target: number of M&As
taken by the bidder firm during the post-announcement three-year period in which the
target is public.
Private target: dummy variable that equals one if the target firm is private and zero
otherwise.
Private target with stock: dummy variable that equals one if the target firm is private and
the method of payment for the acquisition is 100% stock.
Public target with stock: dummy variable that equals one if the target firm is public and
the method payment for the acquisition is 100% stock.

Announcement returns and post-merger performance: evidence of M&A momentum in the European Union market
38|
ROA: Return on assets. EBITA (WC18198) in the year prior the acquisition announcement
divided by the total assets (WC02999) at the end of that year. Source: WorldScope.
Sales growth: percent change in net sales from the year before to the year of the
announcement. Source: WorldScope.
Subsidiary target: dummy variable that equals one if the target firm is subsidiary and zero
otherwise.
Subsidiary target with stock: dummy variable that equals one if the target firm is subsidiary
and the method payment for the acquisition is 100% stock.
Trailing 12-month average CAAR: average cumulative abnormal announcement returns
(CAARs) for all the acquisitions in the 12-month prior 5 days before an acquisition
announcement.
Trailing 12-month BHAR on the bidder's stock: average buy-and-hold abnormal return for
all the acquisitions in 12-month ending 5 days before an announcement.
Trailing 12-month number of acquisitions: number of M&As in the 12-month prior to a
current acquisition announcement.
Trailing 12-month return on market: Average return of the market index in the year
ending 5 days prior to an announcement.