industry–research co-operation within and across regional ... · to davide antonioli, sections...
TRANSCRIPT

Industry–research co-operation within and across regionalboundaries. What does innovation policy add?*
Alberto Marzucchi1, Davide Antonioli2, Sandro Montresor3
1 Department of International Economics, Institutions and Development, Catholic University of Milan, Italy;INGENIO (CSIC-UPV) Universitat Politècnica de València, Spain (email: [email protected])
2 Department of Economics and Management, University of Ferrara, Italy (email: [email protected])3 JRC-IPTS, European Commission, Seville, Spain; Department of Economics, University of Bologna, Italy
(email: [email protected])
Received: 30 March 2013 / Accepted: 6 September 2013
Abstract. The paper aims to show how regional policy-makers can stimulate firms’ co-operationwith research organizations by granting an R&D subsidy. Using an original dataset for the Italianregion of Emilia-Romagna, propensity score matching is first applied to identify the impact of thesubsidy received.Ageneralized propensity score technique is then employed to investigate the effectof an increasing amount of support. The firm’s co-operation is policy sensitive. The award of asubsidy to regional firms affects their intra-regional more than their extra-regional co-operation. Thepropensity toward the latter appears subject to a monetary effect and is influenced by the amount ofpublic funding received providing the subsidy overcomes a minimum threshold.
JEL classification: O32, O38, R11, R58
Key words: Industry-research co-operation, regional innovation systems, behaviouraladditionality
1 Introduction
Research co-operation is a core issue in both scientific debate and policy agenda. It has been apillar of the ‘system approach’ to innovation (Edquist 2000) in the last decade. More recently,
* The authors gratefully acknowledge Paolo Pini, for having made available the Emilia-Romagna dataset, andSilvano Bertini, for his support in gathering data. The financial support of Emilia-Romagna region for the survey is alsoacknowledged. Previous versions of this paper have been presented at the 2011 EAEPE Conference (Vienna, Austria),the INGENIO (CSIC-UPV) 2011 Seminar Series (Valencia, Spain), the 2012 ENEF Meeting (Bologna, Italy), the 2012SPRU Friday Seminar Series (Brighton, UK), the 53rd Annual Meeting of the Association of Italian Economists,University of Basilicata (Matera, Italy), the 2012 International Conference on ‘The Governance of a Complex World’of CNRS-GREDEG (Nice, France) and the 2013 Seminar Series of the Department of Economics, University ofBologna (Italy). The authors thank the participants of these events, and three anonymous referees for the comments andsuggestions. Although the paper is the result of the joint effort of the three authors, Sections 3, 3.1 and 5 can be attributedto Davide Antonioli, Sections 3.2, 3.3 and 4 to Alberto Marzucchi, Sections 1 and 2 to Sandro Montresor. The viewsexpressed are purely those of the authors and may not in any circumstances be regarded as stating an official positionof the European Commission. The usual caveats apply.
doi:10.1111/pirs.12079
© 2013 The Author(s). Papers in Regional Science © 2013 RSAI
Papers in Regional Science, Volume 94 Number 3 August 2015.

it has stimulated the debate on the so-called ‘open innovation’ mode (Chesbrough et al. 2006)and the policy-shift in Europe, from the role of ‘knowledge stocks’ to that of ‘knowledge flows’toward obtaining a ‘smart’ form of growth.
Co-operating with research organizations – that is, universities and research institutes (ingeneral and those which are public in particular) – is important for industrial innovation.Through this type of co-operation, firms are able to access new knowledge from the world ofscience and share the costs and risks of their research projects.1
The role of industry-research co-operation has been widely recognized at the regional level.Within regional boundaries, it contributes to shaping the ‘knowledge base’ and the technologicalprofile of the regional innovation system (RIS) (Cooke et al. 1997). Across regional boundaries,innovation co-operation allows regions to open up to new knowledge sources, enter into broader(possibly global) innovation networks, and upgrade their competencies (Hassink 2005).
In spite of their relevance, the results obtained by regional studies on this issue still fall shortof translating into policy actions (some exceptions are, among others, Hassink 2002; Tödtlingand Trippl 2005) and policy evaluations (Mouqué 2012). It is hard to disentangle what innova-tion policy actually ‘adds’ to the collaborations that firms would have established in its absence,in searching for a competitive advantage, for example. Non-standard econometric techniques arerequired. These, however, have been mainly applied to assess the impact of policy on firms’innovation inputs (e.g., R&D expenditure) and outputs (e.g., patents) (Georghiou 2004).
We try to fill the gap by investigating whether, and to what extent, the research co-operationactivities of a RIS are affected by regional innovation policy. In particular, we disentangle theimpact of policy on industry-research co-operation taking place within and across the regionalboundaries. Drawing on regional studies on the role of proximity for research co-operation, andcrossing them with innovation studies, we discuss the obstacles to such co-operation whichregional policy-makers should address. The outcome of public intervention is then analysed bylooking at a regional R&D subsidy, which includes industry-research co-operation among itsobjectives, but leaves recipient firms free from having to use the funding to actually engage inthis kind of co-operation. Firms’ co-operation with universities and research institutes is dealtwith as an element in the ‘behavioural additionality’ of the policy (Buisseret et al. 1995). Inbrief, the term ‘additional’ refers to the observation of something that would not have occurredin the absence of the policy (innovation policy, in our case). Depending on the kind of observedphenomena, the literature distinguishes different types of additionality: input additionality (thepolicy impact on R&D), output additionality (the innovative output induced by the policy) and,as in our case, behavioural additionality (changes in firms’ behaviour due to policy) (Antonioliand Marzucchi 2012).
We apply our arguments to the empirical investigation of a region in Italy (Emilia-Romagna(ER)). We use an original, firm-level dataset, which contains information on policy funding,pre-policy characteristics and post-policy behaviours and performances. A set of propensityscore matching techniques is first applied. The effect that an increase in the amount of subsidyhas on the geographical extent of firms’ co-operation with research partners is then investigated,by applying the generalized propensity score technique (Hirano and Imbens 2004). This is animportant value added with respect to the existent literature.
1 Following the existent literature, research co-operation can be generally considered as a co-ordination mechanismbetween partners in the production of new knowledge, whose characteristics are in-between those of a ‘spot-market’exchange and complete hierarchical control (Fritsch and Lukas 1999). More precise definitions depend on the specificinvestigation, such as the one we use in our analysis and report in subsection 3.3. In addition to that carried out withresearch organizations, co-operation among firms also has important functions and has attracted a lot of attention (e.g.,Hagedoorn 1993, 2002), however, the aspect is out of this paper’s scope.
A. Marzucchi et al.500
Papers in Regional Science, Volume 94 Number 3 August 2015.

The paper is organized as follows: In Section 2, the background literature pertinent to thepaper is reviewed. The characteristics of our empirical application are presented in Section 3.Section 4 provides a discussion of the results. Section 5 concludes.
2 Literature review
Co-operation between firms and research organizations is one of the channels through whichscience is linked to technology and leads to industrial innovation (Mansfield 1991, 1995;Mansfield and Lee 1996). Through it, firms access new upstream knowledge, benefit fromresearch spillovers and share the risks and costs of their innovative projects (Cassiman andVeugelers 2002). Furthermore, by crossing the boundaries of the business (social) system, firmsexchange formerly unrelated information and communication standards with the science(social) system and reinforce their innovativeness (Kaufmann and Tödtling 2001).
Given their important impact on innovation, relationships between firms and researchorganizations – both in the form of ‘engagement’ (e.g., collaborative and contract research,consulting, and informal knowledge transfer) and ‘commercialization’ (e.g., of academic patentsand entrepreneurial ideas) – have received a lot of attention in innovation studies (for a review,see Perkmann et al. 2013). A parallel interest in regional/urban studies and economic geographyhas attracted the ‘regionalization’ of industry-research co-operation and the regional concentra-tion of its effects (Fritsch and Schwirten 1999; Fritsch 2001; Ponds et al. 2007).
The basic idea is that these research collaborations are an important channel for bothunintended knowledge spillovers and deliberated forms of knowledge access (Massard andMehier 2009; D’Este et al. 2013), leading firms to superior innovation performances at the locallevel. However, the internal mechanisms through which industry-research co-operation works atthe local level are not completely recognized yet. In particular, further investigation is requireddue to the effects of the manifold distance that separates firms and research organizations(Boschma 2005) – that is, geographical, institutional, cognitive, and social – and due to thepossibility that the partners’ proximity in one of these dimensions could compensate for theirdistance in another. This analysis is essential to better understanding the barriers to industry-research co-operation and to evaluating the policy interventions that could mitigate such barriers.
First of all, regarding knowledge production and intellectual property, firms and researchorganizations have different objectives and incentive structures, as they belong to different‘social systems’ (Kaufmann and Tödtling 2001; Ponds et al. 2007; Valentin and Jensen 2007).When compared to inter-firm collaborations, ceteris paribus, industry-research co-operation ischaracterized by a lower institutional proximity (Boschma 2005). On the one hand, this distancecan bring about novelty and variety in both firms’ internal routines and external interfaces, andfavour the occurrence of even more radical forms of innovation (Kaufmann and Tödtling 2001).On the other hand, however, if it becomes excessive, and/or if it is not compensated by otherproximities, this kind of distance could prevent effective co-operation. In this latter case, theaccess to the world of science could entail substantial implicit and explicit co-ordinationcosts to business (e.g., for firms to set up ad hoc communication procedures), which a policyintervention could contribute to alleviating.
Industry-research co-operation can be similarly affected by low levels of cognitive proximitybetween partners, given the distance separating their specialized knowledge bases (Nesta andSaviotti 2005). A low cognitive proximity can spur novel solutions and help firms to access otherfirms’ knowledge, to ‘simply’ combine it with their internal one (Balconi et al. 2012). However,in the case of firms that interact with research organizations for the sake of active mutuallearning, this distance is not necessarily an advantage. While it is an input for the exploration ofnew knowledge, the co-operation with cognitively distant research organizations poses higher
Research co-operation within and across regions 501
Papers in Regional Science, Volume 94 Number 3 August 2015.
exploitation costs to firms (Nooteboom 2000) (i.e., in terms of processing, understanding andabsorbing external knowledge), which a policy intervention could also alleviate. All in all, anexcessively low level of both institutional and cognitive proximity between the partners coulddetermine relevant costs for an effective industry-research co-operation. As these costs couldaffect innovative outcome, this kind of co-operation requires a policy intervention. For example,a regional R&D subsidy, especially if it includes industry-research co-operation among theactivities eligible for public funding, could serve the case and have a significant ‘additional’impact on the relative behaviours.
At the regional level, the previously listed kinds of proximity interact with an additional two,on which ‘innovation geography’ has come to focus (Breschi and Lissoni 2001): geographicaland social proximity. Their interplay enriches the analysis of the barriers to researchco-operation and poses further testable implications, on which we will focus in our empiricalapplication.
At the outset, the collaboration between firms and research organizations entailsbi-directional/reciprocal information exchanges. It thus requires intense codification andde-codification efforts concerning tacit and explicit knowledge, respectively, for which face-to-face contact is crucial. In brief, industry-research co-operation in principle benefits from geo-graphical (or spatial) proximity (Ponds et al. 2007; D’Este and Iammarino 2010). On the otherhand, whether geographical proximity helps per se, or rather if it is moderated and comple-mented by the social proximity between the partners has recently been questioned (Breschi andLissoni 2006). In local systems of production/innovation, and industrial clusters in particular,short physical distances among firms and research organizations combine with their belongingto social networks of interpersonal ties which support their co-operation as they are ‘acquainted’with each other and rely on their respective reputations (Granovetter 1985). Quite interestingly,when this social proximity is separately disentangled from geographical proximity, it appears tohave a relatively higher impact on research collaborations (Autant-Bernard et al. 2007;Maggioni et al. 2007; D’Este et al. 2013).
The previous arguments have important implications for a firm’s decision to co-operate withextra-regional research partners. Crossing the regional boundaries entails a general decrease infirms’ proximities to research organizations. Co-operation costs can thus be expected to behigher for extra-regional interactions than for intra-regional ones. The extent to which thisactually occurs and the actual wedge between intra and extra-regional co-operation costs is, ofcourse, region-specific.2 However, irrespective of these specificities, and of the different needsof extra-regional co-operation that the regional knowledge base poses to firms, some generalpatterns can be expected to occur.
First of all, the geographical distance in general increases, though the weight of shorter-distance, cross-border interactions should be controlled. The opportunity cost of access toknowledge (Andersson and Ejermo 2004) increases, as does the average time-distance cost ofaccess to research. More in general, personal interaction and tacit knowledge diffusion becomemore difficult also in terms of unintended knowledge spillovers (Boschma 2005, p. 69).
Extra-regional co-operation is also likely to entail an increased social distance between thepartners. This is particularly the case for regions that are marked by idiosyncratic socio-economic networks, such as those of Emilia-Romagna, the Italian region we are going toinvestigate in our empirical application (see Section 3). In this case, firms and research organi-zations, along with other social actors, are part of region-specific forms of territorial organiza-
2 For example, the diffusion of ICT infrastructures – broadband technologies for internet access, or social media forpractitioners’ communities – could help regional firms rely less on face-to-face interactions with extra-regional partnerswhen this is convenient. Similarly, firms and research organizations could be part of different RISs, whose productionand knowledge bases are marked by a related (rather than unrelated) kind of variety (Frenken et al. 2007), rendering theircognitive distance less costly to overcome.
A. Marzucchi et al.502
Papers in Regional Science, Volume 94 Number 3 August 2015.

tion – the so-called, industrial district-based, Emilian model (Brusco 1982) – whose advantagesare lost in leaving the ‘local buzz’ to enter into the ‘global pipeline’ (Massard and Mehier 2009).Although this could be a source of industrial renewal for local firms – as we will later discuss– it comes with an increase in co-ordination and social communication costs.
The cognitive distance between the co-operating partners also experiences an increase whenthe partners are in different regions. In this case partners do not share the same regionalknowledge base, which has accumulated over time through regional firms’ investments in tech-nological and production activities; the adoption of region-specific ‘innovation modes’ (Asheim2012; Asheim and Coenen 2005, 2006); and the regional co-evolution of economic, technologi-cal and institutional forces (Boschma and Frenken 2006; Uyarra 2010). The region of Emilia-Romagna, for example, has been developing a RIS whose techno-economic specializationand research-knowledge base has been revealed as different, even from other RISs inItaly (Evangelista et al. 2002). As we will also state below, tapping into RISs (or learningregions) with different specialization patterns could make the region more innovative. However,being embedded in a ‘unique’ innovation and specialization milieu, regional firms are requiredto make additional investments (e.g., in R&D and training) in order to access the knowledge ofextra-regional research organizations. This phenomenon becomes truer the more cognitivelydistant the regions where the partners are located (e.g., backward vs. frontier regions).
Finally, the different ways in which the governance structures of different RISs regulateand/or assist industry-research co-operation (Cooke 2001) could pose additional administrationcosts to the regional firms spanning the regional boundaries of their interactions and setting themto work in different institutional set-ups. Institutional proximity also decreases to a greaterextent when extra-regional co-operation is also international and could entail ‘liability offoreignness’ issues (Zaheer 1995; Tallman and Phene 2007).
All in all, we can say that crossing the regional borders with co-operation implies a sharpdecrease (a sort of negative ‘shift’) in the level of proximity between regional firms and theirpartners. In turn, this is expected to generate a ‘discontinuity’ in the variation of co-operationcosts from regional to extra-regional collaborations.3 This consideration leads us to a firsttestable implication. In the absence of alternative incentives (e.g., larger funding for extra-regional over intra-regional co-operation), firms would react to an R&D subsidy (supportingtheir co-operation, in general) by increasing more their propensity for co-operation withregional, than with extra-regional research organizations. For the aforementioned reasons, sucha subsidy can be expected to make regional co-operation more readily economic viable andsuccessful. Following a ‘behavioural additionality’ perspective, the simple administration of anR&D subsidy (regardless of the amount of support) can be expected to make funded firms moreprone to interact with regional research organizations than with extra-regional ones, whencompared to ‘non-treated’ firms.
A second testable implication concerning extra-regional collaborations follows from theflipside of the proximity argument. As we anticipated in all the previous respects, both theinterplay of regional proximities and the regional behavioural additionality of subsidy-administration could make the region a ‘sticky place’ (Markusen 1996) for firms that are willingto co-operate with research partners. Regional firms could lose sight of the different (andpossibly new) market and technological opportunities generated by more distant partners inother regions and/or in other countries (e.g., D’Este and Iammarino 2010). The regional knowl-edge base, which has possibly been useful in the past, could become obsolete with respect to theouter environment (Lambooy and Boschma 2001) and a potential source of ‘lock-in’ for the RIS(Giuliani 2005; Hassink 2005).
3 Our dataset enables us to capture this aspect of proximity by distinguishing co-operation within and across theregional boundaries in a dichotomic way.
Research co-operation within and across regions 503
Papers in Regional Science, Volume 94 Number 3 August 2015.

For these reasons, supporting extra-regional co-operation with research organizations –both within and outside national boundaries – becomes essential in order to overcome apotential ‘competence trap’, which could turn into an inefficient pattern of regional special-ization (for more on this issue, see the debate on the so-called ‘local buzz’ and ‘globalpipelines’; Bathelt et al. 2004; Moodysson 2008; Trippl et al. 2009). The creation or consoli-dation of ‘open regional innovation systems’ (Belussi et al. 2010), in which local firms openup to extra-regional partners, emerges as a policy priority in this last respect. Accordingly, apolicy of compensation to regional firms for the higher costs they will face becomes crucial.The amount of an R&D subsidy could play an important role. In other words, unlike the‘administration effect’, the ‘monetary effect’ of the subsidy (Broekel 2012) can extend thedegree of freedom that the recipient firm has in using it to increase engagement in extra-regional co-operation.
3 Empirical application
The empirical application we carry out refers to the north-eastern Italian region (NUTS 2 level)of Emilia-Romagna (ER). The region has a population of nearly 4.5 million people and accountsfor about 9 per cent of national GDP (our elaborations on ‘Istat – GeoDemo Statistics’, ‘Istat –Regional Economic Accounts’, and ‘Eurostat – Regional Statistics Database’).
As revealed by the ‘history’ of its comparative advantages (Vertova 2005; Brasili et al. 2011),its production structure – with specializations in traditional industries (e.g., ceramics), mediumhigh-tech sectors (e.g., mechanics and machinery) and high-tech sectors (e.g., biomedicaldevices and mechatronics) – is different from that of other regional partitions of the country and,though to a lesser extent, from that of the other north-eastern Italian regions. An interplaybetween economic activities and social relations is also typical of ER, and has been identified asthe ‘Emilian model’ (Brusco 1982). As is well-known, this has evolved into a RIS whoseindustrial structure is mainly made up of a set of different industrial districts, located in differentmunicipalities within the region (Cooke et al. 1997). Together with the institutional set-up andthe research sub-system of the region, these industrial districts have contributed to the successfulevolution of ER RIS.
In terms of innovation, together with Lombardy, ER is the only medium-high innovator inthe country (Antonioli et al. 2011; Hollanders et al. 2009), and is surrounded by only averageand medium-low innovators.4 When compared with the other European regions (consideringpublishing and patenting intensity, along with R&D), the ER research system appears relativelymore reliant on public R&D, as are other Italian regions. However, when more specific aspectsare considered, it clusters together with only 5 of the other 20 Italian regions (Kroll andStahlecker 2009). Further differentiation emerges from CIS (Community Innovation Survey)data (Evangelista et al. 2002). Unlike ‘technologically backward regions’ (mainly in the south),‘moderately innovative regions’ and ‘R&D based innovative regions’, ER appears as a particular‘informal learning RIS’. A plurality of institutional actors plays a role (e.g., specialized businessservice providers, governmental agencies, technology-transfer centres, and business associa-tions) in this, but their innovative interactions are mainly informal.
All in all, there is evidence of regional ‘discontinuities’ in the different proximities that wehave addressed above. Although with some caveats, this holds true also for geographical
4 In spite of a remarkable record in firms’ innovative efforts and outcomes, some key-innovation enablers have a weakpresence in the region. In the last two European Regional Scoreboards (see Hollanders et al. 2009), these were:population with tertiary education, participation in life-long learning, public R&D expenditures, and broadband access.
A. Marzucchi et al.504
Papers in Regional Science, Volume 94 Number 3 August 2015.
proximity. With respect to ER’s partners, extra-regional partners can be generally deemed moredistant in geographical terms too.5
Innovation policy interventions play an important role in the ER RIS (Bianchi and Giordani1993). A remarkable example is represented by the ‘Regional Programme for IndustrialResearch, Innovation and Technology Transfer’ (PRRIITT), launched for the first time in 2003(Marzocchi 2009). Its aim is to mitigate the weaknesses of the RIS, while exploiting its specificstrengths.
Our analysis is based on this policy scheme. In particular, we focus on the first two calls(February and September 2004) of the ‘Measure 3.1 A’. This measure was devised to sustainindustrial research and precompetitive development with a focus on more detailed objectives,such as support to specific technological areas, employment in industrial research, technologytransfer from actors involved in scientific research, the adoption of Intellectual Property Rights(IPR) forms of protection for innovative outputs. Furthermore and specifically related to the aimof our research, policy-makers also intended to strengthen the linkages between firms anduniversities and/or research institutes.
With respect to the goal of supporting industry-research co-operation (both regional andextra-regional), the subsidy had a hybrid nature. On the one hand, financial support formally hadthe characteristics of a ‘generic’ intervention, leaving firms free to decide whether or not toactually engage in any collaboration with a university or a research institute (and the specificpartner to interact with), or to use the funding differently. On the other hand, even if notspecifically ‘conditioned’ to industry-research co-operation, the subsidy was designed to supportthese types of interactions, both on regional and extra-regional levels. Among the technical-scientific aspects to be considered in the evaluation process for granting the subsidies, policy-makers included a point that explicitly concerned co-operation with research partners.6 As afurther support, firms were provided with a higher percentage of contribution for expendituresrelated to collaboration with universities and research institutes. Specifically, whereas themaximum coverage of the subsidy was fixed at 50 per cent of the overall cost for industrialresearch activities, and at 25 per cent (35% for SMEs) of the total cost for precompetitivedevelopment actions, specific expenditures for industry-research collaborations (both related toresearch and development activities) were potentially covered by up to 80 per cent.
As for the general characteristics of the subsidy implementation, 529 projects (557 firms)7
were subsidized through the two calls. Although both SMEs and large firms were allowed toparticipate in the scheme, the limited amount of the average regional contribution (175,000Euros per project) made the subsidy more oriented towards the former category (see also TableB1 in the Appendix). The total cost of the subsidized projects was about 236 million Euros.Public funding covered about 40 per cent of the total cost, with an overall public expenditure of96 million Euros. Regional contribution ranged from about 61,000 to 250,000 Euros (themaximum contribution amount set by policy-makers).
5 Apart from the peripheral provinces (i.e., Piacenza, Ferrara, Rimini), the closest province to each and everyprovince of the ER region is never located across its borders (detailed evidence is available from the authors uponrequest). Given the low participation in the subsidy scheme we are analysing of the firms located in peripheral provinces(around 11% in our working sample and 14% in the population of beneficiaries), we believe this does not significantlyaffect our argument about geographical proximity.
6 The aspects considered in the evaluation process were: technological/scientific (45 points), economic/financial (20points), managerial (20 points), and regional impact (15 points). The threshold over which firms were funded was setat 75 points.
7 The difference between the number of funded projects and the number of funded firms is due to 15 subsidies thatwere granted to temporary consortia of firms. We excluded these associated firms from our analysis, given the particularnature of their projects when compared to those submitted by single firms (e.g., larger networking capacity, resources,and possibility to exploit economies of scale).
Research co-operation within and across regions 505
Papers in Regional Science, Volume 94 Number 3 August 2015.

3.1 Data
Empirical application relies on a unique dataset. First, by focusing on a single region, wehave been able to obtain detailed information from its policy-makers on the amounts andcharacteristics of the investigated policy scheme. This information has been integratedwith other two firm-level data sources. The first is an original survey, with a structure similarto the Eurostat Community Innovation Survey (CIS), carried out in 2009 by Antonioli et al.(2011) on 555 ER manufacturing firms (with at least 20 employees). The second datasetis the AIDA database, by BureauVanDijk, which we used to extract firms’ balance-sheetdata.
More specifically, the first dataset contains detailed information on structural and organiza-tional characteristics of the surveyed firms and on their innovation outcomes and strategies.Their research co-operation activities are among these.
The survey refers to a random sample of 555 firms and is stratified by size, province(geographic location at NUTS 3 level) and sector (NACE Rev. 1.1). The reference years are2006–2008, a time span subsequent to the onset of policy administration, while some of the datathat we use is (supposedly) time-invariant. On the other hand, balance-sheet data (for example,intramural R&D and advertising expenditures) refer to the year 2003, before the policy was inforce.
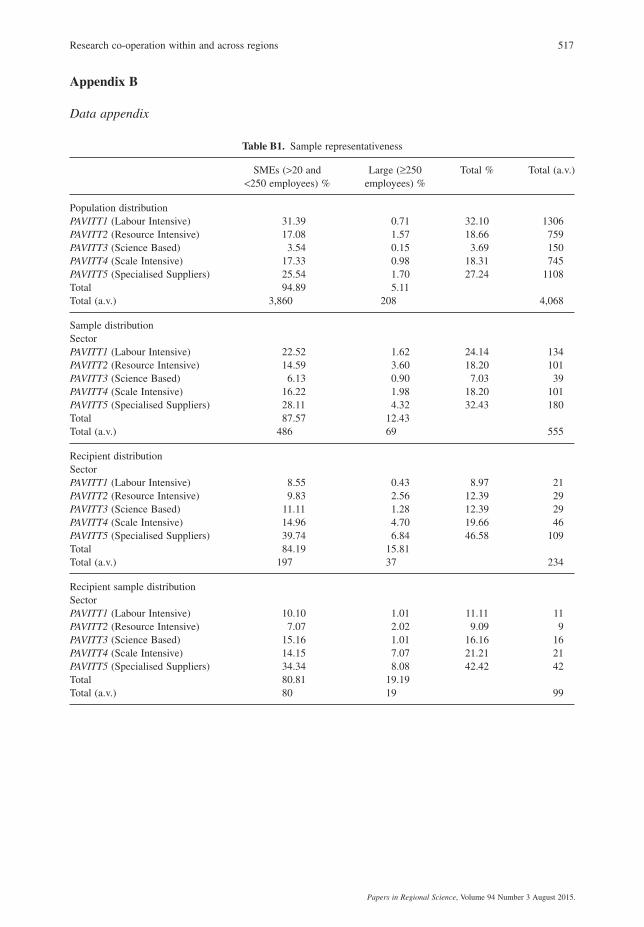
After merging and cleaning procedures, we were left with a longitudinal sample of 408manufacturing firms: 99 subsidized, and 309 non-subsidized with the PRRIITT Measure 3.1A.The 99 firms show a distribution by size (SMEs and large firms) and sector (Pavitt/OECDtaxonomy) similar to that of all the manufacturing firms (with more than 20 employees) thatreceived the regional R&D subsidy (Table B1).
3.2 Econometric strategy
The strategy we use for the first part of the analysis is established in empirical literature on theimpact of the ‘simple’ administration of an R&D subsidy (e.g., Czarnitzki and Licht 2006;Busom and Fernandez-Ribas 2008; Fernandez-Ribas and Shapira 2009).
Given the non-exogeneity of policy support (on which see Cerulli 2010), and the relatedproblems of an ordinary least squares model, the estimation of its impact can make use of apropensity score matching (PSM) approach (Rosenbaum and Rubin 1983). In brief, the PSMtries to obtain an estimate of the average treatment effect on the treated (ATT) of the policy,defined as:
ATT E Y Y D E Y D E Y D= − = = = − =( | ) ( | ) ( | ).1 0 1 01 1 1 (1)
Y1 and Y0 denote the value of a certain outcome variable (Y) in the presence and absence of thetreatment (policy, in this case), respectively. D denotes the status of the treatment: D = 1,administrated (treated); D = 0, non-administrated (non-treated).
(Y0|D = 1) is by definition non-observable. Therefore, it needs to be substituted by referringto a suitable ‘counter-factual’ of firms that did not receive financial support by way of thepolicy. In order to control for the selection-bias (on observables), and be sure that the differ-ence in the outcome of the two groups is exclusively due to the policy, treated firms arematched with non-treated firms on the basis of the propensity score, Pr(D = 1|X) (or P(X)).This represents the probability of being treated, given a set of pre-treatment characteristics, X,which are supposed to affect both the treatment and the outcome. The PSM estimate of ATTis thus given by:
A. Marzucchi et al.506
Papers in Regional Science, Volume 94 Number 3 August 2015.
ATT E E Y D P X E Y D P XPSM P X D= = − ==( )| { [ | , ( )] [ | , ( )]},1 1 01 0 (2)
where P(X) is estimated with a probit model.The PSM is implemented through use of a set of standard procedures, assumptions and
quality tests. In brief, a set of matching procedures is employed, allowing us to assess thestability and, indirectly, the reliability of the evidence. These procedures differ in the selectionand weighting of the non-treated firms to be used as matches, as well as in the capacity to tradebetween efficiency and bias reduction (Becker and Ichino 2002; Smith and Todd 2005; Caliendoand Kopeinig 2008; Cameron and Trivedi 2009). The common support condition is imposed inall the matching procedures, in order to guarantee the presence of suitable counterfactual firmsfor each treated.8 Finally, the quality of the matching is tested by verifying that the beneficiariesand the matched controls are correctly aligned with respect to the vector of the covariates X.9
In order to test for the ‘monetary effect’ of the subsidy in the second part of the empiricalapplication, we make use of an original ‘continuous treatment’ approach: the generalizedpropensity score method (GPS) (Hirano and Imbens 2004; Bia and Mattei 2008). In particular,the GPS is used to estimate the effect of an additional amount of public funding for a set ofsubsidy levels. In technical terms, given the treatment, T, and a set of covariates, X, whichexplain its administration, the generalized propensity score, R, is defined as (Hirano and Imbens2004):
R r T X= ( , ), (3)
where the propensity function r(t,x) is the conditional density of the actual treatment, t, given theobserved covariates, x.
Like the propensity score, the GPS has a balancing property.10 Hirano and Imbens (2004)have demonstrated that, when this balancing propriety is associated with a suitableunconfoundedness assumption, the treatment is unconfounded given the GPS. Hence, the GPScan be used to eliminate the bias in the estimation of the treatment effect, which is due todifferences in the covariates.
In empirical application, following Hirano and Imbens (2004) and Bia and Mattei (2008), wefollow a three-step estimation strategy, which Appendix A illustrates in detail. However, at thisstage it is worthwhile to clarify two of its specific elements. First of all, our interest is in theeffect that an extra amount of subsidy has on a set of co-operation decisions which have adiscretely increasing order: no-co-operation, co-operation with a regional partner, andco-operation with an extra-regional partner. Therefore, step 2 (see Appendix A) of the GPSstrategy is estimated with an ordered probit model. Second, the choice of treatment variation foranalysing the incremental effects of the policy inevitably suffers from ad hocness. However, thisproblem is attenuated through the choice of this variation according to the characteristics of theinvestigated context. As the average regional contribution was equal to 175,000 Euros, Δt hasbeen heuristically looked for among a set of options and chosen at 20,000 Euros.11 Furthermore,given the minimum and maximum amount of subsidy granted to the firms, the treatment levelsto which such a Δt has been applied spans from 60,000 to 250,000 Euros.
8 In addition to the ‘minima and maxima’ comparison, the five nearest-neighbours matching is implemented by alsoimposing the common support condition with a 1 per cent ‘trimming’ procedure (see Caliendo and Kopeinig 2008).
9 Three tests have been carried out (Caliendo and Kopeinig 2008): a joint significance and a pseudo-R2 test for thePSM probit, and a regression-based t-test on the differences in the covariates means. The results of these tests, availableupon request, largely support the quality of the matching procedures.
10 Within strata with the same value of r(t,x), the probability that T = t does not depend on X.11 This is approximately the cost of an extra temporary contract of 12 months for a junior researcher in a typical
regional university/institute department. As a robustness check, we carried out our analysis with different values of Δt,namely 1.00 Euro, 1,000 Euros, and 40,000 Euros.
Research co-operation within and across regions 507
Papers in Regional Science, Volume 94 Number 3 August 2015.

3.3 Variables
We build up two sets of variables. First, we need a set of suitable covariates, X, to be includedin the estimation of the propensity score and in that of the GPS. Descriptive statistics areprovided in Table B2. Sector-specific and scale-specific effects in innovation are first controlledfor by considering a set of dummies (PAVITT1 — PAVITT5) for the Pavitt/OECD sectors, and(the natural logarithm of) the firms’ numbers of employees (lnEMP2003), respectively. Further-more, provincial (NUTS 3 level) dummies (GEO1–GE010) are considered to account for thegeographical heterogeneity of the ER region.
In addition to these time-invariant controls, the dataset allowed us to consider two pre-policyfeatures (that is, in place in 2003) that could have affected policy administration (in 2004): thefirms’ innovativeness and their financial situations. The first is proxied by per capita expendi-tures in intramural R&D and advertising (RDADV2003).12 Our expectation is that firms withhigher R&D intensity are more willing to apply for and use the subsidy to make further stepsalong their path toward innovation. The financial situation of the firm is proxied by its per capitacash-flow (CASHFLOW2003) – accounting for the firm’s internal financial resources to invest ininnovation – and by its short-term debt index (FINCONST2003) – signalling the presence ofpossible financial constraints.13 Our expectation is that smaller (larger) financial resources(barriers) will make firms more prone to apply for the subsidy.
We should note that, apart from the sectoral and geographical dummies, all the consideredcovariates are continuous variables. This fact enhances the quality of the estimates. Furthermore,nearly all of them are used in the specification of both the propensity score and the GPS. Onlyfew of them had to be dropped to respect the balancing propriety of the latter: the provincialdummies (GEO1–GEO10) and the expenditure in R&D and advertising in year 2003(RDADV2003).
The second set of necessary variables are related to the outcome of the policy in terms ofresearch co-operation. Following the definition employed in the survey, this co-operation refersto the active participation of firms in joint innovation projects (not confined to R&D only),which are carried out together with other organizations (both public and private). Hence theexternalization of innovation activities, the acquisition of licences and patents, as well assporadic participation in informal networks are excluded from our analysis.
At the outset, we distinguish research organizations as universities and research institutes.14
This is consistent with literature (e.g., Tödtling et al. 2009), in which the specific type of partnercan have a role in determining the co-operative-additionality of the policy. More precisely, wefirst consider whether, in the aftermath of the policy (period 2006–2008), firms had co-operationagreements in place with: regional universities (COOPUNIREG) and research institutes(COOPRESINSREG); extra-regional universities (COOPUNIEXTRA) and research institutes(COOPRESINSEXTRA). Descriptive statistics of the outcome variables (see Table B3) providesome preliminary insights which will be consolidated through the implementation of the econo-metric strategy described in subsection 3.2. On average, ER firms in our sample co-operate more
12 Unfortunately, disaggregated data for the two kinds of expenditures were not available. However, recent studies areemerging on their complementary in the current open-innovation and demand-led paradigm (e.g., Perks et al. 2009).
13 Short-term debt is considered here to be more relevant than long-term debt, given the contingent nature of thedecision to plan an R&D project and thus apply for a subsidy.
14 Given the characteristics of policy assignment rules, we here refer to universities and research institutes withoutdistinguishing between private and public. The support to industry-research co-operation was not conditioned to thepublic nature of research partners. While this makes private partners in co-operation less distant from firms inmicro-institutional terms, important differences remain between them in terms of both incentives and objectives. Afurther reason for not distinguishing between private and public research partners is the relatively low number of publicresearch institutes in the region (limited to those of the National Research Council (CNR) and of the Italian NationalAgency for New Technologies, Energy and Sustainable Economic Development (ENEA)), which is also reflected in ourdataset.
A. Marzucchi et al.508
Papers in Regional Science, Volume 94 Number 3 August 2015.

with regional partners than with extra-regional ones. Furthermore, funded firms are moreengaged in industry-research collaboration than non-subsidized firms. In the second part of theapplication we make use of two ordinal variables (COOPUNIORD and COOPRESINSORD) which,in the post-policy period (2006–2008), account for the range of the firms’ interaction. Each ofthese variables takes value 0, in the case of no co-operation, 1, in the case of regionalco-operation, and 2, in the case of extra-regional co-operation with at least one university orresearch institute, respectively.
4 Results
Before looking at PSM estimates, let us consider underlying probit estimation (Table 1).As expected, R&D support has a higher probability of being searched for/received by firms
with a larger experience in R&D investment (RDADV2003).15 Furthermore, firms operating inmore dynamic and technology-intensive sectors are more likely to be subsidized. In addition toscale-intensive firms (PAVITT4), science-based companies (PAVITT3) and firms operating in theindustrial-districts of the ER region, characterized by specialized supplier sectors (PAVITT5),have a higher probability of receiving the subsidy. Finally, a solid financial condition increasesthe firms’ probability of being funded (FINCONST2003 is significantly negative). In synthesis,the subsidy appears to be a ‘picking the winner’ policy in its nature (Cerulli 2010), helping
15 R&D could equally increase the willingness and the capacity of firms to apply for the subsidy. Unfortunately, wecannot distinguish whether previous engagement in R&D increases awareness of the need to innovate, and thus theinterest/propensity to submit projects, rather than the capacity to present more promising and well-planned proposals.
Table 1. Probit estimation of the propensity score
Coeff. S.E.
lnEMP2003 0.119 0.083GEO1 3.420*** 1.146GEO2 1.755* 1.053GEO3 0.789 1.155GEO5 1.839* 1.057GEO6 2.639** 1.096GEO7 1.531 1.077GEO8 2.184** 1.083GEO9 1.849* 1.064GEO10 1.187 1.122PAVITT1 0.148 0.290PAVITT3 1.361*** 0.326PAVITT4 0.575** 0.279PAVITT5 0.726*** 0.255FINCONST2003 −0.881* 0.525CASHFLOW2003 −0.005 0.005RDADV2003 0.162*** 0.043_cons −2.671** 1.219
N 408Pseudo R2 0.217Prob > χ2 0.000
Notes: ***,**,* indicate a significance level of 1%, 5%, 10%, respectively.A VIF test excludes the presence of multicollinearity among the covariates(all the VIF values are lower than 10).
Research co-operation within and across regions 509
Papers in Regional Science, Volume 94 Number 3 August 2015.

innovative ER firms to breed their success in innovation (Antonioli et al. 2012).16 Clearly, sucha result is an expected outcome of the selection criteria followed in granting the R&D subsidy(see Section 3). The regional policy-maker, although not explicitly excluding firms with lowbusiness and innovative performance, de facto favoured the best performing firms, by providingthem with premiums for technological, economic and managerial excellence.
As a further introduction to our analysis, Table 2 shows that the ATT of the policy isgenerally positive and significant. This result is robust across the different matching proceduresemployed. Funded firms are more likely to co-operate than non-funded ones, irrespective of thenature of the research partner and its location. The subsidy is actually able to compensaterecipient firms for the co-operation costs that are entailed by the institutional and cognitivedistances which separate firms from research organizations in general. In particular, firms appearto make use of the degree of freedom that the hybrid nature of the public intervention leaves tothem (see Section 3). Given the weaknesses of the investigated RIS, especially in terms of lackof formal and structured links between firms and research actors (e.g., Evangelista et al. 2002),this result suggests an ‘illuminated’ action on the part of ER policy-makers.
Turning to the research focus of the paper, regional boundaries and the manifold disconti-nuity they generate actually affect the impact of the policy. Compared to non-funded firms,funded ones are more likely to co-operate with regional (from +37.4% to +40.2%, depending onthe matching procedure) than with extra-regional universities (from +13.0% to +19.8%). Thesame holds true in the case of regional and extra-regional research institutes (from +32.8% to+33.5%, and from +19.3% to +22.6%, respectively).
This result is also robust and confirms the theoretical argument developed in Section 2 andits policy implications. The manifold proximity that the regional setting provides (geographical,
16 Antonioli et al. (2012) provide an analysis of the same R&D subsidy here investigated. However, it differs fromthe present paper in two main respects. First, differently from the present analysis, the one provided by Antonioli et al.(2012) does not focus on policy effects that pertain to the intended objectives of the policy intervention. Whereasindustry-research co-operation was an explicit policy target (see Section 3), the impacts analysed by Antonioli et al.(2012) (i.e., competences upgrading and inter-firm co-operation) did not receive the same type of policy support.Second, due to a further process of data collection, in the present analysis we make use of information on the amountof policy funding and consequently employ a novel econometric method (i.e., GPS) to investigate the ‘monetary effect’of the subsidy.
Table 2. Effect of the subsidy receipt on the firms’ co-operation with research organizations
5NN Caliper Kernel 5NN Trim
ATT S.E. ATT S.E. ATT S.E. ATT S.E.
Co-operation with ResearchOrganizations
Intra-RISCOOPUNIREG 0.374*** 0.082 0.393*** 0.082 0.402*** 0.072 0.381*** 0.077COOPRESINSREG 0.335*** 0.073 0.335*** 0.076 0.330*** 0.075 0.328*** 0.075Extra-RISCOOPUNIEXTRA 0.189*** 0.060 0.130* 0.071 0.138** 0.065 0.198*** 0.069COOPRESINSEXTRA 0.193*** 0.074 0.218*** 0.075 0.226*** 0.075 0.202*** 0.077
N treated on support 92 92 92 95N treated total 99 99 99 99N non treated 309 309 309 309
Notes: Methods: five nearest neighbours (5NN), five nearest neigbhours with a 0.05 caliper (Caliper), Epanechnikovkernel matching (Kernel), five nearest neighbours with 1% trim (5NN Trim). Standard errors estimated with a200-replication bootstrap procedure. ***, **, * indicate a significance level of 1%, 5%, 10% significance, respectively.
A. Marzucchi et al.510
Papers in Regional Science, Volume 94 Number 3 August 2015.

cognitive, social and institutional) favours firms’ research co-operation. Hence, given the lowerbarriers and costs, closer co-operation is actually easier to enhance by simple participation in thepolicy scheme. In spite of the overall regionalization of its effects, it remains true that the policyhas some additionality in terms of extra-regional co-operation too. Given the role that this kindof relationship plays in opening up the RIS by allowing the regional firms to renew the localknowledge base (e.g., Hassink 2005), this is another very welcomed result of the policy in thisRIS.
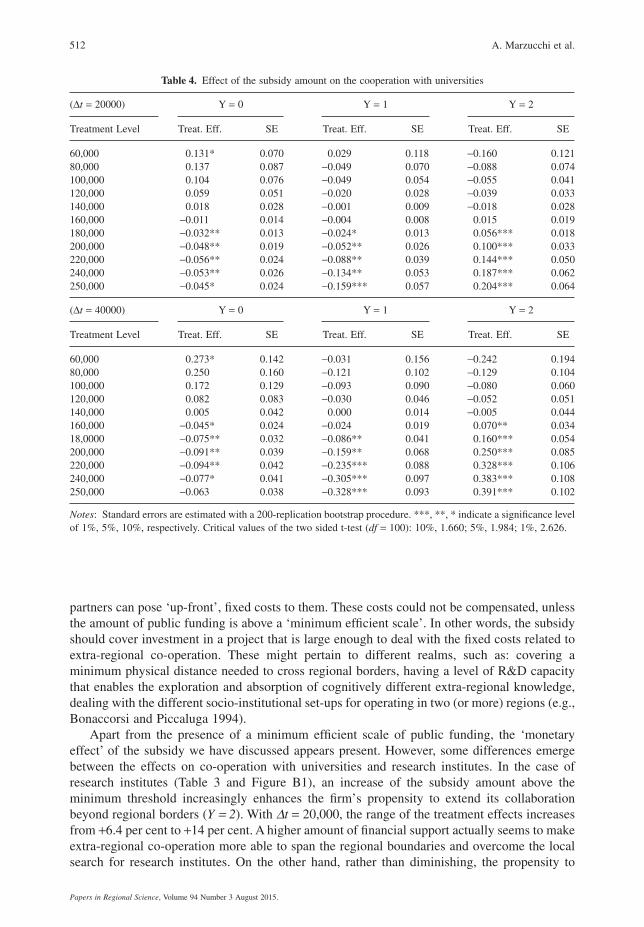
Examining the monetary effect of the policy, our theoretical argument does find confirma-tion in GPS estimates, although with some important specifications.17 An increment of the R&Dsubsidy significantly and increasingly affects the firm’s propensity to extend its co-operationwith research organizations beyond regional borders (Y = 2 in Tables 3 and 4). However, thisoccurs when the subsidy overcomes a minimum threshold. By considering an increase of 20,000(40,000) Euros, this threshold is 200,000 (180,000) Euros with respect to research institutes(Table 3), and 180,000 (160,000) Euros, with respect to universities (Table 4).
This result is quite interesting and suggests the following interpretation: the sharp decreasethat crossing regional boundaries determines in the firms’ ‘proximities’ with their research
17 The maximum likelihood estimation of the GPS is reported in the Appendix (Table B4). In what follows, we reportand comment on the results obtained with Δt values of 20,000 Euros and 40,000 Euros only. Further comments on therobustness of the test will be added at the end of this section.
Table 3. Effect of the subsidy amount on the cooperation with research institutes
(Δt = 20000) Y = 0 Y = 1 Y = 2
Treatment Level Treat. Eff. SE Treat. Eff. SE Treat. Eff. SE
60,000 0.141* 0.078 −0.003 0.064 −0.138 0.10880,000 0.128 0.087 −0.040 0.045 −0.088 0.070100,000 0.096 0.068 −0.034 0.034 −0.062 0.045120,000 0.059 0.047 −0.012 0.017 −0.047 0.037140,000 0.026 0.029 0.002 0.008 −0.028 0.032160,000 0.000 0.017 0.000 0.008 0.000 0.023180,000 −0.022 0.016 −0.010 0.009 0.032 0.020200,000 −0.042* 0.023 −0.022 0.015 0.064** 0.031220,000 −0.061** 0.030 −0.032 0.023 0.094** 0.044240,000 −0.076** 0.037 −0.048 0.036 0.124** 0.057250,000 −0.080** 0.039 −0.060 0.043 0.140** 0.063
(Δt = 40000) Y = 0 Y = 1 Y = 2
Treatment Level Treat. Eff. SE Treat. Eff. SE Treat. Eff. SE
60,000 0.271 0.180 −0.050 0.089 −0.220 0.17380,000 0.226 0.161 −0.090 0.088 −0.136 0.103100,000 0.160 0.118 −0.065 0.065 −0.095 0.069120,000 0.090 0.080 −0.021 0.033 −0.069 0.059140,000 0.026 0.046 0.002 0.011 −0.028 0.050160,000 −0.022 0.028 −0.009 0.014 0.031 0.040180,000 −0.060* 0.034 −0.037 0.029 0.097* 0.056200,000 −0.093** 0.046 −0.068 0.049 0.161* 0.083220,000 −0.122** 0.058 −0.097 0.066 0.220** 0.106240,000 −0.140** 0.067 −0.136 0.083 0.275** 0.123250,000 −0.140** 0.069 −0.161* 0.089 0.301** 0.128
Notes: Standard errors are estimated with a 200-replication bootstrap procedure. ***, **, * indicate a significance levelof 1%, 5%, 10%, respectively. Critical values of the two sided t-test (df = 100): 10%, 1.660; 5%, 1.984; 1%, 2.626.
Research co-operation within and across regions 511
Papers in Regional Science, Volume 94 Number 3 August 2015.
partners can pose ‘up-front’, fixed costs to them. These costs could not be compensated, unlessthe amount of public funding is above a ‘minimum efficient scale’. In other words, the subsidyshould cover investment in a project that is large enough to deal with the fixed costs related toextra-regional co-operation. These might pertain to different realms, such as: covering aminimum physical distance needed to cross regional borders, having a level of R&D capacitythat enables the exploration and absorption of cognitively different extra-regional knowledge,dealing with the different socio-institutional set-ups for operating in two (or more) regions (e.g.,Bonaccorsi and Piccaluga 1994).
Apart from the presence of a minimum efficient scale of public funding, the ‘monetaryeffect’ of the subsidy we have discussed appears present. However, some differences emergebetween the effects on co-operation with universities and research institutes. In the case ofresearch institutes (Table 3 and Figure B1), an increase of the subsidy amount above theminimum threshold increasingly enhances the firm’s propensity to extend its collaborationbeyond regional borders (Y = 2). With Δt = 20,000, the range of the treatment effects increasesfrom +6.4 per cent to +14 per cent. A higher amount of financial support actually seems to makeextra-regional co-operation more able to span the regional boundaries and overcome the localsearch for research institutes. On the other hand, rather than diminishing, the propensity to
Table 4. Effect of the subsidy amount on the cooperation with universities
(Δt = 20000) Y = 0 Y = 1 Y = 2
Treatment Level Treat. Eff. SE Treat. Eff. SE Treat. Eff. SE
60,000 0.131* 0.070 0.029 0.118 −0.160 0.12180,000 0.137 0.087 −0.049 0.070 −0.088 0.074100,000 0.104 0.076 −0.049 0.054 −0.055 0.041120,000 0.059 0.051 −0.020 0.028 −0.039 0.033140,000 0.018 0.028 −0.001 0.009 −0.018 0.028160,000 −0.011 0.014 −0.004 0.008 0.015 0.019180,000 −0.032** 0.013 −0.024* 0.013 0.056*** 0.018200,000 −0.048** 0.019 −0.052** 0.026 0.100*** 0.033220,000 −0.056** 0.024 −0.088** 0.039 0.144*** 0.050240,000 −0.053** 0.026 −0.134** 0.053 0.187*** 0.062250,000 −0.045* 0.024 −0.159*** 0.057 0.204*** 0.064
(Δt = 40000) Y = 0 Y = 1 Y = 2
Treatment Level Treat. Eff. SE Treat. Eff. SE Treat. Eff. SE
60,000 0.273* 0.142 −0.031 0.156 −0.242 0.19480,000 0.250 0.160 −0.121 0.102 −0.129 0.104100,000 0.172 0.129 −0.093 0.090 −0.080 0.060120,000 0.082 0.083 −0.030 0.046 −0.052 0.051140,000 0.005 0.042 0.000 0.014 −0.005 0.044160,000 −0.045* 0.024 −0.024 0.019 0.070** 0.03418,0000 −0.075** 0.032 −0.086** 0.041 0.160*** 0.054200,000 −0.091** 0.039 −0.159** 0.068 0.250*** 0.085220,000 −0.094** 0.042 −0.235*** 0.088 0.328*** 0.106240,000 −0.077* 0.041 −0.305*** 0.097 0.383*** 0.108250,000 −0.063 0.038 −0.328*** 0.093 0.391*** 0.102
Notes: Standard errors are estimated with a 200-replication bootstrap procedure. ***, **, * indicate a significance levelof 1%, 5%, 10%, respectively. Critical values of the two sided t-test (df = 100): 10%, 1.660; 5%, 1.984; 1%, 2.626.
A. Marzucchi et al.512
Papers in Regional Science, Volume 94 Number 3 August 2015.

co-operate locally (i.e., in the region) is left unaltered by the increase in policy intervention (thatis, the outcome Y = 1 is not significantly affected by it).18 That is to say, rather than using thepolicy support for shifting from intra-regional to an extra-regional co-operation with researchinstitutes, regional firms appear more inclined to continue in their intra-regional co-operationand possibly integrate it with a more open strategy.
Adding an extra amount of treatment above the threshold enhances the firms’ propensity toco-operate with extra-regional universities (Y = 2) as well: in a measure which, for an increaseof 20,000 Euros, spans from +5.6 per cent to + 20.4 per cent (Table 4 and Figure B2). However,differently from what emerged for the collaboration with research institutes, the increasingpropensity to co-operate with extra-regional academic partners (in tandem with the subsidyamount) is associated with a decreasing propensity to collaborate with a regional university(Y = 1). Above the threshold (of 180,000 Euros), an extra amount of subsidy (of 20,000 Euros)induces firms to co-operate less with regional academic partners: from –2.4 per cent to –15.9 percent.19 This result suggests a sort of substitution effect, between an ‘inward-looking’ and an‘outward-looking’ co-operation strategy in the case of universities.
The fact that we observe this substitution only for universities can have different explana-tions. On the one hand, the number of universities outside the region that firms consider suitablesubstitutes of regional ones could be higher than that of research institutes. On the other hand,the result can find explanation in the relationship between the knowledge produced by regionaland extra-regional research organizations. Perhaps more so than research institutes, universitiesoperate in an homogeneous framework made of grids of internationally codified scientific fields,peer-review systems and incentives to carry out research in certain scientific areas. In particular,research priorities and themes are defined on the basis of evaluation criteria and fundingmechanisms that supersede the regional level.20 As a consequence, regional universities arelikely to offer analytical knowledge which is not too dissimilar – at least in terms of breadth –from that available through co-operation with extra-regional academic partners. However, whenthe search for academic research capabilities is not regionally confined, the probability offinding more suitable, newer or more diverse knowledge outside the region obviously increases(Belussi et al. 2010; D’Este and Iammarino 2010; Laursen et al. 2011). Accordingly, once publicfunding allows firms to deal with higher costs, they can substitute regional co-operation withextra-regional, if they find it strategically convenient.
From a RIS perspective as well, this result is extremely relevant. On the one hand, to theextent that it increases extra-regional co-operation with universities, the policy has a potentialimpact on the renewal of the regional knowledge base. However, this could come at the cost ofreduced region-specific interactive learning between firms and local universities, possibly result-ing in a decreasing internal cohesion of the system.
We should note in conclusion that the obtained results are largely robust across the Δt valuesthat we have selected.21 In order to carry out a further robustness check, we have re-run theprevious analysis by employing a different type of ‘treatment’. Instead of the actual amount ofthe subsidy, we have used the intensity of the subsidy: that is, the ratio between the subsidy and
18 Although with a different threshold value (i.e., 180,000 rather than 200,000 Euros), and with a different range oftreatment effects for Y = 2 (that is from +9.7% to +30.1%) the results we have obtained concerning interaction withresearch institutes are confirmed for Δt = 40,000 Euros.
19 These results as well are robust with Δt = 40,000 Euros, although with a different threshold (160,000 Euros), anddifferent ranges in the effect for Y = 2 (from +7% to +39.1%) and for Y = 1 (from −8.6% to −32.8%).
20 A notable example for the Italian case is the formalization of the evaluation criteria defined by ANVUR (i.e., thenational agency for the evaluation of the university system). Similarly, supra-regional definition of priorities foracademic research may come from funding schemes at national (e.g., FIRB, PRIN) and EU levels (e.g., FP7, ERCgrants).
21 The evidence emerging from estimates which employ Δt values of 1.00 Euro and 1,000 Euros has not beenillustrated for the sake of conciseness. These additional amounts of subsidy can be considered quite small whencompared to the cost of establishing and managing co-operation with a research organization. Accordingly, we could
Research co-operation within and across regions 513
Papers in Regional Science, Volume 94 Number 3 August 2015.

the total amount of the funded project. However, results show that this is neither particularlymeaningful nor a viable way to proceed in the context of our empirical application. Given thedesign of the considered policy intervention, which supported the different types of firms’expenditures in fixed percentages, the ratio between the subsidy and the total project amountturns out to be extremely concentrated (for example, 65% of the observations have a subsidyintensity ratio between 35% – 45%). This quite low variability made the estimation of the GPS(i.e., the first step of the procedure described in Appendix A) unfeasible.
Finally, our evidence can also be considered robust to the potentially concurring effects ofother policy interventions which the firms in our sample might have benefited from. In theabsence of proper data, we cannot econometrically control for this potential bias. However,some qualitative evidence suggests that this distortion is not a major concern for our empiricalapplication. Throughout the course of a semi-structured interview, key informants of regionalpolicy-makers confirmed that the vast majority of SMEs funded by the subsidy (the main policytarget, see Table B1) did not apply for other R&D funding schemes. At the same time, they alsoreported that other firms, not necessarily SMEs, resorted to regional funding because they wereunable to access other subsidy schemes (for example, because the relative calls for applicationswere already closed).
5 Conclusions
Increasing industry-research co-operation is an important objective to be pursued by policy-makers. Within the region, it helps strengthen the knowledge base, which becomes available tolocal firms. Across regional boundaries, it allows firms to tap into different sources of knowledgein order to subsequently propose novel business solutions in the region. The econometricanalysis conducted on a sample of manufacturing firms located in the ER region in Italy showssome interesting results. An R&D subsidy which provides a certain amount of support forcollaboration with research partners (universities and research institutes), but leaves the benefi-ciaries with some degree of freedom in the decision to engage in this type of co-operation,appears quite effective in activating industry-research co-operation.
At the outset, supported firms actually make use of this opportunity. This suggests that thepolicy can attenuate the costs posed by the barriers to industry-research co-operation, which areimplied by different gaps in the proximity between firms and research organizations. Therefore,regional policy-makers can have an important role in addressing this potential RIS failure, whichalso affects a medium-high innovative region like ER. This result is expected to also hold truein other, less innovative regional contexts and/or in which an attitude favourable towardsco-operation is less diffuse. In these latter cases, further, not necessarily financial, support couldbe needed and provided through ‘softer’ policy interventions (e.g., sharing of best practices).
A second insight emerging from our analysis is that the simple receipt of an R&D subsidyinduces local firms to increase their co-operation with research partners more within the region,than across its boundaries. This suggests that the manifold proximity which characterizesregional collaborations affects the costs and the priority that the local firms attach to theirco-operative projects. Apparently, the simple provision of an R&D subsidy (i.e., its ‘adminis-tration effect’) is not capable of inducing a firm to opt for extra-regional partnerships as muchas it is of fostering intra-regional co-operation.
Finally, our evidence has shown that the amount of a subsidy (i.e., its ‘monetary effect’) canplay a role in this respect instead. A minimum threshold of policy intervention appears necessary
expect that they are not able to have economically meaningful impacts. The results, available upon request, confirm thisexpectation. Even if consistent with those presented in terms of (thresholds of) significance, the treatment effects areindeed very low in terms of magnitude.
A. Marzucchi et al.514
Papers in Regional Science, Volume 94 Number 3 August 2015.

for firms to overcome the possible presence of indivisible fixed costs in extra-regionalco-operation. Beyond such a minimum threshold, an additional amount of subsidy increasesfirms’ propensity to engage in more costly extra-regional co-operation, through which they canaccess different knowledge and obtain new ideas for their innovations. This result presumablyapplies to an even greater extent to regions, whose knowledge base is not that reliant on locallearning mechanisms and is therefore more dependent on external knowledge for innovation.
The possibility that extra-regional co-operation occurs at the expense of intra-regionalco-operation is another important issue. Our application shows that the nature of the partner isa relevant aspect in the possible shift from an inward to an outward co-operative strategy. Asstated above, this occurs regarding firms’ co-operation with universities, but not with researchinstitutes. Part of the explanation relies in the relative availability of the two kinds of partners,within and outside the region concerned. However, the different kind of knowledge that thesetwo different realities contribute to producing is another general aspect which helps account forthis discrepancy.
These results have some important policy implications. First, our evidence suggests thatsmall-scale subsidies, which just partially contribute to the fixed costs of extra-regionalco-operation, would not affect the decision of the recipient firms to co-operate across the region.Hence, investigating a minimum scale which would allow extra-regional co-operation to rep-resent an effective option for local firms, and consequently devising a consistent contribution,becomes an important task for regional policy-makers. An accurate ‘screening’ of the extra-regional research organizations the supported firms decide to co-operate with in the R&Dproject supported by the policy would seemingly be important. Indeed, with respect to someresearch partners (universities, in our case), this policy might trigger a side-(substitution) effectthat would end up making regional research organizations less pivotal for the development ofregional innovations.
The results of the paper are not without limitations. First of all, panel data would haveallowed us to control for firms’ unobservable characteristics related to innovation andco-operation attitudes that our dataset does not account for. Second, results are inevitablysensitive to the characteristics of the context and policy that we have considered. The fact thatSMEs were the main beneficiaries of the intervention – though support was also granted to largefirms – and the low level of the average public funding, are just two examples. On the other hand,the results of the present study also have a general value, once the interplay between regionalproximities and research co-operation can be identified in similar policy initiatives. The originalmethodology which we have suggested for addressing the ‘monetary effect’ of the subsidy couldbe applied in other regional contexts to further generalize our findings, disentangling potentialregional specificities.
Appendix A
Econometric appendix
Three-step estimation strategy for GPSIn step 1, the conditional distribution of the treatment, Ti, given the covariates, Xi, is estimated,by assuming it – or a suitable transformation of it g(Ti) – normally distributed:
g T X N h Xi i i( ) | { ( , ), },≈ γ σ 2 (A1)
where h (γ , Xi) is a function of the covariates which depends on a vector of parameters, γ, andg(Ti) is a logarithmic transformation of the treatment, T.
Research co-operation within and across regions 515
Papers in Regional Science, Volume 94 Number 3 August 2015.

Estimating the parameters γ and σ2 by maximum likelihood, the GPS for each firm, i, canbe obtained as:
ˆˆ ˆ
ˆ, .R g T h Xi i i= − ( ) − ( )[ ]{ }1
2
1
22 2
2
πσ σγexp (A2)
With the estimated GPS, the normality of g(Ti) and the fulfillment of the assumption on thebalancing property can be tested.
In step 2, in order to ‘maximize’ the joint significance and the goodness of its fit, theconditional expectation of the outcome Yi, given Ti and Ri, is modelled and estimated as follows(the estimated GPS, R̂i , is used):
E Y T R T T Ri i i i i i( | , ) .= + + +α α α α0 1 22
3 (A3)
The last step of the procedure consists of estimating the treatment effect of an additionalamount of subsidy, obtaining the standard errors through a bootstrapping procedure. Given theparameters estimated in the previous stage, the average potential outcome at level t of treatmentis given by:
E Y tN
a a t a t a r t Xii
N
[ ( )] [ ( , ).� � � � � �= + + +∑1
0 1 22
3=1
(A4)
The treatment effect for each relevant level of the treatment, t, is calculated as the differencebetween Equation (A4), at level t +Δt, and Equation (A4) at t.
A. Marzucchi et al.516
Papers in Regional Science, Volume 94 Number 3 August 2015.
Appendix B
Data appendix
Table B1. Sample representativeness
SMEs (>20 and<250 employees) %
Large (≥250employees) %
Total % Total (a.v.)
Population distributionPAVITT1 (Labour Intensive) 31.39 0.71 32.10 1306PAVITT2 (Resource Intensive) 17.08 1.57 18.66 759PAVITT3 (Science Based) 3.54 0.15 3.69 150PAVITT4 (Scale Intensive) 17.33 0.98 18.31 745PAVITT5 (Specialised Suppliers) 25.54 1.70 27.24 1108Total 94.89 5.11Total (a.v.) 3,860 208 4,068
Sample distributionSectorPAVITT1 (Labour Intensive) 22.52 1.62 24.14 134PAVITT2 (Resource Intensive) 14.59 3.60 18.20 101PAVITT3 (Science Based) 6.13 0.90 7.03 39PAVITT4 (Scale Intensive) 16.22 1.98 18.20 101PAVITT5 (Specialised Suppliers) 28.11 4.32 32.43 180Total 87.57 12.43Total (a.v.) 486 69 555
Recipient distributionSectorPAVITT1 (Labour Intensive) 8.55 0.43 8.97 21PAVITT2 (Resource Intensive) 9.83 2.56 12.39 29PAVITT3 (Science Based) 11.11 1.28 12.39 29PAVITT4 (Scale Intensive) 14.96 4.70 19.66 46PAVITT5 (Specialised Suppliers) 39.74 6.84 46.58 109Total 84.19 15.81Total (a.v.) 197 37 234
Recipient sample distributionSectorPAVITT1 (Labour Intensive) 10.10 1.01 11.11 11PAVITT2 (Resource Intensive) 7.07 2.02 9.09 9PAVITT3 (Science Based) 15.16 1.01 16.16 16PAVITT4 (Scale Intensive) 14.15 7.07 21.21 21PAVITT5 (Specialised Suppliers) 34.34 8.08 42.42 42Total 80.81 19.19Total (a.v.) 80 19 99
Research co-operation within and across regions 517
Papers in Regional Science, Volume 94 Number 3 August 2015.

Tabl
eB
2.C
ovar
iate
sde
scri
ptiv
est
atis
tics
Var
iabl
esD
escr
iptio
nM
ean
(408
obs.
)M
inM
axM
ean
Subs
idis
ed(9
9ob
s.)
Min
Max
Mea
nN
otSu
bsid
.(3
09ob
s.)
Min
Max
Tim
ein
vari
ant
surv
eyda
taG
eogr
aphi
cal
loca
tion
(10
dum
mie
s)G
EO
1:E
xtra
-reg
ion
GE
O2:
Bol
ogna
GE
O3:
Forl
ìC
esen
aG
EO
4:Fe
rrar
aG
EO
5:M
oden
aG
EO
6:Pi
acen
zaG
EO
7:Pa
rma
GE
O8:
Rav
enna
GE
O9:
Reg
gio
Em
ilia
GE
O10
:R
imin
i
\0
1\
01
\0
1
Sect
or(5
dum
mie
s)PA
VIT
T1:
labo
urin
tens
ive
PAV
ITT
2:re
sour
cein
tens
ive
PAV
ITT
3:sc
ienc
eba
sed
PAV
ITT
4:sc
ale
inte
nsiv
ePA
VIT
T5:
spec
ialis
edsu
pplie
rs
\0
1\
01
\0
1
Bal
ance
shee
tsda
taln
EM
P20
03L
ognu
mbe
rof
empl
oyee
sin
year
2003
4.21
80.
693
7.96
14.
516
2.63
97.
754
4.12
20.
693
7.96
1F
INC
ON
ST20
03Sh
ort-
term
debt
inde
xin
year
2003
0.87
10.
320
10.
838
0.33
01
0.88
20.
320
1C
ASH
FL
OW
2003
Cas
hflo
wpe
rca
pita
inye
ar20
03(t
hous
ands
ofE
uros
)0.
792
−1.1
0518
5.22
20.
183
−0.4
751.
555
0.98
7−1
.105
185.
222
RD
AD
V20
03E
xpen
ditu
res
per
capi
tain
rese
arch
and
adve
rtis
emen
tin
year
2003
(tho
usan
dsof
Eur
os)
0.00
70
0.40
50.
016
00.
326
0.00
30
0.40
5
A. Marzucchi et al.518
Papers in Regional Science, Volume 94 Number 3 August 2015.

Table B3. Outcome variables
Overall mean(408 obs)
Mean subsidised(99 obs)
Mean nonsubsidised(309 obs)
Min. Max.
Co-operation with ResearchOrganizations
Intra-RISCOOPUNIREG 0.370 0.717 0.259 0 1COOPRESINSREG 0.311 0.566 0.229 0 1Extra-RISCOOPUNIEXTRA 0.145 0.343 0.081 0 1COOPRESINSTEXTRA 0.199 0.394 0.136 0 1
Geographical range of the co-operationwith Research Organizations
COOPRESINSORD 0.654 1.192 0.482 0 2COOPUNIORD 0.596 1.212 0.398 0 2
Table B4. Maximum likelihood estimation of the generalised propensity score
Coeff. S.E.
lnEMP2003 0.057* 0.030PAVITT1 0.203 0.133PAVITT3 0.210* 0.126PAVITT4 0.073 0.120PAVITT5 0.206* 0.111FINCONST2003 –0.525*** 0.182CASHFLOW2003 0.000 0.003_cons 12.10*** 0.221
N 99Pseudo R2 0.293Prob > χ2 0.009
Notes: *** and * indicate a significance level of 1% and 10%, respectively. Critical values of the two sided t-test (df =100): 10%, 1.660; 5%, 1.984; 1%, 2.626. A VIF test excludes the presence of multicollinearity among the covariates (allthe VIF values are lower than 10).
Research co-operation within and across regions 519
Papers in Regional Science, Volume 94 Number 3 August 2015.

-.3-.2-.10.1
E[coopist_tot_2(t+40000)]-E[coopist_tot_2(t)]
5000
010
0000
1500
0020
0000
2500
00
Tre
atm
ent l
evel
Tre
atm
ent E
ffect
Low
bou
ndU
pper
bou
nd
Tre
atm
ent
Eff
ect F
unct
ion
-.50.5
E[coopist_tot_3(t+40000)]-E[coopist_tot_3(t)]
5000
010
0000
1500
0020
0000
2500
00
Tre
atm
ent l
evel
Tre
atm
ent E
ffect
Low
bou
ndU
pper
bou
nd
Tre
atm
ent
Eff
ect F
unct
ion
-.2-.10.1.2.3
E[coopist_tot_1(t+20000)]-E[coopist_tot_1(t)]
5000
010
0000
1500
0020
0000
2500
00
Tre
atm
ent l
evel
Tre
atm
ent E
ffect
Low
bou
ndU
pper
bou
nd
Tre
atm
ent
Eff
ect F
unct
ion
-.15-.1-.050.05.1
E[coopist_tot_2(t+20000)]-E[coopist_tot_2(t)]
5000
010
0000
1500
0020
0000
2500
00
Tre
atm
ent l
evel
Tre
atm
ent E
ffect
Low
bou
ndU
pper
bou
nd
Tre
atm
ent
Eff
ect F
unct
ion
-.4-.20.2.4
E[coopist_tot_3(t+20000)]-E[coopist_tot_3(t)]
5000
010
0000
1500
0020
0000
2500
00
Tre
atm
ent l
evel
Tre
atm
ent E
ffect
Low
bou
ndU
pper
bou
nd
Tre
atm
ent
Effe
ct F
unct
ion
-.20.2.4.6
E[coopist_tot_1(t+40000)]-E[coopist_tot_1(t)]
5000
010
0000
1500
0020
0000
2500
00
Tre
atm
ent l
evel
Tre
atm
ent E
ffect
Low
bou
ndU
pper
bou
nd
Tre
atm
ent
Eff
ect F
unct
ion
Fig
.B1.
Tre
atm
ent
effe
cton
the
co-o
pera
tion
with
rese
arch
inst
itute
s(L
eft:
No
co-o
pera
tion;
Y=
0;C
entr
e:C
o-op
erat
ion
with
regi
onal
part
ner;
Y=
1,R
ight
:Co-
oper
atio
nw
ithex
tra-
regi
onal
part
ner,
Y=
2.To
p:Δt
=20
,000
;Bot
tom
:Δt=
40,0
00.C
onfid
ence
boun
dsat
95%
leve
l).
A. Marzucchi et al.520
Papers in Regional Science, Volume 94 Number 3 August 2015.

-.10.1.2.3
E[coopuni_tot_1(t+20000)]-E[coopuni_tot_1(t)]
5000
010
0000
1500
0020
0000
2500
00
Tre
atm
ent l
evel
Tre
atm
ent E
ffect
Low
bou
ndU
pper
bou
nd
Tre
atm
ent
Eff
ect
Fun
ctio
n
-.4-.20.2.4
E[coopuni_tot_2(t+20000)]-E[coopuni_tot_2(t)]
5000
010
0000
1500
0020
0000
2500
00
Tre
atm
ent l
evel
Tre
atm
ent E
ffect
Low
bou
ndU
pper
bou
nd
Tre
atm
ent
Eff
ect
Fun
ctio
n
-.4-.20.2.4
E[coopuni_tot_3(t+20000)]-E[coopuni_tot_3(t)]
5000
010
0000
1500
0020
0000
2500
00
Tre
atm
ent l
evel
Tre
atm
ent E
ffect
Low
bou
ndU
pper
bou
nd
Tre
atm
ent
Eff
ect
Fun
ctio
n
-.20.2.4.6
E[coopuni_tot_1(t+40000)]-E[coopuni_tot_1(t)]
5000
010
0000
1500
0020
0000
2500
00
Tre
atm
ent l
evel
Tre
atm
ent E
ffect
Low
bou
ndU
pper
bou
nd
Tre
atm
ent
Eff
ect
Fun
ctio
n
-.6-.4-.20.2
E[coopuni_tot_2(t+40000)]-E[coopuni_tot_2(t)]
5000
010
0000
1500
0020
0000
2500
00
Tre
atm
ent l
evel
Tre
atm
ent E
ffect
Low
bou
ndU
pper
bou
nd
Tre
atm
ent
Eff
ect
Fun
ctio
n
-.50.5
E[coopuni_tot_3(t+40000)]-E[coopuni_tot_3(t)]
5000
010
0000
1500
0020
0000
2500
00
Tre
atm
ent l
evel
Tre
atm
ent E
ffect
Low
bou
ndU
pper
bou
nd
Tre
atm
ent
Eff
ect
Fun
ctio
n
Fig
.B2.
Tre
atm
ent
effe
cton
the
co-o
pera
tion
with
univ
ersi
ties
(Lef
t:N
oco
-ope
ratio
n;Y
=0;
Cen
tre:
Co-
oper
atio
nw
ithre
gion
alpa
rtne
r;Y
=1,
Rig
ht:C
o-op
erat
ion
with
extr
a-re
gion
alpa
rtne
r,Y
=2.
Top:
Δt=
20,0
00;B
otto
m:Δ
t=40
,000
.Con
fiden
cebo
unds
at95
%le
vel)
.
Research co-operation within and across regions 521
Papers in Regional Science, Volume 94 Number 3 August 2015.

References
Andersson M, Ejermo O (2004) How does accessibility to knowledge sources affect the innovativeness of corporations?Evidence from Sweden. CESIS Working Paper No. 03. The Royal Institute of Technology, Stockholm
Antonioli D, Bianchi A, Mazzanti M, Montresor S, Pini P (2011) Strategie di Innovazione e Risultati Economici.Un’indagine sulle Imprese Manifatturiere dell’Emilia-Romagna. Franco Angeli, Milan
Antonioli D, Marzucchi A (2012) Evaluating the additionality of innovation policy. A review focused on the behaviouraldimension. World Review of Science, Technology and Sustainable Development 9: 124–148
Antonioli D, Marzucchi A, Montresor S (2012) Regional innovation policy and innovative behaviour. Looking foradditional effects. European Planning Studies, doi:10.1080/09654313.2012.722977
Asheim B (2012) The changing role of learning regions in the globalizing knowledge economy: A theoreticalre-examination. Regional Studies 46: 993–1004
Asheim BT, Coenen L (2005) Knowledge bases and regional innovation systems: Comparing Nordic clusters. ResearchPolicy 34: 1173–1190
Asheim BT, Coenen L (2006) Contextualising Regional innovation systems in a globalising learning economy: Onknowledge bases and institutional frameworks. The Journal of Technology Transfer 31: 163–173
Autant-Bernard C, Billand P, Frachisse D, Massard N (2007) Social distance versus spatial distance in R&Dco-operation: Empirical evidence from European collaboration choices in micro and nanotechnologies. Papers inRegional Science 86: 495–520
Balconi M, Lorenzi V, Saviotti PP (2012) Cognitive distance in research collaborations. Paper presented at the DRUIDAcademy
Bathelt H, Malmberg A, Maskell P (2004) Clusters and knowledge: Local buzz, global pipelines and the process ofknowledge creation. Progress in Human Geography 28: 31–56
Becker S, Ichino A (2002) Estimation of average treatment effects based on propensity scores. The Stata Journal 2:358–377
Belussi F, Sammarra A, Sedita S (2010) ‘Open Regional Innovation System’: A focus on firms’ innovation strategies inthe Emilia-Romagna life science industry. Research Policy 39: 710–721
Bia M, Mattei A (2008) A Stata package for the estimation of the dose-response function through adjustment for thegeneralized propensity score. Stata Journal 8: 354–373
Bianchi P, Giordani M (1993) Innovation policy at the local and national levels: The case of Emilia-Romagna. EuropeanPlanning Studies 1: 25–41
Bonaccorsi A, Piccaluga A (1994) A theoretical framework for the evaluation of university-industry relationships. R&DManagement 24: 229–247
Boschma R (2005) Proximity and innovation: A critical assessment. Regional studies 39: 61–74Boschma R, Frenken K (2006) Why is economic geography not an evolutionary science? Towards an evolutionary
economic geography. Journal of Economic Geography 6: 273–302Brasili C, Benni F, Barone B (2011) Emilia-Romagna in the time of the crisis: The indicator of regional economic
activity and the specialisation of production and trade. Paper presented to the ESRA ConferenceBreschi S, Lissoni F (2006) Mobility and social networks: Localized knowledge spillovers revisited. Paper presented to
the ADRES conferenceBreschi S, Lissoni F (2001) Knowledge spillovers and local innovation systems: A critical survey. Industrial and
Corporate Change 10: 975–1006Broekel T (2012) Collaboration intensity and regional innovation efficiency in Germany: A conditional efficiency
approach. Industry and Innovation 19: 155–179Brusco S (1982) The Emilian model: Productive decentralisation and social integration. Cambridge Journal of Eco-
nomics 6: 167–184Buisseret T, Cameron H, Georghiou L (1995) What difference does it make? Additionality in the public support of R&D
in large firms. International Journal of Technology Management 4: 587–600Busom I, Fernandez-Ribas A (2008) The impact of firm participation in R&D programmes on R&D partnerships.
Research Policy 37: 240–257Caliendo M, Kopeinig S (2008) Some practical guidance for the implementation of propensity score matching. Journal
of Economic Surveys 22: 31–72Cameron A, Trivedi P (2009) Microeconometrics using Stata, Volume 5. Stata Press, College Station, TXCassiman B, Veugelers R (2002) Spillovers and R&D co-operation: Some empirical evidence. American Economic
Review 92: 1169–1184Cerulli G (2010) Modelling and measuring the effect of public subsidies on business R&D: A critical review of the
econometric literature. Economic Record 86: 421–449Chesbrough H, Vanhaverbeke W, West J (2006) Open innovation: Researching a new paradigm. Oxford University
Press, Oxford
A. Marzucchi et al.522
Papers in Regional Science, Volume 94 Number 3 August 2015.

Cooke P (2001) Regional innovation systems, clusters and the knowledge economy. Industrial and Corporate Change10: 945–974
Cooke P, Gomez Uranga M, Etxebarria G (1997) Regional innovation systems: Institutional and organisationaldimensions. Research Policy 26: 475–491
Czarnitzki D, Licht G (2006) Additionality of public R&D grants in a transition economy. Economics of Transition 14:101–131
D’Este P, Guy F, Iammarino S (2013) Shaping the formation of university–industry research collaborations: What typeof proximity does really matter? Journal of Economic Geography 13: 537–558
D’Este P, Iammarino S (2010) The spatial profile of university-business research partnerships. Papers in RegionalScience 89: 335–350
Edquist C (2000) Systems of innovation: Growth, competitiveness and employment. Edward Elgar, CheltenhamEvangelista R, Iammarino S, Mastrostefano V, Silvani A (2002) Looking for regional systems of innovation: Evidence
from the Italian innovation survey. Regional Studies 36: 173–186Fernandez-Ribas A, Shapira P (2009) The role of national and regional innovation programmes in stimulating interna-
tional co-operation in innovation. International Journal of Technology Management 48: 473–498Frenken K, Van Oort F, Thijs V (2007) Related variety, unrelated variety and regional economic growth. Regional
studies 41: 685–697Fritsch M (2001) Co-operation in regional innovation systems. Regional Studies 35: 297–307Fritsch M, Lukas R (1999) Innovation, cooperation, and the Region. In: Audretsch DB, Thurik R (eds) Innovation,
industry evolution and employment. Cambridge University Press, Cambridge, pp. 157–181Fritsch M, Schwirten C (1999) Enterprise-university co-operation and the role of public research institutions in regional
innovation systems. Industry and Innovation 6: 69–83Georghiou L (2004) Evaluation of behavioural additionality. concept paper. Innovation Science and Technology IWT
Observatory 48: 7–22Giuliani E (2005) Cluster absorptive capacity. Why do some clusters forge ahead and others lag behind? European
Urban and Regional Studies 12: 269–288Granovetter M (1985) Economic action and social structure: The problem of embeddedness, American Journal of
Sociology 91: 481–510Hagedoorn J (1993) Understanding the rationale of strategic technology partnering: Interorganizational modes of
cooperation and sectoral differences. Strategic Management Journal 14: 371–385Hagedoorn J (2002) Inter-firm R&D partnerships: An overview of major trends and patterns since 1960. Research Policy
31: 477–492Hassink R (2002) Regional innovation support systems: Recent trends in Germany and East Asia. European Planning
Studies 10: 153–164Hassink R (2005) How to unlock regional economies from path dependency? From learning region to learning cluster.
European Planning Studies 13: 521–535Hirano K, Imbens G (2004) The propensity score with continuous treatments. In: Gelman A, Meng X (eds) Applied
Bayesian modelling and causal inference form incomplete-data perspectives. Wiley, New YorkHollanders H, Tarantola S, Loschky A (2009) Regional innovation scoreboard (RIS) 2009. Pro-Inno Europe, BrusselsKaufmann A, Tödtling F (2001) Science–industry interaction in the process of innovation: The importance of boundary-
crossing between systems. Research Policy 30: 791–804Kroll H, Stahlecker T (2009) Europe’s regional research systems: Current trends and structure. European Commission,
Directorate General for Research, BrusselsLambooy J, Boschma R (2001), Evolutionary economics and regional policy. The Annals of Regional Science 35:
113–131Laursen K, Reichstein T, Salter A (2011) Exploring the effect of geographical proximity and university quality on
university-industry collaboration in the United Kingdom. Regional Studies 45: 507–523Maggioni MA, Nosvelli M, Uberti TE (2007) Space versus networks in the geography of innovation: A European
analysis. Papers in Regional Science 86: 471–493Mansfield E (1991) Academic research and industrial innovation. Research Policy 20: 1–12Mansfield E (1995) Academic research underlying industrial innovations: Sources, characteristics, and financing. The
Review of Economics and Statistics 77: 55–65Mansfield E, Lee J (1996) The modern university: Contributor to industrial innovation and recipient of industrial R&D
support. Research Policy 25: 1047–1058Mouqué D (2012) What are counterfactual impact evaluations teaching us about enterprise and innovation support?
Regional Focus 02/2012, European Commission, DG Regional and Urban Policy, BrusselsMarkusen A (1996) Sticky places in slippery space: A typology of industrial districts. Economic Geography 72:
293–313
Research co-operation within and across regions 523
Papers in Regional Science, Volume 94 Number 3 August 2015.

Marzocchi C (2009) The evolution of an innovation policy in a local system of production. The case of the RegionalProgramme for Industrial Research, Innovation and Technology Transfer. Eprints UNIFE
Massard N, Mehier C (2009) Proximity and Innovation through an ‘accessibility to knowledge’ lens. Regional Studies43: 77–88
Moodysson J (2008) Principles and practices of knowledge creation: On the organization of ‘buzz’ and ‘pipelines’ in lifescience communities. Economic Geography 84: 449–469
Nesta L, Saviotti PP (2005) Coherence of the knowledge base and the firm’s innovative performance: Evidence from theUS pharmaceutical industry. Journal of Industrial Economics 53: 123–142
Nooteboom B (2000) Learning and innovation in organizations and economies. Oxford University Press, OxfordPerkmann M, Tartari V, McKelvey M, Autio E, Broström A, D’Este P, Fini R, Geuna A, Grimaldi R, Hughes A, Krabel
S, Kitson M, Llerena P, Lissoni F, Salter A, Sobrero M (2013) Academic engagement and commercialisation: Areview of the literature on university–industry relations. Research Policy 42: 423–442
Perks H, Kahn K, Zhang C (2009) An empirical evaluation of R&D marketing NPD integration in Chinese firms: TheGuanxi effect. Journal of Product Innovation Management 26: 640–651
Ponds R, Van Oort F, Frenken K (2007) The geographical and institutional proximity of research collaboration. Papersin Regional Science 86: 423–443
Rosenbaum PR, Rubin PD (1983) The central role of the propensity score in observational studies for causal effects.Biometrika 70: 41–55
Smith A, Todd E (2005) Does matching overcome LaLonde’s critique of nonexperimental estimators? Journal ofEconometrics 125: 305–353
Tallman S, Phene A (2007) Leveraging knowledge across geographic boundaries. Organization Science 18: 252–260Tödtling F, Lehner P, Kaufmann A (2009) Do different types of innovation rely on specific kinds of knowledge
interactions? Technovation 29: 59–71Tödtling F, Trippl M (2005) One size fits all? Towards a differentiated regional innovation policy approach. Research
Policy 34: 1203–1219Trippl M, Tödtling F, Lengauer L (2009). Knowledge sourcing beyond buzz and pipelines: Evidence from the Vienna
software sector. Economic Geography 85: 443–462Uyarra E (2010) What is evolutionary about regional systems of innovation? Implications for regional policy. Journal
of Evolutionary Economics 20: 115–137Valentin F, Jensen R (2007) Effects on academia-industry collaboration of extending university property rights. The
Journal of Technology Transfer 32: 251–276Vertova G (2005) A historical investigation of regional patterns of specialization: The case of Italy. In: Bradley J,
Petrakos GG, Traistaru J (eds) Growth and cohesion in an enlarged European Union, Springer, New YorkZaheer S (1995) Overcoming the liability of foreignness. Academy of Management Journal 38: 341–363
A. Marzucchi et al.524
Papers in Regional Science, Volume 94 Number 3 August 2015.

© 2015 The Author(s). Papers in Regional Science © 2015 RSAI
Papers in Regional Science, Volume 94 Number 3 August 2015.
doi:10.1111/pirs.12079
Resumen. Este artículo tiene como objetivo mostrar cómo los responsables de las políticas regionales pueden estimular la cooperación entre las empresas y las organizaciones de inves-tigación mediante la concesión de subvenciones para la I+D. A partir de un conjunto original de datos de la región italiana de Emilia-Romaña, primero se aplica un pareamiento por puntaje de propensión para identifi car el impacto de la subvención recibida. A continuación, se emplea una técnica generalizada de puntaje de propensión para investigar el efecto de una cantidad de apoyo cada vez mayor. La cooperación de la empresa es sensible a la política. La concesión de una subvención a las empresas regionales afecta más a su cooperación intrarregional que a la extrarregional. La propensión hacia esta última aparece ligada a un efecto monetario y se ve infl uida por la cantidad de fi nanciación pública recibida, siempre y cuando la subvención supere un umbral mínimo.
: