industry and market status of tilapia in malaysia - … and market status of tilapia in malaysia ......
TRANSCRIPT
Industry and Market Status of Tilapia in Malaysia
Dr. Mazuki Bin Hashim
4th INTERNATIONAL TRADE AND TECHNICAL CONFERENCE AND EXPOSITION ON TILAPIA (TILAPIA 2015)
Aquaculture Development Division
Department of Fisheries Malaysia

Presentation Outline
1. Status of Fisheries Sub-sector’s Development in Malaysia
2. Contribution of Aquaculture in Food Fish Production
3. Tilapia Aquaculture: History
4. Development of Tilapia Aquaculture
5. Tilapia Market Chain
6. Advances in Tilapia Industry
7. Tilapia: National Key Economic Area
8. Conclusion

Status of Fisheries Sub-sector’s Development in Malaysia
Food fish production in 2013 was 1.78 million tones (RM10.6 billion)
Contribution to National GDP 1.3%, 12.5% Agriculture GDP
134,000 employment (105,000 fishermen + 29,000 fish farmers)
RM5.9 billion Fish & Fish Product Trade
377 million pcs. (RM629 million) ornamental fish
DOF MALAYSIA
YEAR 2013 2015 2020
SUPPLY (million tons) 1.74 2.07 2.36
DEMAND (million tons) 1.51 1.75 1.92
Per capita consumption (kg) 53.1 56.8 61.1
SSL (%) 125 102 110
Supply and Demand of Food Fish
TILAPIA 2015

Coastal : 1,155,000 m.t Deep Sea : 329,000 m.t Aquaculture : 308, 000 m.t Ornamental fish : 377 million pcs Fish Fry : 9.5 billion pcs
1,787,000 m.t
101.70%
123.70% 128.00% 124.90%
0.00%
20.00%
40.00%
60.00%
80.00%
100.00%
120.00%
140.00%
2010 2011 2012 2013e
Self Sufficiency Level (SSL) on Food Fish (%)
Annual Growth Rate (AGR)
Average AGR (2002 – 2013) 4.0%
Capture Fisheries : 3.6%
Aquaculture: 6.6%
Fisheries Industry Overview
DOF MALAYSIA TILAPIA 2015

Contribution of Aquaculture to Malaysian Food-fish Production (‘000 Tons)
Aquaculture Production in 2013 totalled 308,000 tonnes (RM2.6 billion)
Under the 10th Malaysia Plan, aquaculture identified as one of the thrust areas.
Projected production in the year 2015 targeted at 585,000 tonnes.
951 1108
1286 1210 1428 1472
52 (5.2%)
13 (10.7%)
168 (11.6%)
207 (14.6%)
373 (20.7%)
308 (17.3%)
0
200
400
600
800
1000
1200
1400
1600
1800
2000
1990 1995 2000 2005 2010 2013
Aquaculture Capture

TREND OF AQUACULTURE PRODUCTION IN MALAYSIA
1990-2010 (M.T)
Significant increased in production of freshwater fish and shrimp,
Increase production responding to increase in demand for tilapia, catfish and shrimp in
domestic and export market.
9,689 18,499
50,688 62,007
152,631 155,399
37,514
101,080
75,695 67,425
77,664 89,366
3,045
7,406
17,418
35,104
80,529
103,943
5,761
7,966
11,259
22,521
24,326
-
50,000
100,000
150,000
200,000
250,000
300,000
350,000
400,000
1990 1995 2000 2005 2009 2010
Marine Finfish Marine Shrimp
Mollusc Freshwater Fish

Advantages in Aquaculture Development
Strategically located in the middle of Southeast Asia, Malaysia is an important
producer, market and trading nation for fish and fishery products in the
region.
The good climatic condition and free from natural disaster, the country is very
conducive to aquaculture and fishing industry.
Malaysia is blessed with abundant fisheries resources that can provide
ample supply of raw materials to a wide range of seafood business. The
country’s fish production in 2012 was close to 2.0 million tones, comprising
1.47 million tones of wild catches and 637,517 tones of aquaculture products,
including seaweed.
Strongly backed by government support, under the National Agro-food Policy
(2011 - 2020) and National Economic Transformation Programme.
Government has identified deep-sea fishing and aquaculture as part of the
government’s strategies to increase fish supply for the domestic market,
improve the balance of trade and expand exports.
Strategic Location
Good Climatic Condition
Blessed with abundant
fisheries resources
Strong Government
Backup
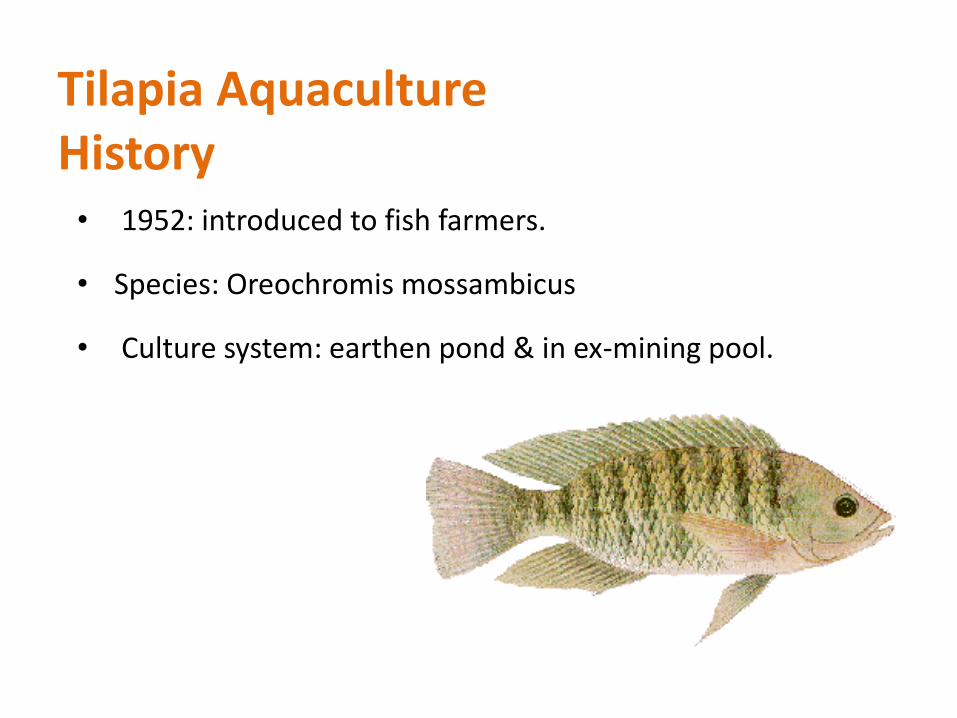
Tilapia Aquaculture History
• 1952: introduced to fish farmers.
• Species: Oreochromis mossambicus
• Culture system: earthen pond & in ex-mining pool.

Commercial Tilapia Aquaculture
• 1980’s : Introduction of commercial culture
• Species: Hybrid Red Tilapia
• Culture system: earthen ponds, concrete tanks and floating
cages

ITEMS Production (MT) Value (RM Mill.)
Freshwater Fish 132,892 1,225
Tilapia 44,099 329
Percentage 33% 27 %
Tilapia: Contribution to Freshwater Aquaculture Production (2013)

Year
Production (MT) Value (RM)
2008 34,822.50 200,195,380
2009 35,588.34 208,167,590
2010 38,886.68 250,985,940
2011 43,068.74 304,162,910
2012 52,295.30 379,785,380
2013 44,099.24 329,060,250
Tilapia: Production (2008 - 2013)
Growth 2008 – 2013: 6.4% in quantity and 13.3% in value

1,799.16 2,158.43 2,305.41 2,913.59
9,629.33
0 744.89
13,041.53 15,363.02
29,013.94
0.00
5,000.00
10,000.00
15,000.00
20,000.00
25,000.00
30,000.00
35,000.00
40,000.00
45,000.00
1970 1980 1990 2000 2010
Hybrid Red Tilapia Black Tilapia (O. mosambicus)
Tilapia: Species Composition (1970 - 2013)
• Significant growth in Hybrid Red Tilapia production since 1980’s
• Good market acceptance domestically
• Availability of quality fry and commercial feed

Tilapia: Development of Culture System
Land based system: Ex-mining pond, earthen
ponds, tank system
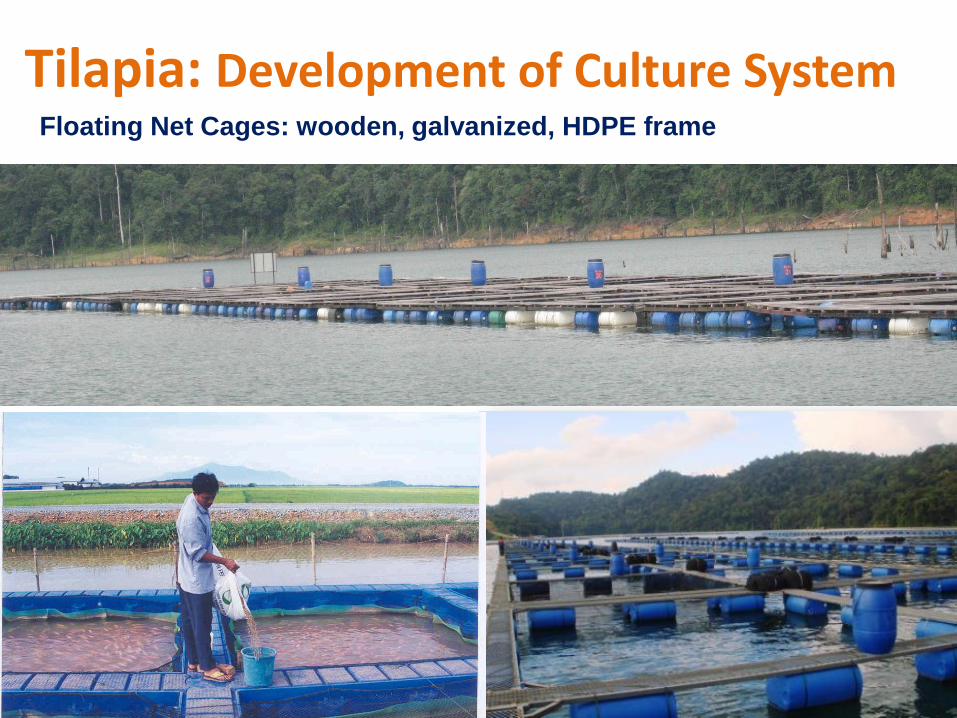
Tilapia: Development of Culture System Floating Net Cages: wooden, galvanized, HDPE frame

Polar Circle HDPE cage (20m Ø),
Production capacity 50 m.t/cage/cycle
Tilapia: Development of Culture System
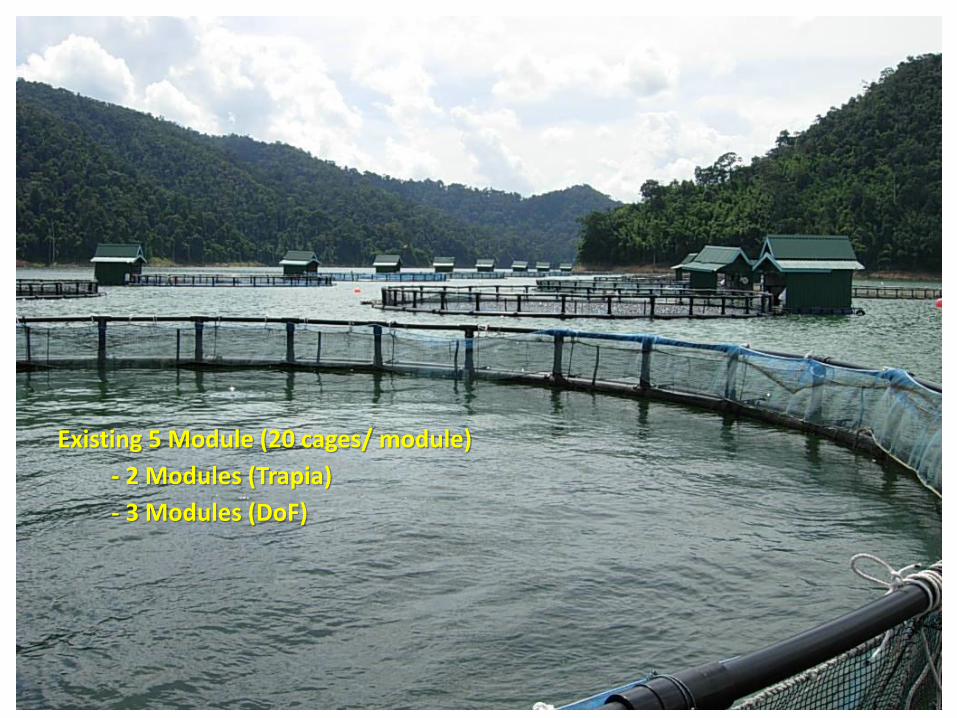
Existing 5 Module (20 cages/ module)
- 2 Modules (Trapia)
- 3 Modules (DoF)

Mechanized operation: Using fish pump for fish harvesting
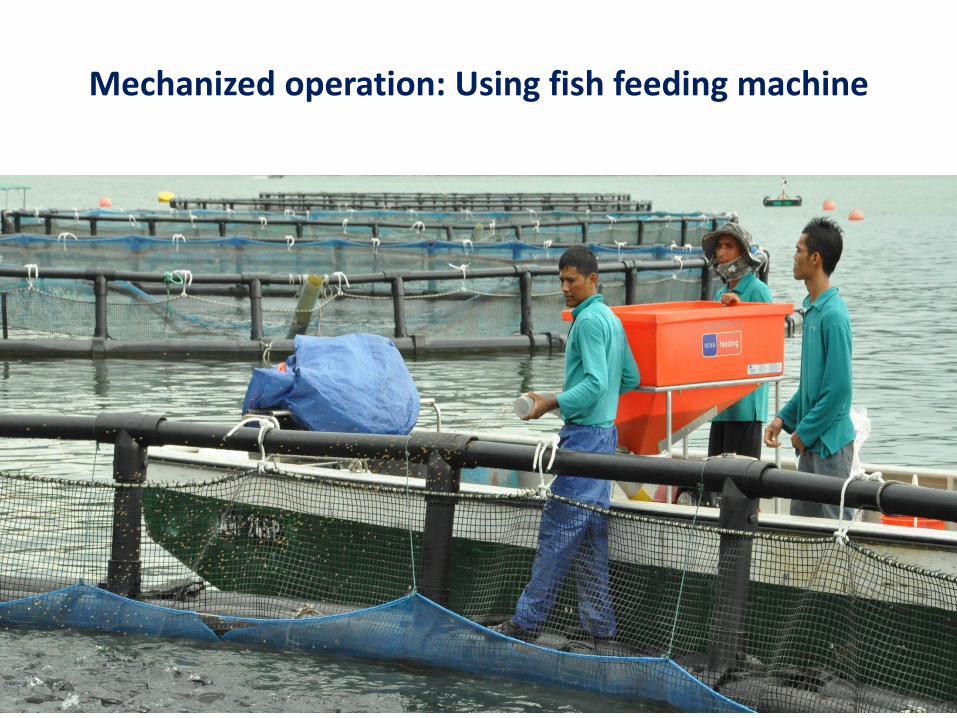
Mechanized operation: Using fish feeding machine

• Government hatchery: 13
• Private hatchery: 30 (78.8 mill fries per/year).
Tilapia: Hatchery

No Exporting Countries Year Total (pieces) Value (RM)
1 Filipina,Thailand, China, Vietnam 2010 12,684,084 328,909.98
2 Vietnam,Thailand 2011 1,014,280 83,550.66
3 Thailand, Indonesia 2012 911,355 84,173.22
4 Vietnam 2013 303,000 17,271.00
5 Taiwan 2014 50,000 1,611.30
GRAND TOTAL 14,962,719 515,516.16
Source : KLIA Biosecurity
Import of Tilapia Fry

TILAPIA MARKET CHAIN FARMER
WHOLESALER
WHOLESALE MARKET
EXPORT
Products: Market Certification Live, Frozen whole fish, GGS, Fillet Destination: Saudi Arabia, Dubai, Singapore, US
Products: Live, Fresh, Fillet Market Segments Major Cities: KL, JB, Penang • Fresh market • Farmer’s market • Seafood Restaurants • Supermarket
Market Certification

Tilapia Products

• Oreochromis niloticus – GIFT Tilapia
– 20 million fry/hatchery/year
– DNA traceability programme
Advances in Tilapia Industry Impact of Genetic Advances to Aquaculture Development

Impact of Genetic Advances to Aquaculture Development
• Oreochromis niloticus – Significant increase in production (50
m.t/cage/cycle)
– 40,000 m.t/farm/year
– Value added products & export market
Advances in Tilapia Industry

• New Vaccine to Control Tilapia Fish Disease - StrepToVax – a feed-based vaccine for controlling infection
of Streptococcus sp. bacteria in Tilapia.
– This vaccine reduced dependency of farmers on antibiotic usage against bacterial infection in Tilapia.
• Production of all male Tilapia using YY male.
• DNA Marker-assisted Selection program at FRI Glami Lemi to produce fast growing red tilapia.
Advances in Tilapia Industry

Environment-friendly Modular Culture System
MODULAR
CLEAN
SAVES WATER
HEALTHY FISH
Business plan
“Humane culture”
Advances in Tilapia Industry
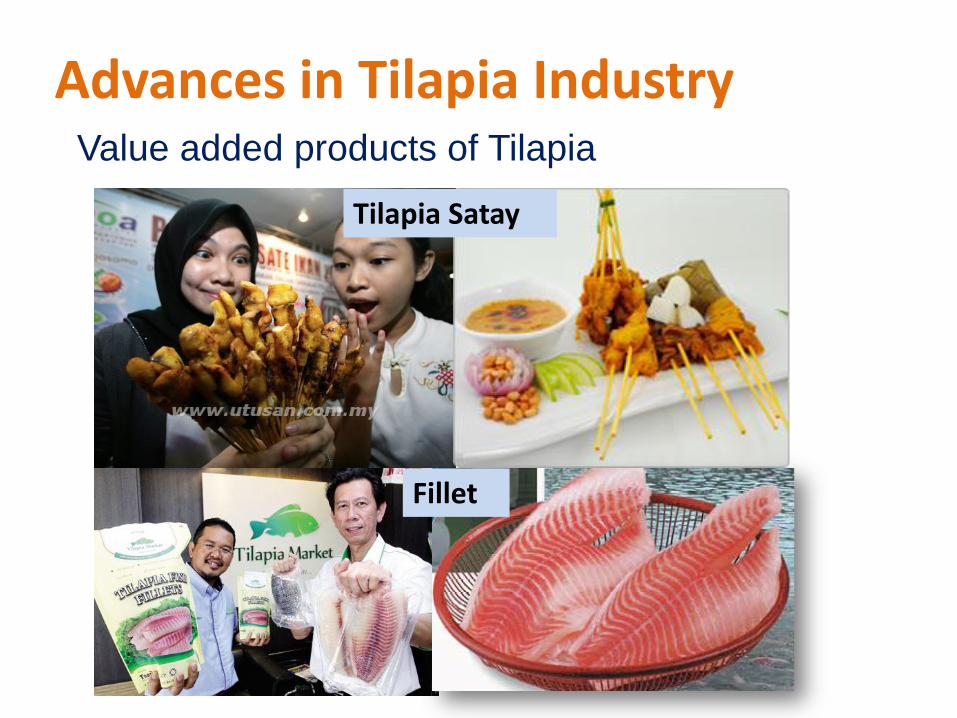
Tilapia Satay
Fillet
Advances in Tilapia Industry Value added products of Tilapia

EPP 4 : Integrated Cage Farming
Large Scale Cage Farming Integrated with Hatcheries, Processing Plants and Utilizing Modern Farming Methods e.g. HDPE Polar Circle Cages (20 m diameter) for Tilapia Culture
Tilapia: National Key Economic Area (NKEA)

Integrated Cage Farming


AQUACULTURE PRODUCTION TARGET BY YEAR 2020 (M.T)
YEAR FRESHWATER
FISH MOLLUSC
MARINE FISH
MARINE SHRIMP
TOTAL
2014 190,000 110,000 53,000 100,000 453,000
2015 234,084 129,435 74,261 148,121 585,901
2016 293,615 155,038 93,985 187,462 730,100
2017 368,084 185,605 118,885 237,126 909,700
2018 461,252 222,108 150,318 299,823 1,133,501
2019 577,734 265,668 189,975 378,922 1,412,299
2020 725,119 318,422 240,587 479,872 1,764,000

• Extension Services (Attitude & Technology)
• R&D+C • Strengthening theProduction Value
Chain (Input & Marketing) • Function of PNK/PPK • Good Aquaculture Practices • Expansion of Export Market • Source of Financing • Human Resource Development • Enforce Aquaculture Regulation
• Production from existing companies.
• Production from new companies.
• Incentives / New Companies
• Development of new area in Sabah & Sarawak
• Private sector investment
• Synergy Farming
• Young Agropreneur
• Cluster Development
DEVELOPMENT STRATEGIES (50:50)

• Sub-lease (30 years) water areas
Sites (Processing, hatchery &
feed mill)
1. ANCHOR COMPANY
3. FARMERS ASSOCIATION
4. DEPARTMENT OF FISHERIES MALAYSIA
5. STATE GOVERNMENT
• Selection of participants
• Provide basic infrastructures.
• Provide cage culture system.
• Bear the operating cost for the training programme.
• Prepare agreement.
• Monitor project
• Training & monitoring services.
• Provides SOP and supervision
• Supply of quality inputs (Fry & fish feed)
• Buy back of harvested yeild
• Facilitate financial management for participants.
• Manage the monthly allowance for participants
(RM3,000/month).
• Clearing of input bills (fish fry, fish feed etc.).
Agreement Letter
2. PARTICIPANTS Equipment Loan Agreement
Synergy Farming Program
Agreement
• Implement the freshwater fish cage culture project
• Ready to get the loan from Agrobank
• Sell the yield to the anchor company
Synergic farming Appproach for AIZ Tasik Temengor:
Implementation Model

Location of Synergy Farming AIZ Temengor Lake, Perak
Temengor Lake, Perak

ITEM DESCRIPTION
Anchor Company Trapia Malaysia Sdn Bhd
Area 100 ha (NKEA – EPP 4)
Species GIFT Tilapia (Genomar Supreme Traceable Tilapia)
Culture System Polar Circle HDPE cage (20m Ø),
Production capacity 50 m.t/cage/cycle @ 6 months
Current status Existing 3 Module (20 cages/ module)
- 2 Module (Trapia)
- 1 Modul (DOF)
2 new modules (90% completed)
Commence 2010
Target 10 modules (200 cages)
Production 15 mt/day raw fish for filleting
Product Tilapia Fillet (US, Canada, EU)
Job Opportunities 200 participants
5 modules
SUMMARY OF SYNERGY FARMING AIZ TEMENGOR LAKE, PERAK

Market Promotion for Tilapia Products

Aquaculture Certification
38
• Environment, socio-economic aspects
MALAYSIA GOOD AGRICULTURAL PRACTICES
GOOD AQUACULTURE PRACTICES

GLOBAL G.A.P Certification
European Seafood Show (Brussels) 2010

• Tilapia has the potential to be the primary species for domestic and export
market due to its strong consumer demand.
• Good stocking material has been developed internationally e.g GIFT.
• Proven technology; breeding and grow-out technology.
• Strong demand from United States (premium fillet segment), increasing
demand from EU and Middle East.
• Government will continue to provide business support services and facilitate
private sector investment in Tilapia Aquaculture in Malaysia.
Conclusion

TERIMA KASIH Thank You
4th INTERNATIONAL TRADE AND TECHNICAL CONFERENCE AND EXPOSITION ON TILAPIA (TILAPIA 2015)