industries qatar (iq) initiating coverage - aljazira … to commence the 3rd ethylene plant at ......
TRANSCRIPT

NOVEMBER2012
IndustriesQatar (IQ)
Research DivisionCompany Reports
Please read Disclaimer on the back
All rights reserved, AlJAZIRA CAPITAL ©
Initiating Coverage
Aljazira Capital is a Saudi Investment Company licensed by the Capital Market Authority (CMA), License No. 07076-37
RESEARCHDIVISION
AGM - Head of ResearchAbdullah Alawi+966 2 [email protected]
Senior Analyst Syed Taimure Akhtar +966 2 6618271 [email protected]
AnalystSaleh Al-Quati+966 2 [email protected]
BROKERAGE AND INVESTMENT CENTERS
DIVISION
General Manager - Brokerage DivisionAla’a Al-Yousef+966 1 [email protected]
AGM-Head of international and institutional brokerageLuay Jawad Al-Motawa +966 1 [email protected]
Regional Manager - West and South RegionsAbdullah Al-Misbahi+966 2 [email protected]
Area Manager - Qassim & Eastern ProvinceAbdullah Al-Rahit+966 6 [email protected]

November2012
1
Industries Qatar (IQ)Initiation | Qatar | Petrochemicals Sector | Nov 2012
Rating: “Overweight”
Current Price: QAR 151.70
12-month price target: QAR 176.6
Upside/(Downside): 16.4%
Key Information
Reuters Code IQCD.DSM
Bloomberg Code IQCD QD
Country: Qatar
Sector: Petrochemicals
Primary Listing: Qatar Exchange
M-Cap: QAR 83,435mn
52 Weeks H/L: QAR 155.0/124.9
Price Chart
3D expansion strategy
• A leading local & regional petrochemical facility - Industries Qatar (IQ) through its subsidiaries and jointly controlled entities owns capacities of around (i) 4.3mn tonne of basic olefins & oxygenate and related derivatives (ranked at 2nd after SABIC3 in the GCC region), (ii) 4.9mn tonne of ammonia, urea & melamine and (iii) 5.8mn tonne of different grades of steel products. Hence, this makes the company as the 2nd largest in its respective sector across the GCC region.
• Well integrated operational structure – The company’s operational structure is based on the state-of-the-art production plants of each subsidiaries and jointly controlled entities; where most of the basic petrochemicals are used as a feedstock to produce related intermediaries and polymers. Besides the direct ownerships, the company is also benefiting through the indirect stakes of its affiliates. According to the given information, at present, the company’s petrochemical operation is based on 3 ethylene plants4 , 4 polyethylene plants5 , QVC plants6 , 1 methanol & Methyl Tertiary Butyl Ether (MTBE) plant7 and QPPC plants8. The company’s fertilizer operation is mainly based on 5 complexes each contain two production trains i.e. ammonia and urea; whereas steel operation is based on DRI/HBI9, billets, steel bar and steel coils complexes.
• Expansion plans - According to the given information, the company is scheduled to commence the 3rd ethylene plant at Qapco in 4Q-2012 which will translate into an addition of 180k tonne of ethylene at Qapco plant; where the expected commercial inauguration of 3rd plant of LDPE at Qapco in 4Q-2012 will absorb the additional production capacity from ethylene plants. Likewise, Qafco-6 is also expected to commence its operation in 3Q-2012 to consume the excess in-house production of ammonia from Qafco-5 plant. The expansion in steel segment is expected to instigate commercially in 2Q-2013.
• Limited production line with an aim to optimize in-house consumption - Unlike SABIC, the company limits its olefins & oxygenates operations exposure to ethylene & its related derivatives and methanol & MTBE, respectively. However, the proposed expansion plan and existing operational structure are suggesting the company’s vision to reduce dependence on exports of basic chemicals and expand products base for more sophisticated productions. In addition, the company’s steel segment is highly dependent on the local market consumption but the company is still striving to attain maximum level of operational integration in the respective segment. Besides these expansion plans, the company is also focusing to expand its geographical presence (through acquisition) in market; where the growth potential is high. As per given information, at present, the plan to go international acquisitions (in related business) is under review.
• Financial growth - Based on our expectations, the company’s sales revenue will increase at a CAGR of 7.1%, during 2011-15; whereas gross margin is expected to remain under pressure during 2011-15, due expected rise in feedstock gas prices, higher depreciation and planned shutdowns. Consequently, the company’s net profitability is expected to increase at a CAGR of 7.1%, during 2011-15.
IQ was established in 1969 and incorporated in April 2003; where a government based Qatar Petroleum (QP) owned 70% stakes in the company; where QP supplied feedstock gas at subsidized rates.
The prime function of the company is to act as a holding company to the its subsidiaries and jointly controlled entities (where the company holds majority stakes) i.e. Qapco1, Qafac2, Qafco3 and Qasco4.
1 Qatar Petrochemical Company, engaged in the manufacturing and marketing of ethylene and related derivatives. IQ owns 80% stakes of Qapco
2 Qatar Fuel Additives Company, a leading producer and seller of methanol & related derivatives. IQ owns 50% stakes in Qafac.
3 Qatar Fertilizer Company, a local producer of ammonia, urea and melamine. IQ owns 75% stakes in Qafco.
4 Qatar Steel Company, engaged in the production of wide range of steel & related products. Qasco is fully owned by IQ.
1. Olefinsaremostcommoninpetrochemicalindustry,,ethylene,propylene,Buteneandsoon,,mainlyuseinthe production of many petrochemicals and plastic products.
2. Oxygenates are a group of chemicals comprising alcohols & ethers3. Saudi Basic Industries Corporation, the largest KSA based petrochemical company in the GCC region 4. 2ethyleneplantsareownedbyQapco,while1plantisownedbyRasLaffanOlefinCracker(RLOC)which
isaJVofQatofin(aQapcoJV).5. 3 polyethylene plants designed to produced low density polyethylene (LDPE), owned by Qapco; whereas 1
plantisusedtoproducelowlineardensitypolyethylene(LLDPE)whichisownedbyQatofin.6. Qatar Vinyl Company is a Qapco joint venture, which is designed to produce caustic soda, ethylene
dichloride (EDC) and vinyl chloride monomers (VCM).7. These plants are owned by Qafac8. Qatar Plastic Products Company is a Qapco venture and designed to produce industrial grade plastic
products.9. Direct reduced iron / Hot Briquetted Iron is a brick-shaped mass (briquetted) containing 90%-92% iron.
IQ LHS QE - RHS
8,000.0
8,100.0
8,200.0
8,300.0
8,400.0
8,500.0
8,600.0
8,700.0
8,800.0
8,900.0
9,000.0
115.00
120.00
125.00
130.00
135.00
140.00
145.00
150.00
155.00
Oct
-11
Oct
-11
Oct
-11
No
v-1
1N
ov-
11
Dec
-11
Dec
-11
Jan-1
2Ja
n-1
2Feb
-12
Feb
-12
Mar
-12
Mar
-12
Ap
r-1
2A
pr-
12
Ap
r-1
2M
ay-1
2M
ay-1
2Ju
n-1
2Ju
n-1
2Ju
l-1
2Ju
l-1
2A
ug
-12
Aug
-12
Sep
-12
Sep
-12
Sep
-12
Oct
-12
Syed Taimure Akhtar(Senior Analyst)
[email protected]+966-2-6618271

November2012
2
Key financial indicators
QAR mn (unless specified) 2011 2012e 2013e 2014e 2015eRevenues 16,549 19,535 21,028 21,320 21,800 EBITDA 8,426 10,642 12,828 12,478 12,446 Net income 7,924 9,847 10,794 10,430 10,439 EPS (QAR) 14.4 17.9 19.6 19.0 19.0 P/E 9.2 8.5 7.7 8.0 8.0 P/BV 2.7 2.7 2.3 2.0 1.8 EV/EBITDA 7.9 7.1 5.9 6.0 6.0
Source: AlJazira Capital* We have taken respective December closing prices for 2010 &2011, while for years 2012 & onwards we used closing price of 26th November 2012.
Source: Aljazira Capital * Country risk is taken from Damodaran’s country default spreads (CDS) based on Moody’s rating. ** Qatar Exchange; a Qatari bourse. # The calculation of WACC for petrochemical segment is based on the Qapco available capital structure as Qafac financial disclosure is not available; while discount rate for fertilizerssegment is based on available capital structure of Qafco. Furthermore, we used IQ capital structure for steel segment
asQascohasnofinancialdisclosure.
Key variables estimations
• Investment consideration - We used weighted average approach to drive 12-month price target for the company at QAR176.6/share. Under this approach we assigned 70% weights to DCF based SOTP value and 30% to relative based value (TTM-EV/EBITDA matrix). This implies the stock, at current market price of QAR151.7/share (as of 26th Nov 2012), is offering a potential upside of 16.4% and trading at prospective 2013 PE and PBV of 7.7 x and 2.3x, respectively. We, therefore, initiate our coverage on IQ with ‘Overweight’ recommendation.
We used weighted average approach to determine the company’s 12-month price target. Underthisapproachweuseddiscountedcashflow(DCF)basedsumofthepartvaluation(SOTP) valuation methodology and EV/EBITDA based relative valuation technique.
Weuseddiscountedcashflow(DCF)basedsumoftheparts(SOTP)valuationmethodologyto arrive at a 12-month price target of QAR177.3/share. Under this valuation, we valued IQ operational segment separately using the variables explained in above chart; where the terminal growth is taken 3.0% for all segment.
RFR
, 2.5
%
ERP
, 9.4
%
CoE
, 10.
9%
WA
CC
-P
etro
chem
ical
, 8.6
%
WA
CC
-Fe
rtiliz
ers,
8.8
%
WA
CC
-S
teel
, 9.8
%
1.0% 3.0% 5.0% 7.0% 9.0% 11.0% 13.0% 15.0%
We used Capital Asset Pricing Model (CAPM) to
derive the company’s Cost of Equity; where two years weekly raw beta of IQ is
taken at 1.225 from Bloomberg
Total market return (TMR) of QE** is taken at 11.883% from Bloomberg. The ERP
calculation is based on‘TMR less RFR’
Risk free rate is the sum of - 10 years US bond yield of 2.0%; and- Country risk premium of Qatar 0.5%*
Valuation summary
November2012
3
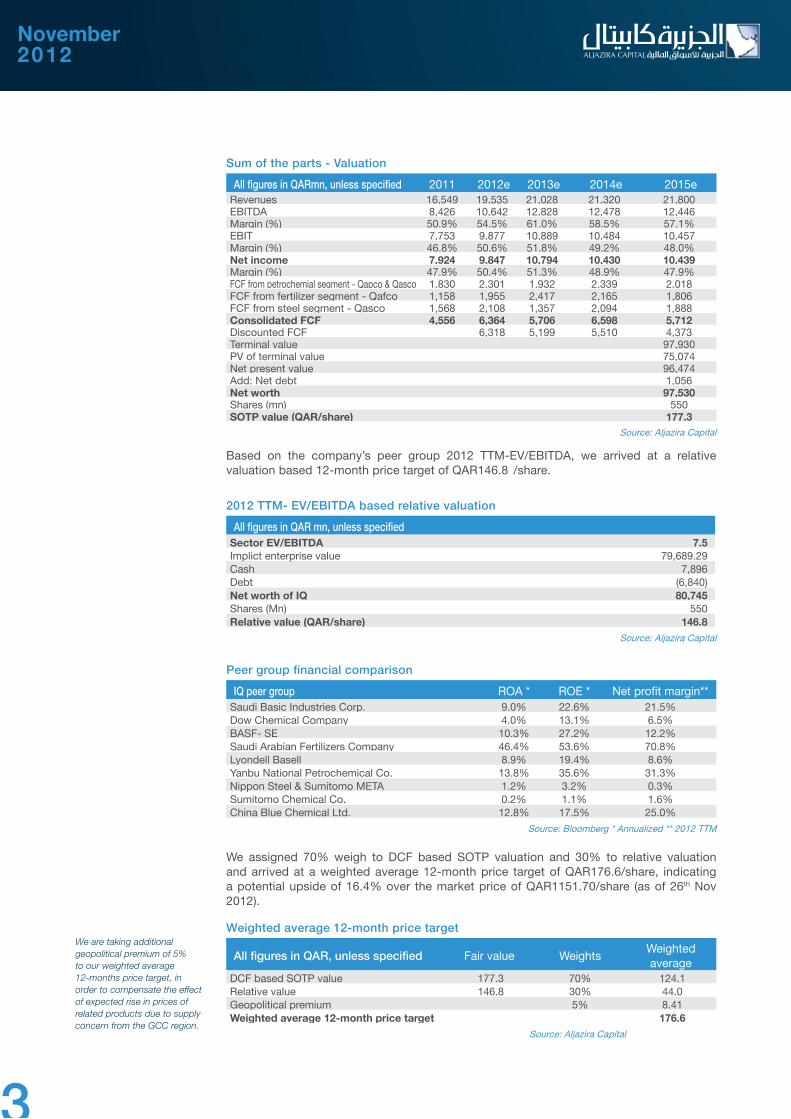
Weighted average 12-month price target
All figures in QAR, unless specified Fair value WeightsWeighted average
DCF based SOTP value 177.3 70% 124.1 Relative value 146.8 30% 44.0 Geopolitical premium 5% 8.41 Weighted average 12-month price target 176.6
Source: Aljazira Capital
Sum of the parts - Valuation
All figures in QARmn, unless specified 2011 2012e 2013e 2014e 2015e Revenues 16,549 19,535 21,028 21,320 21,800EBITDA 8,426 10,642 12,828 12,478 12,446Margin (%) 50.9% 54.5% 61.0% 58.5% 57.1%EBIT 7,753 9,877 10,889 10,484 10,457Margin (%) 46.8% 50.6% 51.8% 49.2% 48.0%Net income 7,924 9,847 10,794 10,430 10,439Margin (%) 47.9% 50.4% 51.3% 48.9% 47.9%FCF from petrochemial segment - Qapco & Qasco 1,830 2,301 1,932 2,339 2,018FCF from fertilizer segment - Qafco 1,158 1,955 2,417 2,165 1,806FCF from steel segment - Qasco 1,568 2,108 1,357 2,094 1,888Consolidated FCF 4,556 6,364 5,706 6,598 5,712Discounted FCF 6,318 5,199 5,510 4,373Terminal value 97,930PV of terminal value 75,074Net present value 96,474Add: Net debt 1,056Net worth 97,530Shares (mn) 550SOTP value (QAR/share) 177.3
Source: Aljazira Capital
2012 TTM- EV/EBITDA based relative valuation
All figures in QAR mn, unless specifiedSector EV/EBITDA 7.5Implict enterprise value 79,689.29Cash 7,896Debt (6,840)Net worth of IQ 80,745Shares (Mn) 550Relative value (QAR/share) 146.8
Source: Aljazira Capital
Peer group financial comparison
IQ peer group ROA * ROE * Net profit margin**Saudi Basic Industries Corp. 9.0% 22.6% 21.5%Dow Chemical Company 4.0% 13.1% 6.5%BASF- SE 10.3% 27.2% 12.2%Saudi Arabian Fertilizers Company 46.4% 53.6% 70.8%Lyondell Basell 8.9% 19.4% 8.6%Yanbu National Petrochemical Co. 13.8% 35.6% 31.3%Nippon Steel & Sumitomo META 1.2% 3.2% 0.3%Sumitomo Chemical Co. 0.2% 1.1% 1.6%China Blue Chemical Ltd. 12.8% 17.5% 25.0%
Source: Bloomberg * Annualized ** 2012 TTM
Based on the company’s peer group 2012 TTM-EV/EBITDA, we arrived at a relative valuation based 12-month price target of QAR146.8 /share.
We assigned 70% weigh to DCF based SOTP valuation and 30% to relative valuation and arrived at a weighted average 12-month price target of QAR176.6/share, indicating a potential upside of 16.4% over the market price of QAR1151.70/share (as of 26th Nov 2012).
We are taking additional geopolitical premium of 5% to our weighted average 12-months price target, in order to compensate the effect of expected rise in prices of related products due to supply concern from the GCC region.
November2012
4
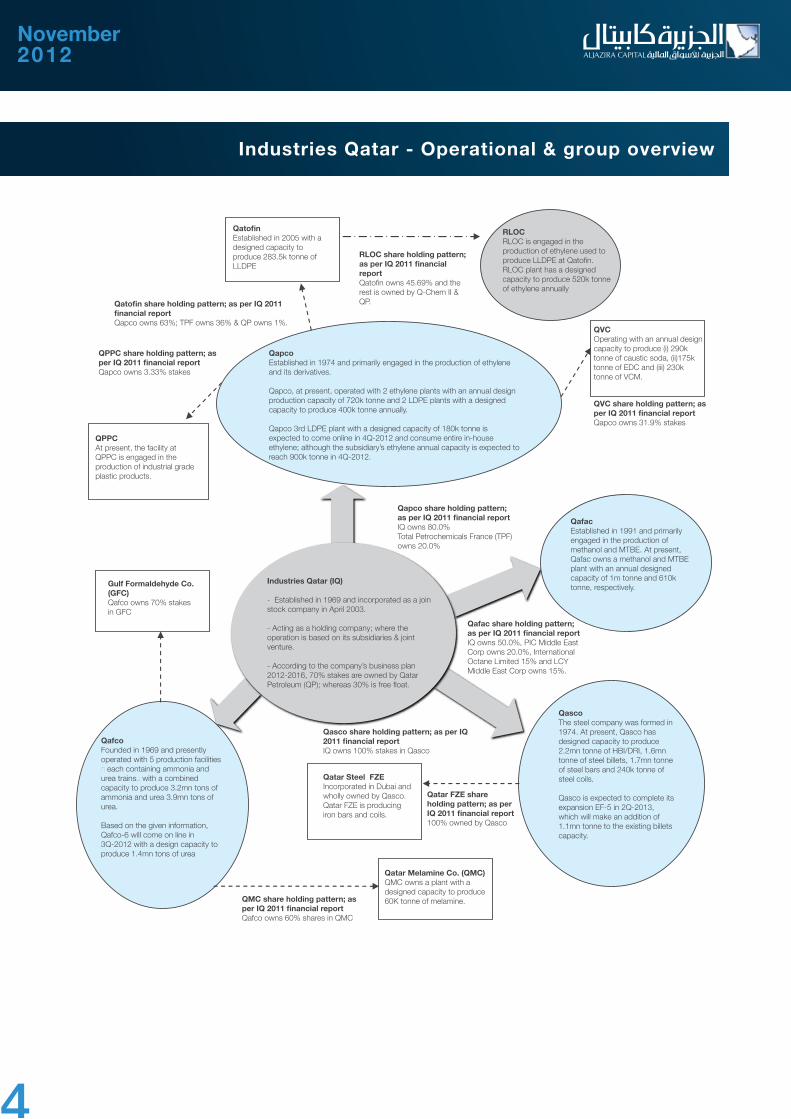
Industries Qatar - Operational & group overview
QVCOperating with an annual design capacity to produce (i) 290k tonne of caustic soda, (ii)175k tonne of EDC and (iii) 230k tonne of VCM.
QafacEstablished in 1991 and primarily engaged in the production of methanol and MTBE. At present, Qafac owns a methanol and MTBE plant with an annual designed capacity of 1m tonne and 610k tonne, respectively.
RLOCRLOC is engaged in the production of ethylene used to produce LLDPE at Qatofin. RLOC plant has a designed capacity to produce 520k tonne of ethylene annually
RLOC share holding pattern; as per IQ 2011 financial reportQatofin owns 45.69% and the rest is owned by Q-Chem II & QP.
Qatofin Established in 2005 with a designed capacity to produce 283.5k tonne of LLDPE
Qatofin share holding pattern; as per IQ 2011 financial reportQapco owns 63%; TPF owns 36% & QP owns 1%.
QPPC share holding pattern; as per IQ 2011 financial reportQapco owns 3.33% stakes
QPPCAt present, the facility at QPPC is engaged in the production of industrial grade plastic products.
Gulf Formaldehyde Co.(GFC)Qafco owns 70% stakes in GFC
QapcoEstablished in 1974 and primarily engaged in the production of ethylene and its derivatives.
Qapco, at present, operated with 2 ethylene plants with an annual design production capacity of 720k tonne and 2 LDPE plants with a designed capacity to produce 400k tonne annually.
Qapco 3rd LDPE plant with a designed capacity of 180k tonne is expected to come online in 4Q-2012 and consume entire in-house ethylene; although the subsidiary’s ethylene annual capacity is expected to reach 900k tonne in 4Q-2012.
QafcoFounded in 1969 and presently operated with 5 production facilities� each containing ammonia and urea trains� with a combined capacity to produce 3.2mn tons of ammonia and urea 3.9mn tons of urea.
Based on the given information, Qafco-6 will come on line in 3Q-2012 with a design capacity to produce 1.4mn tons of urea
QMC share holding pattern; as per IQ 2011 financial reportQafco owns 60% shares in QMC
Qatar Melamine Co. (QMC)QMC owns a plant with a designed capacity to produce 60K tonne of melamine.
Qatar FZE share holding pattern; as per IQ 2011 financial report100% owned by Qasco
Qasco share holding pattern; as per IQ 2011 financial reportIQ owns 100% stakes in Qasco
Qafac share holding pattern; as per IQ 2011 financial reportIQ owns 50.0%, PIC Middle East Corp owns 20.0%, International Octane Limited 15% and LCY Middle East Corp owns 15%.
Qapco share holding pattern; as per IQ 2011 financial reportIQ owns 80.0%Total Petrochemicals France (TPF) owns 20.0%
QVC share holding pattern; as per IQ 2011 financial reportQapco owns 31.9% stakes
Industries Qatar (IQ)
- Established in 1969 and incorporated as a join stock company in April 2003.
- Acting as a holding company; where the operation is based on its subsidiaries & joint venture.
- According to the company’s business plan 2012-2016, 70% stakes are owned by Qatar Petroleum (QP); whereas 30% is free float.
QascoThe steel company was formed in 1974. At present, Qasco has designed capacity to produce 2.2mn tonne of HBI/DRI, 1.6mn tonne of steel billets, 1.7mn tonne of steel bars and 240k tonne of steel coils.
Qasco is expected to complete its expansion EF-5 in 2Q-2013, which will make an addition of 1.1mn tonne to the existing billets capacity.
Qatar Steel FZEIncorporated in Dubai and wholly owned by Qasco. Qatar FZE is producing iron bars and coils.

November2012
5
Key growth factors & upcoming challenges
Based on the given information, we believe the company’s existing growth strategy is focusing to achieve the following objectives;
(i) Broadening overall production capacity; is based on the upcoming expansion in all key operational segments of the company. According to our understanding, the successful completion of expansion will lead the company’s overall petrochemical, fertilizer and steel production capacities to increase at 2011-15CAGR of 2.7%, 17.2% and 4.4%, respectively.
(i i) Strengthening operational integration; through optimizing the in-house consumption of basic chemicals. According to the given plan, upon the completion of proposed expansion plans, the company will be able to consume (a) all of its excess ethylene to produce its derivative i.e. LDPE and LLDPE, (b) excess ammonia production will utilize internally to produce urea from Qafco-6, (c) increase the production of steel billets and (d) start-up new Co2 recovery plant in 1Q-2014 to resume production levels at MTBE plant. Consequently, the company’s plants would have to operate at high utilization rates to meet in-house demand and will translate into an increase in the overall production at 2011-15CAGR of 8.5%.
3.84.5 4.4 4.4 4.7 5.05.3 5.6
7.9
9.6
8.3 8.3
5.0 5.5
5.9 6.7
7.4
8.3
-
2.0
4.0
6.0
8.0
10.0
12.0
2010 2011 2012e 2013e 2014e 2015ePetrochemical segment (mn tonne) Fertilizer segment (mn tonne) Steel segment (mn tonne)
Capacity utiliztaionCapacity utilization 2010 2011 2012e 2013e 2014e 2015e
Ethylene plant 1 - QAPCO 102% 103% 110% 94% 103% 118%Ethylene plant 2 - QAPCO 102% 103% 110% 94% 103% 118%Ethylene plant 3 - QAPCO n/o n/o 75% 94% 103% 118%LDPE-1 - QAPCO 101% 107% 112% 105% 106% 107%LDPE-2 - QAPCO 101% 107% 112% 105% 106% 107%LDPE-3 - QAPCO n/o n/o 75% 79% 81% 82%LLDPE - Qatofin 72% 109% 127% 130% 130% 130%Ethylene - RLOC 97% 103% 109% 111% 97% 111%Casutic soda - QVC 100% 101% 101% 101% 101% 101%Ethylene dichloride - QVC 100% 101% 101% 101% 101% 101%Vinyl chloride monomer - QVC 100% 101% 101% 101% 101% 101%FFC films - QPC 100% 101% 101% 101% 101% 101%Shirnkable films - QPC 100% 101% 101% 101% 101% 101%Top-openbags - QPC 100% 101% 101% 101% 101% 101%Recycled PE - QPC 100% 101% 101% 101% 101% 101%Methanol - QAFAC 88% 102% 79% 76% 88% 88%MTBE - QAFAC 85% 109% 96% 98% 112% 113%QAFCO 1 - Ammonia 110% 112% 102% 98% 87% 87%QAFCO 1 - Urea 105% 113% 113% 111% 111% 112%QAFCO 2- Ammonia 110% 112% 102% 98% 87% 84%QAFCO 2 - Urea 105% 113% 113% 111% 111% 112%QAFCO 3 - Ammonia 110% 112% 102% 98% 87% 84%QAFCO 3 - Urea 105% 113% 113% 111% 111% 112%QAFCO 4 - Ammonia 110% 112% 102% 98% 87% 84%QAFCO 4 - Urea 105% 113% 113% 111% 111% 112%QAFCO 5 - Ammonia n/o n/o 114% 133% 119% 120%QAFCO 5 - Urea n/o n/o 98% 88% 89% 91%QAFCO 6 - Urea n/o n/o 66% 67% 68% 68%Melamine plant n/o 100% 89% 87% 88% 88%HBI/DRI 96% 98% 107% 105% 106% 107%Steel production - Billets 73% 73% 74% 82% 115% 156%Steel bars 118% 126% 139% 139% 139% 139%Steel coils 100% 100% 100% 100% 100% 100%
Please note that the capacity utilization of all plants are adjusted with the given maintenance shutdown schedule in business plan 2012-16.
Expected production growth
Source: Company data sheets & Aljazira Capital
Source: Company data sheets & Aljazira Capital
4.0 4.3 4.44.8 4.8 4.84.9 5.0
7.7
9.4 9.4 9.4
5.8 5.8 5.8
6.76.9 6.9
-
1.00
2.00
3.00
4.00
5.00
6.00
7.00
8.00
9.00
10.00
2010 2011 2012e 2013e 2014e 2015ePetrochemical segment (mn tonne) Fertilizer segment (mn tonne) Steel segment (mn tonne)
Expected completion of EF5-; a steel project
Expected completion of
Qafco6- in 4Q2012-; where the full year
impact will be observed in 2013
Expected completion of 3rd ethylene plant LDPE the ;2012-4Q plants in full year impact will be
2013 observed in
Expected expansion in production capacities

November2012
6
Based on the given information, the key challenges to the company are;
(i) Maintain undisrupted supply during planned maintenance shutdowns; according to the given information, the company has to face major shutdowns in the 2014 & 2015 which will lead to lower capacity utilization and low productionvolumes, in respectivequarters. Hence, thecompany’s revenues&profitability indictorswill remainunder pressure, during these quarters.
(i ii) Chinese economic slowdown & rise in petrochemical capacity around the globe; as per the company’s business plan 2012-16, the future growth in the company’s key petrochemical output (i.e. LDPE & LLDPE) for export is primarily based on reasonable growth in China. Hence, the key challenge for the company is to effectively manage the potential threats of economic slowdown in China. Moreover, the possible injections of new capacities around the globe, especially in US after a discovery of shale gas, will lead to keep the prices of polyethylene under pressure.We,therefore,believethesuccessfultargetmarketdiversificationstrategywillremaincrucialincomingyears.
We expect the company’s sales revenue will increase at 2011-15CAGR of 7.1%; where the revenues form petrochemical segment will continue to dominate followed by steel & fertilizer, respectively. The expected growth in sales revenues is mainly based on;
(i) The expected weighted average increase in volumetric sales (net-off with in-house consumption, as explained earlier) at 2011-15CAGR of 8.1%; where the growth is primarily associated with the additional production from Qafco-6 urea plant, designed to consume excess ammonia from Qafco-5, indicating no additional ammonia train; and
(ii) The weighted average prices of products are expected to show a negative 2012-16CAGR of 0.5%; where the expected weighted average prices of petrochemicals and fertilizers in 2015 will remain lower than 2011 levels with limited growth in related steel products’ prices, during 2011-15.
0.7
0.9
1.1
1.3
1.5
1.7
1.9
2.1
2.3
2.5
2.7
4Q12 1Q13 2Q13 3Q13 4Q13 1Q14 2Q14 3Q14 4Q14 1Q15 2Q15 3Q15 4Q15Petrochemical segment (mn tonne) Fertilizer segment (mn tonne) Steel segment (mn tonne)
Qapcoethylene & LDPE plants
will remain out of operation for 45 days &
62, respectively in 3Q2013.
Qasco HBI/DRIplant will remain out of
operation for 64 days in 2Q2014-
Qasco HBI/DRIplant is scheduled to go maintenance shutdown
for 92 days in2Q2015-
The key planned shutdowns in 1Q2014- are;1) Qapco ethylene plant for 45 days.2) Qatofin LLDPE plant 45 days3) Methanol & MTBE plants for 50 days & 40 days, respectively4) Qafco ammonia plants for 50 days and urea plants for 40
Qafco ammonia & urea plants will remain out of
operation for 24 days & 27 days, respectively, in 1Q2015-
Qafco ammonia & urea plants will remain out of operation for & 16 14 days, respectively, in
4Q2015.
Financial performance
Source: IQ business plan 2012-16 & Aljazira Capital
Maintenance shutdown & QoQ production volumes

November2012
7
Thecompany’sgrossprofitabilitymarginsareexpectedtoshowdownwardtrendandreach53.9%in2015ascomparedto the estimated gross margins of 56.7% in 2012. The major reasons of expected decline gross margins are;
(i) Planned shutdowns; as mentioned earlier
(ii) Product prices remained under pressure; as explain earlier; and
(iii) Expected rise in feedstock gas prices for petrochemicals, fertilizers and steel segments at 2011-15 CAGR of 4.6%, -2.5% and 0.9%, respectively, as per the company’s business plan 2012-16.
Ontheotherhand,weexpect thecompanytopostnetprofitofQAR9.8bn (EPS;QAR17.9) in2012 indicatingYoYincrease of is 24.3%; where gross margin is expected to show improvement over 53.7% recorded in 2011. The growth in 2012 is mainly associated with the expected completion of expansions at Qafco & Qapco plants in 4Q-2012; this indicates these expansions will have full year impact in 2013. It should be noted that Qasco new steel plant is expected to start commercially in 2Q-2013; hence, we expect the company will overcome the impact planned shutdowns in petrochemicalssegmentin1Q-2013andleadtoaYoYgrowthof9.6%in2013innetprofitability.
However, the number shutdowns at petrochemicals and fertilizers plants will lead to a slight decline in 2014 net profitability;whereas thecompany isexpected to resume itsupward trajectory in2015.Hence, thecompany’snetprofitabilityisexpectedtoincreaseataCAGRof7.1%,during2011-15,withanetprofitabilitymarginof47.9%in2015.
12,331
16,549
19,477 21,028 21,320 21,800
25.1%
34.2%
17.7%
8.0%
1.4%2.2%
0.0%
5.0%
10.0%
15.0%
20.0%
25.0%
30.0%
35.0%
40.0%
-
5,000
10,000
15,000
20,000
25,000
2010 2011 2012e 2013e 2014e 2015eSales revenue (QARmn) - LHS Sales revenue growth - RHS
Petrochemical segment
39%Fertilzers segment
26%
Steel segment35%
Petrochemicalsegment 36%
Steel segment33%
Fertilzerssegment31%
26.9%
32.8%
34.2%
31.9%
26.5%
23.3%
18.5%
23.1%
25.2%24.4%
21.1%
19.1%
15.0%
20.0%
25.0%
30.0%
35.0%
40.0%
-
2,000
4,000
6,000
8,000
10,000
12,000
2010 2011 2012e 2013e 2014e 2015eNet profit (QAR mn) - LHS RoAE - RHS RoAA - RHS
41.0%
46.0%
51.0%
56.0%
61.0%
66.0%
40.0%
42.0%
44.0%
46.0%
48.0%
50.0%
52.0%
54.0%
56.0%
58.0%
60.0%
2010 2011 2012e 2013e 2014e 2015e
Gross margin - LHS EBIT margin - LHS
EBITDA margin - RHS Net margin - RHS - RHS
Petrochemicals segment, 35.8%Fertilizers
segment, 31.5%
Steel segment, 32.6%
Source: Company annual reports, 2Q-2012 data sheet & Aljazira Capital
Source: Company annual reports & Aljazira Capital
Sales revenue growth
Net profitability growth Profitability margins
2012e Net profitability composition - Segment wise
Sales revenue composition 2011
Sales revenue composition 2015e

November2012
8
Amount in QARmnunless otherwise specified 2010 2011 2012E 2013E 2014E 2015E
Income statement Revenues 12,331 16,549 19,535 21,028 21,320 21,800 YoY growth 25.1% 34.2% 18.0% 7.6% 1.4% 2.2% Cost of sales (6,401) (7,654) (8,466) (8,943) (9,591) (10,048) Gross profit 5,930 8,895 11,069 12,085 11,729 11,752 Selling expenses (189) (218) (244) (236) (246) (256) General & adminstartiv expenses (584) (669) (844) (937) (975) (1,014) Other costs (97) (256) (104) (23) (24) (25) Operating profit 5,059 7,753 9,877 10,889 10,484 10,457 YoY growth 50.1% 53.2% 27.4% 10.2% -3.7% -0.3% Other income 568 337 244 182 189 197 Impairment losses - (9) - - - - Financial charges (147) (156) (274) (277) (244) (215) Profit before zakat & minority interest 5,478 7,931 9,856 10,803 10,439 10,448 Minoriity interest 2 (7) (8) (9) (9) (9) Net profit 5,480 7,924 9,847 10,794 10,430 10,439 YoY growth 10.5% 44.6% 24.3% 9.6% -3.4% 0.1% Balance sheet Assets Cash and bank balance 5,290 6,960 7,896 7,906 8,599 8,649 Other current assets 4,749 5,494 6,823 9,579 10,711 12,096 Property plant & equipment 8,874 9,589 21,547 23,641 25,976 28,814 Other non-current assets 12,994 14,735 5,194 5,915 6,753 7,728 Total assets 31,908 36,778 41,459 47,041 52,039 57,287 Liabilities & owners' equity Total current liabilities 3,502 3,842 4,629 4,634 4,646 4,668 Interest bearing loans and borrowings - Long term 6,118 5,535 4,982 4,857 4,371 4,153 Total non-current liabilities 624 770 819 872 929 990 Minority interests 14 395 365 383 402 423 Share capital 5,500 5,500 5,500 5,500 5,500 5,500 Legal reserves 202 277 351 426 500 575 Cummulative change in fair values 315 315 346 381 419 461 Hedging reserves (466) (589) (634) (444) (310) (217) Retained earnings 16,099 20,735 25,100 30,432 35,581 40,735 Total owners' equity 21,651 26,237 30,664 36,295 41,690 47,053 Total equity & liabilities 31,908 36,778 41,459 47,041 52,039 57,287 Cashflow statement Operating activities 4,990 8,041 9,551 10,195 11,473 11,194 Investing activities (3,271) (3,259) (2,940) (4,573) (4,978) (5,606) Financing activities (1,426) (3,317) (5,675) (5,612) (5,802) (5,538) Change in cash 294 1,466 936 10 693 50 Ending cash balance 5,290 6,960 7,896 7,906 8,599 8,649 Key fundamental ratios Current ratio (x) 2.9 3.2 3.2 3.8 4.2 4.4 Cash ratio (x) 1.5 1.8 1.7 1.7 1.9 1.9 Gross profit margin 48.1% 53.7% 56.7% 57.5% 55.0% 53.9% Operating margin 41.0% 46.8% 50.6% 51.8% 49.2% 48.0% EBITDA margin 46.3% 50.9% 54.5% 61.0% 58.5% 57.1% Net profit margin 44.4% 47.9% 50.4% 51.3% 48.9% 47.9% Return on average assets 18.5% 23.1% 25.2% 24.4% 21.1% 19.1% Return on average equity 26.9% 32.8% 34.2% 31.9% 26.5% 23.3% Interest coverage (x) 34.51 49.56 36.09 39.29 42.97 48.67 Debt / equity (x) 0.35 0.26 0.22 0.18 0.14 0.12 EV/sales (x) 5.73 4.00 3.87 3.59 3.51 3.43 EV/EBITDA (x) 12.37 7.86 7.10 5.89 6.00 6.01 EPS (QAR) 9.96 14.41 17.90 19.63 18.96 18.98 BVPS (QAR) 39.39 48.42 56.42 66.69 76.53 86.32 Market price (QAR)* 138.00 133.00 151.70 151.70 151.70 151.70 Market-Cap (QAR mn) 75,900.0 73,150.0 83,435.0 83,435.0 83,435.0 83,435.0 Dividend yield 3.6% 4.1% 6.5% 6.5% 6.3% 6.3% P/E ratio (x) 13.85 9.23 8.47 7.73 8.00 7.99 P/BV ratio (x) 3.50 2.75 2.69 2.27 1.98 1.76
Source:Companyfinancialreports&AljaziraCapital*WehavetakenrespectiveDecendpricesfor2010&2011,while for years 2012 & onwards we used closing price of 26th Nov 2012.
Updated financial statements

AlJazira Capital, the investment arm of Bank AlJazira, is a Shariaa Compliant Saudi
Closed Joint Stock company and operating under the regulatory supervision of the
Capital Market Authority. AlJazira Capital is licensed to conduct securities business in
all securities business as authorized by CMA, including dealing, managing, arranging,
advisory, and custody. AlJazira Capital is the continuation of a long success story
in the Saudi Tadawul market, having occupied the market leadership position for
several years. With an objective to maintain its market leadership position, AlJazira
Capital is expanding its brokerage capabilities to offer further value-added services,
brokerage across MENA and International markets, as well as offering a full suite of
securities business.
Overweight: This rating implies that the stock is currently trading at a discount to its
12 months price target. Stocks rated “Overweight” will typically provide an upside
potential of over 10% from the current price levels over next twelve months.
Underweight: This rating implies that the stock is currently trading at a premium to
its 12 months price target. Stocks rated “Underweight” would typically decline by
over 10% from the current price levels over next twelve months.
Neutral: The rating implies that the stock is trading in the proximate range of its 12
months price target. Stocks rated “Neutral” is expected to stagnate within +/- 10%
range from the current price levels over next twelve months.
Suspension of rating or rating on hold (SR/RH): This basically implies suspension
of a rating pending further analysis of a material change in the fundamentals of the
company.
For further queries about our special services, contact us at the toll free number 800 116 9999.
CO
MPA
NY
PR
OFILE
R
ATING
TER
MIN
OLO
GY

Disclaimer
The purpose of producing this report is to present a general view on the company/economic sector/economic subject under research, and not to recommendabuy/sell/holdforanysecurityoranyotherassets.Basedonthat,thisreportdoesnottakeintoconsiderationthespecificfinancialposition of every investor and/or his/her risk appetite in relation to investing in the security or any other assets, and hence, may not be suitable for allclientsdependingontheirfinancialpositionandtheirabilityandwillingnesstoundertakerisks.Itisadvisedthateverypotentialinvestorseekprofessionaladvicefromseveralsourcesconcerninginvestmentdecisionandshouldstudytheimpactofsuchdecisionsonhis/herfinancial/legal/tax position and other concerns before getting into such investments or liquidate them partially or fully. The market of stocks, bonds, macroeconomic or microeconomic are of a volatile nature and could witness sudden changes without any prior warning, therefore, the investor insecuritiesorotherassetsmightfacesomeunexpectedrisksandfluctuations.Alltheinformation,viewsandexpectationsandfairvaluesortarget prices contained in this report have been compiled or arrived at by AlJazira Capital from sources believed to be reliable, but AlJazira Capital hasnotindependentlyverifiedthecontentsobtainedfromthesesourcesandsuchinformationmaybecondensedorincomplete.Accordingly,no representation or warranty, express or implied, is made as to, and no reliance should be placed on the fairness, accuracy, completeness or correctness of the information and opinions contained in this report. AlJazira Capital shall not be liable for any loss as that may arise from the use of this report or its contents or otherwise arising in connection therewith. The past performance of any investment is not an indicator of futureperformance.Anyfinancialprojections,fairvalueestimatesorpricetargetsandstatementsregardingfutureprospectscontainedinthisdocument may not be realized. The value of the security or any other assets or the return from them might increase or decrease. Any change in currency rates may have a positive or negative impact on the value/return on the stock or securities mentioned in the report. The investor might get an amount less than the amount invested in some cases. Some stocks or securities maybe, by nature, of low volume/trades or may become like that unexpectedly in special circumstances and this might increase the risk on the investor. Some fees might be levied on some investments in securities. This report has been written by professional employees in AlJazira Capital, and they undertake that neither them, nor their wives or children hold positions directly in any listed shares or securities contained in this report during the time of publication of this report. This report has been produced independently and separately and no party (in-house or outside) who might have interest whether direct or indirect have seen the contents of this report. It should be also noted that the Research Division of AlJazira Capital had no information at the time of issuing this reportregardinganyconflictofinterestbetweenthecompany/companiesmentionedinthisreportandanymembersoftheboard/executives/employees of AlJazira Capital or any of Bank AlJazira Group companies. No part of this document may be reproduced whether inside or outside the Kingdom of Saudi Arabia without the written permission of AlJazira Capital. Persons who receive this document should make themselves aware, of and adhere to, any such restrictions. By accepting this document, the recipient agrees to be bound by the foregoing limitations.
Asset Management Brokerage Corporate Finance Custody Advisory
Head Office: Madinah Road, Mosadia، P.O. Box: 6277, Jeddah 21442, Saudi Arabia، Tel: 02 6692669 - Fax: 02 669 7761